
MMST: A Multi-Modal Ground-Based Cloud Image Classification Method

Abstract
1. Introduction
- This paper proposes a novel method based on the Swin Transformer. The model fully relies on the attention mechanism and the linear layer to learn the features of cloud images and multi-modal information. This method solves the shortcomings of the traditional CNN model, namely, that it cannot conduct global modeling, and the performance ceiling of the model is restricted by too much inductive bias.
- We address the deficiency of learning only the modeling of images in the cloud classification task. Residual blocks are added to the linear layer to learn more complex feature representations of meteorological multi-modal information.
- An experimental evaluation is carried out on the multi-modal base cloud image dataset MGCD, showing that the method proposed in this paper has better classification results.
2. Methods
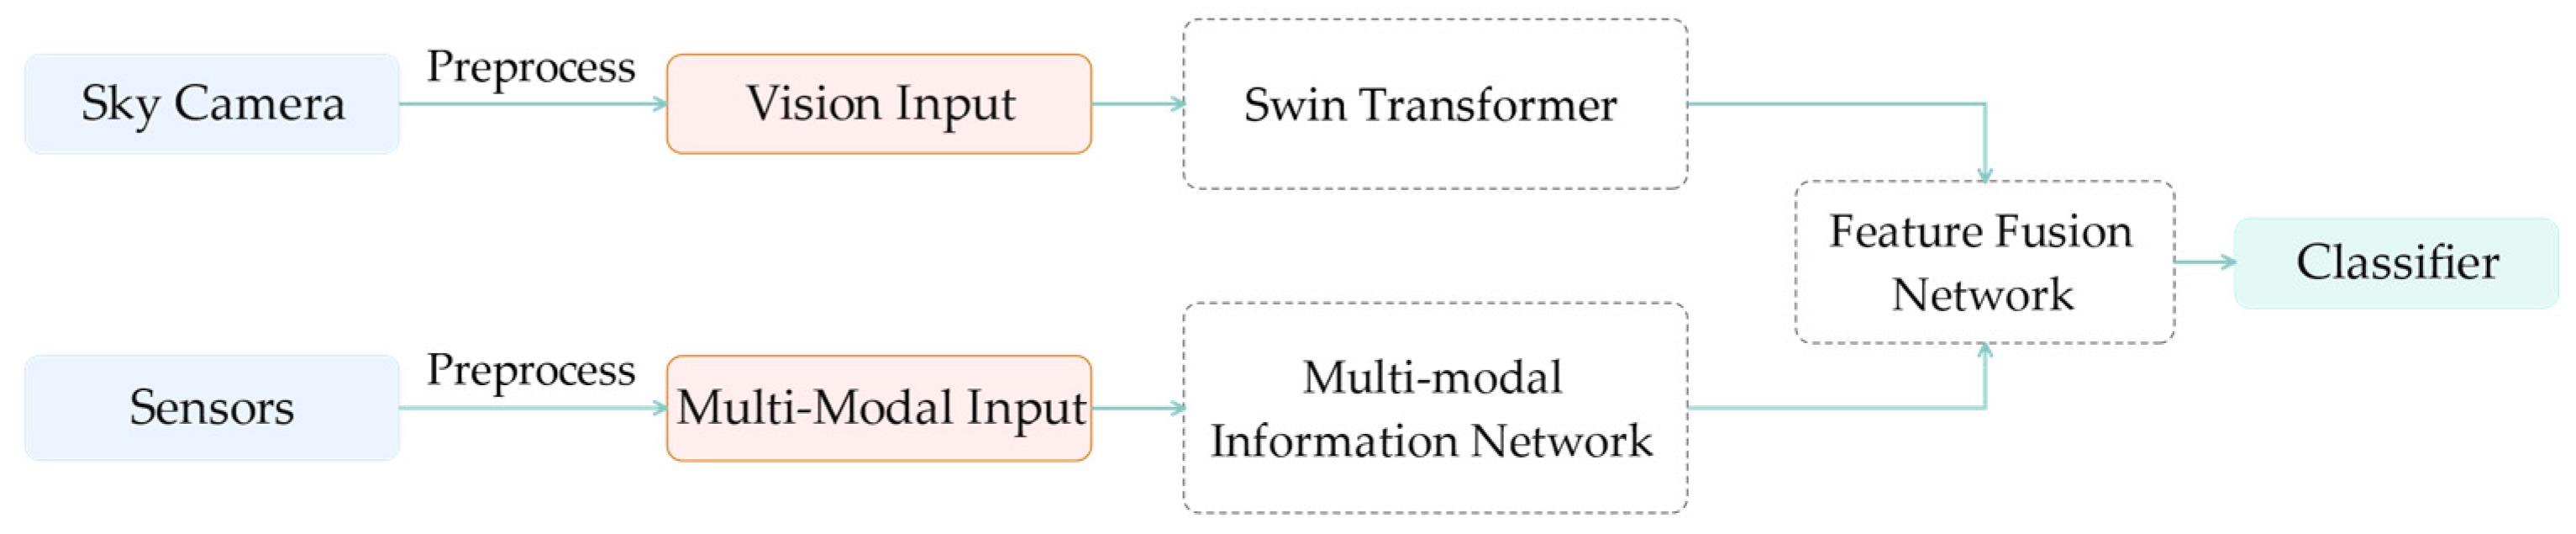
2.1. Overview of the Classification Process
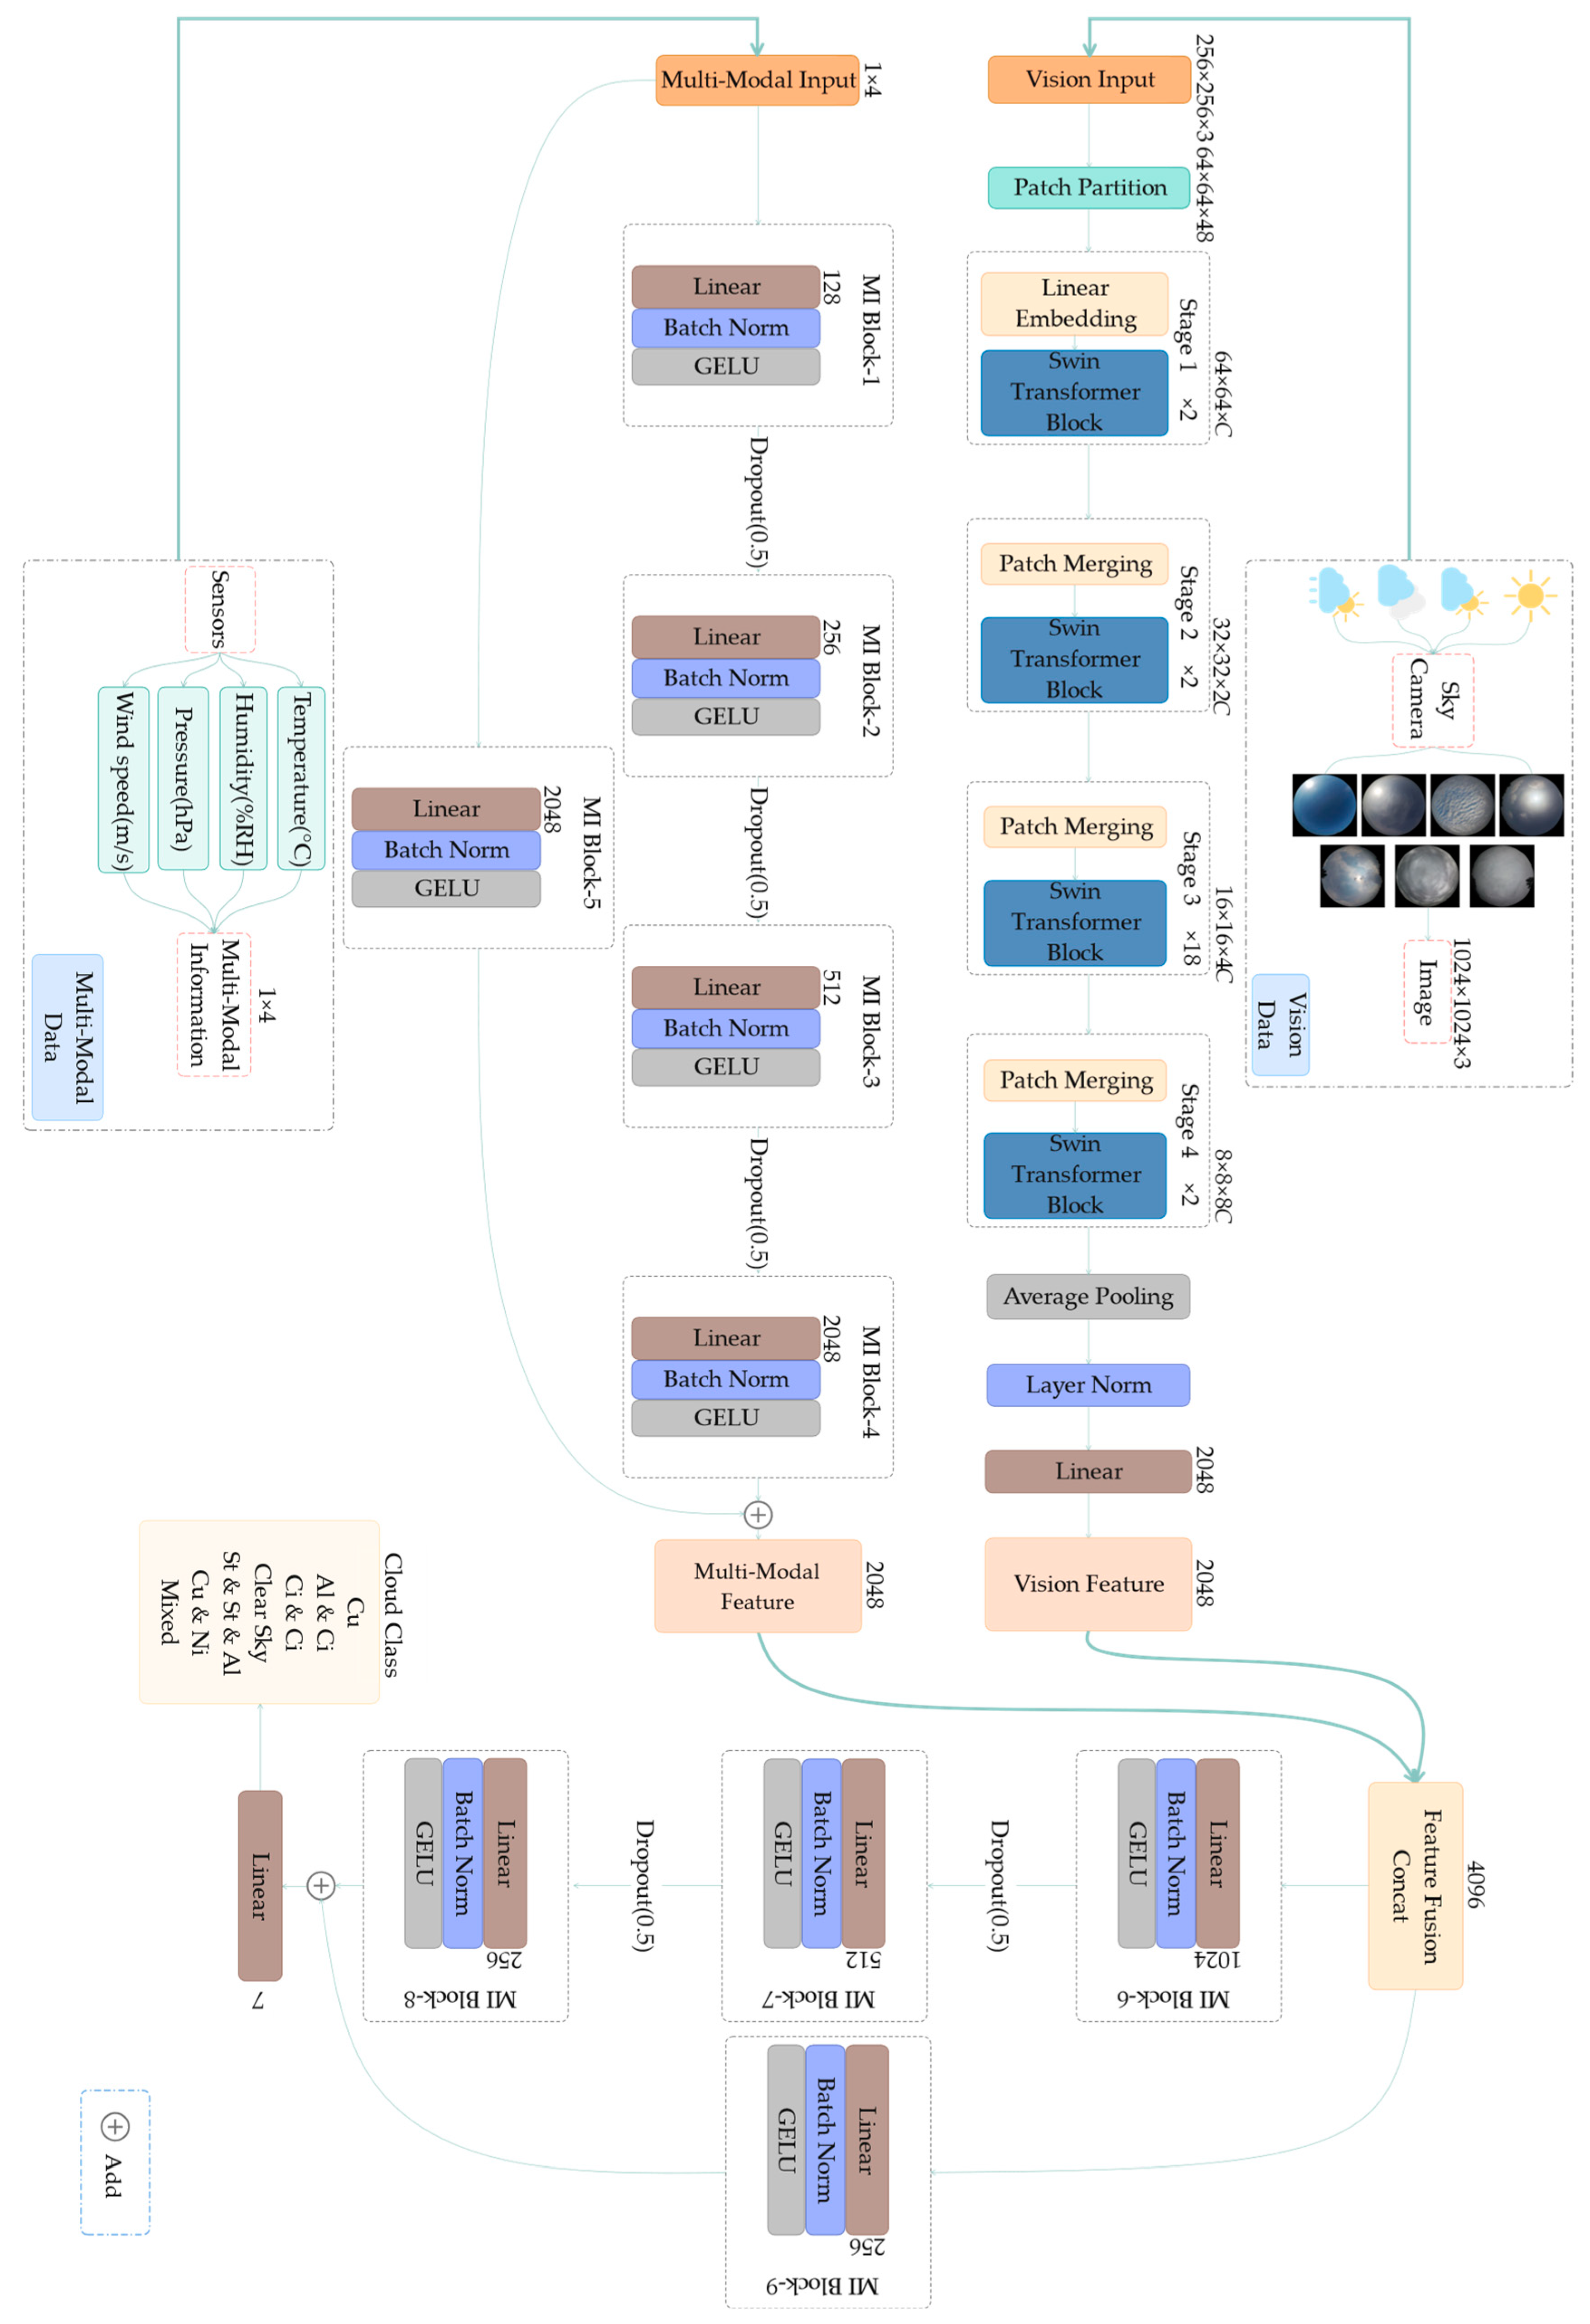
2.2. Introduction of the Proposed Method
2.3. Visual Backbone Network
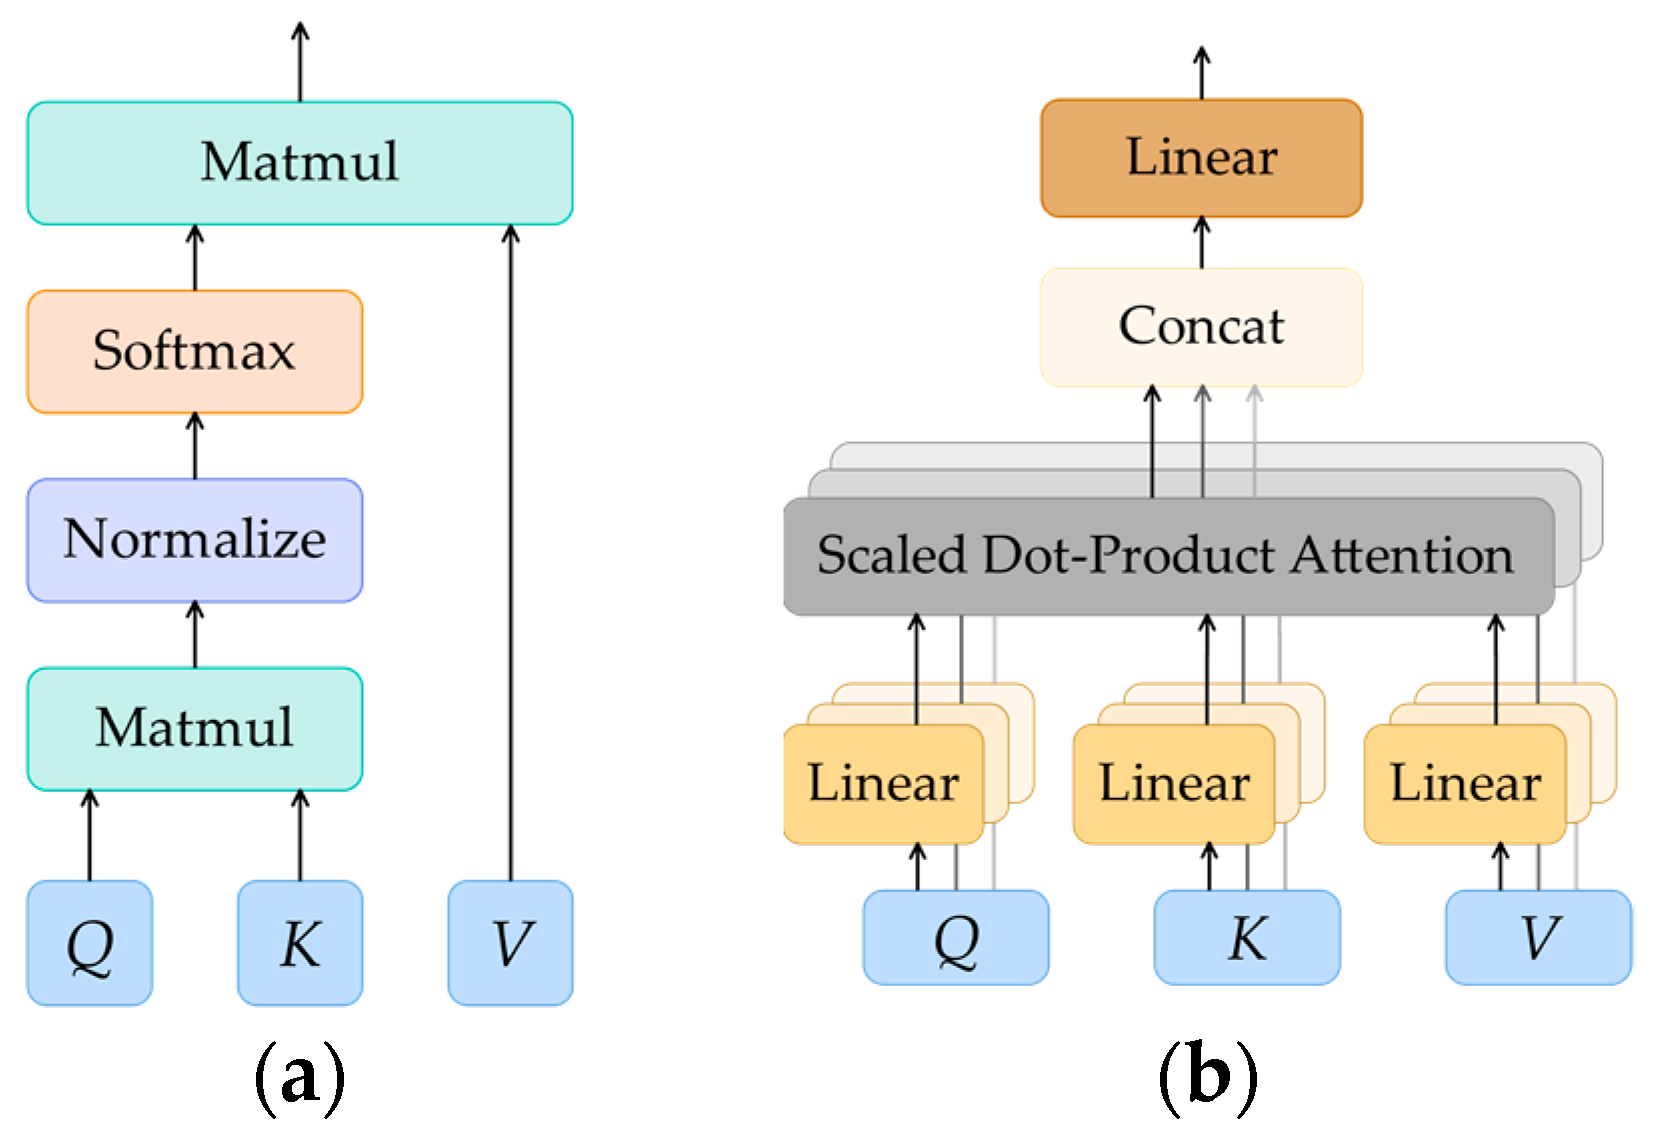
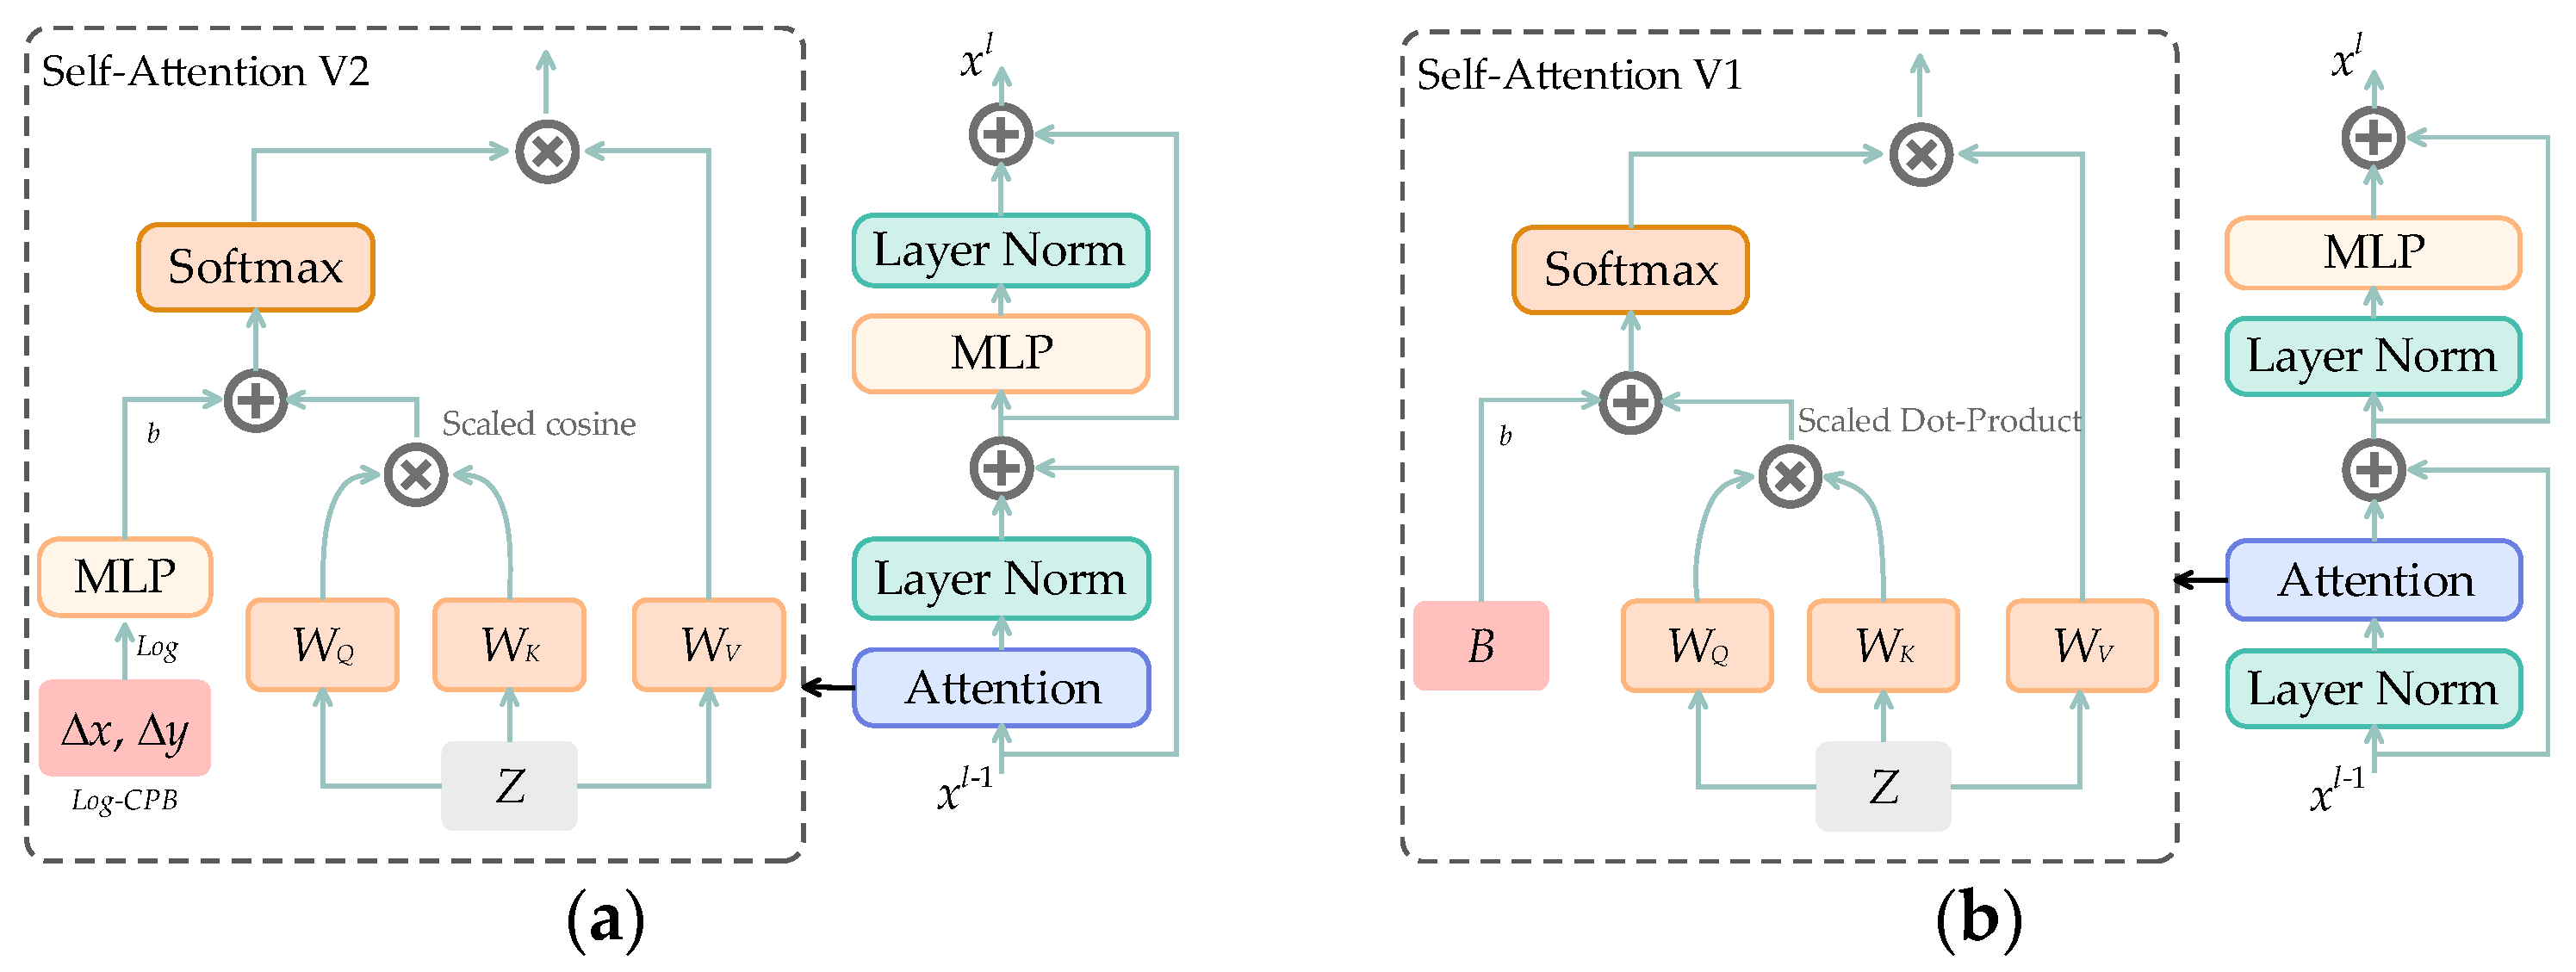
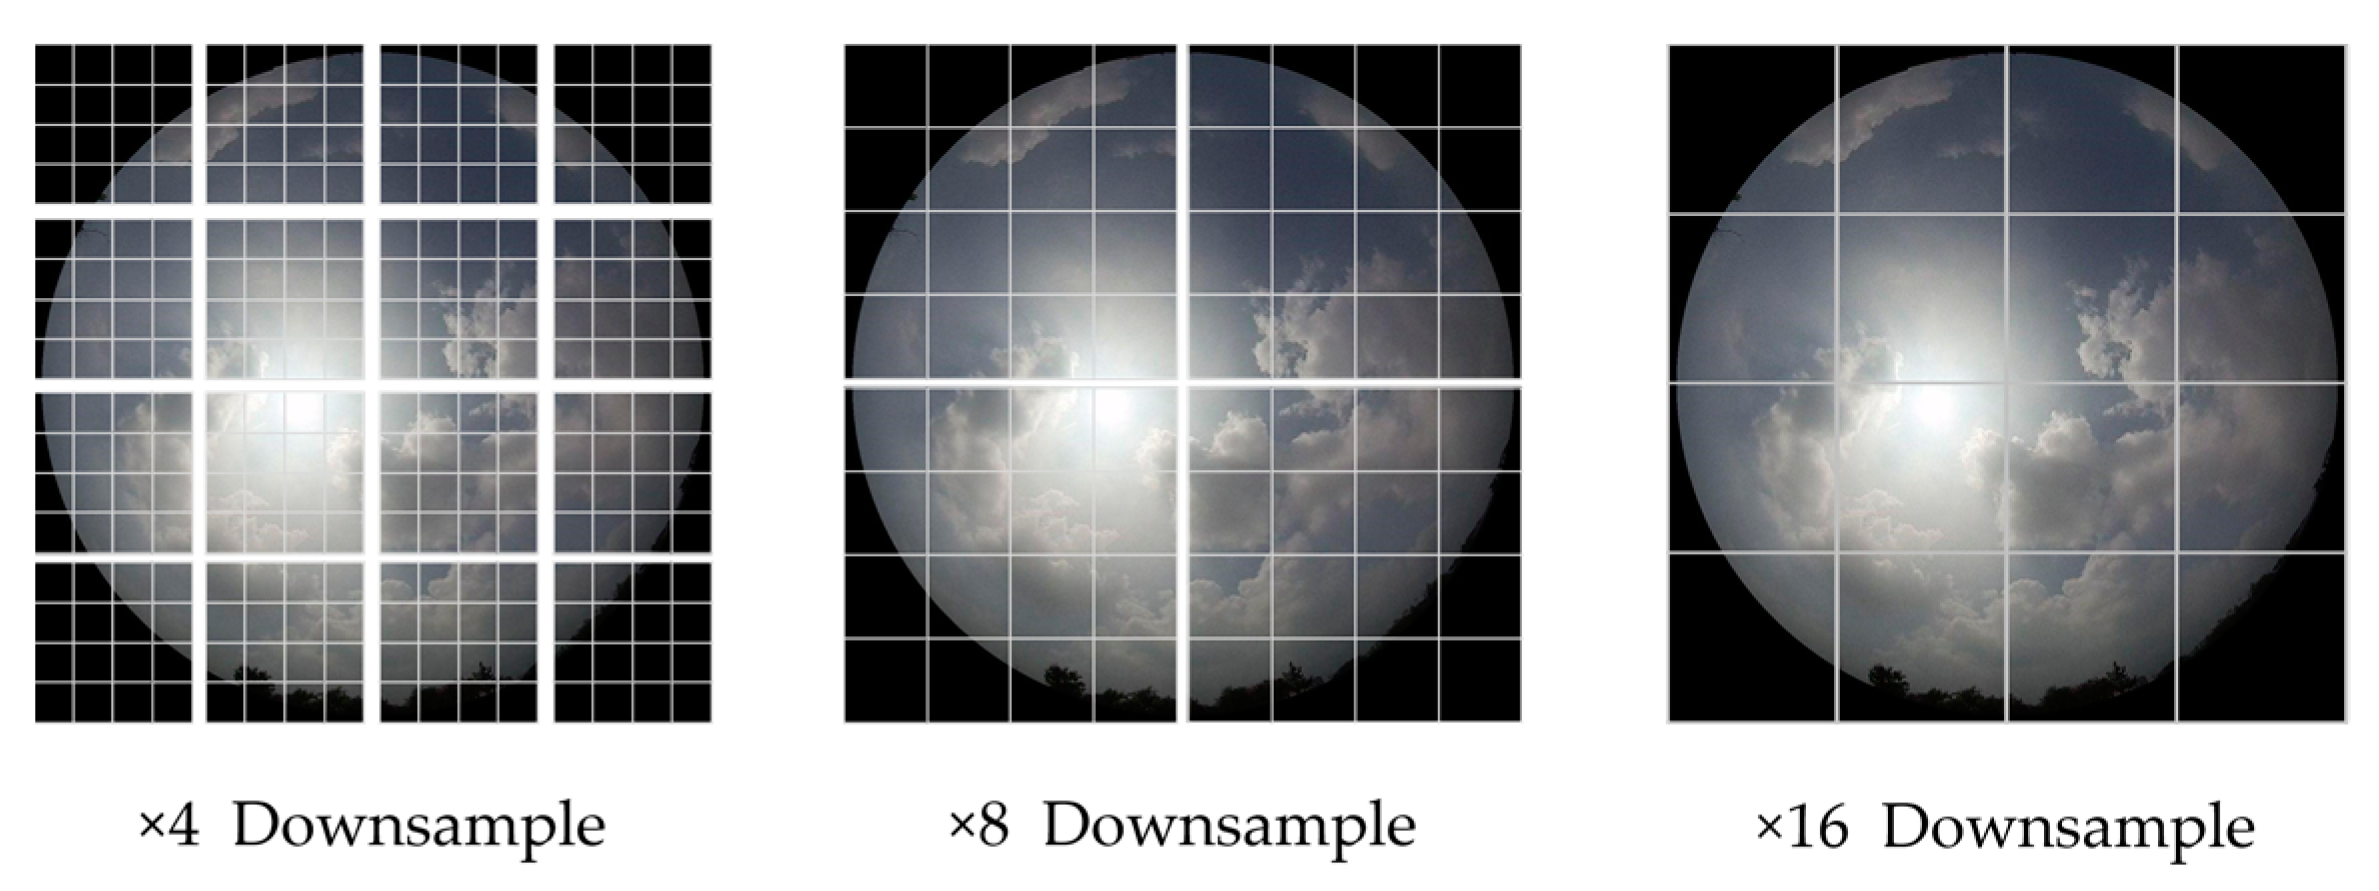
2.3.1. Swin Transformer V2
- (1)
- Improvements to self-attention
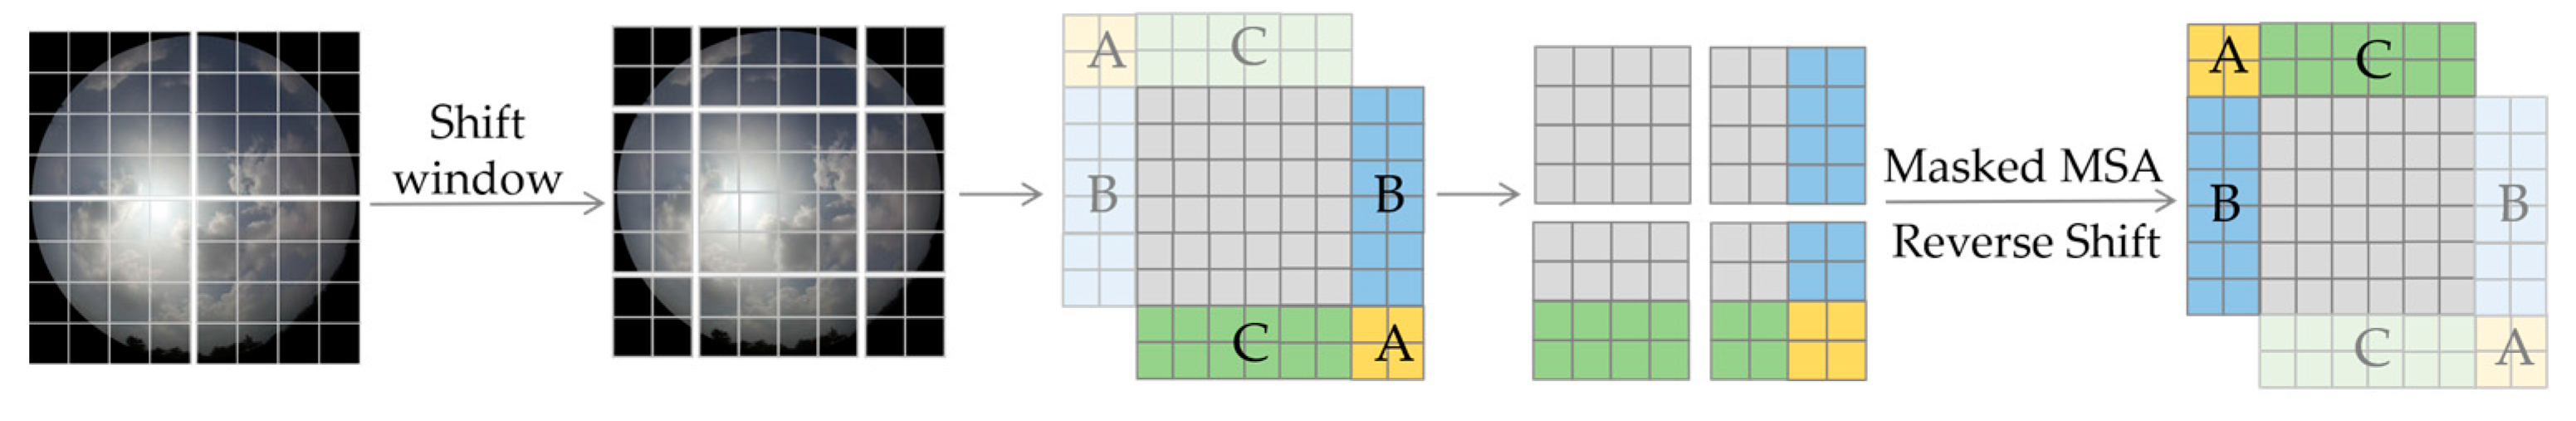
- (2)
- Improvements to shifted windows multi-head self-attention
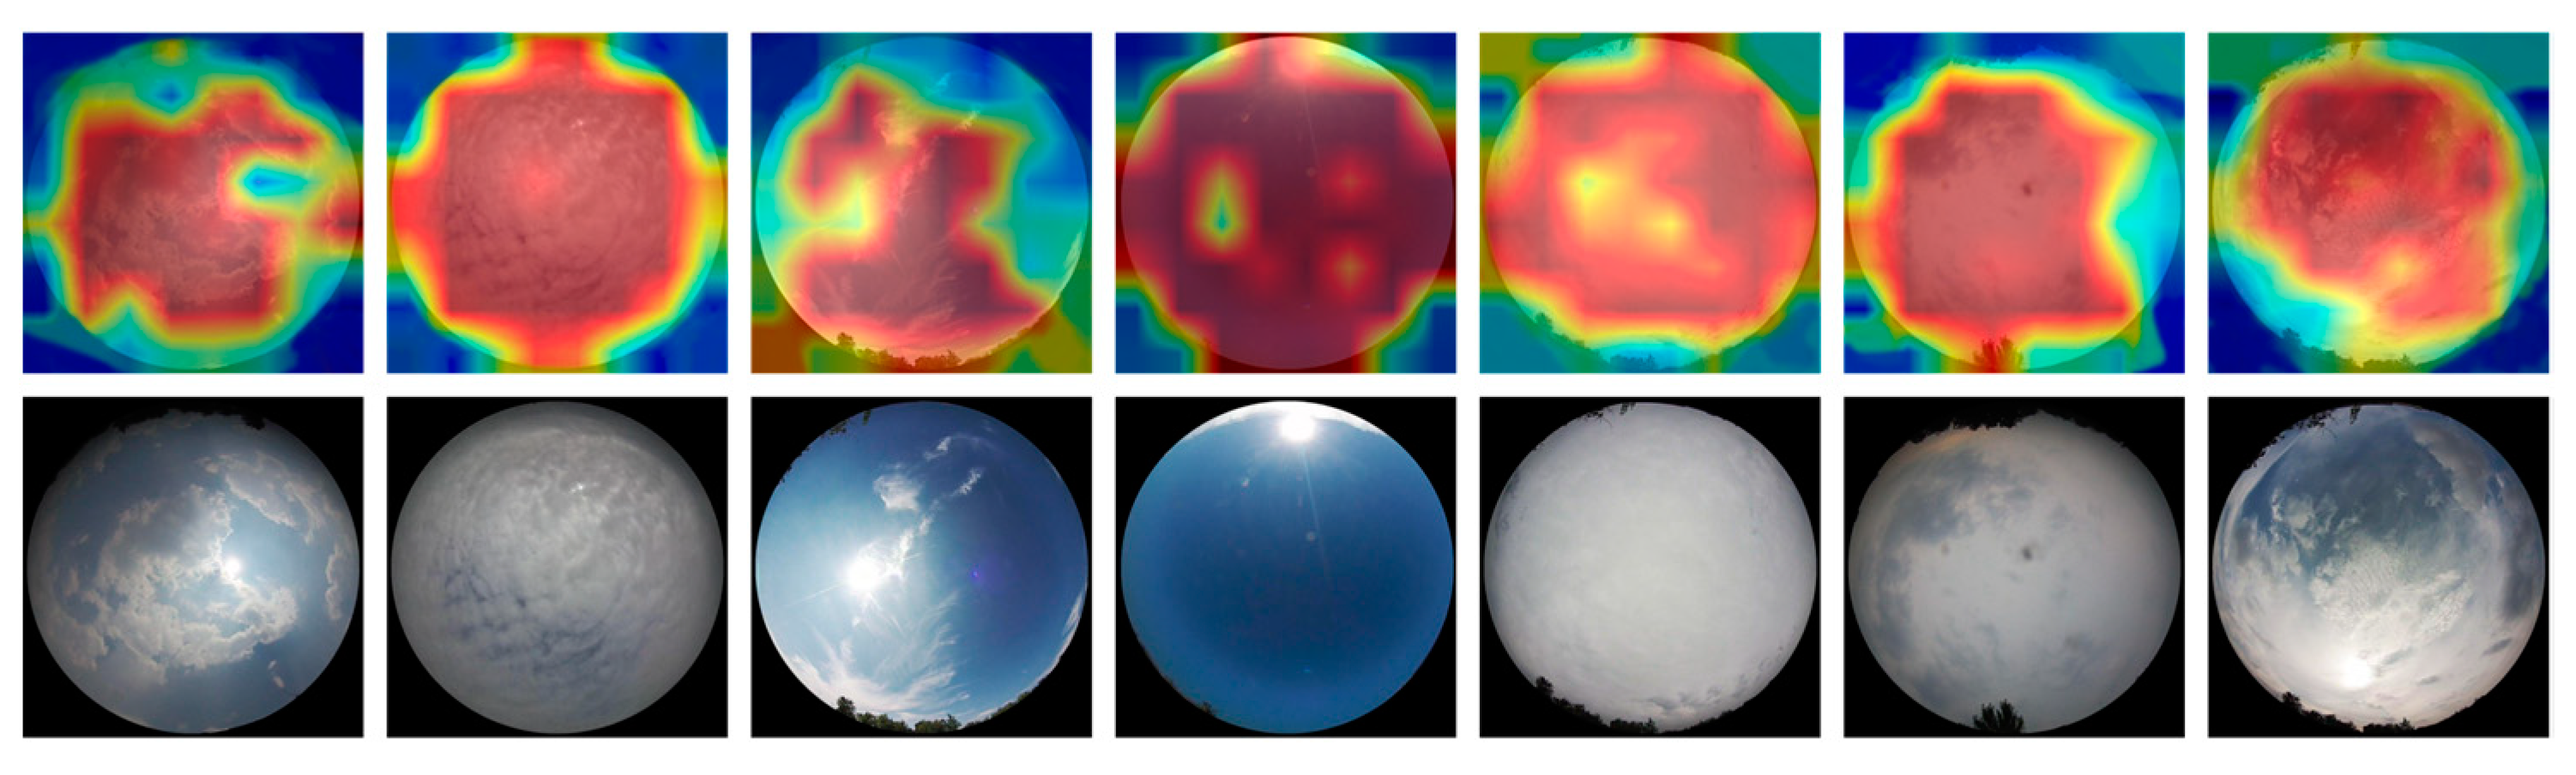
2.3.2. Feature Map Visualization
2.4. Multi-Modal Information Network and Feature Fusion Network
2.5. Implementation Details
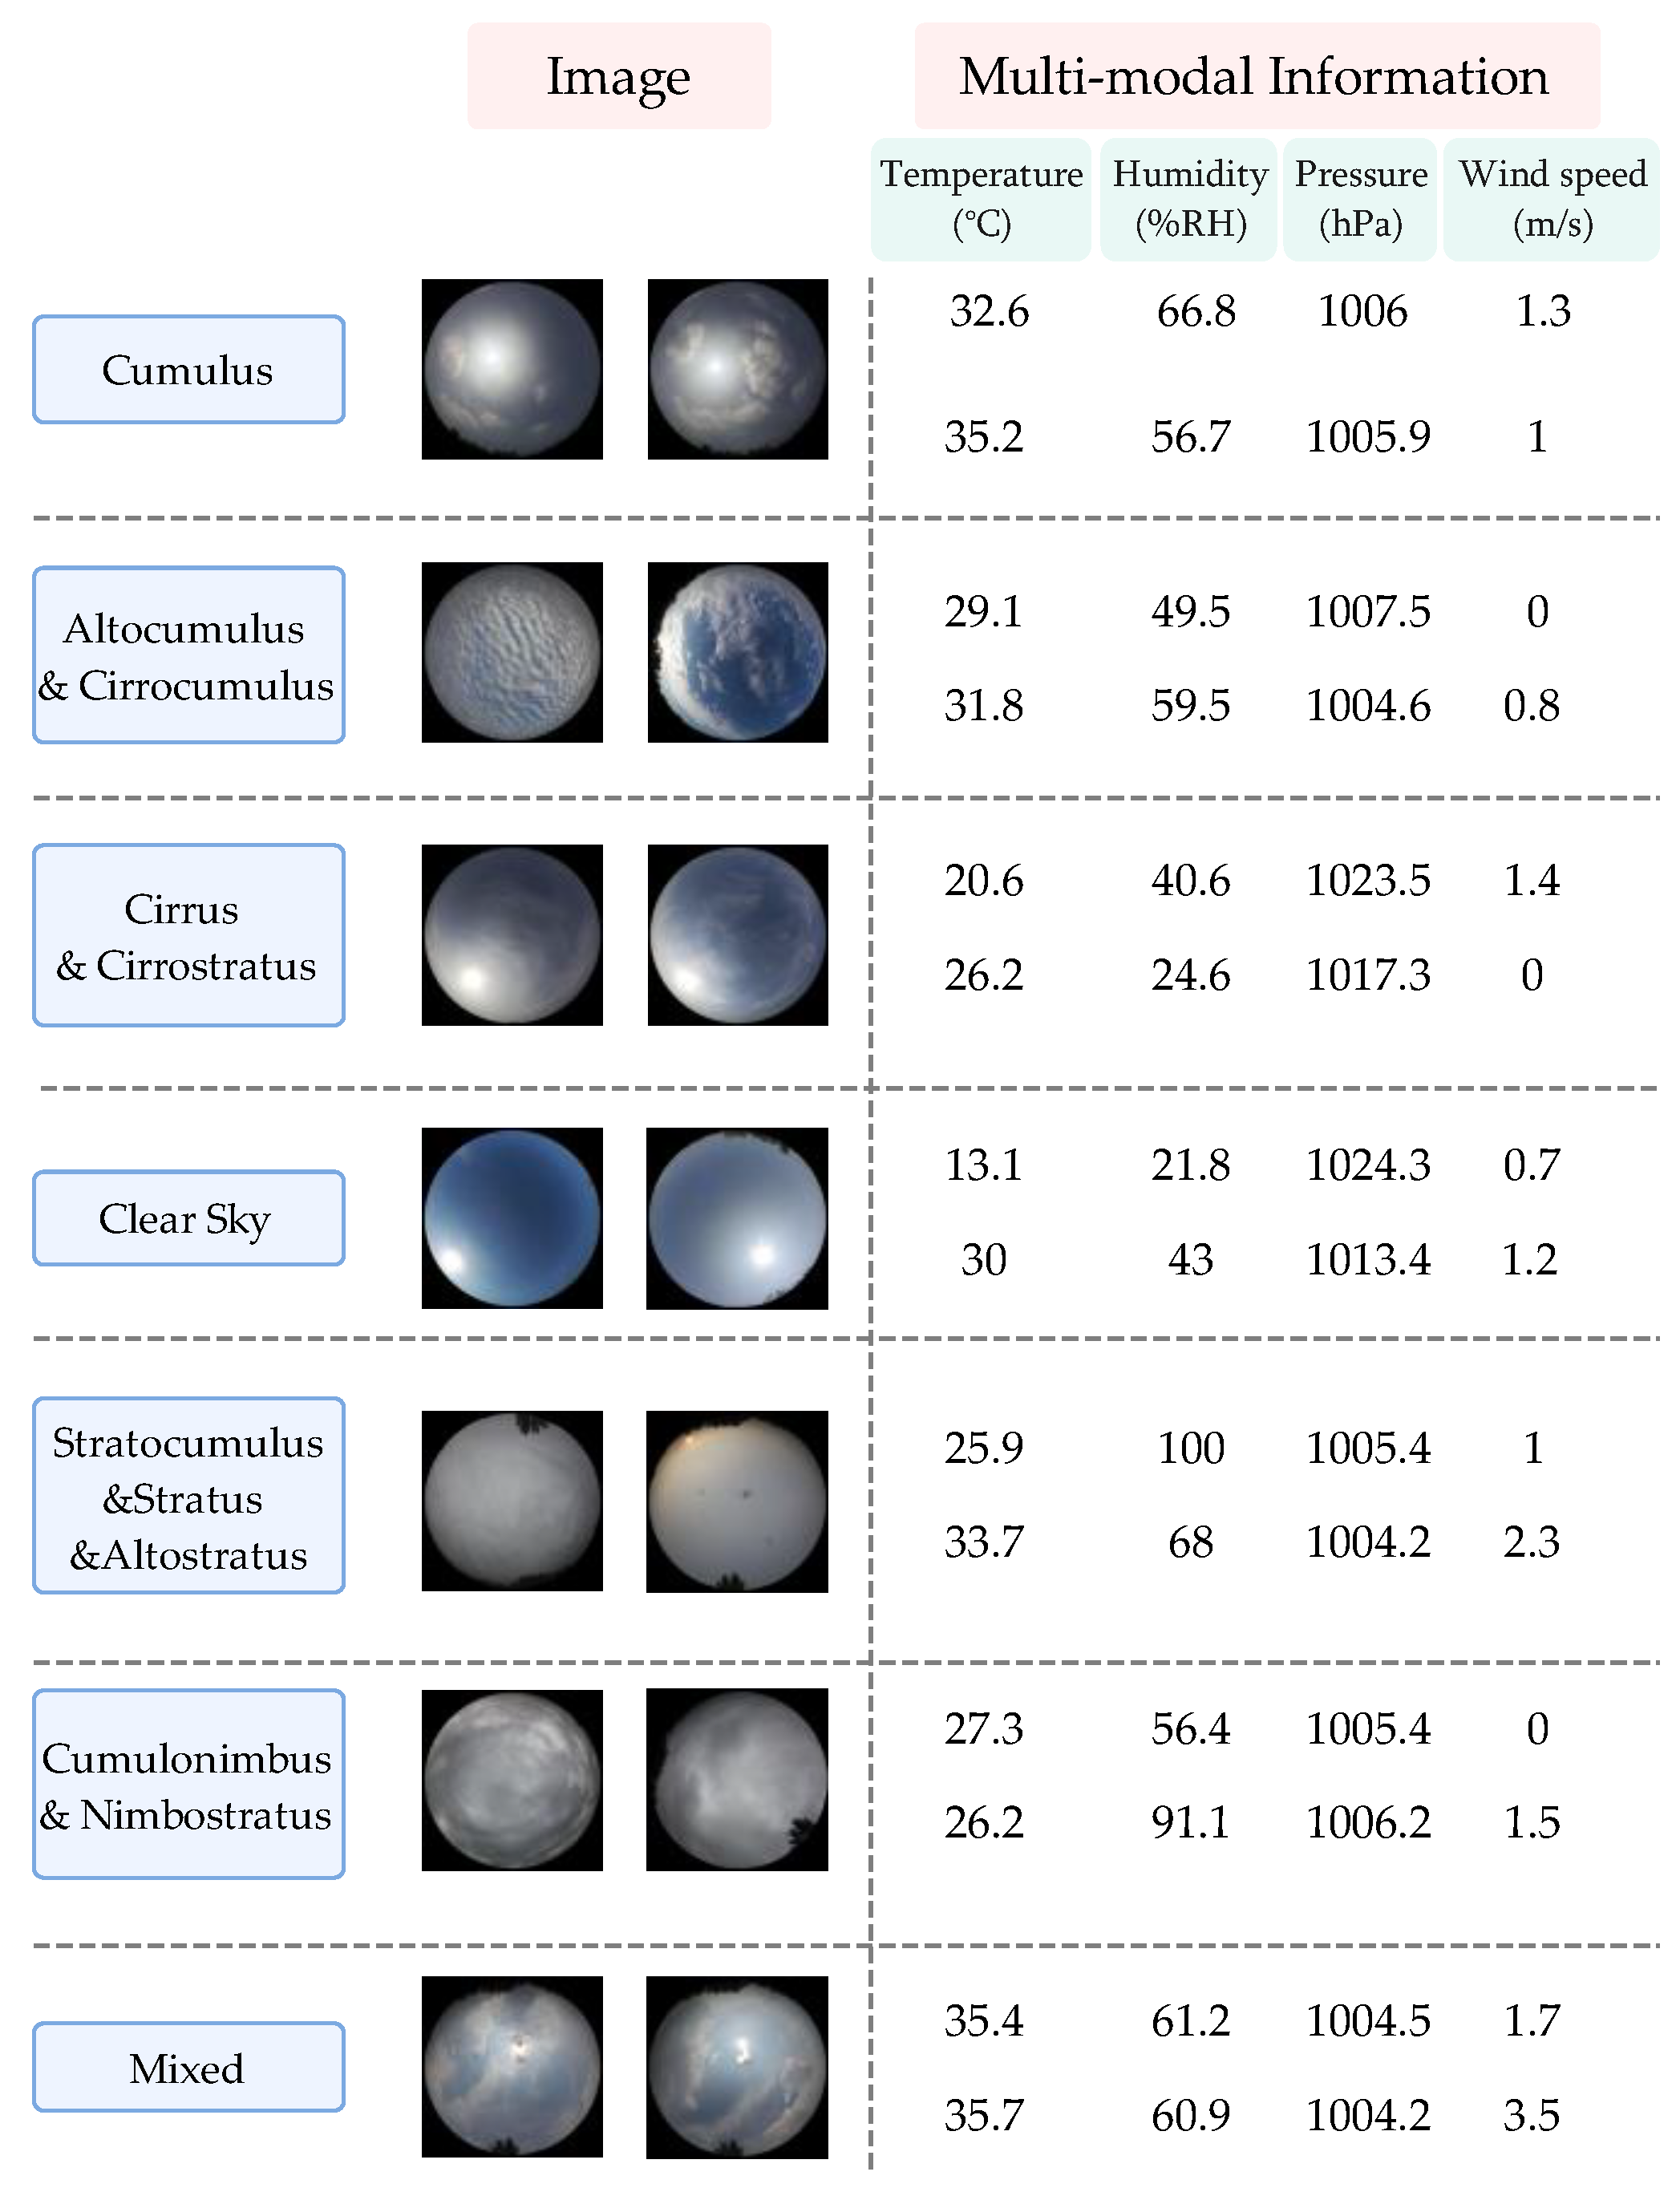
3. Data Collection
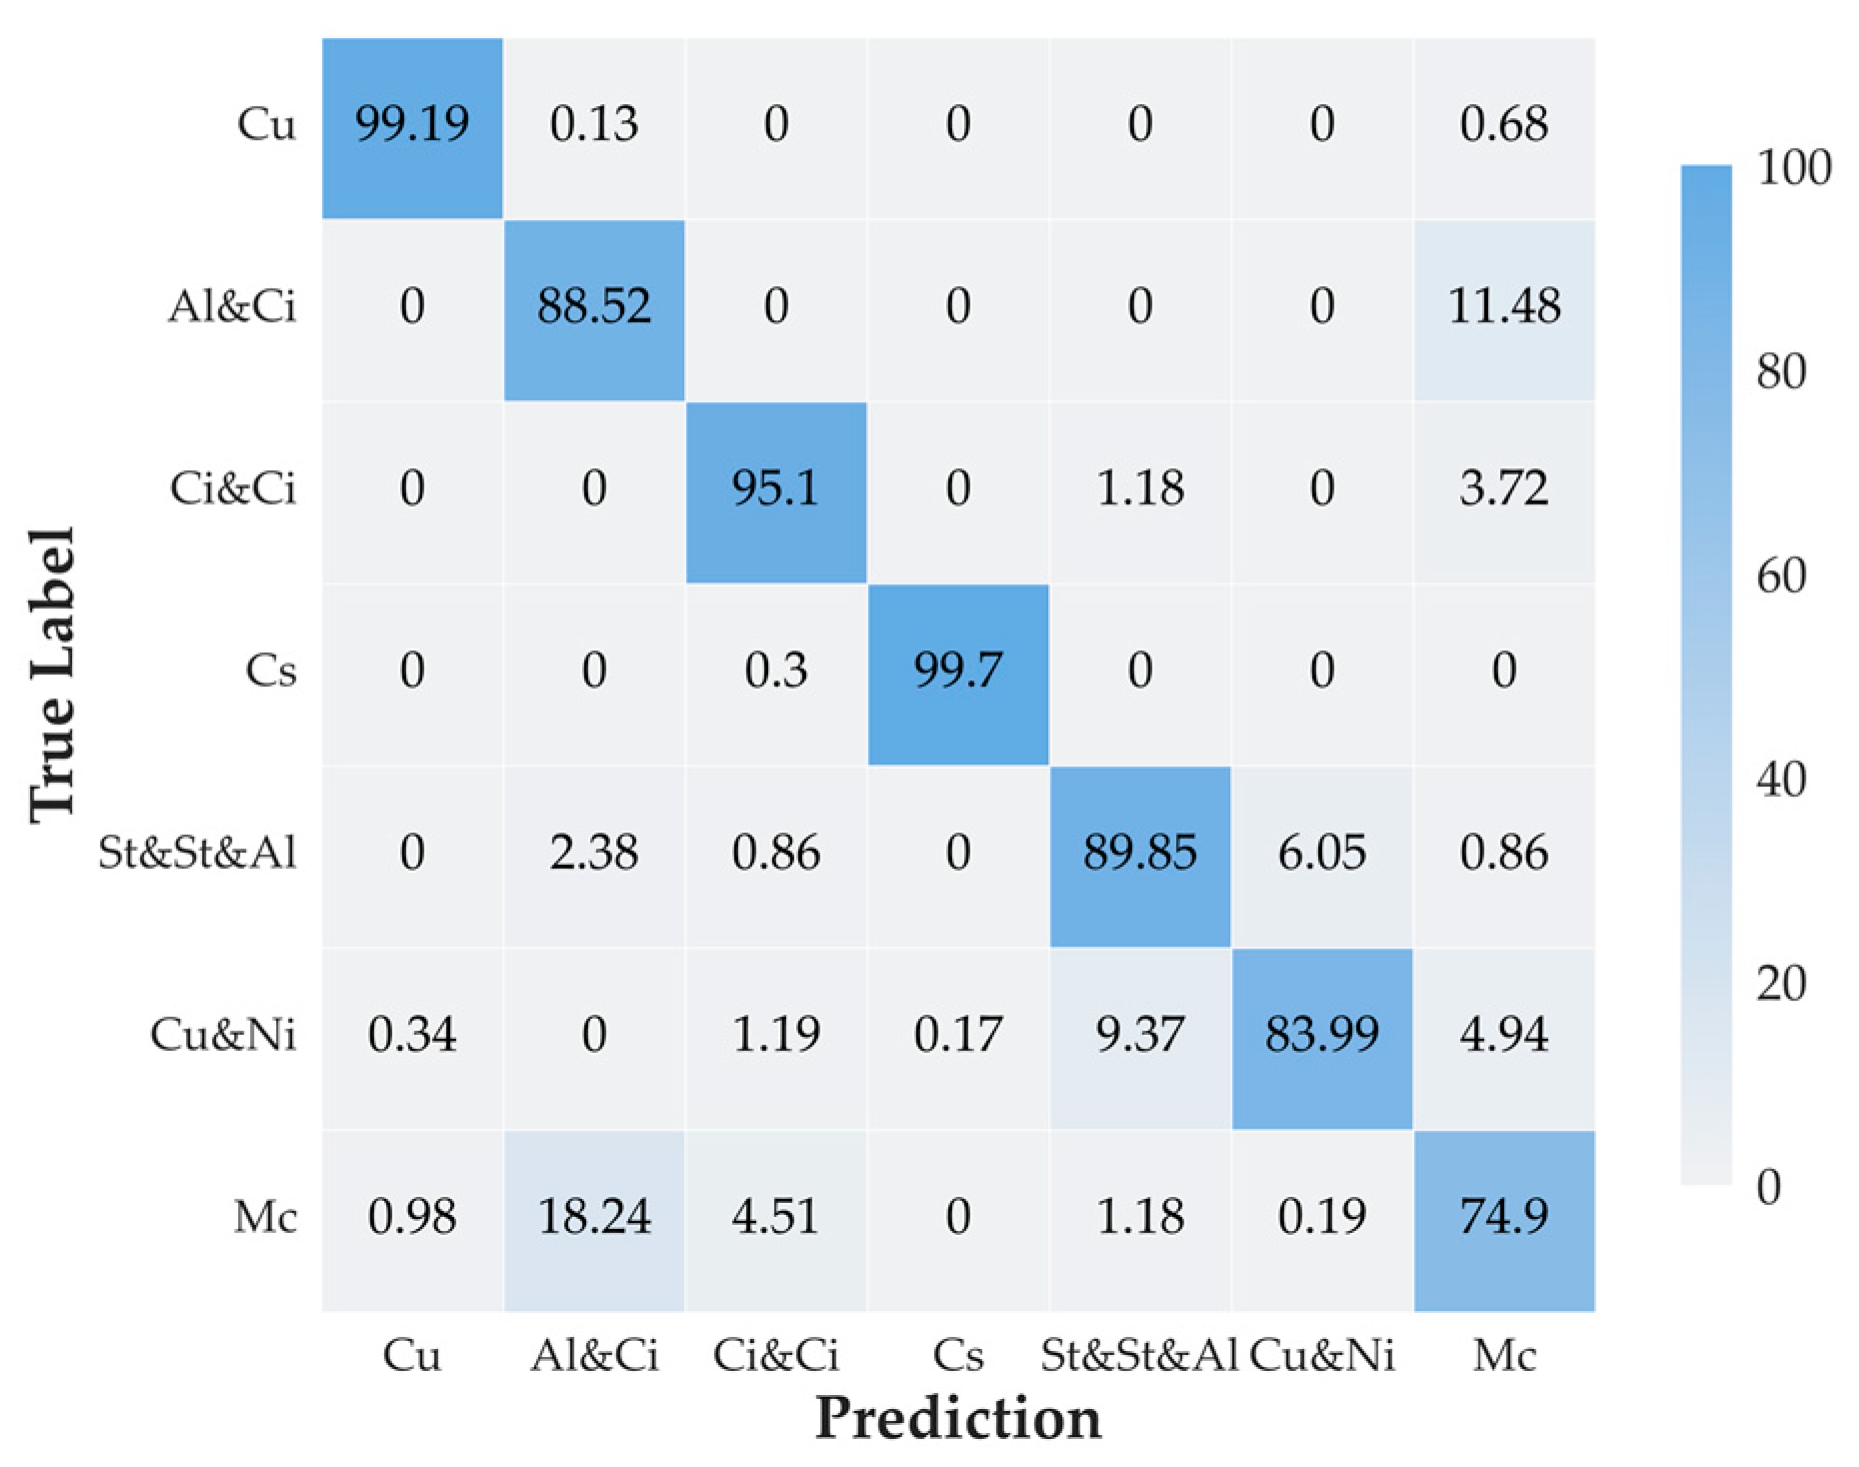
4. Results
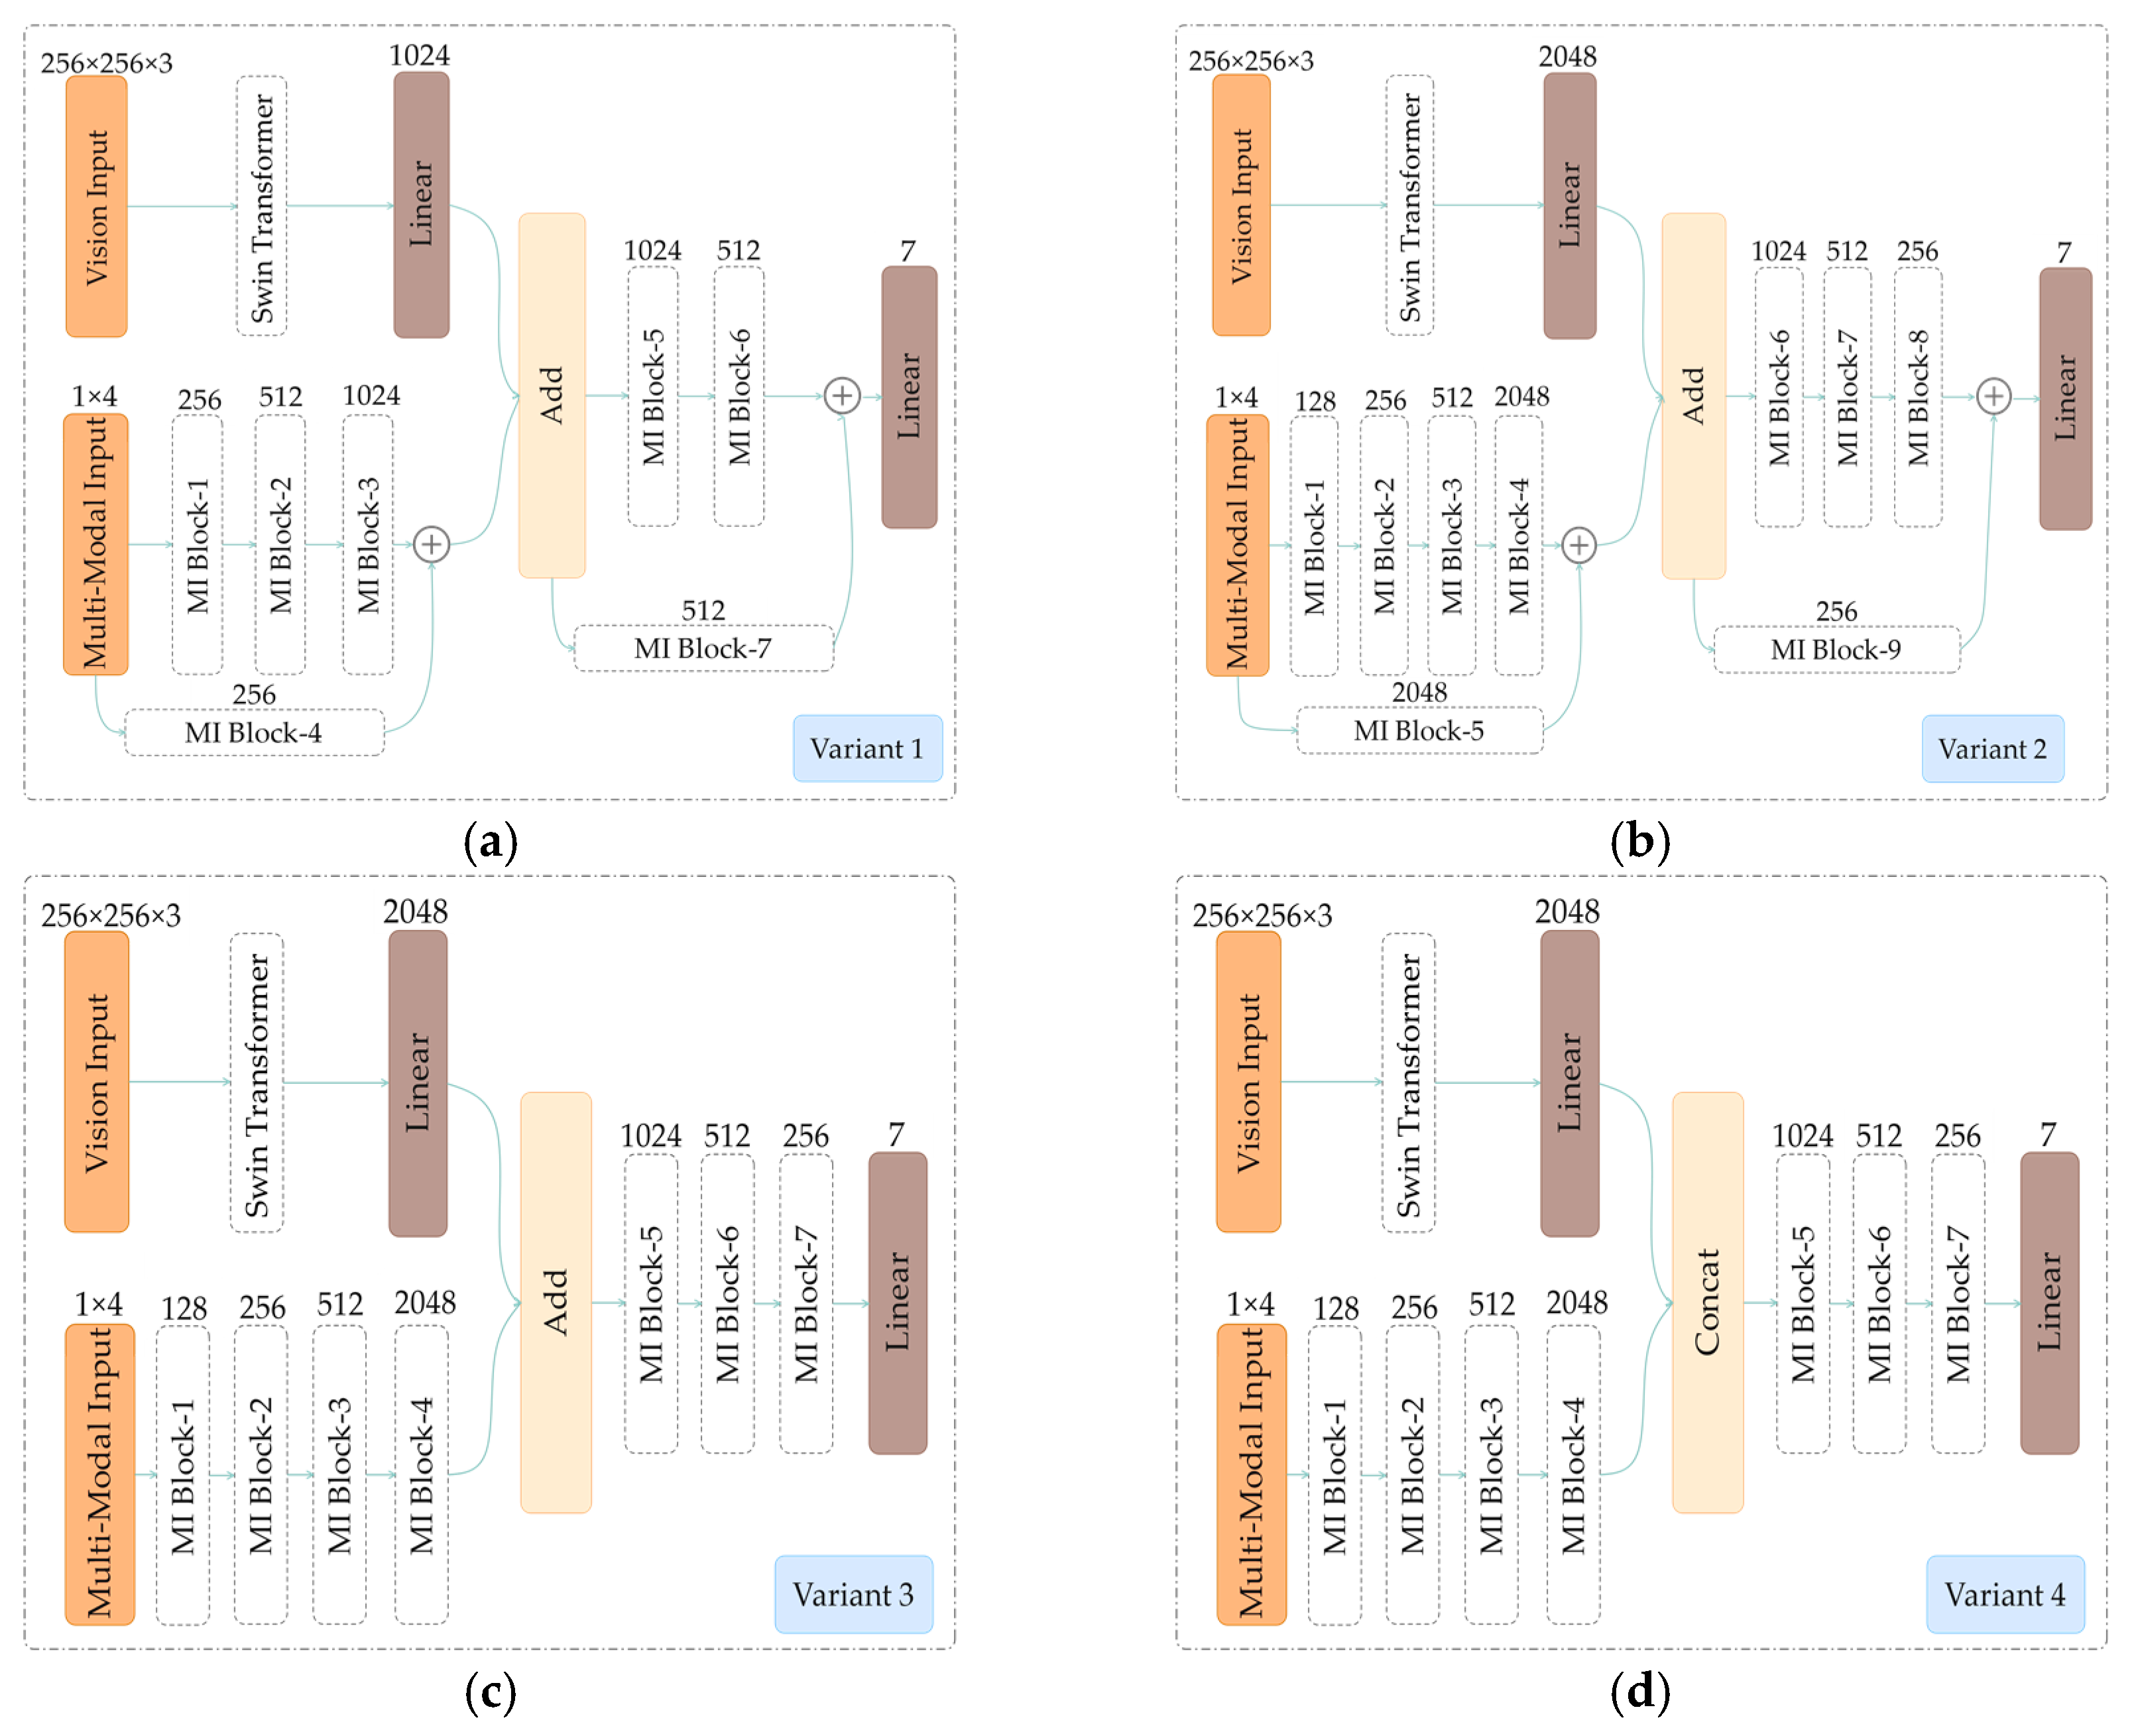
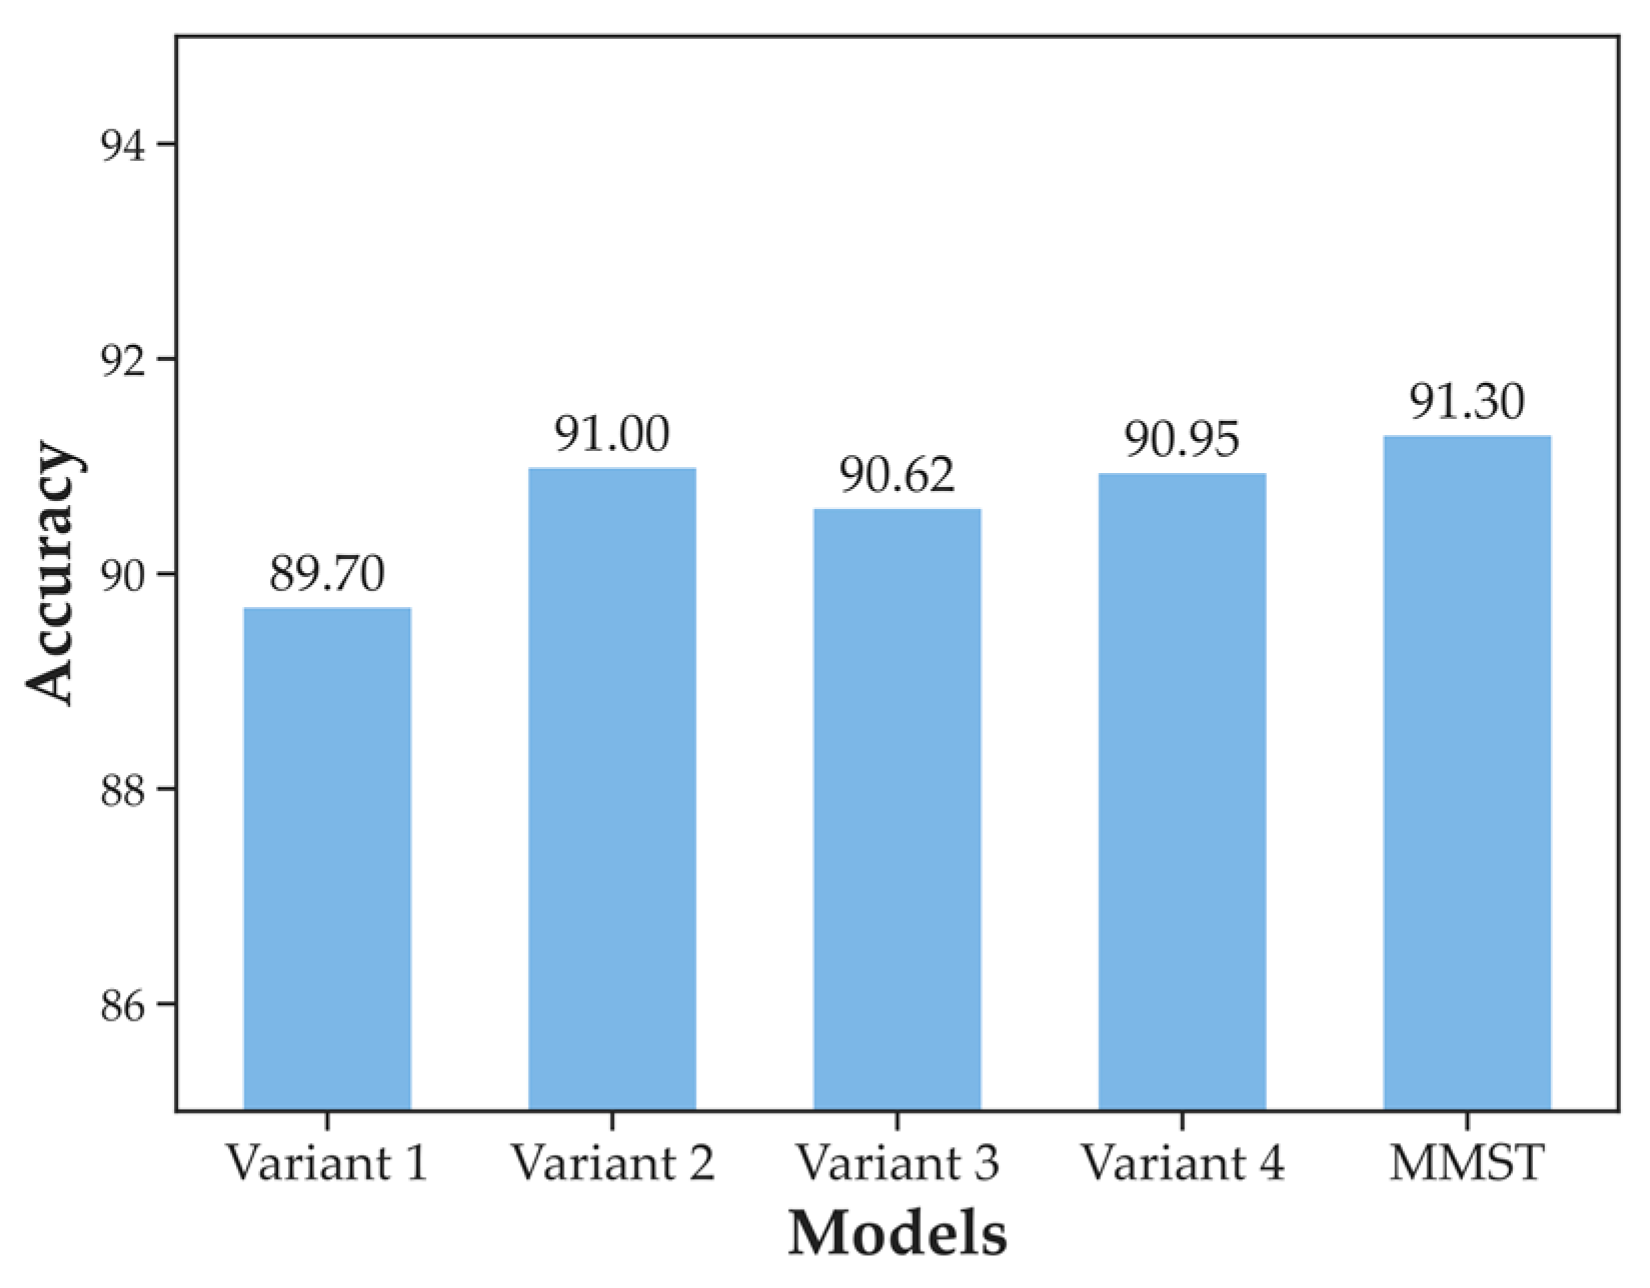
4.1. Comparison with Variants of MMST
4.2. Comparison with Hand-Crafted Methods
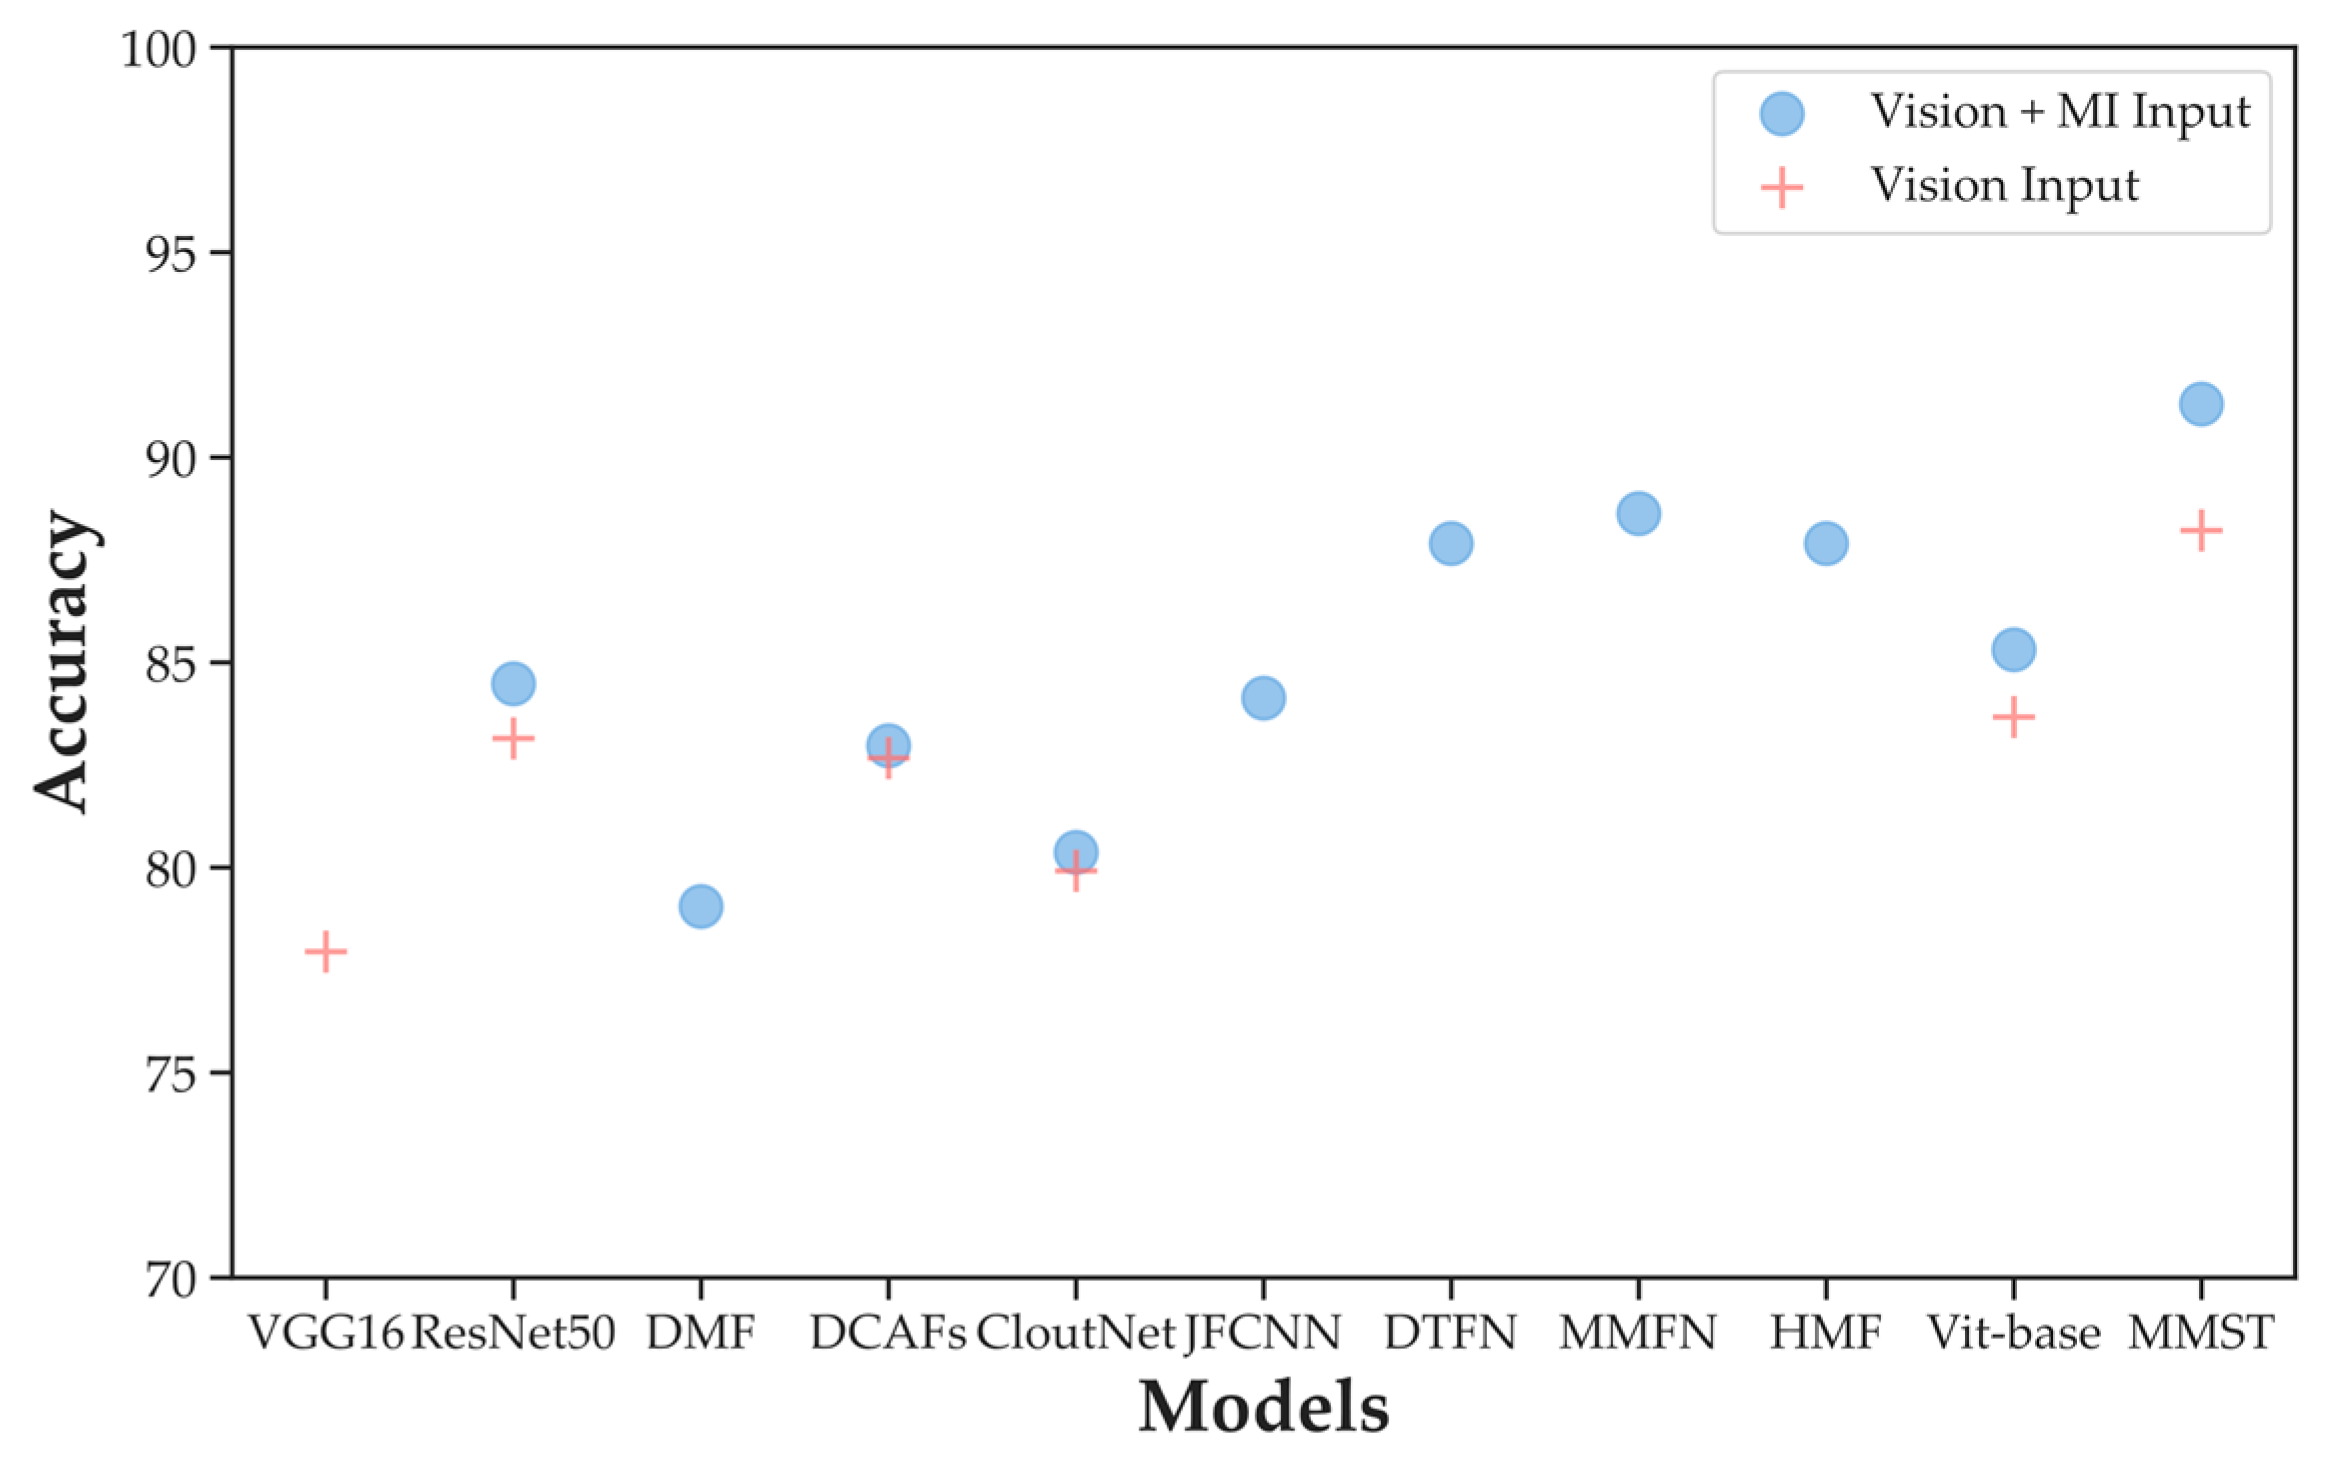
4.3. Comparison with Other Deep Learning Methods
5. Discussion
5.1. Analyses of the Experiments with Variants of MMST
5.2. Analyses of the Experiments with Hand-Crafted Methods
5.3. Analyses of the Experiments with Other Deep Learning Methods
6. Conclusions
- Collect a ground-based cloud image dataset with a considerably larger amount of data.
- Obtain more multi-modal information combined with image information to improve classification accuracy.
- Improve the image coding methods and local modeling capabilities to enable the model of the Transformer architecture to gradually surpass or even replace CNN in the visual field. At the same time, the ability of the model to distinguish mixed cloud layers should be improved.
- Scaling images before entering the network results in a loss of information. In theory, the Swin Transformer can process input data of any length (that is, images of any size). Future work can be directed toward processing high-resolution ground-based cloud images.
Author Contributions
Funding
Institutional Review Board Statement
Informed Consent Statement
Data Availability Statement
Conflicts of Interest
References
- Zhu, T.; Wei, L.; Guo, Y. Cloud Classification of Ground-Based Cloud Images Based on Convolutional Neural Network. J. Phys. Conf. Ser. 2021, 2035, 012020. [Google Scholar] [CrossRef]
- Liu, L.; Sun, X.; Chen, F.; Zhao, S.; Gao, T. Cloud Classification Based on Structure Features of Infrared Images. J. Atmos. Ocean. Technol. 2011, 28, 410–417. [Google Scholar] [CrossRef]
- Heinle, A.; Macke, A.; Srivastav, A. Automatic Cloud Classification of Whole Sky Images. Atmos. Meas. Tech. 2010, 3, 557–567. [Google Scholar] [CrossRef]
- Oikonomou, S.; Kazantzidis, A.; Economou, G.; Fotopoulos, S. A Local Binary Pattern Classification Approach for Cloud Types Derived from All-Sky Imagers. Int. J. Remote Sens. 2019, 40, 2667–2682. [Google Scholar] [CrossRef]
- Xiao, Y.; Cao, Z.; Zhuo, W.; Ye, L.; Zhu, L. MCLOUD: A Multiview Visual Feature Extraction Mechanism for Ground-Based Cloud Image Categorization. J. Atmos. Ocean. Technol. 2016, 33, 789–801. [Google Scholar] [CrossRef]
- Zhang, J.; Liu, P.; Zhang, F.; Song, Q. CloudNet: Ground-Based Cloud Classification with Deep Convolutional Neural Network. Geophys. Res. Lett. 2018, 45, 8665–8672. [Google Scholar] [CrossRef]
- Liu, S.; Li, M.; Zhang, Z.; Cao, X.; Durrani, T.S. Ground-Based Cloud Classification Using Task-Based Graph Convolutional Network. Geophys. Res. Lett. 2020, 47, e2020GL087338. [Google Scholar] [CrossRef]
- Vaswani, A.; Shazeer, N.; Parmar, N.; Uszkoreit, J.; Jones, L.; Gomez, A.N.; Kaiser, Ł.; Polosukhin, I. Attention Is All You Need. In Proceedings of the Advances in Neural Information Processing Systems; Curran Associates, Inc.: Red Hook, NY, USA, 2017; Volume 30. [Google Scholar]
- Dosovitskiy, A.; Beyer, L.; Kolesnikov, A.; Weissenborn, D.; Zhai, X.; Unterthiner, T.; Dehghani, M.; Minderer, M.; Heigold, G.; Gelly, S.; et al. An Image Is Worth 16x16 Words: Transformers for Image Recognition at Scale. arXiv 2020, arXiv:2010.11929. [Google Scholar]
- Li, X.; Qiu, B.; Cao, G.; Wu, C.; Zhang, L. A Novel Method for Ground-Based Cloud Image Classification Using Transformer. Remote Sens. 2022, 14, 3978. [Google Scholar] [CrossRef]
- Farmer, D.K.; Cappa, C.D.; Kreidenweis, S.M. Atmospheric Processes and Their Controlling Influence on Cloud Condensation Nuclei Activity. Chem. Rev. 2015, 115, 4199–4217. [Google Scholar] [CrossRef]
- Liu, S.; Li, M.; Zhang, Z.; Xiao, B.; Durrani, T.S. Multi-Evidence and Multi-Modal Fusion Network for Ground-Based Cloud Recognition. Remote Sens. 2020, 12, 464. [Google Scholar] [CrossRef]
- Liu, Z.; Hu, H.; Lin, Y.; Yao, Z.; Xie, Z.; Wei, Y.; Ning, J.; Cao, Y.; Zhang, Z.; Dong, L.; et al. Swin Transformer V2: Scaling Up Capacity and Resolution. In Proceedings of the IEEE/CVF Conference on Computer Vision and Pattern Recognition, New Orleans, LA, USA, 18–24 June 2022; pp. 12009–12019. [Google Scholar]
- Liu, Z.; Lin, Y.; Cao, Y.; Hu, H.; Wei, Y.; Zhang, Z.; Lin, S.; Guo, B. Swin Transformer: Hierarchical Vision Transformer Using Shifted Windows. In Proceedings of the 2021 IEEE/CVF International Conference on Computer Vision (ICCV), Montreal, QC, Canada, 10–17 October 2021; pp. 10012–10022. [Google Scholar]
- Zheng, Z.; Zhao, Y.; Li, A.; Yu, Q. Wild Terrestrial Animal Re-Identification Based on an Improved Locally Aware Transformer with a Cross-Attention Mechanism. Animals 2022, 12, 3503. [Google Scholar] [CrossRef] [PubMed]
- Li, A.; Zhao, Y.; Zheng, Z. Novel Recursive BiFPN Combining with Swin Transformer for Wildland Fire Smoke Detection. Forests 2022, 13, 2032. [Google Scholar] [CrossRef]
- Shaw, P.; Uszkoreit, J.; Vaswani, A. Self-Attention with Relative Position Representations. arXiv 2018, arXiv:1803.02155. [Google Scholar]
- Chattopadhay, A.; Sarkar, A.; Howlader, P.; Balasubramanian, V.N. Grad-CAM++: Generalized Gradient-Based Visual Explanations for Deep Convolutional Networks. In Proceedings of the 2018 IEEE Winter Conference on Applications of Computer Vision (WACV), Lake Tahoe, NV, USA, 12–15 March 2018; pp. 839–847. [Google Scholar]
- Hendrycks, D.; Gimpel, K. Gaussian Error Linear Units (GELUs). arXiv 2020, arXiv:1606.08415. [Google Scholar]
- Shan, Y.; Hoens, T.R.; Jiao, J.; Wang, H.; Yu, D.; Mao, J. Deep Crossing: Web-Scale Modeling without Manually Crafted Combinatorial Features. In Proceedings of the 22nd ACM SIGKDD International Conference on Knowledge Discovery and Data Mining, San Francisco, CA, USA, 13 August 2016; Association for Computing Machinery: New York, NY, USA, 2016; pp. 255–262. [Google Scholar]
- He, K.; Zhang, X.; Ren, S.; Sun, J. Delving Deep into Rectifiers: Surpassing Human-Level Performance on ImageNet Classification. arXiv 2015, arXiv:1502.01852, 1026–1034. [Google Scholar]
- Glorot, X.; Bengio, Y. Understanding the Difficulty of Training Deep Feedforward Neural Networks. In Proceedings of the Thirteenth International Conference on Artificial Intelligence and Statistics; JMLR Workshop and Conference Proceedings, Sardinia, Italy, 31 March 2010; pp. 249–256. [Google Scholar]
- Ojala, T.; Pietikainen, M.; Maenpaa, T. Multiresolution Gray-Scale and Rotation Invariant Texture Classification with Local Binary Patterns. IEEE Trans. Pattern Anal. Mach. Intell. 2002, 24, 971–987. [Google Scholar] [CrossRef]
- Guo, Z.; Zhang, L.; Zhang, D. A Completed Modeling of Local Binary Pattern Operator for Texture Classification. IEEE Trans. Image Process. 2010, 19, 1657–1663. [Google Scholar] [CrossRef]
- Csurka, G.; Dance, C.R.; Fan, L.; Willamowski, J.; Bray, C. Visual Categorization with Bags of Keypoints. In Proceedings of the Workshop on Statistical Learning in Computer Vision, ECCV, Prague, Czech Republic, 10−14 May 2004; Volume 1, pp. 1–2. [Google Scholar]
- Lazebnik, S.; Schmid, C.; Ponce, J. Beyond Bags of Features: Spatial Pyramid Matching for Recognizing Natural Scene Categories. In IEEE Computer Society Conference on Computer Vision and Pattern Recognition (CVPR’06); IEEE: Piscataway, NJ, USA, 2006; Volume 2, pp. 2169–2178. [Google Scholar]
- Simonyan, K.; Zisserman, A. Very Deep Convolutional Networks for Large-Scale Image Recognition. arXiv 2015, arXiv:1409.1556. [Google Scholar]
- He, K.; Zhang, X.; Ren, S.; Sun, J. Deep Residual Learning for Image Recognition. arXiv 2016, arXiv:1512.03385. [Google Scholar]
- Liu, S.; Li, M. Deep Multimodal Fusion for Ground-Based Cloud Classification in Weather Station Networks. J. Wirel. Com. Netw. 2018, 2018, 48. [Google Scholar] [CrossRef]
- Shi, C.; Wang, C.; Wang, Y.; Xiao, B. Deep Convolutional Activations-Based Features for Ground-Based Cloud Classification. IEEE Geosci. Remote Sens. Lett. 2017, 14, 816–820. [Google Scholar] [CrossRef]
- Liu, S.; Li, M.; Zhang, Z.; Xiao, B.; Cao, X. Multimodal Ground-Based Cloud Classification Using Joint Fusion Convolutional Neural Network. Remote Sens. 2018, 10, 822. [Google Scholar] [CrossRef]
- Li, M.; Liu, S.; Zhang, Z. Deep Tensor Fusion Network for Multimodal Ground-Based Cloud Classification in Weather Station Networks. Ad. Hoc Netw. 2020, 96, 101991. [Google Scholar] [CrossRef]
- Liu, S.; Duan, L.; Zhang, Z.; Cao, X. Hierarchical Multimodal Fusion for Ground-Based Cloud Classification in Weather Station Networks. IEEE Access. 2019, 7, 85688–85695. [Google Scholar] [CrossRef]
- Amyar, A.; Guo, R.; Cai, X.; Assana, S.; Chow, K.; Rodriguez, J.; Yankama, T.; Cirillo, J.; Pierce, P.; Goddu, B.; et al. Impact of Deep Learning Architectures on Accelerated Cardiac T1 Mapping Using MyoMapNet. NMR Biomed. 2022, 35, e4794. [Google Scholar] [CrossRef] [PubMed]


| Class | Precision (%) | Recall (%) | F1-Score (%) |
|---|---|---|---|
| Cu | 99.13 | 99.62 | 99.03 |
| Al-Ci | 73.95 | 89.23 | 80.27 |
| Ci-Ci | 95.78 | 95.49 | 95.91 |
| Cs | 100 | 100 | 100 |
| St-St-Al | 86.17 | 90.55 | 88.17 |
| Cu-Ni | 95.49 | 84.13 | 89.04 |
| Mc | 79.32 | 75.28 | 77.51 |
| Class | Vision Input | Vision + MI Input | ||||||
|---|---|---|---|---|---|---|---|---|
| Accuracy (%) | Precision (%) | Recall (%) | F1-Score (%) | Accuracy (%) | Precision (%) | Recall (%) | F1-Score (%) | |
| BoVW | 66.15 | 62.80 | 66.95 | 63.94 | 67.20 | 66.19 | 67.91 | 66.60 |
| PBoVW | 66.13 | 63.53 | 65.51 | 64.54 | 67.15 | 67.00 | 65.85 | 65.23 |
| 45.38 | 44.33 | 45.94 | 44.99 | 45.25 | 46.22 | 45.07 | 45.65 | |
| 49.00 | 49.27 | 51.34 | 49.85 | 47.25 | 49.53 | 51.58 | 50.13 | |
| 50.20 | 49.55 | 52.96 | 50.08 | 50.53 | 46.94 | 49.31 | 47.11 | |
| 65.10 | 64.45 | 65.39 | 64.32 | 65.40 | 65.12 | 65.57 | 65.07 | |
| 68.20 | 67.88 | 67.47 | 67.78 | 68.48 | 69.19 | 68.18 | 68.68 | |
| 69.18 | 70.71 | 66.20 | 68.73 | 69.68 | 69.92 | 71.67 | 70.50 | |
| MMST | 88.22 | 86.87 | 87.48 | 86.79 | 91.30 | 89.86 | 90.17 | 89.17 |
Disclaimer/Publisher’s Note: The statements, opinions and data contained in all publications are solely those of the individual author(s) and contributor(s) and not of MDPI and/or the editor(s). MDPI and/or the editor(s) disclaim responsibility for any injury to people or property resulting from any ideas, methods, instructions or products referred to in the content. |
© 2023 by the authors. Licensee MDPI, Basel, Switzerland. This article is an open access article distributed under the terms and conditions of the Creative Commons Attribution (CC BY) license (https://creativecommons.org/licenses/by/4.0/).
Share and Cite
Wei, L.; Zhu, T.; Guo, Y.; Ni, C. MMST: A Multi-Modal Ground-Based Cloud Image Classification Method. Sensors 2023, 23, 4222. https://doi.org/10.3390/s23094222
Wei L, Zhu T, Guo Y, Ni C. MMST: A Multi-Modal Ground-Based Cloud Image Classification Method. Sensors. 2023; 23(9):4222. https://doi.org/10.3390/s23094222
Chicago/Turabian StyleWei, Liang, Tingting Zhu, Yiren Guo, and Chao Ni. 2023. "MMST: A Multi-Modal Ground-Based Cloud Image Classification Method" Sensors 23, no. 9: 4222. https://doi.org/10.3390/s23094222
APA StyleWei, L., Zhu, T., Guo, Y., & Ni, C. (2023). MMST: A Multi-Modal Ground-Based Cloud Image Classification Method. Sensors, 23(9), 4222. https://doi.org/10.3390/s23094222