Technical Note

Coastal Bathymetric Sounding in Very Shallow Water Using USV: Study of Public Beach in Gdynia, Poland

Department of Navigation and Hydrography, Polish Naval Academy, 81-127 Gdynia, Poland
Sensors 2023, 23(9), 4215; https://doi.org/10.3390/s23094215
Submission received: 6 February 2023 / Revised: 12 April 2023 / Accepted: 21 April 2023 / Published: 23 April 2023
(This article belongs to the Special Issue Hydrographic Systems and Sensors)

Abstract

:
The bathymetric surveys executed with a use of small survey vessels in limited water areas, including offshore areas, require precise determination of the geospatial coordinates of the seabed which is a synthesis of, among others, determining the position coordinates and measuring the depth. Inclination of the seabed and the declining depth make manoeuvring of the sounding vessel, e.g., a hydrographic motorboat or Unmanned Survey Vehicle (USV), in shallow water impossible. Therefore, it is important to determine the minimal depth for the survey resulting from the draught of the sounding vessel and the limits of the sounding area. The boundaries also result from the dimensions of the sounding vessel, its manoeuvring parameters and local water level. Type of the echosounder used in the bathymetric survey is a decisive factor for the sounding profile planning and the distances between them and the survey vessel for the possibility performing the measurements in shallow water. Electronic Navigational Chart (ENC) was used to determine the water area’s boundaries, and the safety contours were determined on the basis of the built Digital Sea Bottom Model (DSBM). The safety contour, together with the vessel’s dimensions, its manoeuvring parameters and the hydrometeorological conditions, limit the offshore area in which the measurement can be performed. A method of determining boundaries of the survey performed by a USV equipped with SingleBeam EchoSounder (SBES) on survey lines perpendicular to the coastal line are presented in the paper in order to cover the water area with the highest amount of measurement data, with the USV’s navigational safety taken into consideration. The measurements executed on the municipal beach served verification of the DSBM.

1. Introduction

Small surface vessels increasingly often replace cutters and hydrographic motorboats in bathymetric surveys in the inshore zone [1,2,3,4,5,6,7,8,9,10]. Small size and high manoeuverability, as well as one-man personnel, are among their main advantages. They are often fitted out with SBES for depth measurement owing to the high precision positioning and the vessel guiding along the survey lines (line keeping) [11,12]. This is possible owing to applying the geodetic positioning systems [13,14] in an open upper hemisphere, which enables determining the mobile position coordinates [15].
The International Hydrographic Organization (IHO) [16,17] and local [18,19] requirements specify that 100% of the seafloor must be covered with measurements, which can be understood as a measurement with a Side Scan Sonar (SSS) or an MultiBeam Echosounder (MBES), although the device records a cloud of discrete points. The distance between points of acoustic wave reflection from the seafloor is much smaller than for SBES, and it depends on the survey vessel velocity, the sound beam arrangement and the depth. When measurements are made with an SBES perpendicularly to the vessel’s direction of movement, the distance between the soundwave reflection points depends on the distance between sounding lines and ranges from a few to about a dozen metres. Although the requirement of 100% coverage with data is not fulfilled, measurements with USV equipped with SBES are popular and provide an alternative to MBES mounted on larger autonomous vessels.
A general methodology of planning survey lines [20,21] and good practice in hydrography [22] focus on the position of profiles and other objects (wharf, breakwater) in relation to each other and to the coastline. The maximum distance between profiles is determined, as are the rules of their concentration when an object is detected on the seafloor or in the case of shallowing. Manual steering of a hydrographic motorboat (and doing it perpendicularly to a wharf or the coastline) is an onerous task to the steersman. Therefore, survey profiles are planned at the smallest required distance, which is usually several times greater than between the profiles planned for measurements performed with USV.
Registering geospatial data is another stage of bathymetric surveys. It is important to guide a survey vessel along the sounding lines planned at the first measurement stages. As a navigation problem, it consists in maintaining the vessel’s trajectory (its position and the position of its positioning system) on the planned route. The accuracy of keeping along the survey lines is affected by the positioning system accuracy, the helmsman’s skills (both with a motorboat and a USV in a manual mode), a survey vessel’s manoeuvering parameters, hydrometeorological conditions as well as the model of navigation automation and the basin characteristics (wharf, beach).
Planning bathymetric surveys, including survey lines, is easier in an open basin than on a limited one. It is particularly difficult to plan profiles in harbours and marinas because of the basin diversity. There are frequently ships anchored in a harbour basin, which prevent performing a survey of the whole basin. Mooring sites in marinas are made as Y-booms with a small distance between them [23,24,25]. The width of a mooring site is a manoeuverability-limiting factor.
It is important to determine the land-side border when planning measurements in the inshore area, according to the methodology [19] and perpendicularly to the coast. For manual steering, longer profiles can be planned, which include some land. While controlling the depth with an echosounder, a turn is performed to the next survey line to ensure the survey vessel’s safety. Their limit in measurement automatic mode should be established while taking into account the water level, the safety contour [26,27,28] and the manoeuvering parameters [29,30,31,32]. This will enable performing the measurements as close to the coastline as possible.
Bathymetric surveys were performed in the basin adjacent to the municipal beach, between the southern breakwater of the marina and the sea boulevard in May 2020. The area of research is shown in Figure 1.
The paper is structured as follows. The introduction to the study, purpose and study area are provided in Section 1. Section 2 details general methodology of survey lines’ planning using SBES, planning of survey lines in restricted area, water level observation and prediction, Digital Sea Bottom Model and the safety contour. Section 3 presents the results of the bathymetric surveys (trajectory of the USV) limited using the following methods: coastline on the basis of the ENC, hydrographic reconnaissance and safety contour on the basis of DSBM. Section 4 concludes the paper.

2. Materials and Methods

2.1. General Methodology of Survey Lines’ Planning Using SBES

As SBESs are used on small vessels (a motorboat, USV), measurements are performed in inshore areas. These include maritime hydrotechnical structures and inshore areas. Basic profiles in the hydrotechnical structure area are designed in parallel to the hydrotechnical structure line. Control profiles are designed perpendicularly to basic profiles [20,21].
Basic survey lines in inshore basins are usually designed perpendicularly to the seafloor relief, general direction of contour lines (isobaths) or the coastline. Control survey lines are designed perpendicularly to basic lines. Basic survey lines in basins with a varied coastline are designed at an angle of 45° to the general direction of contour lines or the coastline [20,21].
Surveys of shallows involve determining the value and position of the smallest depth, determining the boundaries of shallows and determining the relief and types of their boundaries. To this end, a dense profile network is designed according to the following principles: a basin near the shallow border is covered with a network of mutually perpendicular profiles spaced at twice less than in the basic survey profile network; as the survey work progresses, the directions and distances of profiles are determined accurately [20,21].
A higher concentration of measurement survey lines is used for SBES measurements in order to determine the course of contour lines and forms of seafloor relief with greater precision. To this end, additional lines are created: at sites where signs of shallows are present; in basins with varied depths and seafloor relief; at places where directions of the planned profiles are similar to the courses of survey lines, which prevents their correct plotting; on the axes of canals and fairways [20,21].

2.2. Planning of Survey Lines in Restricted Areas

Planning of parallel survey lines with a use of typical hydrographic systems QINSy (QPS, Zeist, The Netherlands), HYPACK (HYPACK, Middletown, CT, USA) and EIVA (EIVA a/s, Skanderborg, Denmark) consists of determination of the base line, number of lines and distances between them. In the first stage, it can involve an inaccessible area for the sounding vessel as for instance shallows (shoal, coast), navigational marks or hydrotechnical structures. In manual mode, based on the information about the depth or on observation of the navigational obstacles, the helmsman makes a turn onto the next sounding line. It is possible to limit the sounding area on the basis of ENC or the reconnaissance, performed by a USV. It consists of a USV steering so that it moves safely but as close to the shallows or navigational dangers (stones, rocks, boughs of trees) as possible. The reconnaissance method can be useful in the areas where ENCs have not been developed (inland water areas, mainly lakes) or where the USV’s navigation is highly probable to be in jeopardy. Figure 2 presents stages of planning profiles in three surveyed areas using reconnaissance and ENC methods.

2.3. Water Level Observation and Prediction

Considering the dynamic changes of the seawater levels caused by anemobaric (atmospheric pressure, wind direction and velocity), hydrological (river basins) factors, and tidal elements, obtaining information on the current water level in an area where bathymetric measurements are performed is one of the most important tasks of each hydrographer. This information allows for determining the measured depths relative to the reference level for bathymetric surveys, known as the chart datum. Further, during data processing, this information also allows for handling the bathymetric data referred to in the vertical reference system, which is part of the system used in the National Spatial Reference System [33] areas in the part associated with the creation and updating of data contained in maritime cartographic documents and in navigation databases of the Electronic Chart Display and Information System (ECDIS) and Electronic Chart System ECS.
Observations are performed at stream gauge sites in harbours in cooperation with the state maritime administration (harbour authorities) [34,35,36,37]. The water level observation is executed with staff gauges and it is registered with mareographs, which allow for the continuous registration of water level changes. Information on the water level and its other parameters are available on the Internet at various, usually one-hour intervals [38,39,40,41].
The following are used in field applications, where local conditions require information on water level fluctuations:
  • mobile water level gauge stations, often referred to as tide-gauge or tide-stations. They usually make use of special pressure and temperature sensors, which measure changes in the water column and use the registered changes to convert the data, referring them to the water level changes;
  • the RTK-tide method which enables determination of the water level based on the altitude of a GNSS receiver antenna in a chosen reference system and reducing (converting) it to a local vertical altitude system [41,42,43].
Water level, on the basis of information available on the Internet [38,44], the gauge installed in the marina and GNSS measurements (Figure 3) were used for determination of the safety contour, which is a boundary of bathymetric surveys in coastal areas.

2.4. USV Used for Bathymetric Surveys in Very Shallow Water

During the surveys in shallow water areas, where USVs of draught of a dozen cm or so are used, the security isobaths should be determined where the USV security contour will be one of them—at the current water level. USV OceanAlfa SL20 is presented in Figure 4—it performed the bathymetric measurements in the water area adjacent to the municipal beach in Gdynia.
Table 1 presents the basic USV parameters in respect to its route along the sounding lines in shallow water.
Due to the bathymetric surveys planned on a very shallow basin and carried out by a USV, the safety contour was established within the range of 0–0.5 m with a resolution of 5 cm. Its selection is dependent on the size of the USV.

3. Results and Discussion

3.1. Area of the Research

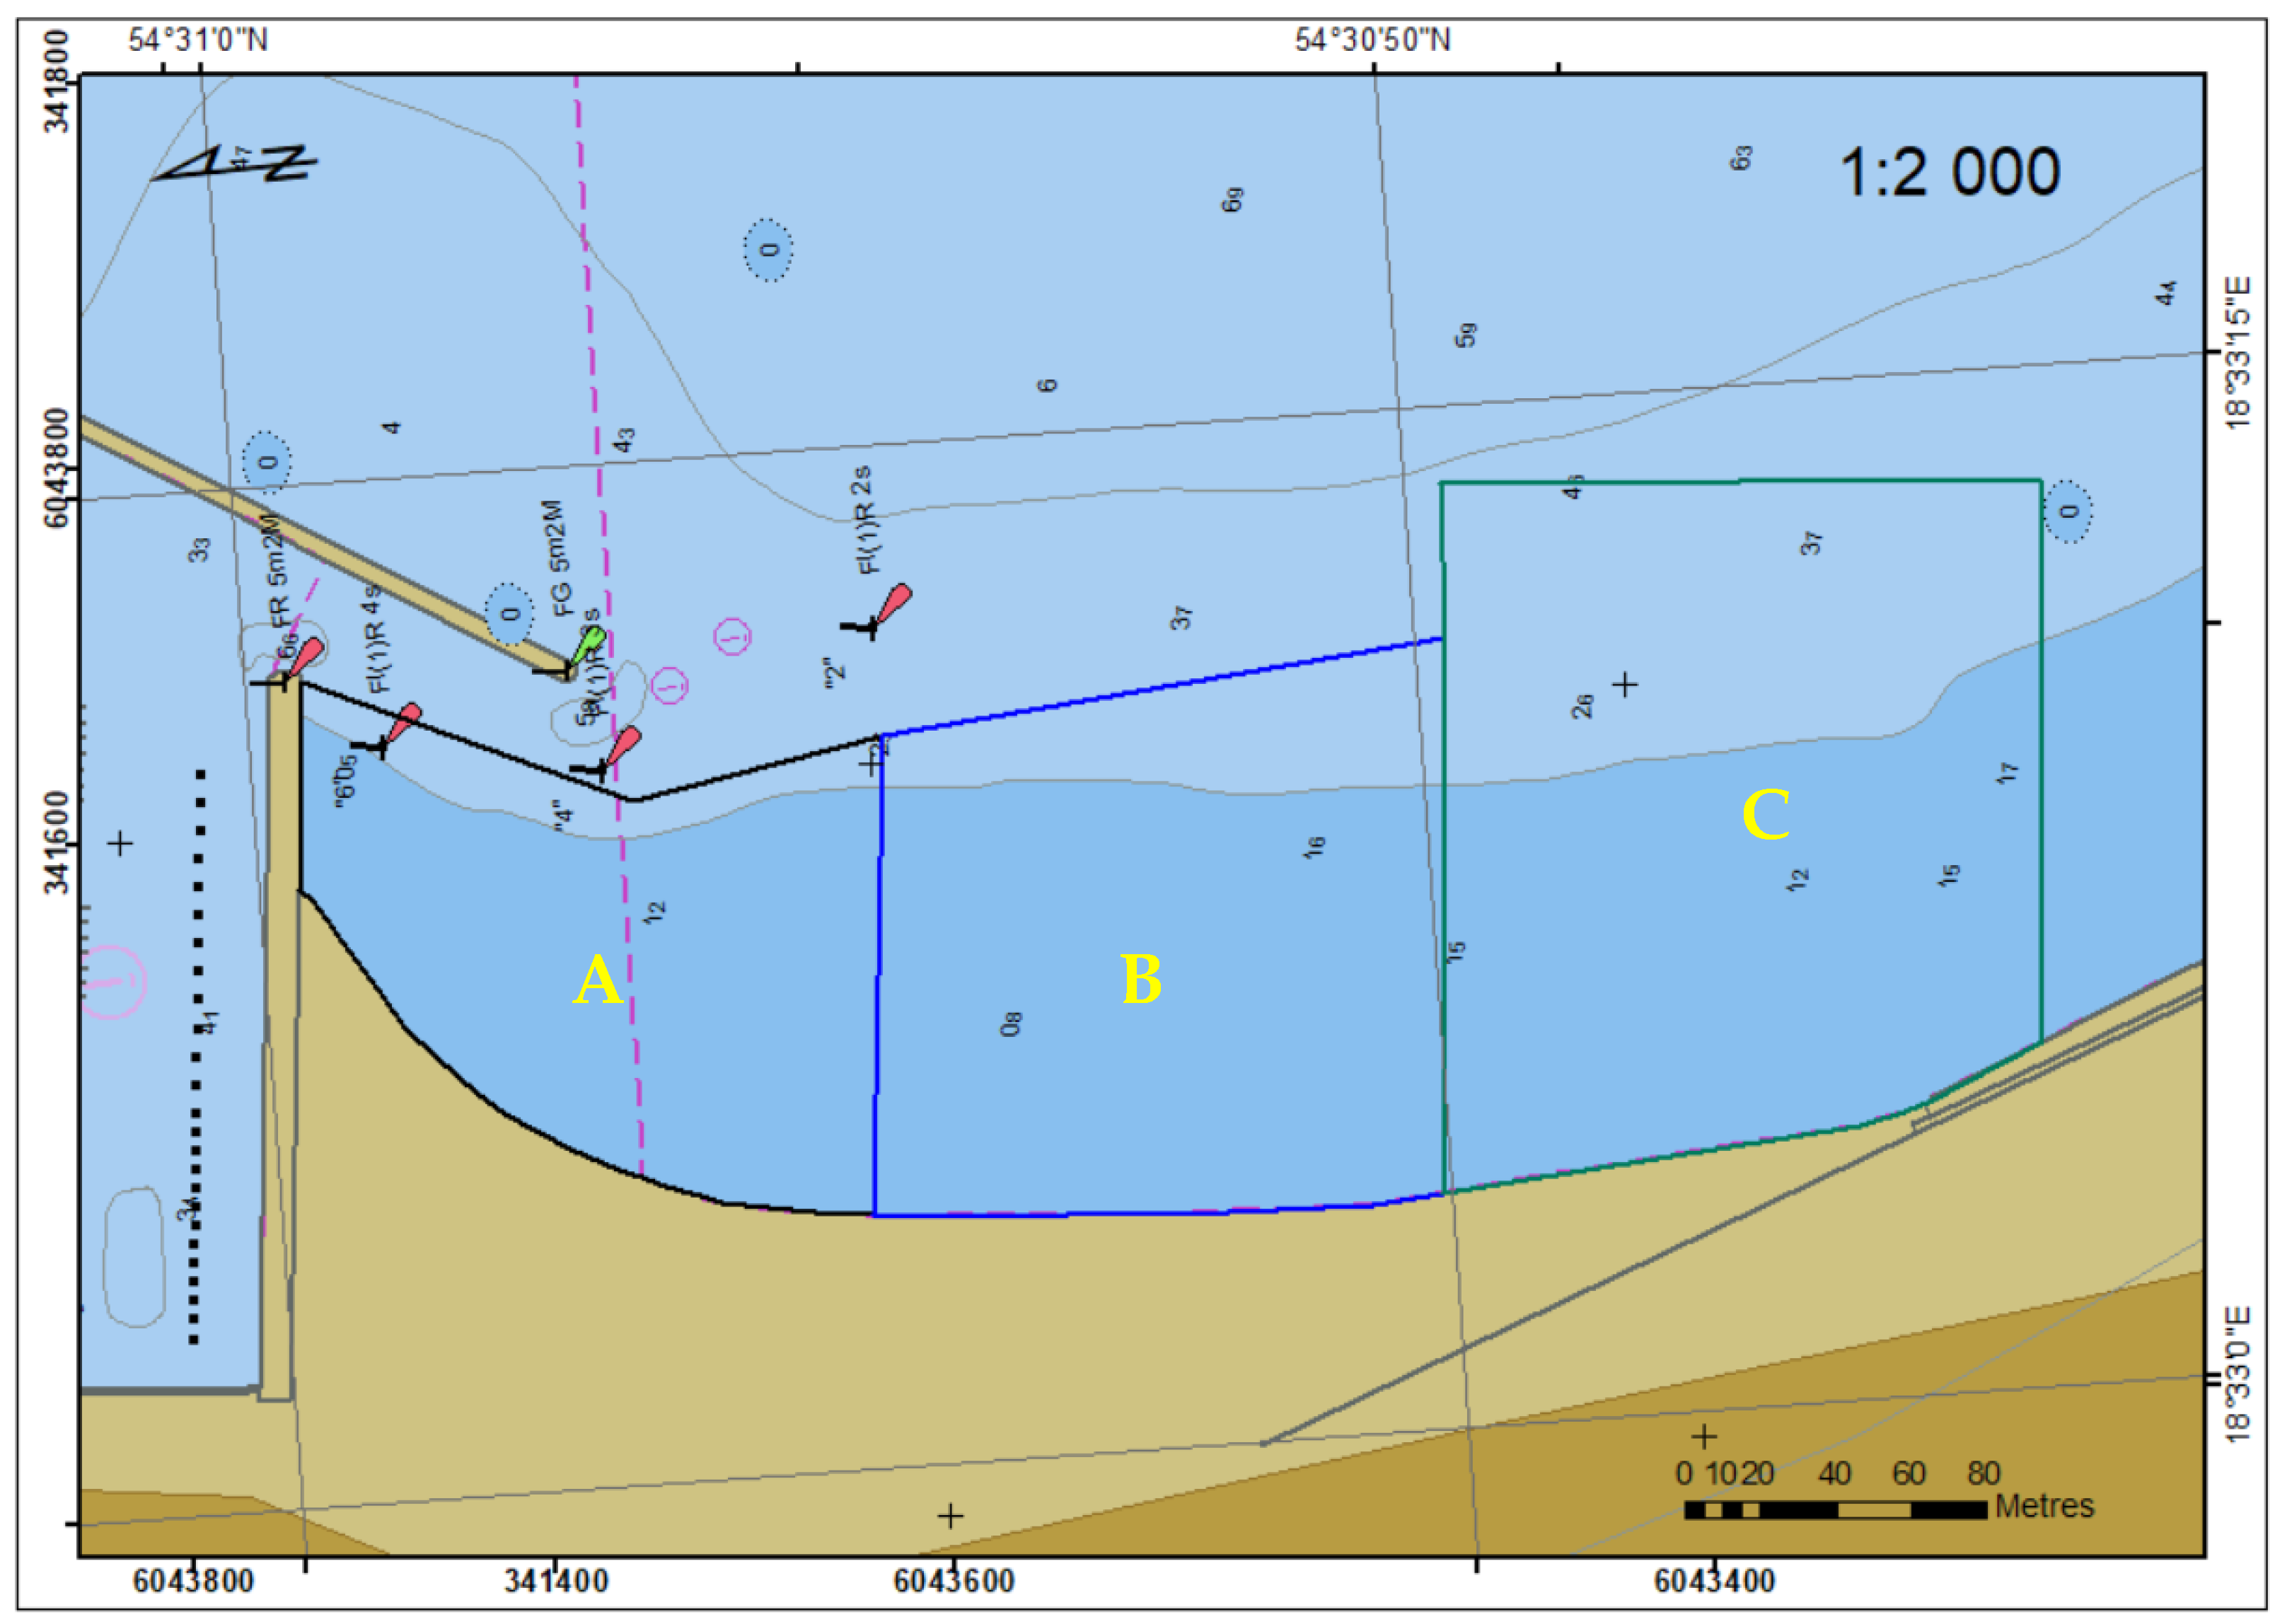
The 450 m long beach was divided into three parts and each of them was surveyed on one day. The survey lines were planned in a parallel arrangement, perpendicular to the contour lines and the coastline, at a distance of 5 m. Their length varied: 75 m in the northern part, close to the fairway to the marina, 100 m in the middle part and 150 m in the southern part, the farthest from the marina (Figure 5).
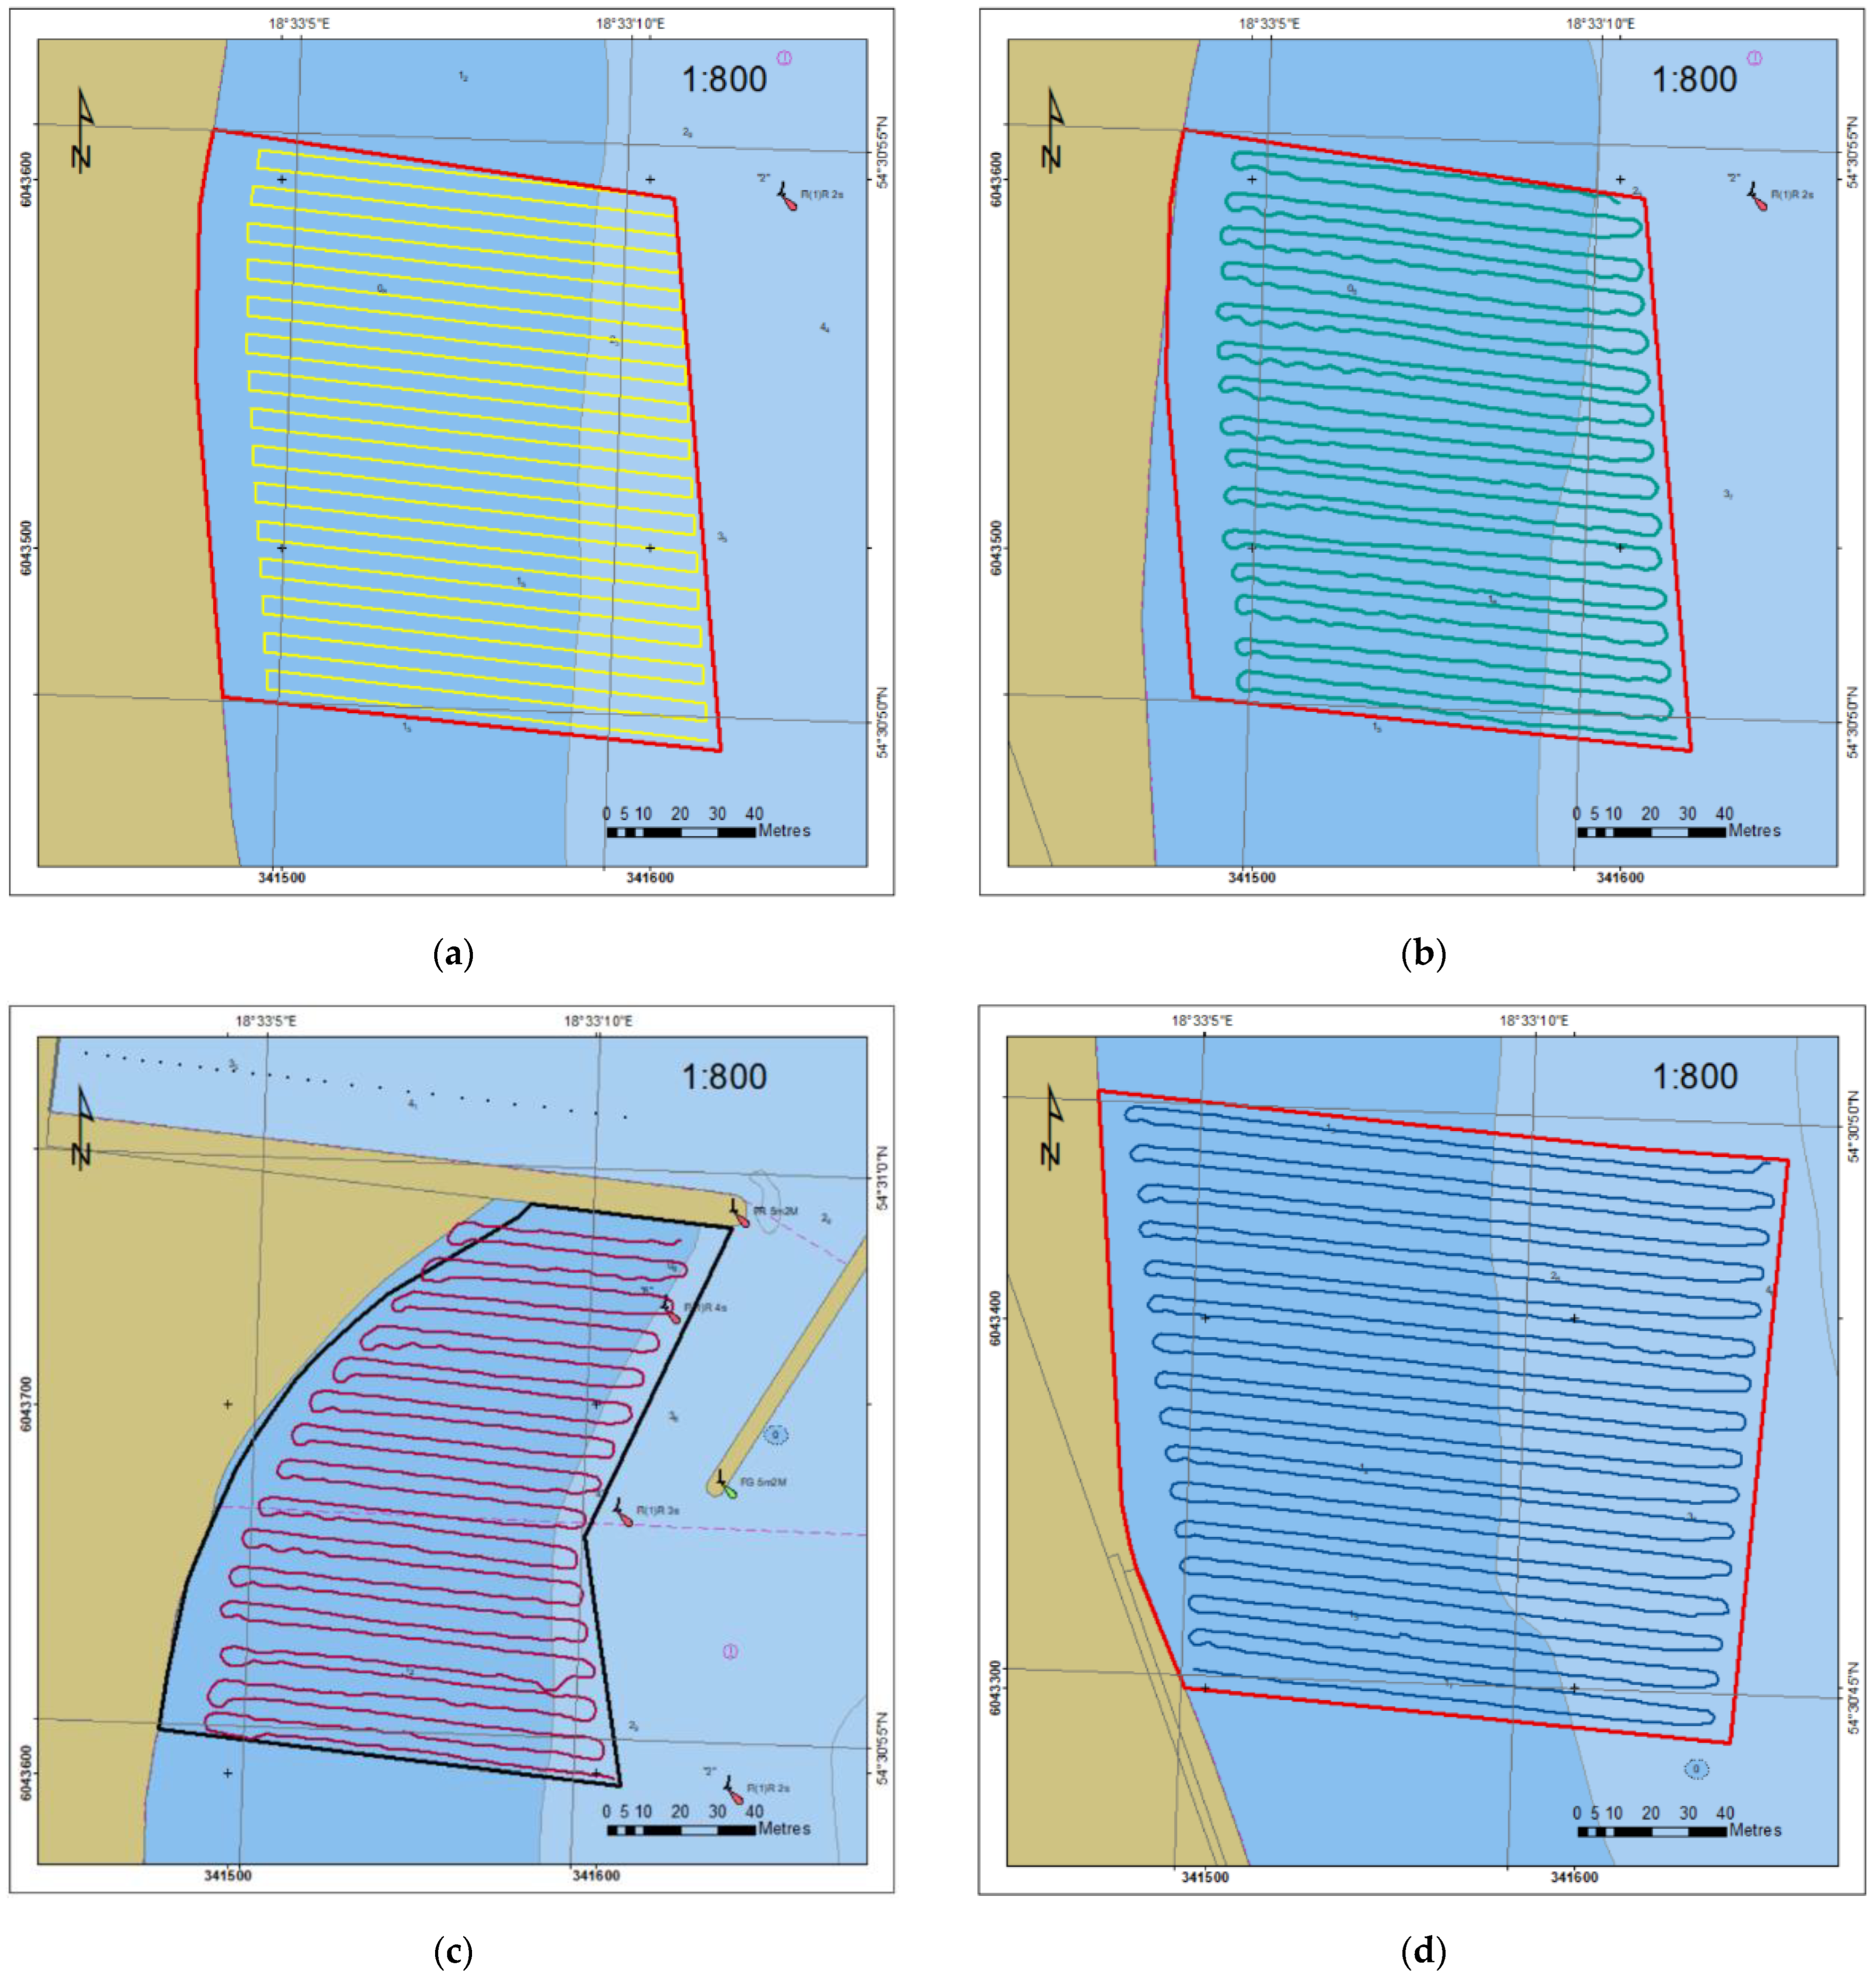
The measurements in the middle part (B) were performed on the first sounding day. The profiles were planned on the basis of the coastline course in the ENC, keeping a 10 m margin—the distance from the coast. Due to the high water level, the profile distance from the temporary coastline was larger. Therefore, it was decided that the surveyed area border would be established by reconnaissance on the second and the third day (the southern (C) and the northern (A) part, respectively). The USV was guided in manual mode from the beach with visual supervision to a depth enabling safe navigation and survey.
Figure 6 presents the trajectory of the USV during bathymetric surveys. The red line limits the area B on the basis on the ENC PL5GDYNA ed. 2018 (a) and ed. 2020 (b). Figure 6c,d present the trajectory in areas A and C, respectively.

3.2. Determination the Sounding Boundary

DSBM was prepared on the basis of the ENC PL5 GDYNA and contour lines were determined in the range of 0–0.5 m with a 5 cm interval. Depths in Mean Sea Level (MSL) vertical datum was related to the tide-gauge located in Kronstadt, according to the National Spatial Reference System [33]. Next, the current water level available from water level station located in Gdynia marina was located online [38,44].
Throughout the four-day period, major fluctuations of the water level in the range of 513–535 cm in local vertical datum were observed. Table 2 presents the water level in the morning, when bathymetric soundings were realised.
For determination of the depth in bathymetric surveys, the actual water level can be referred to the measured depths of the so-called chart datum, which for the PL-KRON86-NH height system, amounted to 508 cm. To do so, the following formula should be used [45,46,47,48]:
d’ = −(d + ΔdED ± ΔdCD)
where d’ is normal height of the point measured by the echo sounder in the PL-KRON86-NH height system (cm), d is depth measured by the echosounder (cm), ΔdET is draft of the echo sounder transducer (cm), ΔdCD is a depth correction referred to in the chart datum in the PL-KRON86-NH height system (cm), which needs to be added where the averaged sea level (dSL) does not exceed 508 cm; otherwise, it needs to be subtracted. The correction ΔdCD, which is determined based on the following equation, requires additional explanation:
ΔdCD = 508 cm − dSL
where dSL is averaged sea level observed on a tide gauge between consecutive full hours in the PL-KRON86-NH height system (cm).
To determine the current safety contour, the corrected depth should be reduced to the current sea level. When water is high, the safety contour will move towards the coast. When water is low, the sounding area boundaries recede from the coast. At the sea level higher than the security isobaths, the bathymetric soundings will be realised in the area marked in the ENC as a land area. Therefore, it is necessary to choose arbitrarily one of the two solutions: either to reduce the sounding area to the coastline on the basis of ENC or to make reconnaissance.
For determination of the safe contour, on the basis of the water level in the beginning the working (sounding) day, depth corrections should be taken into consideration as presented in Table 3. The depth clearance (20 cm) limits the contour line determining the sounding boundary in coastal area.
In high water levels, the sounding area can be limited up to the coastline or by bathymetric reconnaissance. In low water levels, the boundary will be further from the coastline. Please note that the determined contour line is the shallower point that the USV can take place. It can be a bow or a side. The area of sounding has to be additionally limited by the distance between a GNSS receiver antenna and a bow, taking into consideration USV manoeuvering parameters.
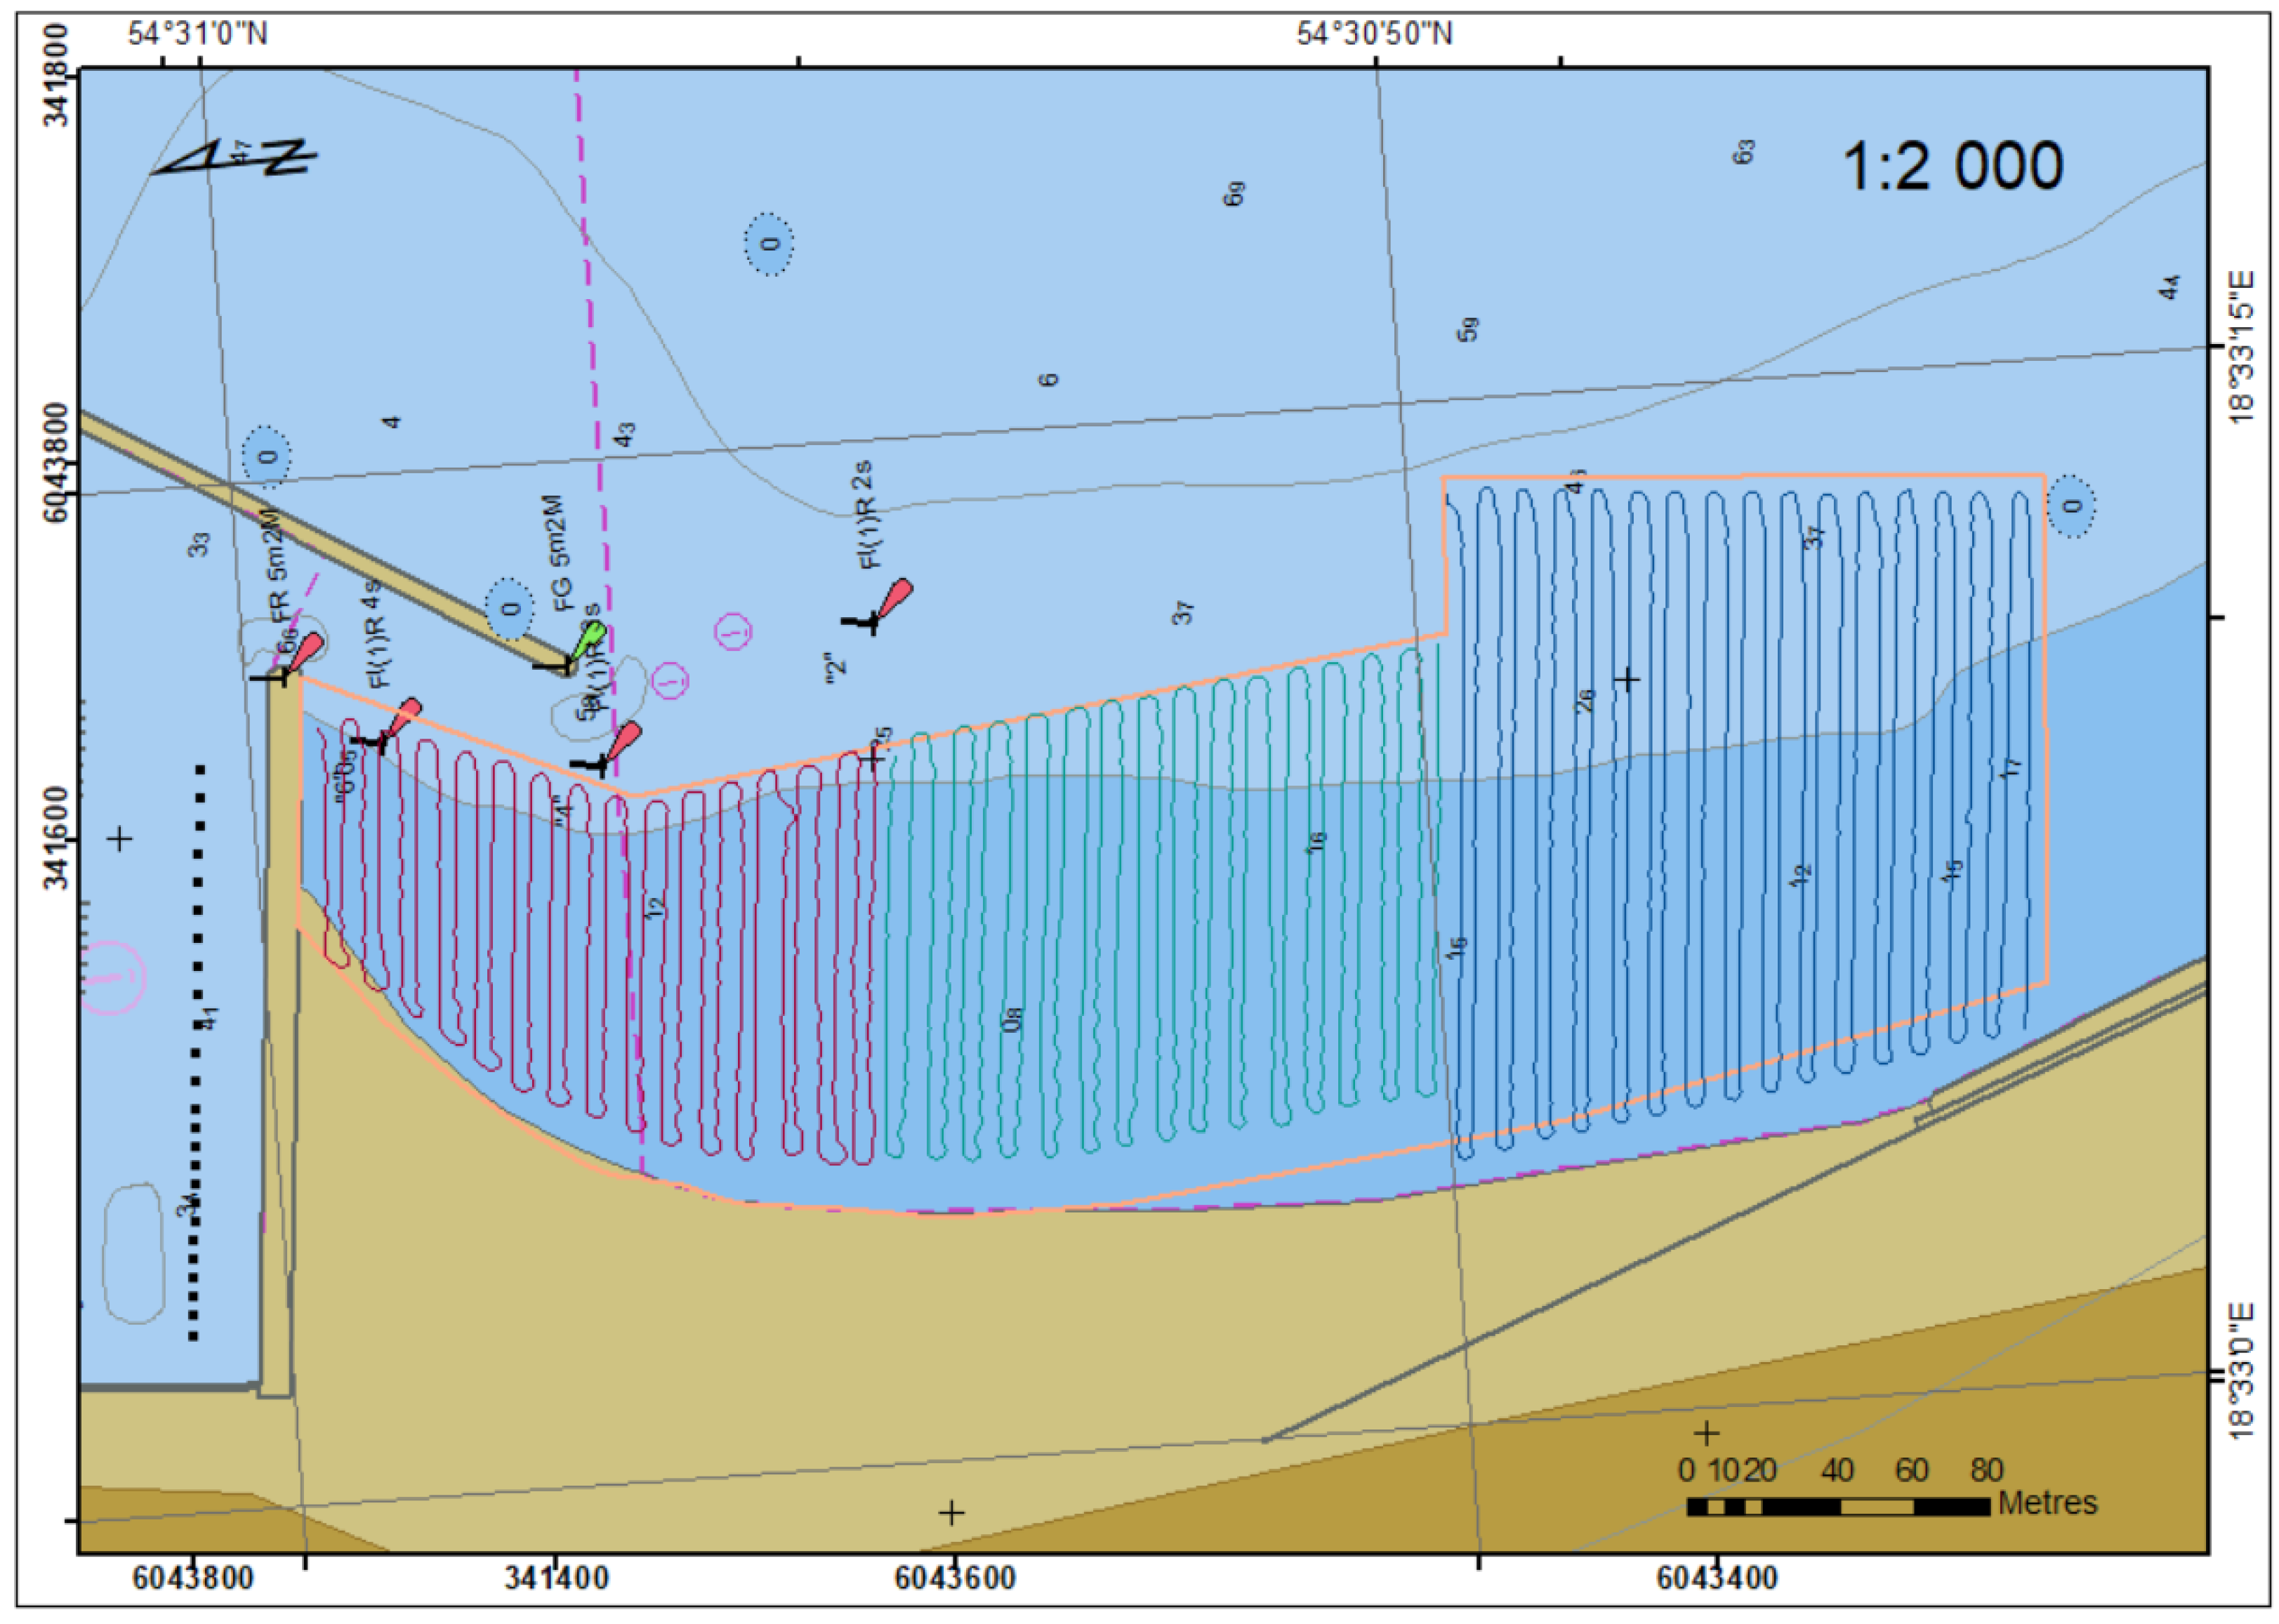
Complete trajectory of the USV is shown in Figure 7.
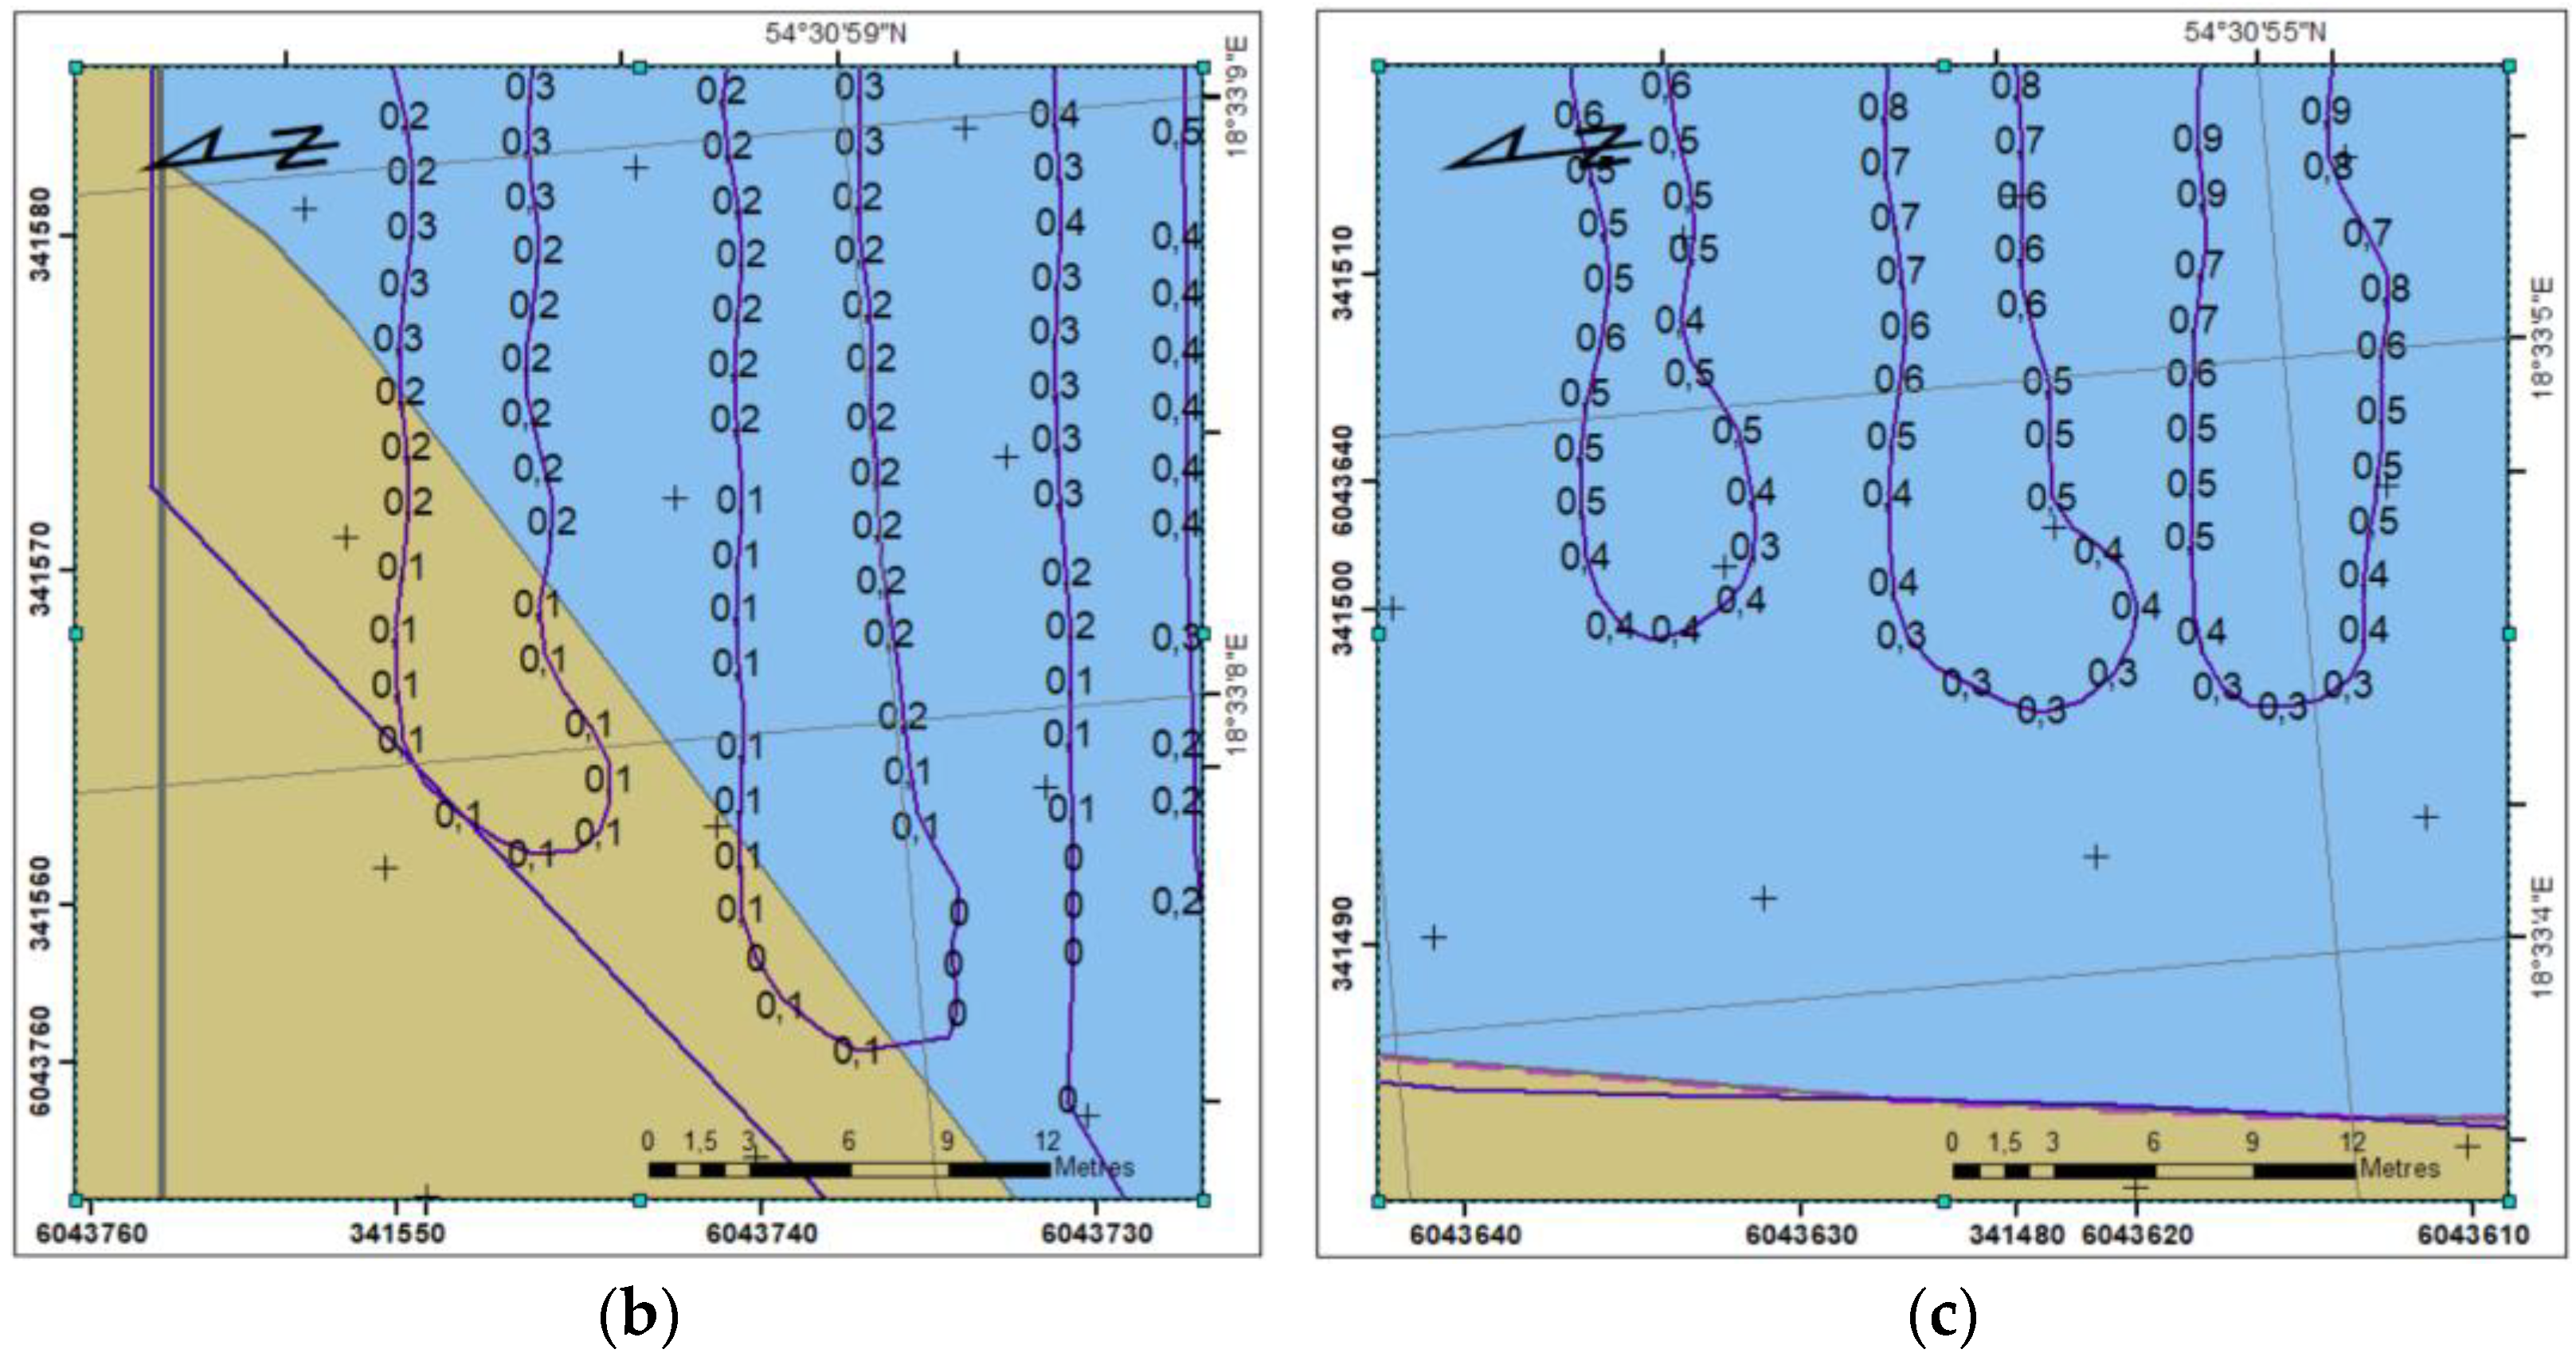
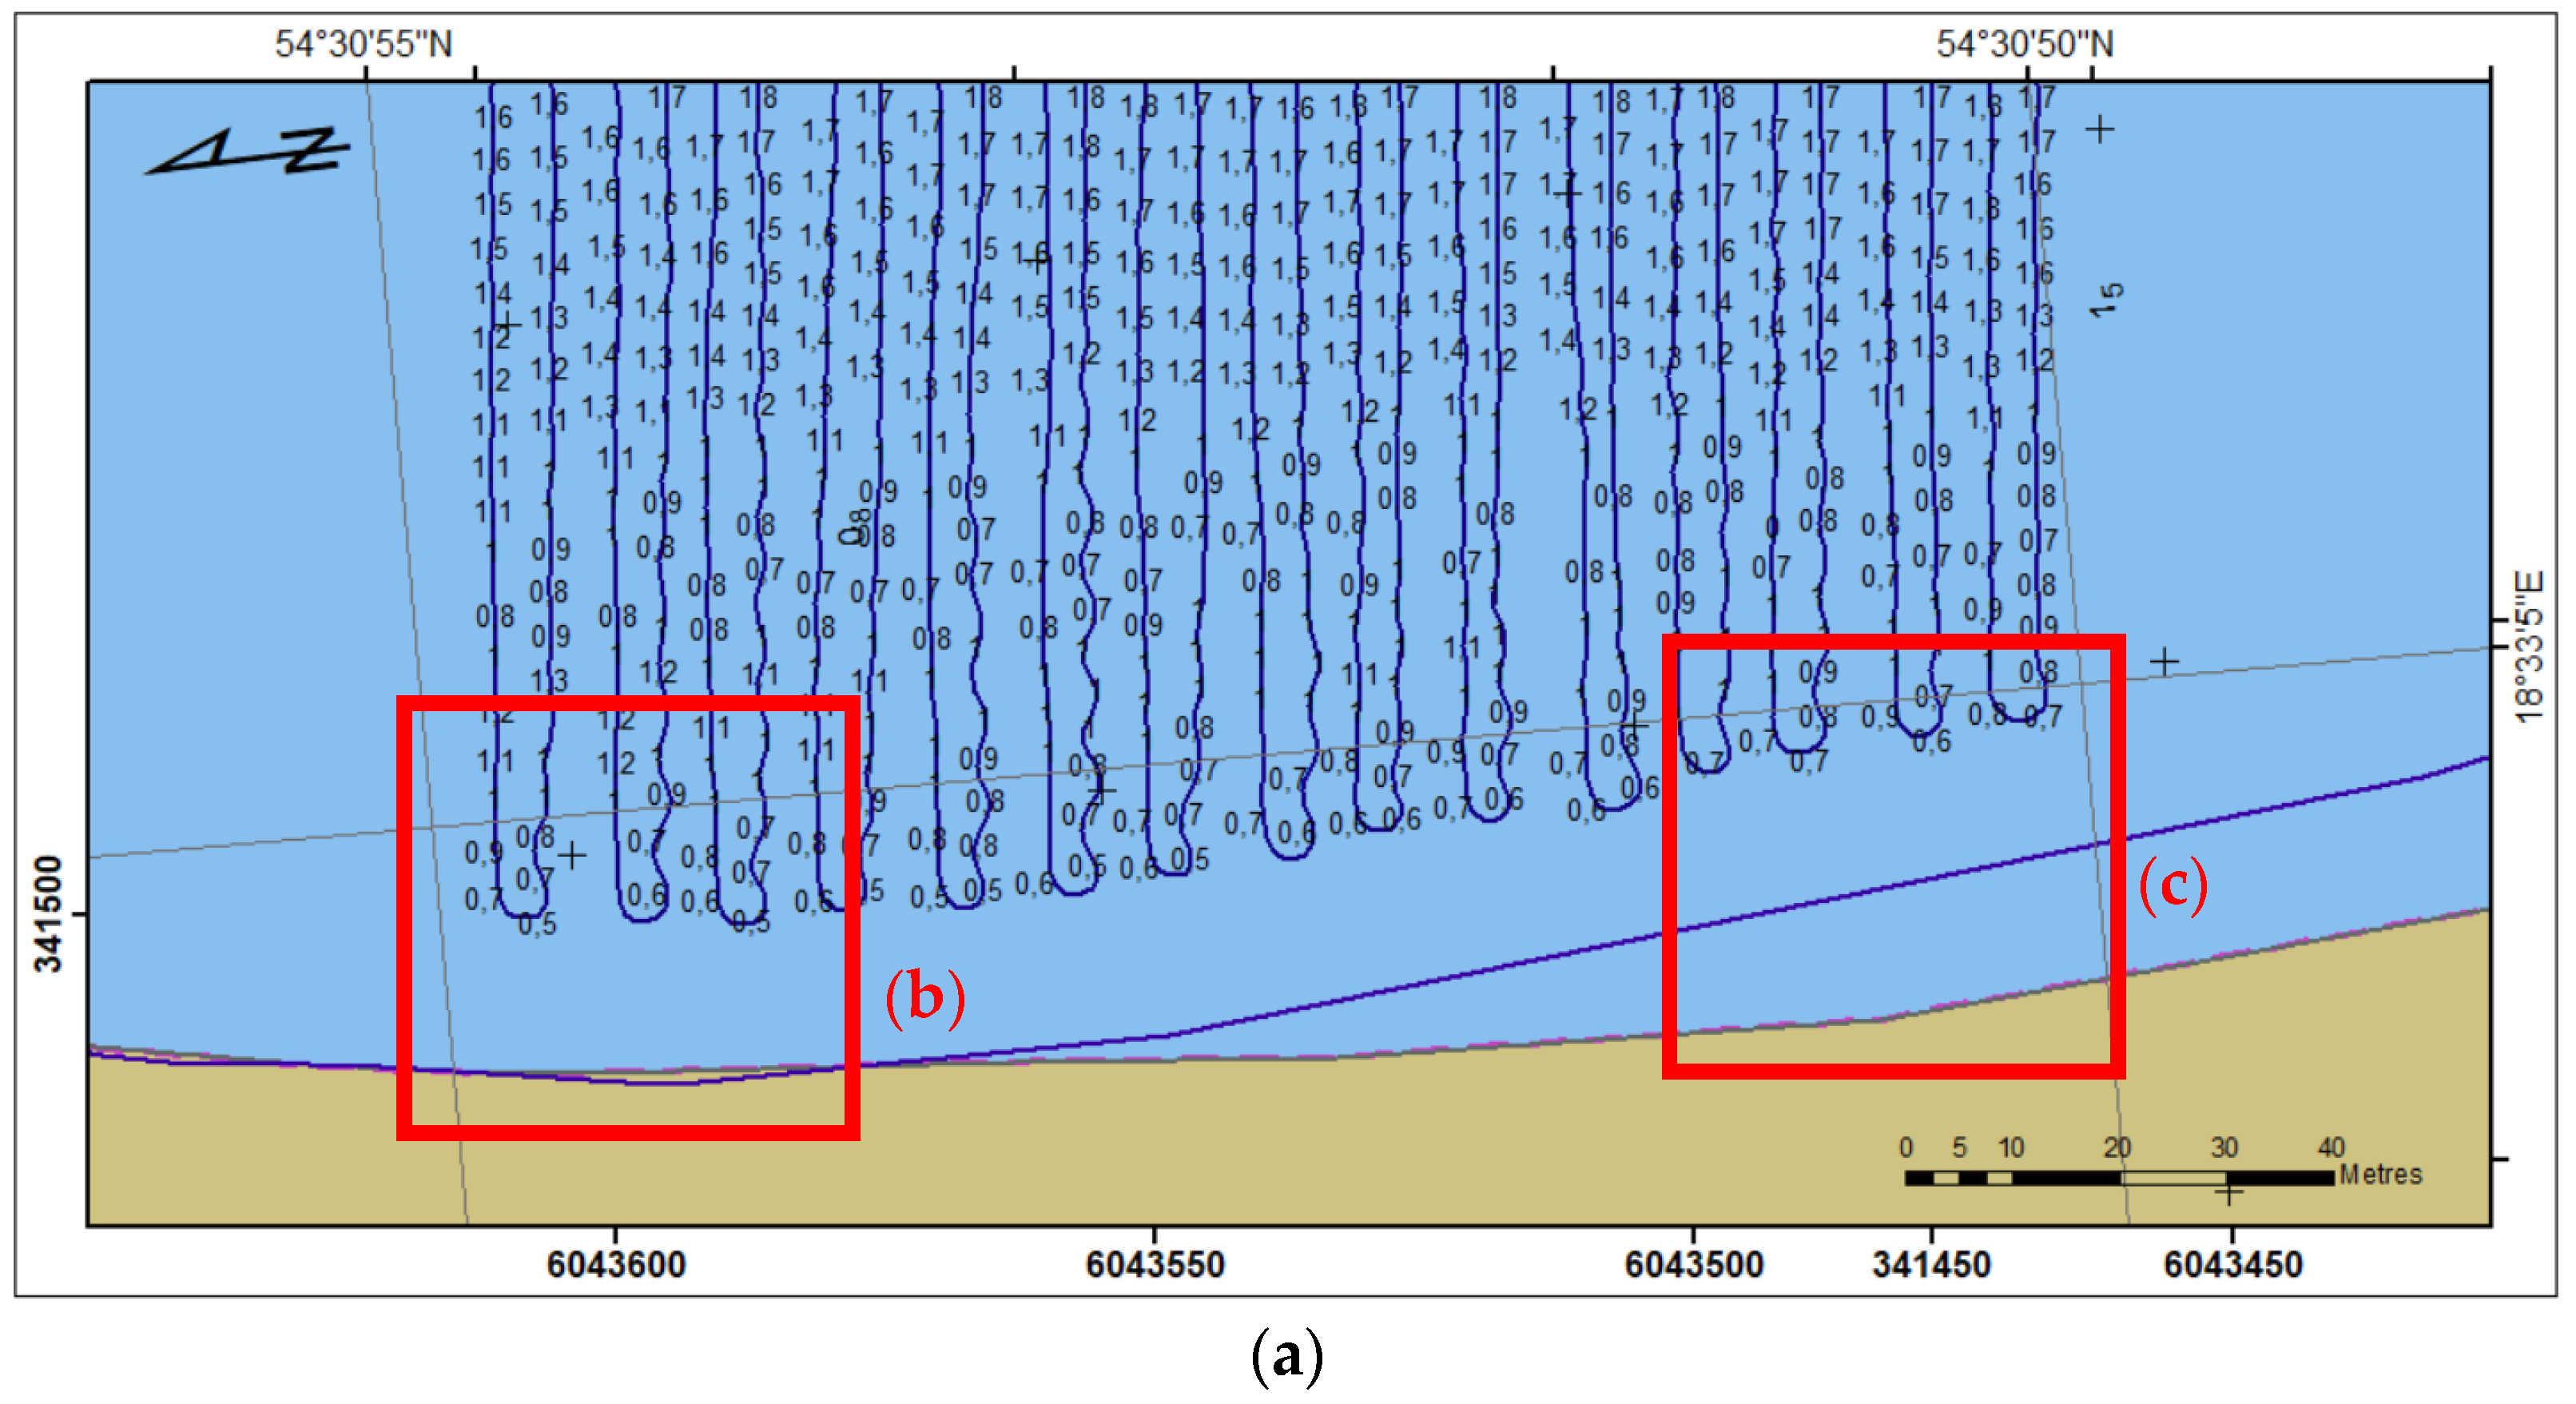
Below (Figure 8) shows sounded region A with USV trajectory, and measured depth. Although the trajectory is on land area (b), in current water level, coastal changes and bathymetric reconnaissance, soundings were as close to the coastline as it was possible. Taking into consideration seabed fluctuations, at the end of the area (c) distance to the coast is 12 m.
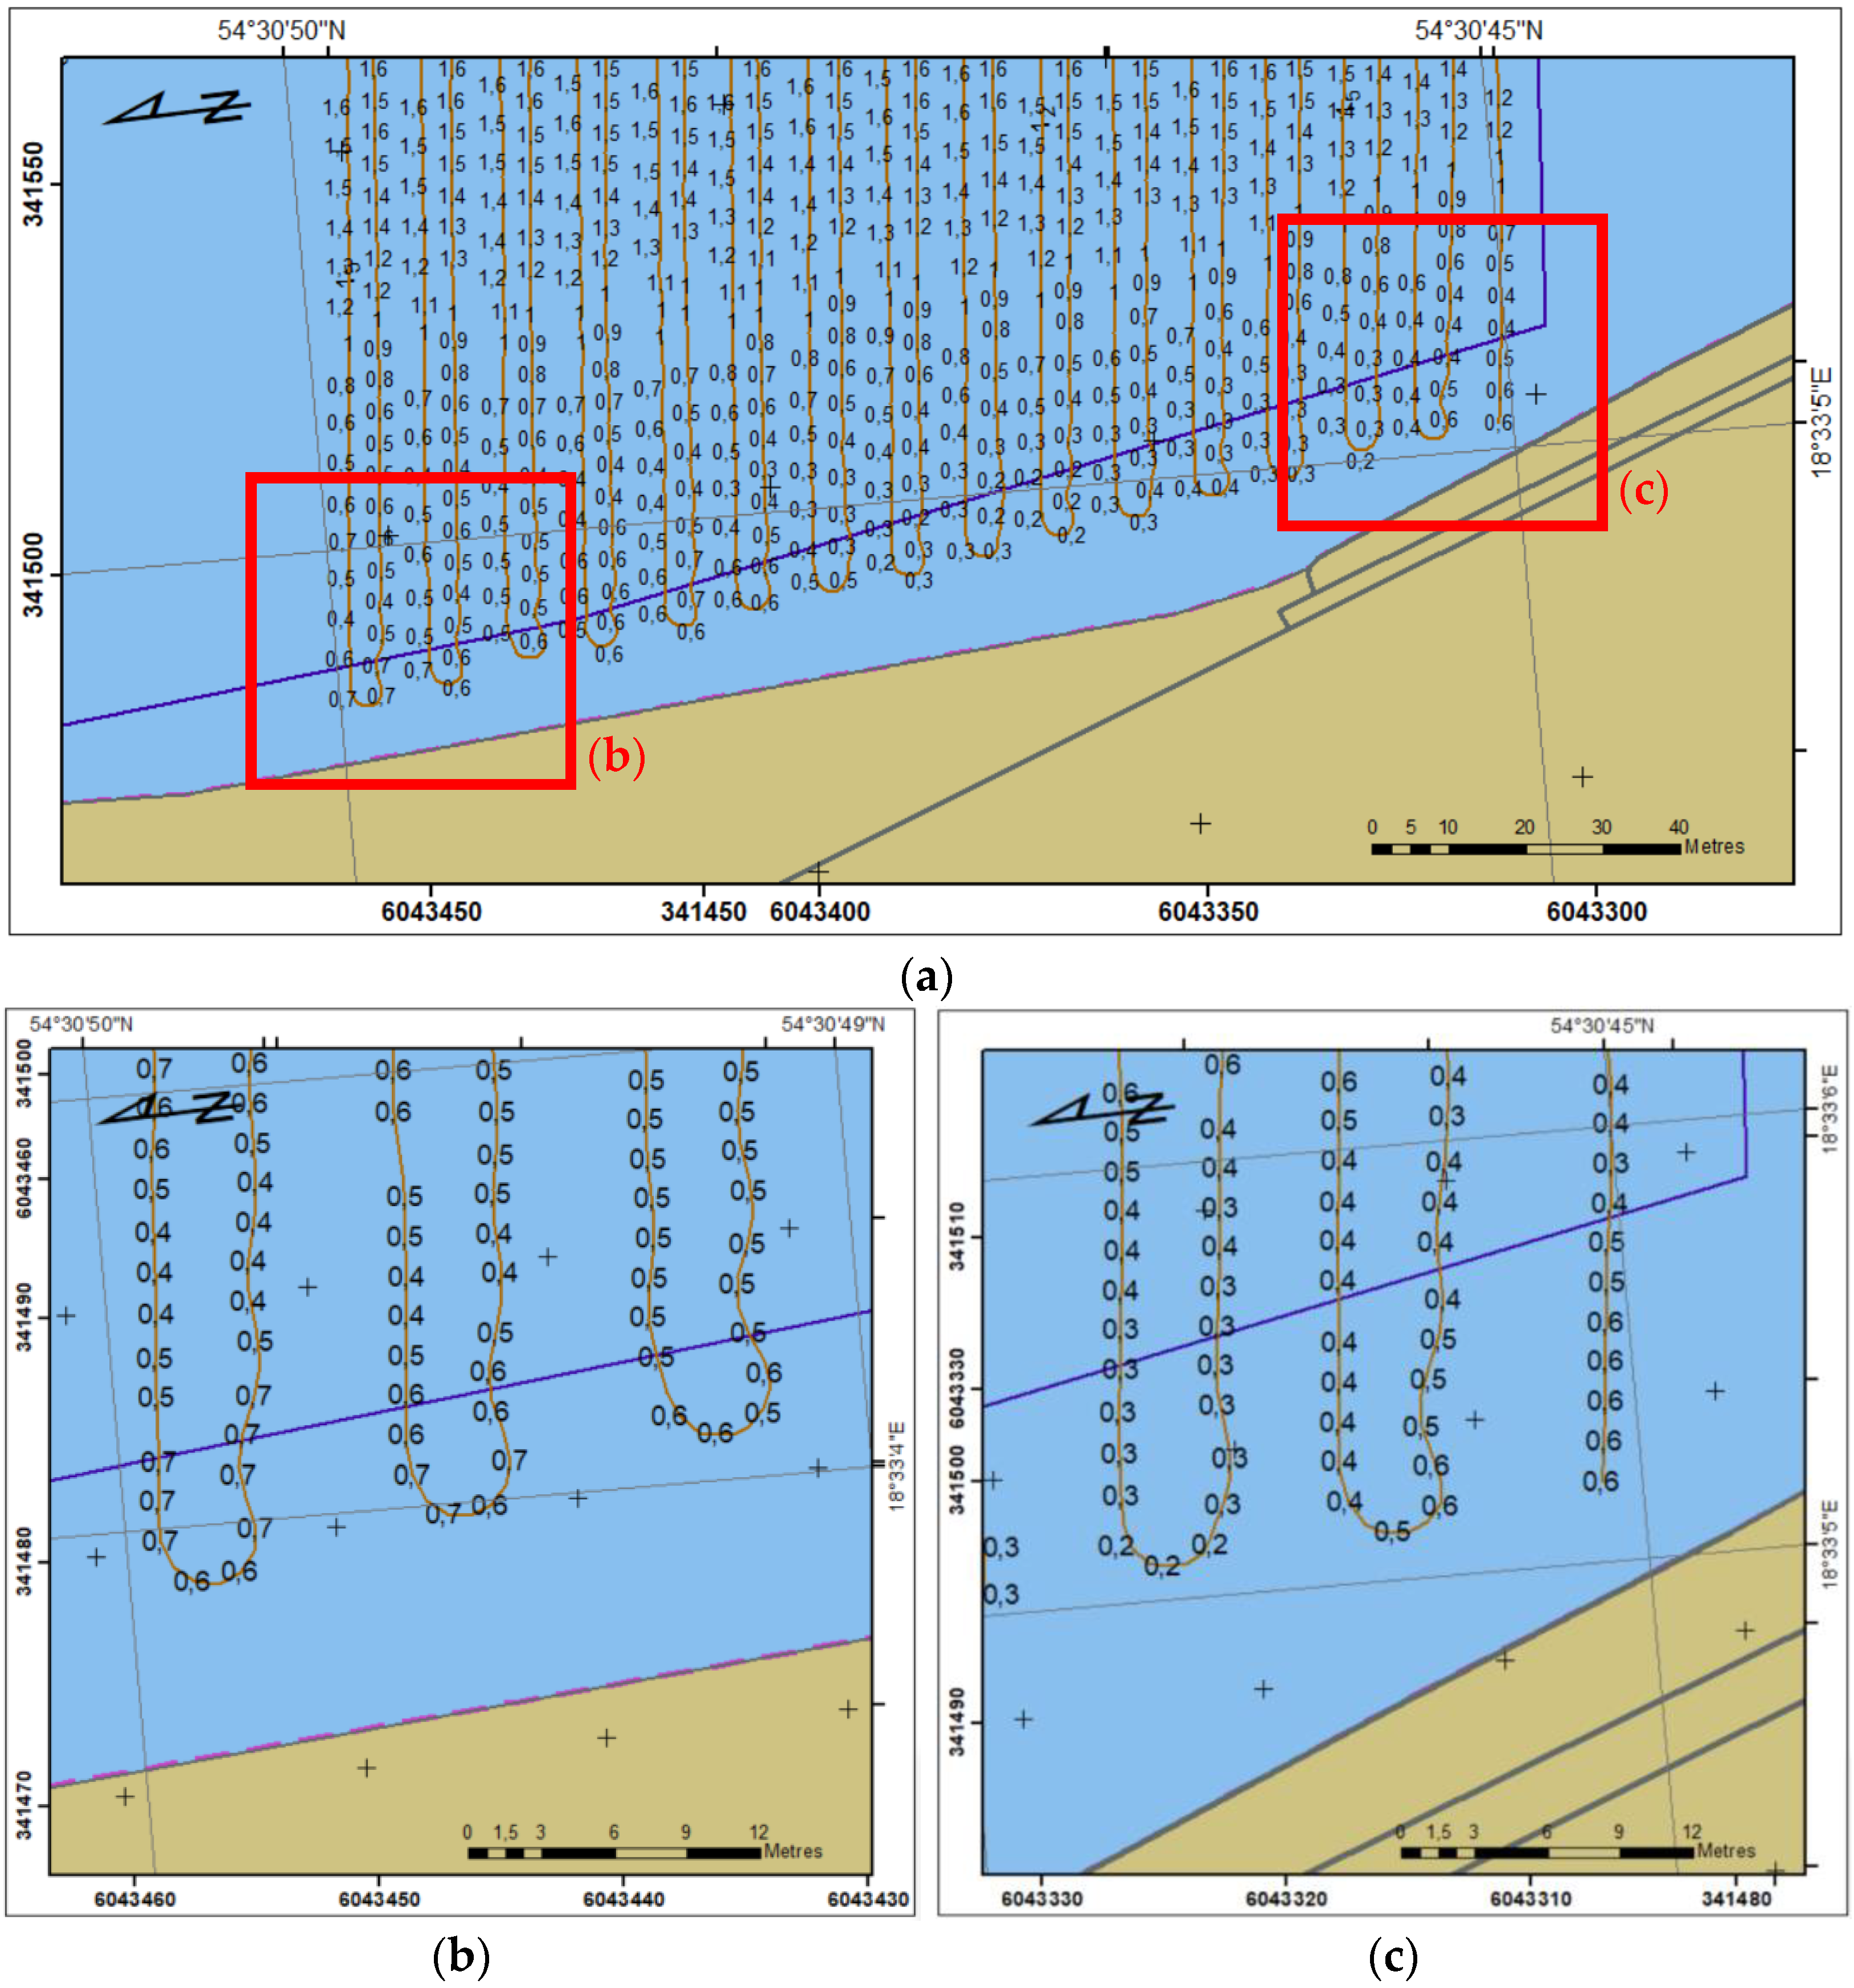
Figure 9 and Figure 10 present sounding regions B and c, respectively, with land area based on ENC edited in 2018 and sounding area limited by coastline based on ENC edited in 2021. The distance between the sounding area and coastline is a result of shallows (Figure 9) and stones (Figure 10) on the bottom.

4. Conclusions

Planning bathymetric surveys consists of several factors, e.g., economic, logistical and hydrometeorological. The method of measurement performance is determined by the availability of technical measures, which include a vessel and an echosounder. A USV equipped with an SBES makes it possible to perform measurements in an inshore area up to a very small depth, while ensuring the vessel’s navigational safety. The measurement is quick, especially a measurement performed in automatic navigation mode.
It was assumed that the survey profiles in the inshore area would be planned with the use of the ENC; therefore, such a cell must be developed for the area. The method presented in the paper is useful in a region where regular bathymetric measurements required for the basin are performed. Regular measurements are also performed in basins where the seafloor relief is varied, e.g., in ones with a tombolo. Measurements are usually performed twice: before the dredging work, to determine the volume of the bottoms for dredging, and after the work completion.
The use of a USV, guided along the planned profiles in the automatic navigation mode, enables the quick performance of the survey. One should note the coastline diversity, which results from geomorphological changes and the water level. With access to hydrological data, especially the eco-hydrodynamic model, a water level forecast performing the measurements at a high water level will help to acquire geospatial data as close to the coastline as possible.

Funding

This research received no external funding.

Institutional Review Board Statement

Not applicable.

Informed Consent Statement

Not applicable.

Data Availability Statement

Not applicable.

Conflicts of Interest

The author declares no conflict of interest.

References

  1. Stateczny, A.; Grońska, D.; Motyl, W. Hydrodron—New step for professional hydrography for restricted waters. In Proceedings of the 2018 Baltic Geodetic Congress, Olsztyn, Poland, 21–23 June 2018. [Google Scholar]
  2. Specht, C.; Świtalski, E.; Specht, M. Application of an autonomous/unmanned survey vessel (ASV/USV) in bathymetric measurements. Pol. Marit. Res. 2017, 24, 36–44. [Google Scholar] [CrossRef]
  3. Tanakitkorn, K. A review of unmanned surface vehicle development. Marit. Tech. Res. 2019, 1, 2–8. [Google Scholar] [CrossRef]
  4. Strickland, J.; Devine, T. Unmanned Surface Vehicles: Realizations & Applications. In Proceedings of the 11th Symposium on High Speed Marine Vehicles, Naples, FL, USA, 25–26 October 2017. [Google Scholar]
  5. Popielarczyk, D.; Marschalko, M.; Templin, T.; Niemiec, D.; Yilmaz, I.; Matuszková, B. Bathymetric Monitoring of Alluvial River Bottom Changes for Purposes of Stability of Water Power Plant Structure with a New Methodology for River Bottom Hazard Mapping (Wloclawek, Poland). Sensors 2020, 20, 5004. [Google Scholar] [CrossRef]
  6. Popielarczyk, D.; Templin, T.; Łopata, M. Using the geodetic and hydroacoustic measurements to investigate the bathymetric and morphometric parameters of Lake Hancza (Poland). Open Geosci. 2015, 7, 854–869. [Google Scholar] [CrossRef]
  7. Popielarczyk, D.; Templin, T. Application of Integrated GNSS/Hydroacoustic Measurements and GIS Geodatabase Models for Bottom Analysis of Lake Hancza. Pure Appl. Geophys. 2014, 171, 997–1011. [Google Scholar] [CrossRef]
  8. Nikishin, V.; Durmanov, M.; Skorik, I. Autonomous Unmanned Surface Vehicle for Water Surface Monitoring. TransNav Int. J. Mar. Nav. Saf. Sea Tran. 2020, 14, 853–858. [Google Scholar] [CrossRef]
  9. Jin, J.; Zhang, J.; Shao, F.; Lyu, Z.; Wang, D. A novel ocean bathymetry technology based on an unmanned surface vehicle. Acta Oceanol. Sin. 2018, 37, 99–106. [Google Scholar] [CrossRef]
  10. Zhang, S.; Ran, W.; Liu, G.; Li, Y.; Xu, Y. A Multi-Agent-Based Defense System Design for Multiple Unmanned Surface Vehicles. Electronics 2022, 11, 2797. [Google Scholar] [CrossRef]
  11. Marchel, Ł.; Specht, C.; Specht, M. Assessment of the Steering Precision of a Hydrographic USV along Sounding Profiles Using a High-Precision GNSS RTK Receiver Supported Autopilot. Energies 2020, 13, 5637. [Google Scholar] [CrossRef]
  12. Stateczny, A.; Burdziakowski, P.; Najdecka, K.; Domagalska-Stateczna, B. Accuracy of Trajectory Tracking Based on Nonlinear Guidance Logic for Hydrographic Unmanned Surface Vessels. Sensors 2020, 20, 832. [Google Scholar] [CrossRef]
  13. Specht, C.; Makar, A.; Specht, M. Availability of the GNSS geodetic networks position during the hydrographic surveys in the ports. TransNav Int. J. Mar. Navig. Saf. Sea Transp. 2018, 12, 657–661. [Google Scholar] [CrossRef]
  14. Jang, W.S.; Park, H.S.; Seo, K.Y.; Kim, Y.K. Analysis of positioning accuracy using multi differential GNSS in coast and port area of South Korea. J. Coast. Res. 2016, 75, 1337–1341. [Google Scholar] [CrossRef]
  15. Makar, A. Dynamic Tests of ASG-EUPOS Receiver in Hydrographic Application. In Proceedings of the 18th International Multidisciplinary Scientific GeoConference SGEM, Albena, Bulgaria, 30 June–9 July 2018; Volume 18, pp. 743–750. [Google Scholar]
  16. International Hydrographic Organization. Special Publication S-44, Standards for Hydrographic Surveys, 6th ed.; International Hydrographic Organization: Monaco, 2019. [Google Scholar]
  17. Canadian Hydrographic Service. Standards for Hydrographic Surveys, 2nd ed.; International Hydrographic Organization: Ottawa, ON, Canada, 2013. [Google Scholar]
  18. Ministry of Defence of the Republic of Poland. Act of 28 March 2018 on the Minimum Standards for Hydrographic Surveys; Ministry of Defence of the Republic of Poland: Warsaw, Poland, 2018. [Google Scholar]
  19. Specht, M. Method of evaluating the positioning system capability for complying with the minimum accuracy requirements for the international hydrographic organization orders. Sensors 2019, 19, 3860. [Google Scholar] [CrossRef] [PubMed]
  20. Hydrographic Office of the Polish Navy. Maritime Hydrography—Rules of Data Collecting and Results Presentation; Hydrographic Office of the Polish Navy: Gdynia, Poland, 2009.
  21. International Federation of Surveyors (FIG). Guidelines for the Planning, Execution and Management of Hydrographic Surveys in Ports and Harbours; FIG Publication No 56; International Federation of Surveyors (FIG): Copenhagen, Denmark, 2010. [Google Scholar]
  22. New Zealand Government. Good Practice Guidelines for Hydrographic Surveys in New Zealand Ports and Harbours; New Zealand Government: Wellington, New Zealand, 2020. [Google Scholar]
  23. Specht, M.; Specht, C.; Szafran, M.; Makar, A.; Dąbrowski, P.; Lasota, H.; Cywiński, P. The Use of USV to Develop Navigational and Bathymetric Charts of Yacht Ports on the Example of National Sailing Centre in Gdańsk. Remote Sens. 2020, 12, 2585. [Google Scholar] [CrossRef]
  24. Makar, A.; Specht, C.; Specht, M.; Dąbrowski, P.; Szafran, M. Integrated Geodetic and Hydrographic Measurements of the Yacht Port for Nautical Charts and Dynamic Spatial Presentation. Geosciences 2020, 10, 203. [Google Scholar] [CrossRef]
  25. Makar, A. Determination of the Minimum Safe Distance between a USV and a Hydro-Engineering Structure in a Restricted Water Region Sounding. Energies 2022, 15, 2441. [Google Scholar] [CrossRef]
  26. International Hydrographic Organization. Specifications for Chart Content and Display Aspects of ECDIS, 6.1(.1) ed.; International Hydrographic Organization: Monaco, 2014. [Google Scholar]
  27. Hydrographic Office of the Polish Navy. The Guidebook in Terms of Marks and Symbols Used in ENC and ECDIS; Publication No 540; Hydrographic Office of the Polish Navy: Gdynia, Poland, 2020. (In Polish) [Google Scholar]
  28. Rutkowski, G. ECDIS Limitations, Data Reliability, Alarm Management and Safety Settings Recommended for Passage Planning and Route Monitoring on VLCC Tankers. TransNav Int. J. Mar. Navig. Saf. Sea Transp. 2018, 12, 483–490. [Google Scholar] [CrossRef]
  29. Rutkowski, G. Determining the Best Possible Speed of the Ship in Shallow Waters Estimated Based on the Adopted Model for Calculation of the Ship’s Domain Depth. Pol. Marit. Res. 2020, 27, 140–148. [Google Scholar] [CrossRef]
  30. Novaselic, M.; Mohović, R.; Baric, M.; Grbić, L. Wind Influence on Ship Manoeuvrability—A Turning Circle Analysis. TransNav Int. J. Mar. Navig. Saf. Sea Transp. 2021, 15, 47. [Google Scholar] [CrossRef]
  31. Cui, J.; Wu, Z.; Chen, W. Research on Prediction of Ship Manoeuvrability. J. Shipp. Ocean. Eng. 2018, 8. [Google Scholar] [CrossRef]
  32. Burdziakowski, P.; Stateczny, A. Universal Autonomous Control and Management System for Multipurpose Unmanned Surface Vessel. Pol. Mar. Res. 2019, 26, 30–39. [Google Scholar] [CrossRef]
  33. Council of Ministers of the Republic of Poland. Ordinance of the Council of Ministers of 15 October 2012 on the National Spatial Reference System; Council of Ministers of the Republic of Poland: Warsaw, Poland, 2012. (In Polish)
  34. Medvedev, I.P.; Rabinovich, A.B.; Kulikov, E.A. Tidal oscillations in the Baltic Sea. Oceanology 2013, 53, 526–538. [Google Scholar] [CrossRef]
  35. Merrifield, M.; Aarup, T.; Allen, A.; Aman, A.; Caldwell, P.; Bradshaw, E.; Fernandes, R.M.S.; Hayashibara, H.; Hernandez, F.; Kilonsky, B.; et al. The Global Sea Level Observing System (GLOSS). In Proceedings of the OceanObs’09: Sustained Ocean Observations and Information for Society, Venice, Italy, 21–25 September 2009; Hall, J., Harrison, D.E., Stammer, D., Eds.; ESA Publication: Auckland, New Zealand; Volume 2. [Google Scholar]
  36. Bradshaw, E.; Rickards, L.; Aarup, T. Sea level data archaeology and the Global Sea Level Observing System (GLOSS). GeoResJ 2015, 6, 9–16. [Google Scholar] [CrossRef]
  37. Boski, T.; Wilamowski, A. Sea level changes—Causes, time scales and the history of their recognition. Prz. Geol. 2020, 68, 820–823. [Google Scholar]
  38. Ecohydrodynamic Model. Available online: http://model.ocean.univ.gda.pl/php/frame.php?area=ZatokaGdanska (accessed on 15 June 2022).
  39. Ołdakowski, B.; Kowalewski, M.; Jędrasik, J.; Szymelfenig, M. Ecohydrodynamic Model of the Baltic Sea, Part I: Description of the ProDeMo model. Oceanologia 2005, 47, 477–516. [Google Scholar]
  40. Kowalewska-Kalkowska, H.; Kowalewski, M.; Wiśniewski, B. The forecasting of hydrodynamic conditions in the Odra River mouth using hydrodynamic model of the Baltic Sea (M3D_UG). Pol. J. Env. St. 2007, 16, 26–31. [Google Scholar]
  41. Kowalewska-Kalkowska, H.; Kowalewski, M. Observations and modelling of extreme sea level events in the coastal waters of the Pomeranian Bay. In Proceedings of the Storm Surges Congress, Hamburg, Germany, 13–17 September 2010. [Google Scholar]
  42. Rogowski, J.B.; Galas, R.; Kłęk, M. Determination of Seabed Heights in the Area of Polish Territorial Waters in the Official Reference System. TransNav Int. J. Mar. Navig. Saf. Sea Transp. 2020, 14, 339–342. [Google Scholar] [CrossRef]
  43. Popielarczyk, D. RTK Water Level Determination in Precise Inland Bathymetric Measurements. In Proceedings of the 25th International Technical Meeting of the Satellite Division of the Institute of Navigation (ION GNSS 2012), Nashville, TN, USA, 17–21 September 2012; pp. 1158–1163. [Google Scholar]
  44. Hydrological Stations. Gdynia (154180120). Available online: https://hydro.imgw.pl/#station/hydro/154180120 (accessed on 15 June 2022).
  45. Makar, A. Determination of USV’s Direction Using Satellite and Fluxgate Compasses and GNSS-RTK. Sensors 2022, 22, 7895. [Google Scholar] [CrossRef]
  46. Makar, A. Limitations of Multi-GNSS Positioning of USV in Area with High Harbour Infrastructure. Electronics 2023, 12, 697. [Google Scholar] [CrossRef]
  47. Specht, M.; Specht, C.; Stateczny, A.; Marchel, Ł.; Lewicka, O.; Paliszewska-Mojsiuk, M.; Wiśniewska, M. Determining the Seasonal Variability of the Territorial Sea Baseline in Poland (2018–2020) Using Integrated USV/GNSS/SBES Measurements. Energies 2021, 14, 2693. [Google Scholar] [CrossRef]
  48. Lewicka, O.; Specht, M.; Stateczny, A.; Specht, C.; Dardanelli, G.; Brčić, D.; Szostak, B.; Halicki, A.; Stateczny, M.; Widźgowski, S. Integration Data Model of the Bathymetric Monitoring System for Shallow Waterbodies Using UAV and USV Platforms. Remote Sens. 2022, 14, 4075. [Google Scholar] [CrossRef]
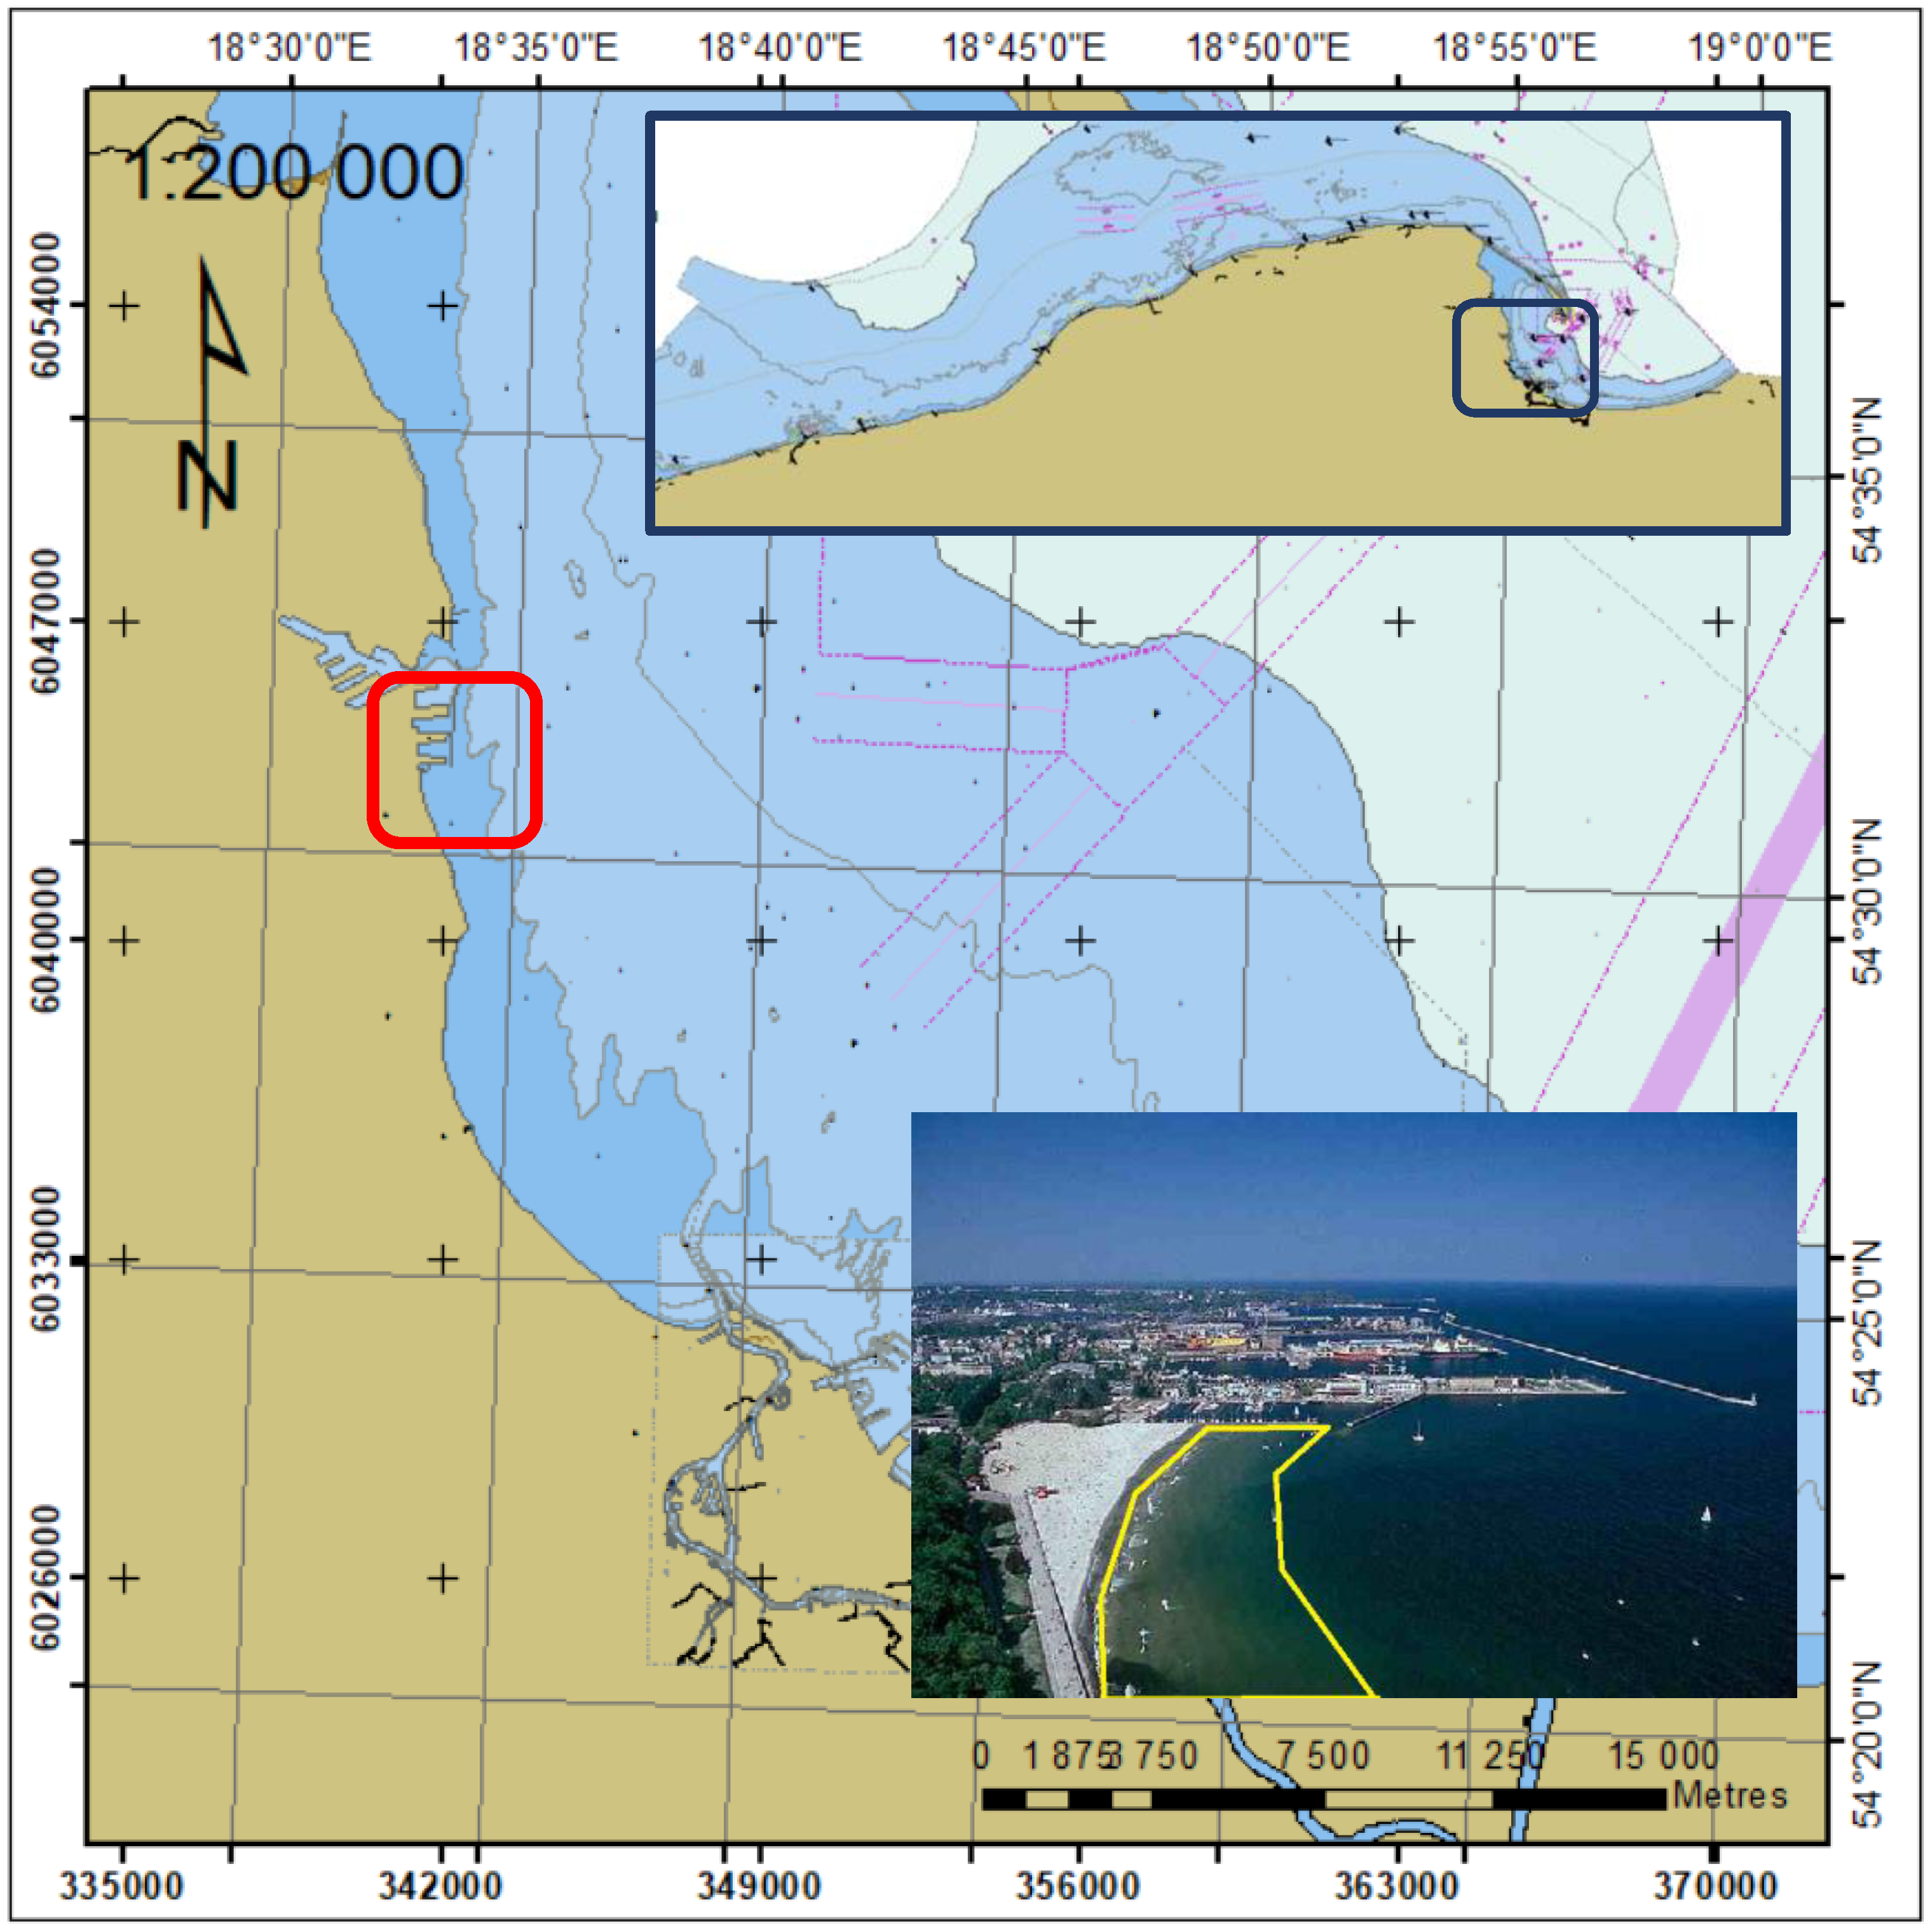
Figure 1. Location of bathymetric surveys in coastal area in Gdynia.
Sensors 23 04215 g001
Figure 2. Stages of planning the survey lines in the restricted area: (a,e) rectangular area including shallow water and land area, (c) area limited using the ENC, (b,d,f) trajectory of the USV on reduced survey lines.
Sensors 23 04215 g002aSensors 23 04215 g002b
Figure 3. Sea level recorded in the water station in Gdynia [35].
Sensors 23 04215 g003
Figure 4. USV OceanAlfa SL20 during bathymetric survey.
Sensors 23 04215 g004
Figure 5. Sounding area divided into three parts.
Sensors 23 04215 g005
Figure 6. Planned lines in area B (a) and the trajectory of the USV in restricted areas: B (b), A (c) and C (d).
Sensors 23 04215 g006
Figure 7. Sounding region with the USV’s trajectory.
Sensors 23 04215 g007
Figure 8. Sounding region A (a) with the USV’s trajectory; selected parts (b) and (c).
Sensors 23 04215 g008aSensors 23 04215 g008b
Figure 9. Sounding region B (a) with the USV’s trajectory; selected parts (b) and (c).
Sensors 23 04215 g009aSensors 23 04215 g009b
Figure 10. Sounding region C (a) with the USV’s trajectory; selected parts (b) and (c).
Sensors 23 04215 g010
Table 1. Technical specification of the OceanAlpha USV SL20.
ParameterOceanAlpha USV SL20
Hull materialCarbon fiber
Dimension105 cm × 55 cm × 35 cm
Draft15 cm
Propulsionwater-jet propulsion
Survey speed2–5 kn (1–2.5 m/s)
Max speed10 kn (5 m/s)
Positioning (standard—not used)u-blox LEA-6 series
Positioning (used in manoeuvering)Topcon HiPerII
HeadingHoneywell HMC6343
EchosounderEchologger series SBES
Table 2. Water level [cm] in Gdynia marina.
Time
Area
26.05.2020
B
27.05.2020
-
28.05.2020
C
29.05.2020
A
8.00517514530.5528
9.00518512.5531531
10.00519513534531
11.00519512.5535531.5
12.00519.5514.5535532
13.00520515.5535533
14.00520.5516.5535535
Table 3. Water level and suggested depth corrections.
Time26.05.202027.05.202028.05.202029.05.2020
Water level [cm]519513535531
Depth correction [cm]−20−15−35−30
Contour line [cm]0500
Disclaimer/Publisher’s Note: The statements, opinions and data contained in all publications are solely those of the individual author(s) and contributor(s) and not of MDPI and/or the editor(s). MDPI and/or the editor(s) disclaim responsibility for any injury to people or property resulting from any ideas, methods, instructions or products referred to in the content.