
Experimental Study: Deep Learning-Based Fall Monitoring among Older Adults with Skin-Wearable Electronics

 ,
,  ,
, 
Abstract
1. Introduction
2. Materials and Methods
3. Results and Discussion
4. Conclusions
Supplementary Materials
Author Contributions
Funding
Institutional Review Board Statement
Informed Consent Statement
Data Availability Statement
Acknowledgments
Conflicts of Interest
References
- Sadigh, S.; Reimers, A.; Andersson, R.; Laflamme, L. Falls and Fall-Related Injuries Among the Elderly: A Survey of Residential-Care Facilities in a Swedish Municipality. J. Community Health 2004, 29, 129–140. [Google Scholar] [CrossRef] [PubMed]
- Salva, A.; Bolibar, I.; Pera, G.; Arias, C. Incidence and consequences of falls among elderly people living in the community. Med. Clin. 2004, 122, 172–176. [Google Scholar] [CrossRef] [PubMed]
- Stevens, J.A.; Corso, P.S.; Finkelstein, E.A.; Miller, T.R. The costs of fatal and non-fatal falls among older adults. Inj. Prev. J. Int. Soc. Child Adolesc. Inj. Prev. 2006, 12, 290–295. [Google Scholar] [CrossRef] [PubMed]
- Rougier, C.; Meunier, J.; St-Arnaud, A.; Rousseau, J. Monocular 3D head tracking to detect falls of elderly people. Conf. Proc. IEEE Eng. Med. Biol. Soc. 2006, 1, 6384–6387. [Google Scholar]
- Web-Based Injury Statistics Query and Reporting System (WISQARS); Centers for Disease Control Prevention: Atlanta, GA, USA, 2002.
- Ageing and life course family and community health. In WHO Global Report on Falls Prevention in Older Age; World Health Organization: Geneva, Switzerland, 2008.
- A Profile of Older Americans; US Department of Health and Human Services, Administration on Aging: Washington, DC, USA, 2017.
- Florence, C.S.; Bergen, G.; Atherly, A.; Burns, E.; Stevens, J.; Drake, C. Medical Costs of Fatal and Nonfatal Falls in Older Adults. J. Am. Geriatr. Soc. 2018, 66, 693–698. [Google Scholar] [CrossRef]
- Chang, J.T.; Morton, S.C.; Rubenstein, L.Z.; Mojica, W.A.; Maglione, M.; Suttorp, M.J.; Roth, E.A.; Shekelle, P.G. Interventions for the prevention of falls in older adults: Systematic review and meta-analysis of randomised clinical trials. BMJ 2004, 328, 680. [Google Scholar] [CrossRef]
- What’s New in Electronics: Emergency Dailer; Popular Science: New York, NY, USA, 1975.
- Pannurat, N.; Thiemjarus, S.; Nantajeewarawat, E. Automatic fall monitoring: A review. Sensors 2014, 14, 12900–12936. [Google Scholar] [CrossRef] [PubMed]
- Wang, H.; Zhang, D.; Wang, Y.; Ma, J.; Wang, Y.; Li, S. RT-Fall: A Real-Time and Contactless Fall Detection System with Commodity WiFi Devices. IEEE Trans. Mob. Comput. 2017, 16, 511–526. [Google Scholar] [CrossRef]
- Hussain, F.; Hussain, F.; Ehatisham-Ul-Haq, M.; Azam, M.A. Activity-Aware Fall Detection and Recognition Based on Wearable Sensors. IEEE Sens. J. 2019, 19, 4528–4536. [Google Scholar] [CrossRef]
- Stone, E.E.; Skubic, M. Fall detection in homes of older adults using the Microsoft Kinect. IEEE J. Biomed. Health Inform. 2014, 19, 290–301. [Google Scholar] [CrossRef]
- Lu, N.; Wu, Y.; Feng, L.; Song, J. Deep learning for fall detection: Three-dimensional CNN Combined with LSTM on video kinematic data. IEEE J. Biomed. Health Inform. 2019, 23, 314–323. [Google Scholar] [CrossRef]
- Huang, Z.; Liu, Y.; Fang, Y.; Horn, B.K.P. Video-Based Fall Detection for Seniors with Human Pose Estimation. In Proceedings of the 4th IEEE International Conference on Universal Village 2018, UV, Boston, MA, USA, 21–24 October 2018. [Google Scholar]
- Rahnemoonfar, M.; Alkittawi, H. Spatio-temporal convolutional neural network for elderly fall detection in depth video cameraS. In Proceedings of the 2018 IEEE International Conference on Big Data, Big Data, Seattle, WA, USA, 10–13 December 2018; pp. 2868–2873. [Google Scholar]
- Li, Y.; Ho, K.; Popescu, M. A microphone array system for automatic fall detection. IEEE Trans. Biomed. Eng. 2012, 59, 1291–1301. [Google Scholar] [PubMed]
- Uddin, M.Z.; Khaksar, W.; Torresen, J. Ambient sensors for elderly care and independent living: A survey. Sensors 2018, 18, 2027. [Google Scholar] [CrossRef] [PubMed]
- Huan-Wen, T.; Mei-Yung, C.; Chen, J. Design of Fall Detection System with Floor Pressure and Infrared Image. In Proceedings of the 2010 International Conference on System Science and Engineering, Taipei, China, 1–3 July 2010; pp. 131–135. [Google Scholar]
- Arshad, A.; Khan, S.; Zahirul Alam, A.H.M.; Ismail, A.F.; Tasnim, R. Capacitive proximity floor sensing system for elderly tracking and fall detection. In Proceedings of the 2017 IEEE International Conference on Smart Instrumentation, Measurement and Applications, ICSIMA, Putrajaya, Malaysia, 28–30 November 2017; pp. 1–5. [Google Scholar]
- Feng, G.; Mai, J.; Ban, Z.; Guo, X.; Wang, G. Floor Pressure Imaging for Fall Detection with Fiber-Optic Sensors. IEEE Pervasive Comput. 2016, 15, 40–47. [Google Scholar] [CrossRef]
- Alwan, M.; Rajendran, P.J.; Kell, S.; Mack, D.; Dalal, S.; Wolfe, M.; Felder, R. A Smart and Passive Floor-Vibration Based Fall Detector for Elderly. In Proceedings of the 2006 2nd International Conference on Information & Communication Technologies, Damascus, Syria, 24–28 April 2006; pp. 1003–1007. [Google Scholar]
- Clemente, J.; Li, F.; Valero, M.; Song, W. Smart Seismic Sensing for Indoor Fall Detection, Location, and Notification. IEEE J. Biomed. Health Inform. 2020, 24, 524–532. [Google Scholar] [CrossRef]
- Liu, C.; Jiang, Z.; Su, X.; Benzoni, S.; Maxwell, A. Detection of human fall using floor vibration and multi-features semi-supervised SVM. Sensors 2019, 19, 3720. [Google Scholar] [CrossRef] [PubMed]
- Patsadu, O.; Watanapa, B.; Dajpratham, P.; Nukoolkit, C. Fall motion detection with fall severity level estimation by mining kinect 3D data stream. Int. Arab J. Inf. Technol. 2018, 15, 378–388. [Google Scholar]
- Ali, S.F.; Khan, R.; Mahmood, A.; Hassan, M.T.; Jeon, M. Using Temporal Covariance of Motion and Geometric Features via Boosting for Human Fall Detection. Sensors 2018, 18, 1918. [Google Scholar] [CrossRef]
- He, J.; Bai, S.; Wang, X. An Unobtrusive Fall Detection and Alerting System Based on Kalman Filter and Bayes Network Classifier. Sensors 2017, 17, 1393. [Google Scholar] [CrossRef]
- Saleh, M.; Jeannès, R.L.B. Elderly Fall Detection Using Wearable Sensors: A Low Cost Highly Accurate Algorithm. IEEE Sens. J. 2019, 19, 3156–3164. [Google Scholar] [CrossRef]
- Baek, W.S.; Kim, D.M.; Bashir, F.; Pyun, J.Y. Real life applicable fall detection system based on wireless body area network. In Proceedings of the 2013 IEEE 10th Consumer Communications and Networking Conference, CCNC 2013, Las Vegas, NV, USA, 11–14 January 2013; pp. 62–67. [Google Scholar]
- Mostarac, P.; Malaric, R.; Jurcevic, M.; Hegedus, H.; Lay-Ekuakille, A.; Vergallo, P. System for monitoring and fall detection of patients using mobile 3-axis accelerometers sensors. In Proceedings of the MeMeA 2011–2011 IEEE International Symposium on Medical Measurements and Applications, Bari, Italy, 30–31 May 2011. [Google Scholar]
- Brown, G. An Accelerometer Based Fall Detector: Development, Experimentation, and Analysis; University of California: Berkeley, CA, USA, 2005; pp. 1–9. [Google Scholar]
- Noury, N.; Fleury, A.; Rumeau, P.; Bourke, A.K.; Laighin, G.O.; Rialle, V.; Lundy, J.E. Fall detection—Principles and Methods. In Proceedings of the 29th Annual International Conference of the IEEE Engineering in Medicine and Biology Society, Lyon, France, 22–26 August 2007; pp. 1663–1666. [Google Scholar]
- Bagalà, F.; Becker, C.; Cappello, A.; Chiari, L.; Aminian, K.; Hausdorff, J.M.; Zijlstra, W.; Klenk, J. Evaluation of accelerometer-based fall detection algorithms on real-world falls. PLoS ONE 2012, 7, e37062. [Google Scholar] [CrossRef] [PubMed]
- Igual, R.; Medrano, C.; Plaza, I. Challenges, issues and trends in fall detection systems. Biomed. Eng. Online 2013, 12, 66. [Google Scholar] [CrossRef] [PubMed]
- Belshaw, M.; Taati, B.; Snoek, J.; Mihailidis, A. Towards a single sensor passive solution for automated fall detection. In Proceedings of the Annual International Conference of the IEEE Engineering in Medicine and Biology Society, EMBS, Boston, MA, USA, 30 August–3 September 2011; pp. 1773–1776. [Google Scholar]
- Chen, G.C.; Huang, C.N.; Chiang, C.Y.; Hsieh, C.J.; Chan, C.T. A reliable fall detection system based on wearable sensor and signal magnitude area for elderly residents. In Aging Friendly Technology for Health and Independence; Lecture Notes in Computer Science (Including Subseries Lecture Notes in Artificial Intelligence and Lecture Notes in Bioinformatics), LNCS; Springer: Berlin/Heidelberg, Germany, 2010; Volume 6159, pp. 267–270. [Google Scholar]
- Kangas, M.; Vikman, I.; Wiklander, J.; Lindgren, P.; Nyberg, L.; Jämsä, T. Sensitivity and specificity of fall detection in people aged 40 years and over. Gait Posture 2009, 29, 571–574. [Google Scholar] [CrossRef] [PubMed]
- Lord, C.J.; Colvin, D.P. Falls in the Elderly: Detection and Assessment. In Proceedings of the Annual Conference on Engineering in Medicine and Biology, Orlando, FL, USA, 31 October–3 November 1991; IEEE: Piscataway, NJ, USA; pp. 1938–1939. [Google Scholar]
- Kangas, M.; Konttila, A.; Lindgren, P.; Winblad, I.; Jämsä, T. Comparison of low-complexity fall detection algorithms for body attached accelerometers. Gait Posture 2008, 28, 285–291. [Google Scholar] [CrossRef]
- Bagnasco, A.; Scapolla, A.M.; Spasova, V. Design, Implementation and Experimental Evaluation of a Wireless Fall Detector. In Proceedings of the 4th International Symposium on Applied Sciences in Biomedical and Communication Technologies, Barcelona, Spain, 26–29 October 2011; Association for Computing Machinery: New York, NY, USA, 2011; pp. 1–5. [Google Scholar]
- De Miguel, K.; Brunete, A.; Hernando, M.; Gambao, E. Home camera-based fall detection system for the elderly. Sensors 2017, 17, 2864. [Google Scholar] [CrossRef]
- Aziz, O.; Musngi, M.; Park, E.J.; Mori, G.; Robinovitch, S.N. A comparison of accuracy of fall detection algorithms (threshold-based vs. machine learning) using waist-mounted tri-axial accelerometer signals from a comprehensive set of falls and non-fall trials. Med. Biol. Eng. Comput. 2017, 55, 45–55. [Google Scholar] [CrossRef]
- De Quadros, T.; Lazzaretti, A.E.; Schneider, F.K. A Movement Decomposition and Machine Learning-Based Fall Detection System Using Wrist Wearable Device. IEEE Sens. J. 2018, 18, 5082–5089. [Google Scholar] [CrossRef]
- Chelli, A.; Patzold, M. A Machine Learning Approach for Fall Detection and Daily Living Activity Recognition. IEEE Access 2019, 7, 38670–38687. [Google Scholar] [CrossRef]
- Cheng, S.; Chen, J.; Anastasiou, C.; Angeli, P.; Matar, O.K.; Guo, Y.-K.; Pain, C.C.; Arcucci, R. Generalised Latent Assimilation in Heterogeneous Reduced Spaces with Machine Learning Surrogate Models. J. Sci. Comput. 2022, 94, 11. [Google Scholar] [CrossRef]
- Liu, C.; Cheng, S.; Ding, W.; Arcucci, R. Spectral Cross-Domain Neural Network with Soft-adaptive Threshold Spectral Enhancement. arXiv preprint 2023, arXiv:2301.10171. [Google Scholar]
- Ali, G.Q.; Al-Libawy, H. Time-Series Deep-Learning Classifier for Human Activity Recognition Based On Smartphone Built-in Sensors. J. Phys. Conf. Ser. 2021, 1973, 012127. [Google Scholar] [CrossRef]
- Alawneh, L.; Alsarhan, T.; Al-Zinati, M.; Al-Ayyoub, M.; Jararweh, Y.; Lu, H. Enhancing human activity recognition using deep learning and time series augmented data. J. Ambient. Intell. Humaniz. Comput. 2021, 12, 10565–10580. [Google Scholar] [CrossRef]
- Nafea, O.; Abdul, W.; Muhammad, G.; Alsulaiman, M. Sensor-based human activity recognition with spatio-temporal deep learning. Sensors 2021, 21, 2141. [Google Scholar] [CrossRef] [PubMed]
- Zhang, S.; Li, Y.; Zhang, S.; Shahabi, F.; Xia, S.; Deng, Y.; Alshurafa, N. Deep Learning in Human Activity Recognition with Wearable Sensors: A Review on Advances. Sensors 2022, 22, 1476. [Google Scholar] [CrossRef]
- Chen, K.; Zhang, D.; Yao, L.; Guo, B.; Yu, Z.; Liu, Y. Deep learning for sensor-based human activity recognition: Overview, challenges, and opportunities. ACM Comput. Surv. 2021, 54, 1–40. [Google Scholar] [CrossRef]
- Jeong, J.-W.; Yeo, W.-H.; Akhtar, A.; Norton, J.J.S.; Kwack, Y.-J.; Li, S.; Jung, S.-Y.; Su, Y.; Lee, W.; Xia, J.; et al. Materials and Optimized Designs for Human-Machine Interfaces Via Epidermal Electronics. Adv. Mater. 2013, 25, 6839–6846. [Google Scholar] [CrossRef]
- Kim, Y.-S.; Mahmood, M.; Lee, Y.; Kim, N.K.; Kwon, S.; Herbert, R.; Kim, D.; Cho, H.C.; Yeo, W.-H. All-in-One, Wireless, Stretchable Hybrid Electronics for Smart, Connected, and Ambulatory Physiological Monitoring. Adv. Sci. 2019, 6, 1900939. [Google Scholar] [CrossRef]
- Wang, S.; Li, M.; Wu, J.; Kim, D.-H.; Lu, N.; Su, Y.; Kang, Z.; Huang, Y.; Rogers, J.A. Mechanics of Epidermal Electronics. J. Appl. Mech. 2012, 79, 031022. [Google Scholar] [CrossRef]
- Gibson, R.F. Principles of Composite Material Mechanics; CRC Press: Boca Raton, FL, USA, 2016. [Google Scholar]
- Schwindt, D.A.; Wilhelm, K.P.; Miller, D.L.; Maibach, H.I. Cumulative irritation in older and younger skin: A comparison. Acta Derm. Venereol. 1998, 78, 279–283. [Google Scholar] [CrossRef]
- Lioudmila, T.; Haishan, Z.; Igor, M.; David, I.M.; Harvey, L.; Tim, K.L. Skin Roughness Assessment. In New Developments in Biomedical Engineering; Domenico, C., Ed.; IntechOpen: Rijeka, Croatia, 2010. [Google Scholar]
- Hall, P.S.; Hao, Y.; Nechayev, Y.I.; Alomainy, A.; Constantinou, C.C.; Parini, C.; Kamarudin, M.R.; Salim, T.Z.; Hee, D.T.M.; Dubrovka, R.; et al. Antennas and propagation for on-body communication systems. IEEE Antennas Propag. Mag. 2007, 49, 41–58. [Google Scholar] [CrossRef]
- Tajin, M.A.S.; Bshara, O.; Liu, Y.; Levitt, A.; Dion, G.; Dandekar, K.R. Efficiency measurement of the flexible on-body antenna at varying levels of stretch in a reverberation chamber. IET Microw. Antennas Propag. 2020, 14, 154–158. [Google Scholar] [CrossRef] [PubMed]
- Huang, Z.; Niu, Q.; You, I.; Pau, G. Acceleration Feature Extraction of Human Body Based on Wearable Devices. Energies 2021, 14, 924. [Google Scholar] [CrossRef]
- Barri Khojasteh, S.; Villar, J.R.; de la Cal, E.; González, V.M.; Sedano, J.; Yazgan, H.R. Evaluation of a Wrist-Based Wearable Fall Detection Method. In Proceedings of the Hybrid Artificial Intelligent Systems: 13th International Conference, HAIS 2018, Oviedo, Spain, 20–22 June 2018; Springer: Berlin/Heidelberg, Germany, 2018; pp. 377–386. [Google Scholar]
- Tamrat, T.; Griffin, M.; Rupcic, S.; Kachnowski, S.; Taylor, T.; Barfield, J. Operationalizing a Wireless Wearable Fall Detection Sensor for Older Adults. In Proceedings of the 2012 6th International Conference on Pervasive Computing Technologies for Healthcare (PervasiveHealth) and Workshops, San Diego, CA, USA, 21–24 May 2012; IEEE: Piscataway, NJ, USA, 2012; pp. 297–302. [Google Scholar]
- Orendurff, M.S.; Segal, A.D.; Klute, G.K.; Berge, J.S.; Rohr, E.S.; Kadel, N.J. The effect of walking speed on center of mass displacement. J. Rehabil. Res. Dev. 2004, 41, 829–834. [Google Scholar] [CrossRef] [PubMed]
- Nweke, H.F.; Teh, Y.W.; Al-garadi, M.A.; Alo, U.R. Deep learning algorithms for human activity recognition using mobile and wearable sensor networks: State of the art and research challenges. Expert Syst. Appl. 2018, 105, 233–261. [Google Scholar] [CrossRef]
- Awais, M.; Chiari, L.; Ihlen, E.A.F.; Helbostad, J.L.; Palmerini, L. Classical Machine Learning Versus Deep Learning for the Older Adults Free-Living Activity Classification. Sensors 2021, 21, 4669. [Google Scholar] [CrossRef] [PubMed]
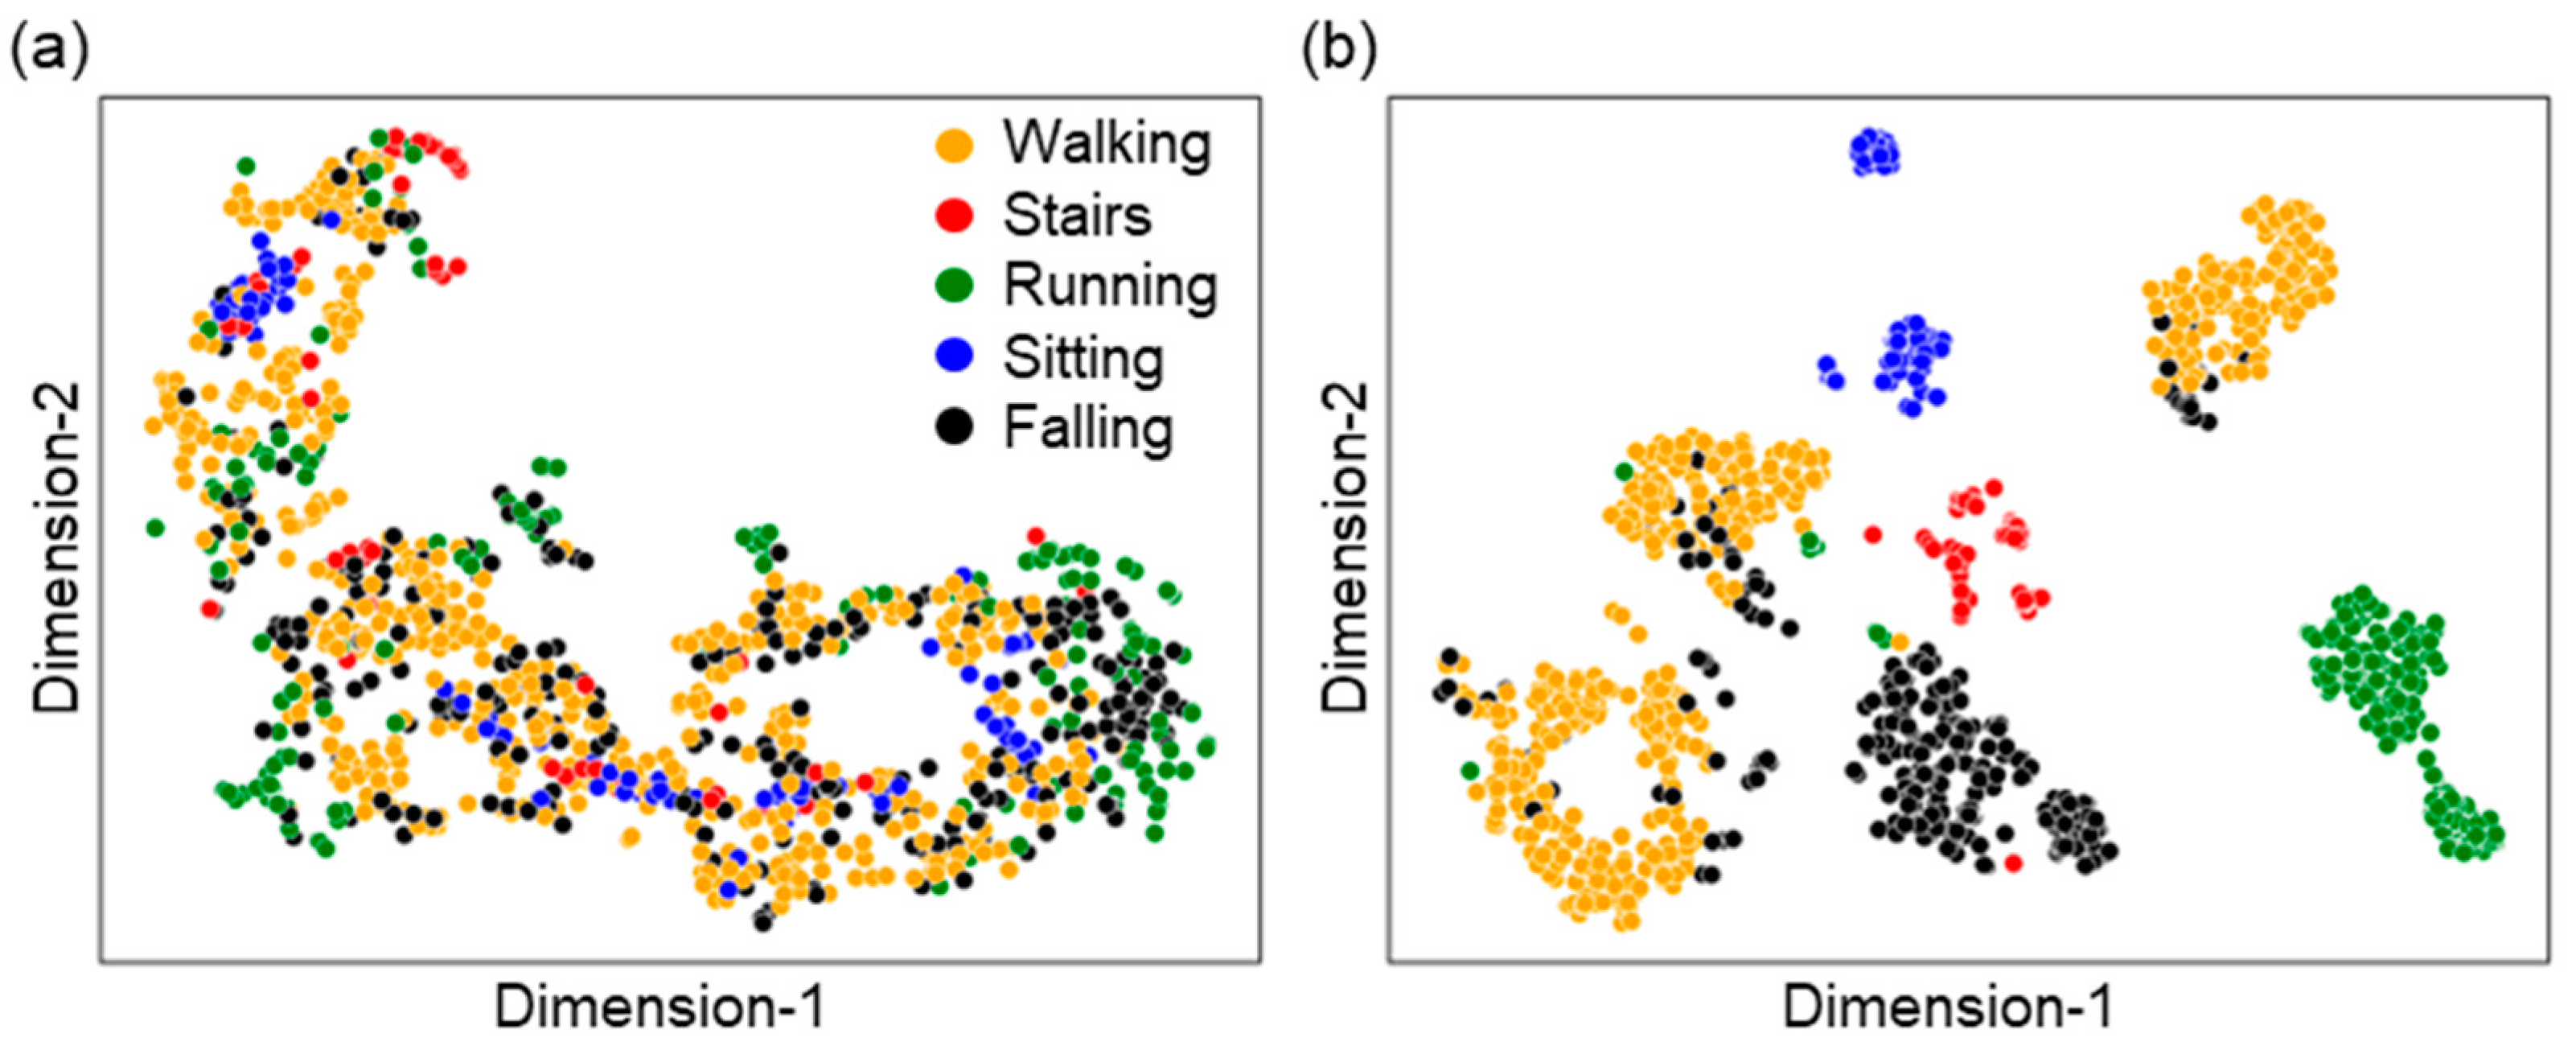
- Maaten, L.v.d.; Hinton, G.E. Visualizing Data using t-SNE. J. Mach. Learn. Res. 2008, 9, 2579–2605. [Google Scholar]
- Spagnolli, A.; Guardigli, E.; Orso, V.; Varotto, A.; Gamberini, L. Measuring User Acceptance of Wearable Symbiotic Devices: Validation Study Across Application Scenarios; Symbiotic Interaction; Jacucci, G., Gamberini, L., Freeman, J., Spagnolli, A., Eds.; Springer International Publishing: Cham, Switzerland, 2014; pp. 87–98. [Google Scholar]


| Device Placement | Walking | Stairs | Running | Sitting | Falling | |
|---|---|---|---|---|---|---|
| Young Adults | Chest | 1111 | 538 | 363 | 191 | 112 |
| 278 | 134 | 91 | 48 | 28 | ||
| 1389 | 672 | 454 | 239 | 140 | ||
| Wrist | 878 | 693 | 611 | 162 | 139 | |
| 220 | 173 | 153 | 40 | 35 | ||
| 1098 | 866 | 764 | 202 | 174 | ||
| Necklace | 1197 | 746 | 1193 | 171 | 154 | |
| 299 | 187 | 298 | 43 | 38 | ||
| 1496 | 933 | 1491 | 214 | 192 | ||
| Older Adults | Chest | 1015 | 710 | 838 | 148 | 136 |
| 254 | 177 | 210 | 37 | 34 | ||
| 1269 | 887 | 1048 | 185 | 170 |
| Device Placement | Accuracy | Precision | Recall | F1-Score |
|---|---|---|---|---|
| Chest | 0.9326 | 0.9757 | 0.9606 | 0.9674 |
| Wrist | 0.8244 | 0.8446 | 0.8682 | 0.8537 |
| Necklace | 0.9225 | 0.9450 | 0.9331 | 0.9387 |
| Model | Mag. of acc. (n = 1) | XYZ acc. (n = 3) | XYZ acc. and Gyro. (n = 6) | Combined (n = 7) |
|---|---|---|---|---|
| LSTM | 0.905 ± 0.014 | 0.928 ± 0.015 | 0.936 ± 0.011 | 0.931 ± 0.011 |
| CNN | 0.915 ± 0.010 | 0.879 ± 0.015 | 0.931 ± 0.009 | 0.927 ± 0.008 |
| CNN-LSTM | 0.903 ± 0.026 | 0.921 ± 0.022 | 0.925 ± 0.022 | 0.921 ± 0.018 |
| Conv-LSTM | 0.887 ± 0.021 | 0.926 ± 0.013 | 0.885 ± 0.046 | 0.866 ± 0.038 |
| Bi-LSTM | 0.886 ± 0.019 | 0.914 ± 0.030 | 0.912 ± 0.017 | 0.909 ± 0.023 |
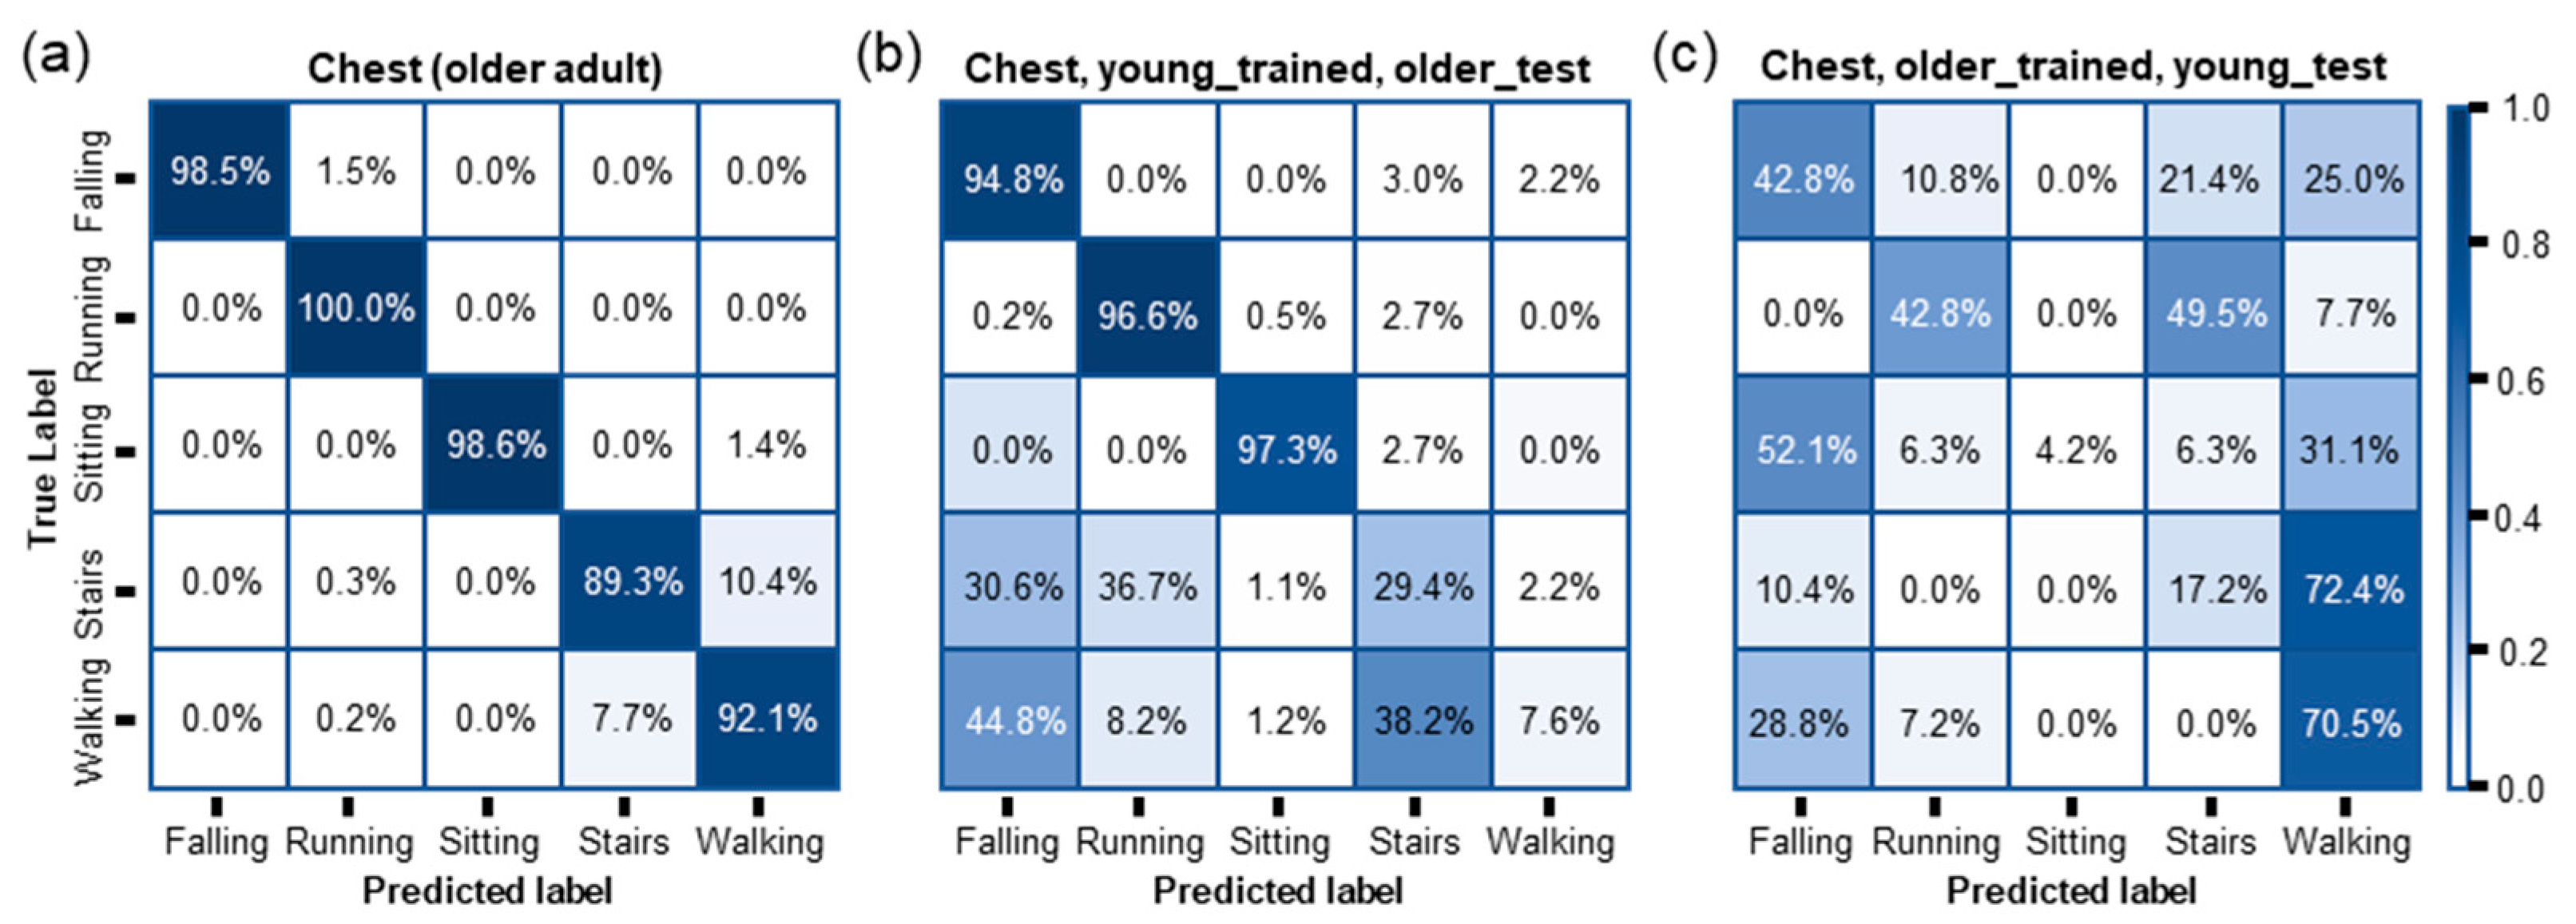
| Device Placement | Training Dataset | Test Dataset | Accuracy | Precision | Recall | F1-Score |
|---|---|---|---|---|---|---|
| Chest | Old | Old | 0.9353 | 0.9552 | 0.9578 | 0.9561 |
| Young | Older | 0.4831 | 0.5789 | 0.6565 | 0.4922 | |
| Older | Young | 0.4697 | 0.5657 | 0.3550 | 0.3335 |
| Question | Strongly Disagree | Disagree | Agree | Strongly Agree |
|---|---|---|---|---|
| Do you think that the SWM device is comfortable? | 0% | 0% | 20% | 80% |
| Do you think that the SWM device is convenient? | 0% | 0% | 26.7% | 73.33% |
| Do you think that the SWM device is important? | 0% | 6.67% | 13.33% | 80% |
| Do you think that the SWM device is safe? | 0% | 0% | 20% | 80% |
| Do you think that the SWM device is useful? | 0% | 6.67% | 20% | 73.33% |
Disclaimer/Publisher’s Note: The statements, opinions and data contained in all publications are solely those of the individual author(s) and contributor(s) and not of MDPI and/or the editor(s). MDPI and/or the editor(s) disclaim responsibility for any injury to people or property resulting from any ideas, methods, instructions or products referred to in the content. |
© 2023 by the authors. Licensee MDPI, Basel, Switzerland. This article is an open access article distributed under the terms and conditions of the Creative Commons Attribution (CC BY) license (https://creativecommons.org/licenses/by/4.0/).
Share and Cite
Lee, Y.; Pokharel, S.; Muslim, A.A.; KC, D.B.; Lee, K.H.; Yeo, W.-H. Experimental Study: Deep Learning-Based Fall Monitoring among Older Adults with Skin-Wearable Electronics. Sensors 2023, 23, 3983. https://doi.org/10.3390/s23083983
Lee Y, Pokharel S, Muslim AA, KC DB, Lee KH, Yeo W-H. Experimental Study: Deep Learning-Based Fall Monitoring among Older Adults with Skin-Wearable Electronics. Sensors. 2023; 23(8):3983. https://doi.org/10.3390/s23083983
Chicago/Turabian StyleLee, Yongkuk, Suresh Pokharel, Asra Al Muslim, Dukka B. KC, Kyoung Hag Lee, and Woon-Hong Yeo. 2023. "Experimental Study: Deep Learning-Based Fall Monitoring among Older Adults with Skin-Wearable Electronics" Sensors 23, no. 8: 3983. https://doi.org/10.3390/s23083983
APA StyleLee, Y., Pokharel, S., Muslim, A. A., KC, D. B., Lee, K. H., & Yeo, W.-H. (2023). Experimental Study: Deep Learning-Based Fall Monitoring among Older Adults with Skin-Wearable Electronics. Sensors, 23(8), 3983. https://doi.org/10.3390/s23083983