
Multi-Disciplinary Monitoring Networks for Mesoscale Underground Experiments: Advances in the Bedretto Reservoir Project

 , , and
Abstract
:1. Introduction
2. Challenges in the Instrumentation of Meso-Scale Experiments
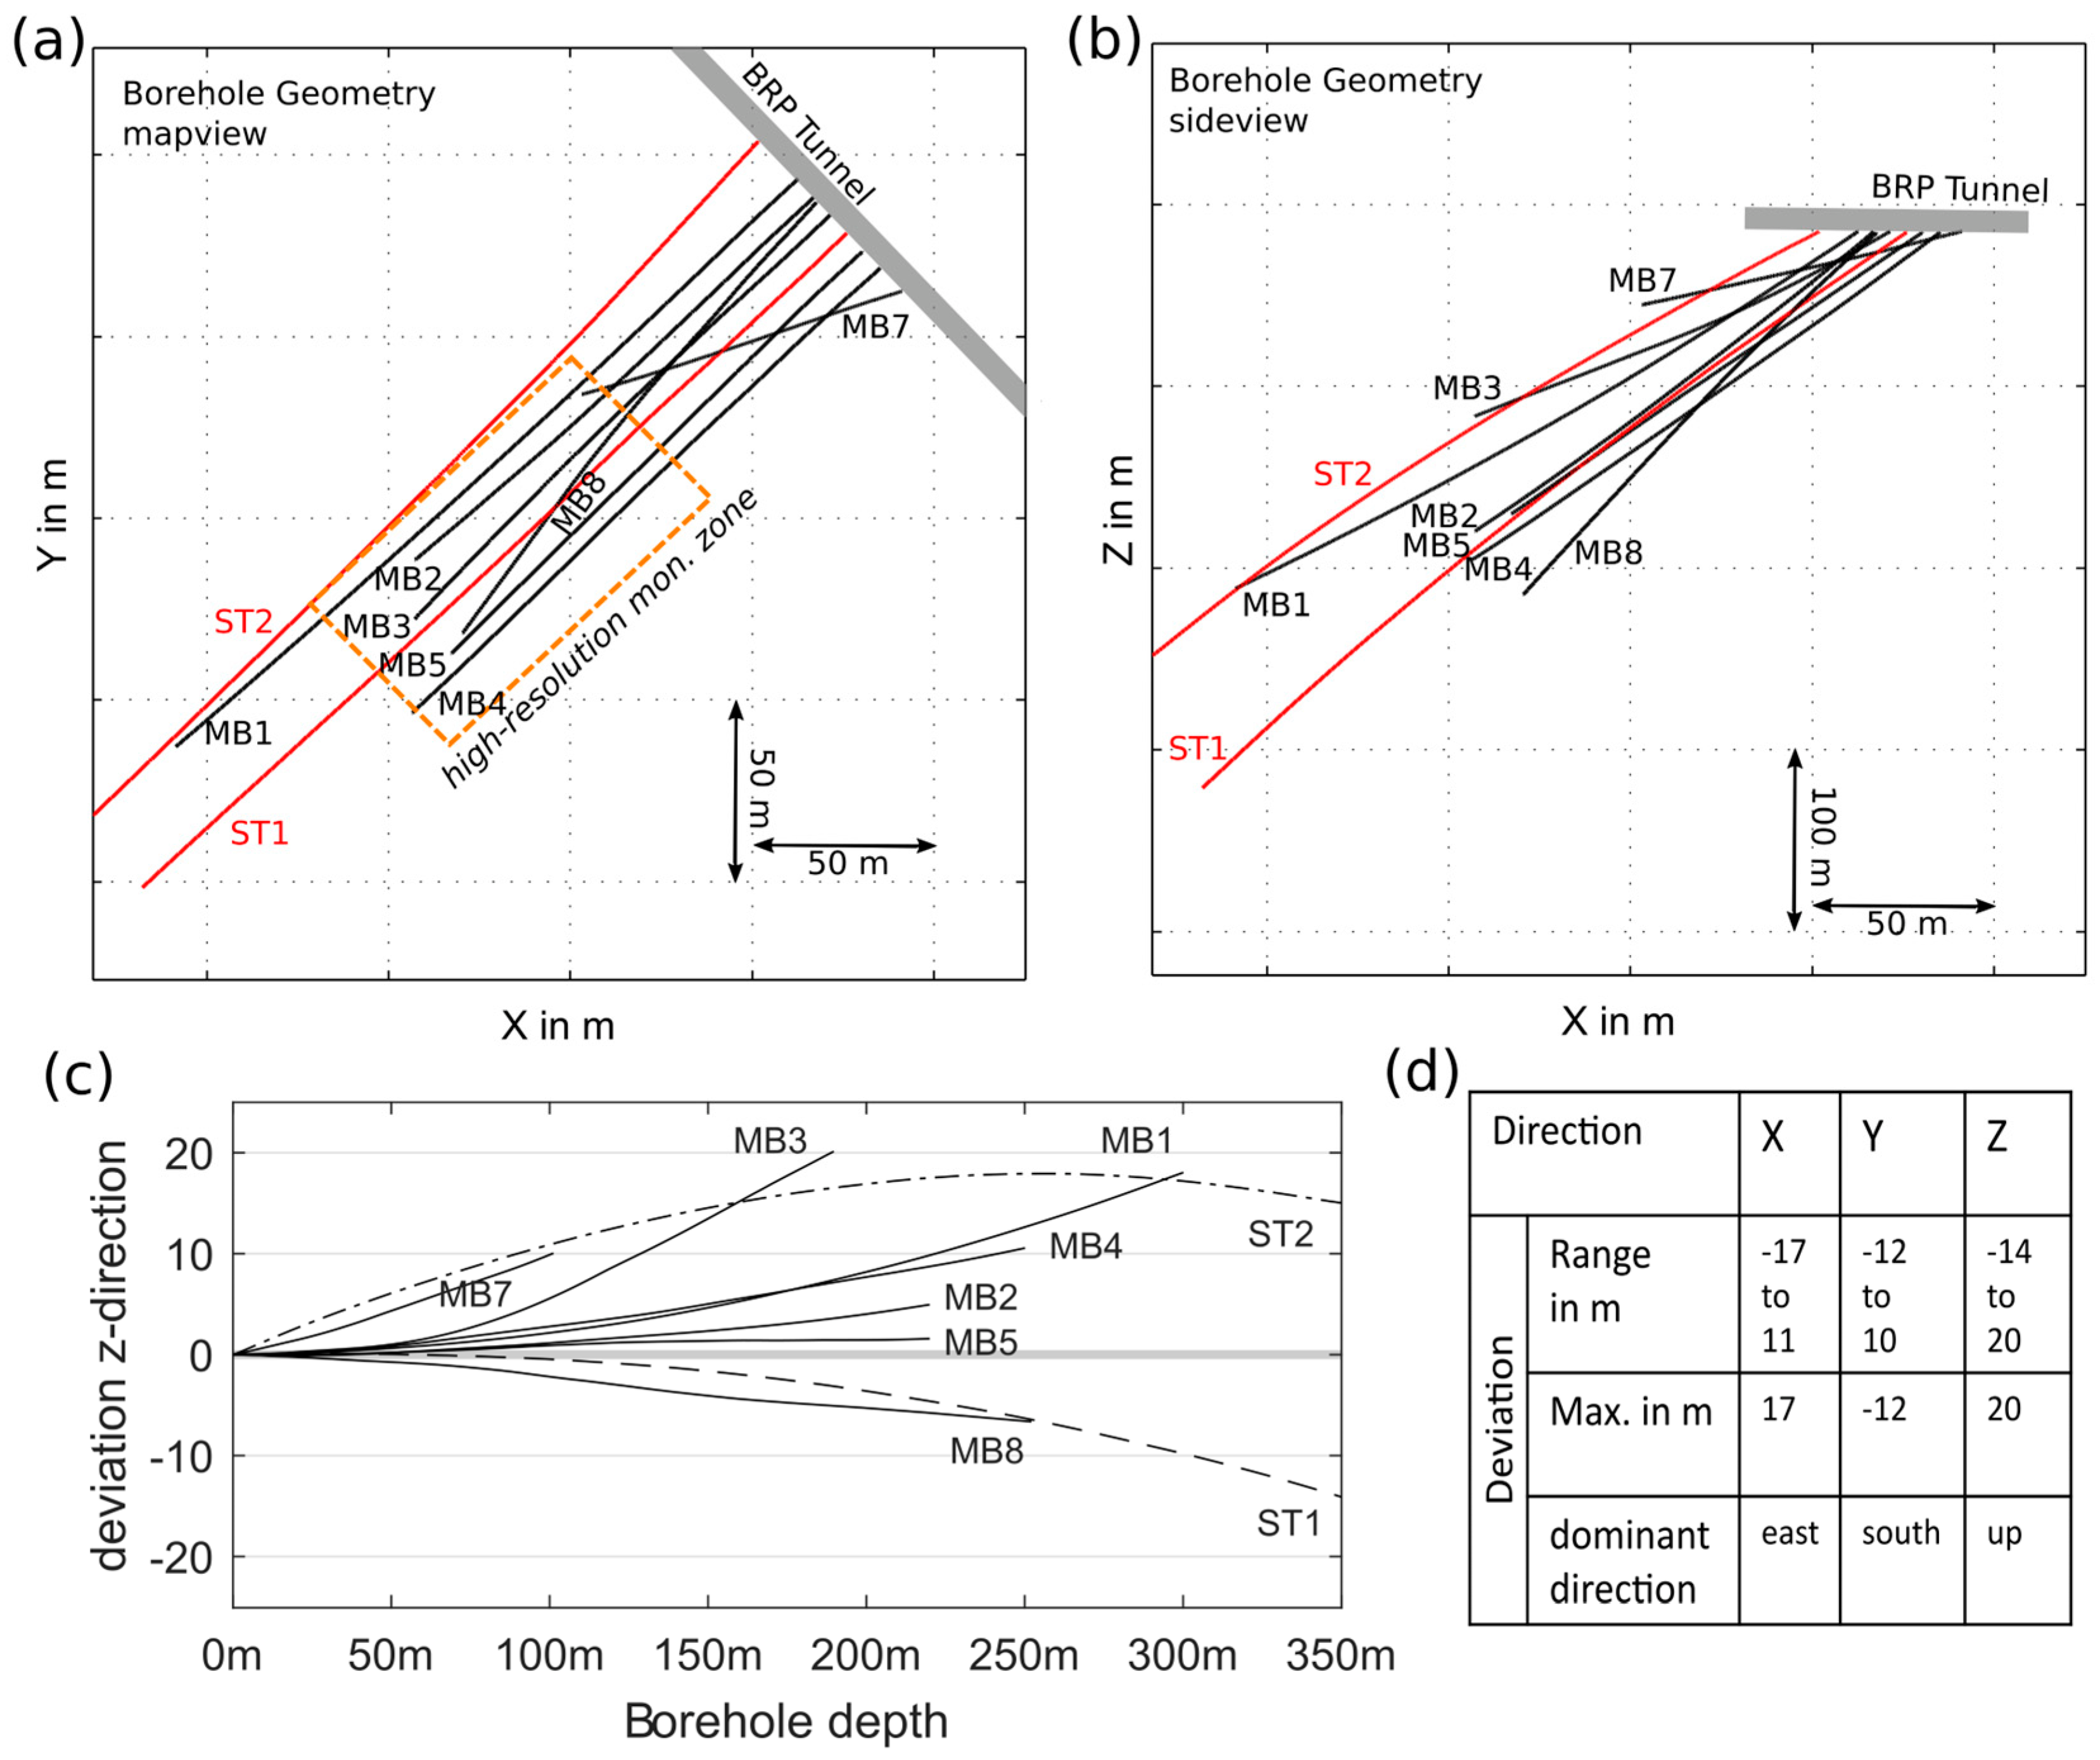
2.1. Borehole Deviation
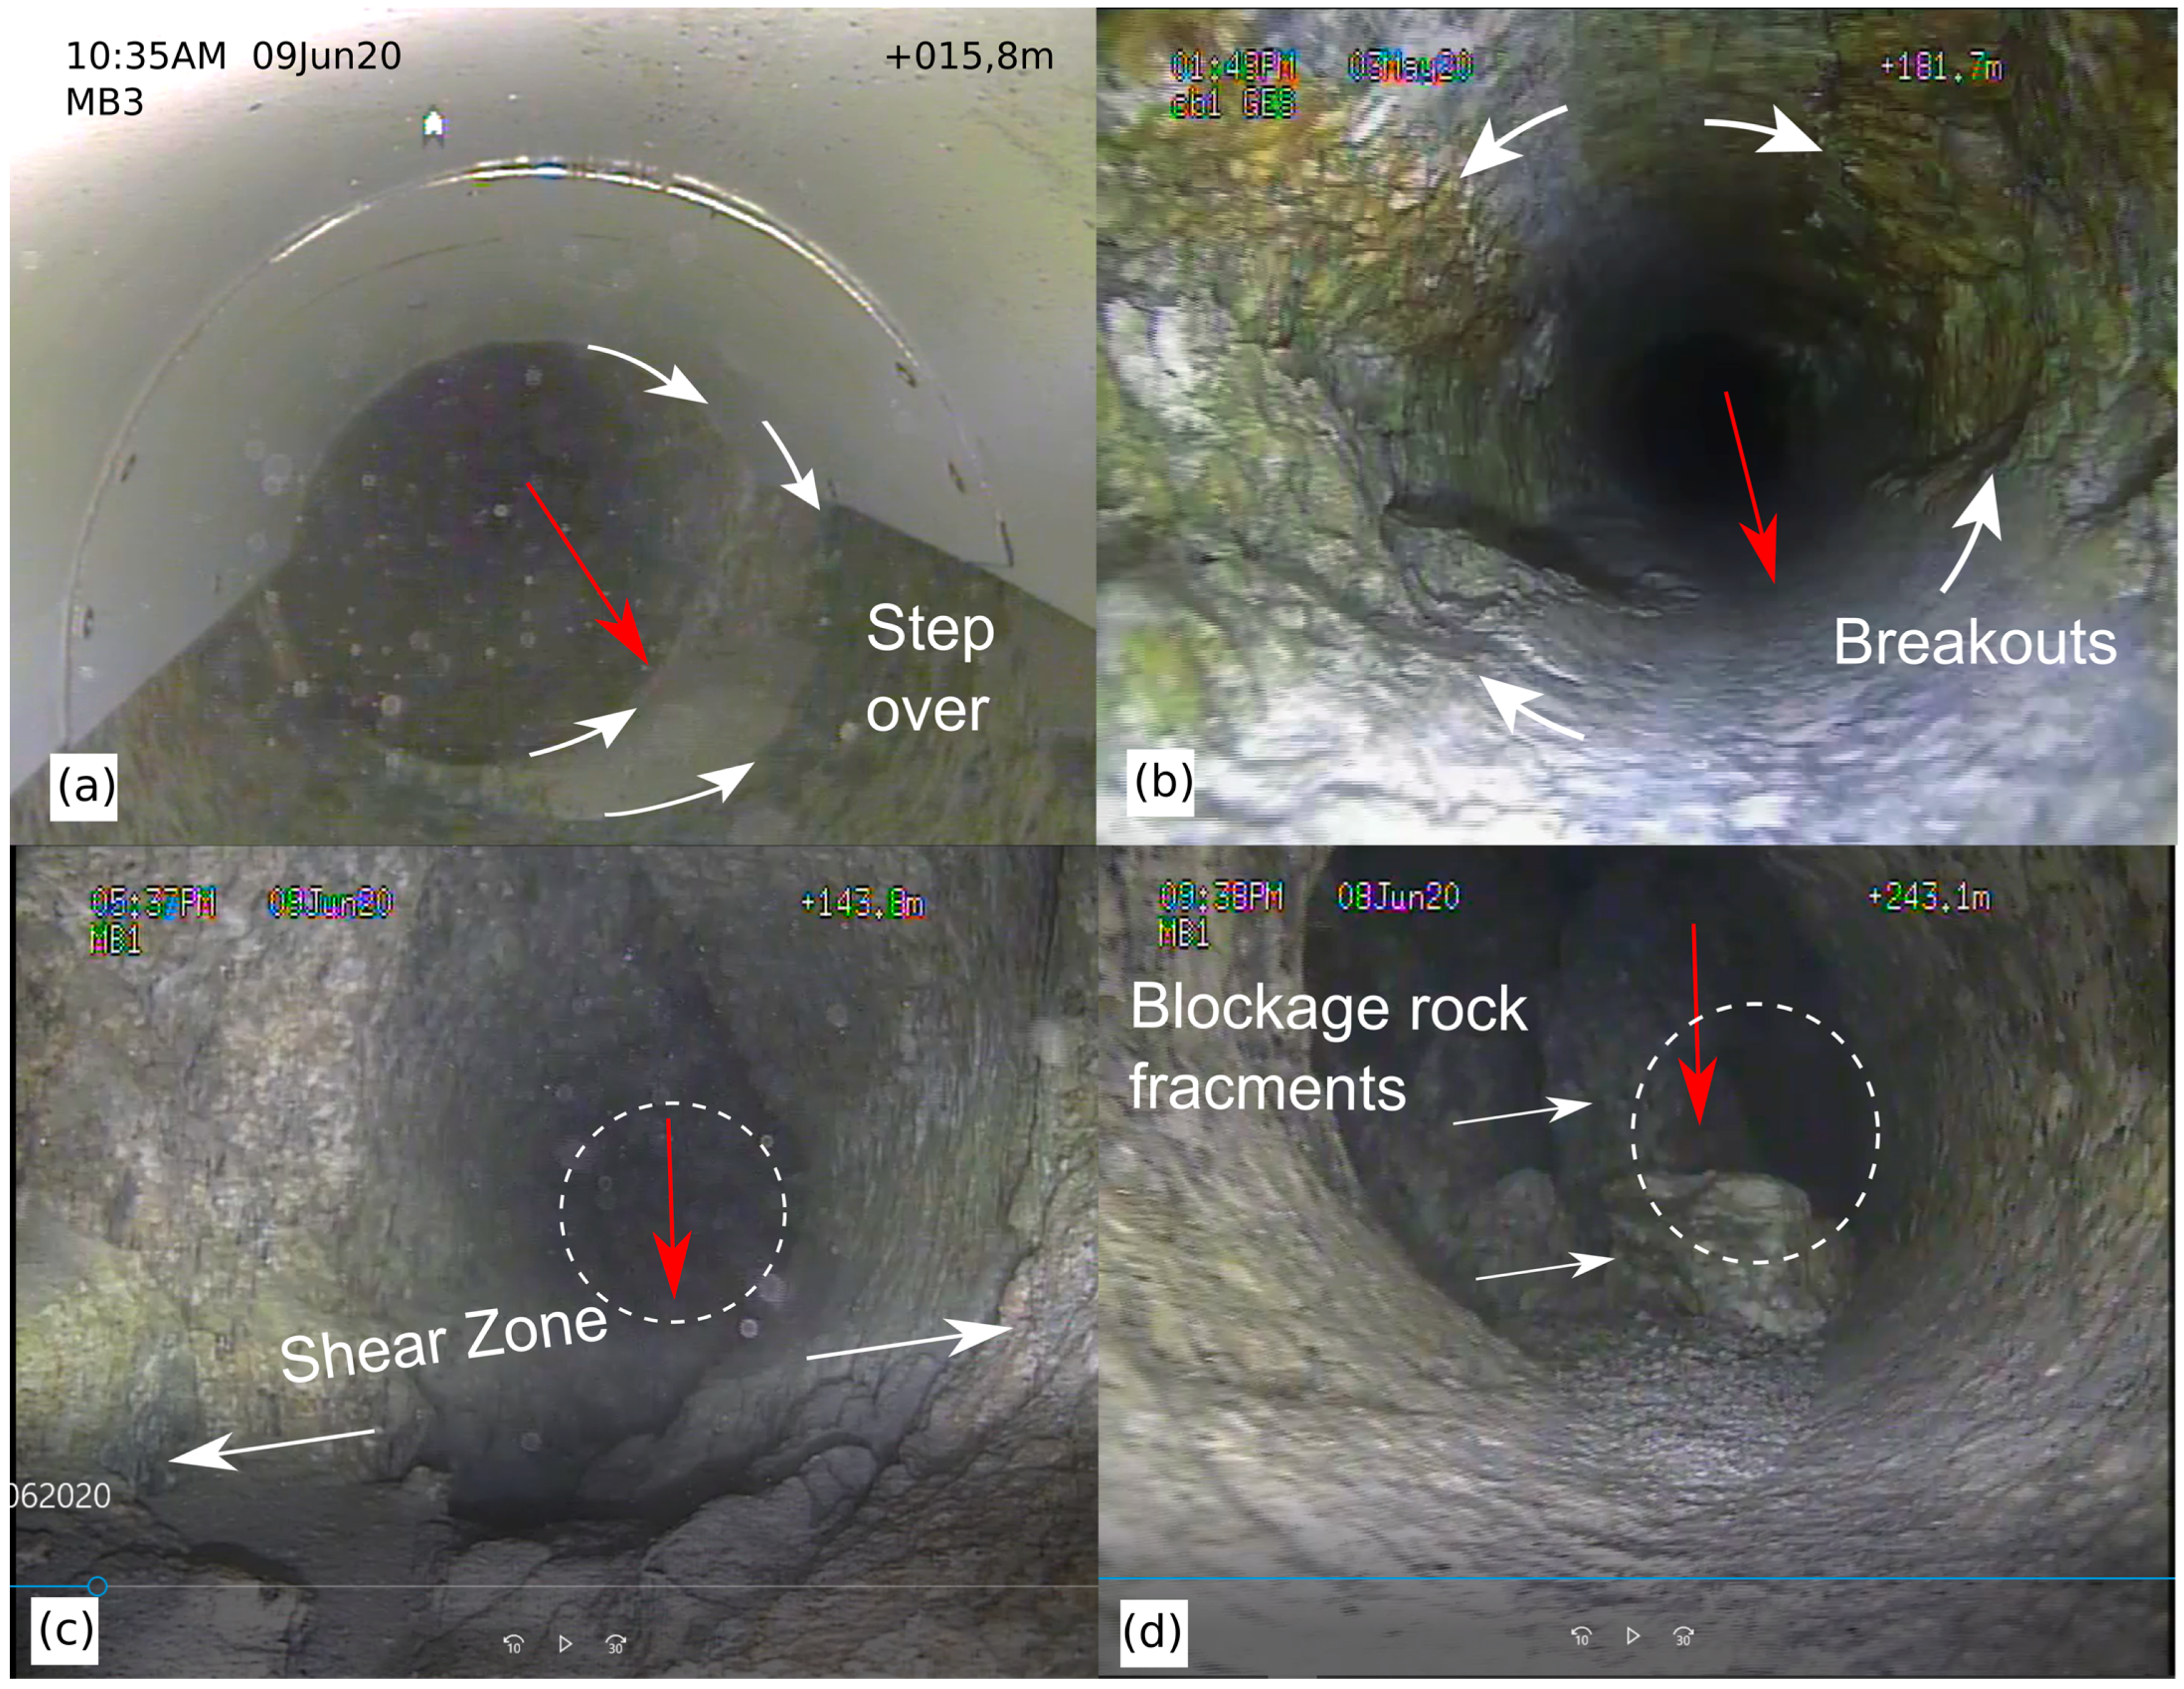
2.2. Borehole Roughness
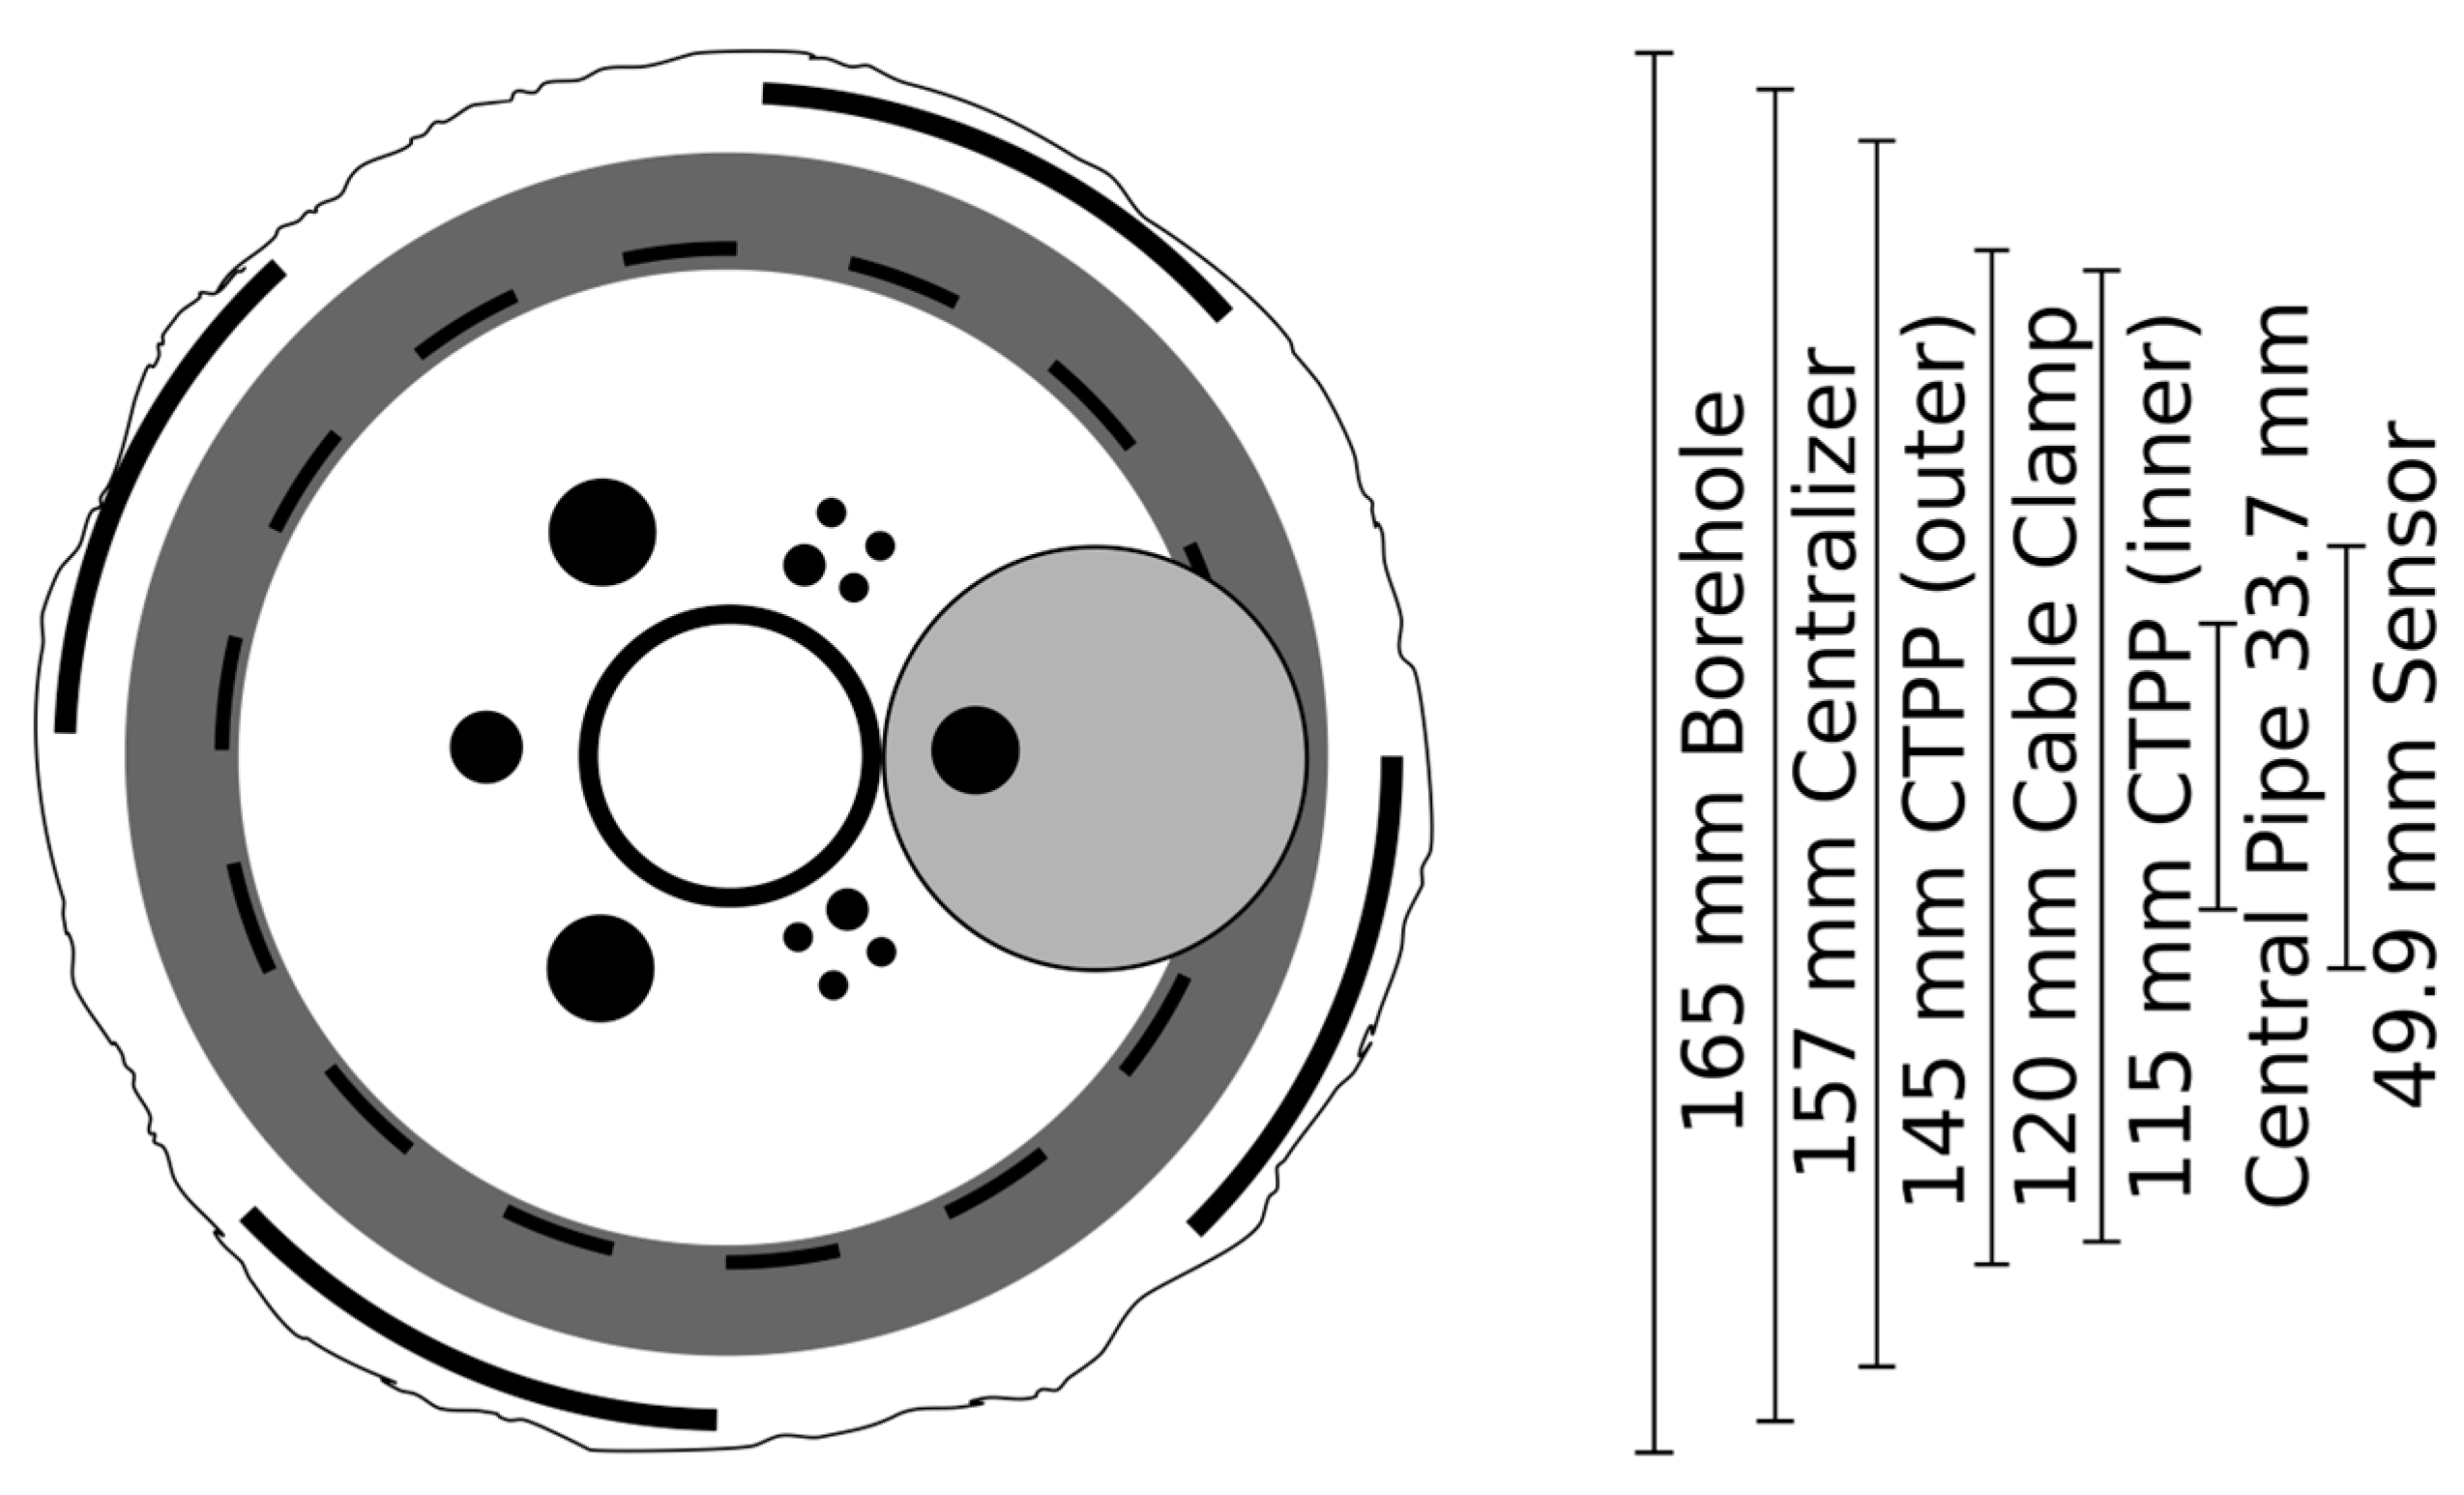
2.3. Multi-Sensor Installation
2.4. Pressure
2.5. Heavy Equipment
2.6. Borehole Sealing
3. Application to a Deep Underground Geothermal Reservoir Project
3.1. Introduction of the Bedretto Reservoir Project (BRP)
3.1.1. Scientific Background

| Hectometer | Decameter | ||||
|---|---|---|---|---|---|
| BRP | Äspö | Grimsel | Collab | Stimtec | |
| Rock volume | 100 × 300 × 100 m | 30 × 30 × 30 m | 30 × 30 × 30 m | 30 × 30 × 30 m | 30 × 40 × 30 m |
| Depth bgl. | ~1000 m | 410 m | 480 m | 1500 m | 130 m |
| Injection in m3 | up to 100 * | 0.01 to 0.03 | 0.9 to 1.5 | 0.02 to 0.65 | 0.02 to 0.06 |
| Frac. extent | <100 m * | <10 m | <20 m | <20 m | <10 m |
| loc. AE events | 10.000 to 100.000 * | 0 to 102 | 13 to 3103 | 58 to 426 | 0 to 5775 |
| Distance ** | 60 m–400 m * | 4 to 25 m | 15 to 40 m | 25 to 35 m | 10 to 20 m |
| Inj. borehole diam. | 216 mm | 102.5 mm | 146 mm | 96 mm | 76 mm |
| Reference | This study | [12,20,21] | [13,19,22] | [23,29] | [15] |
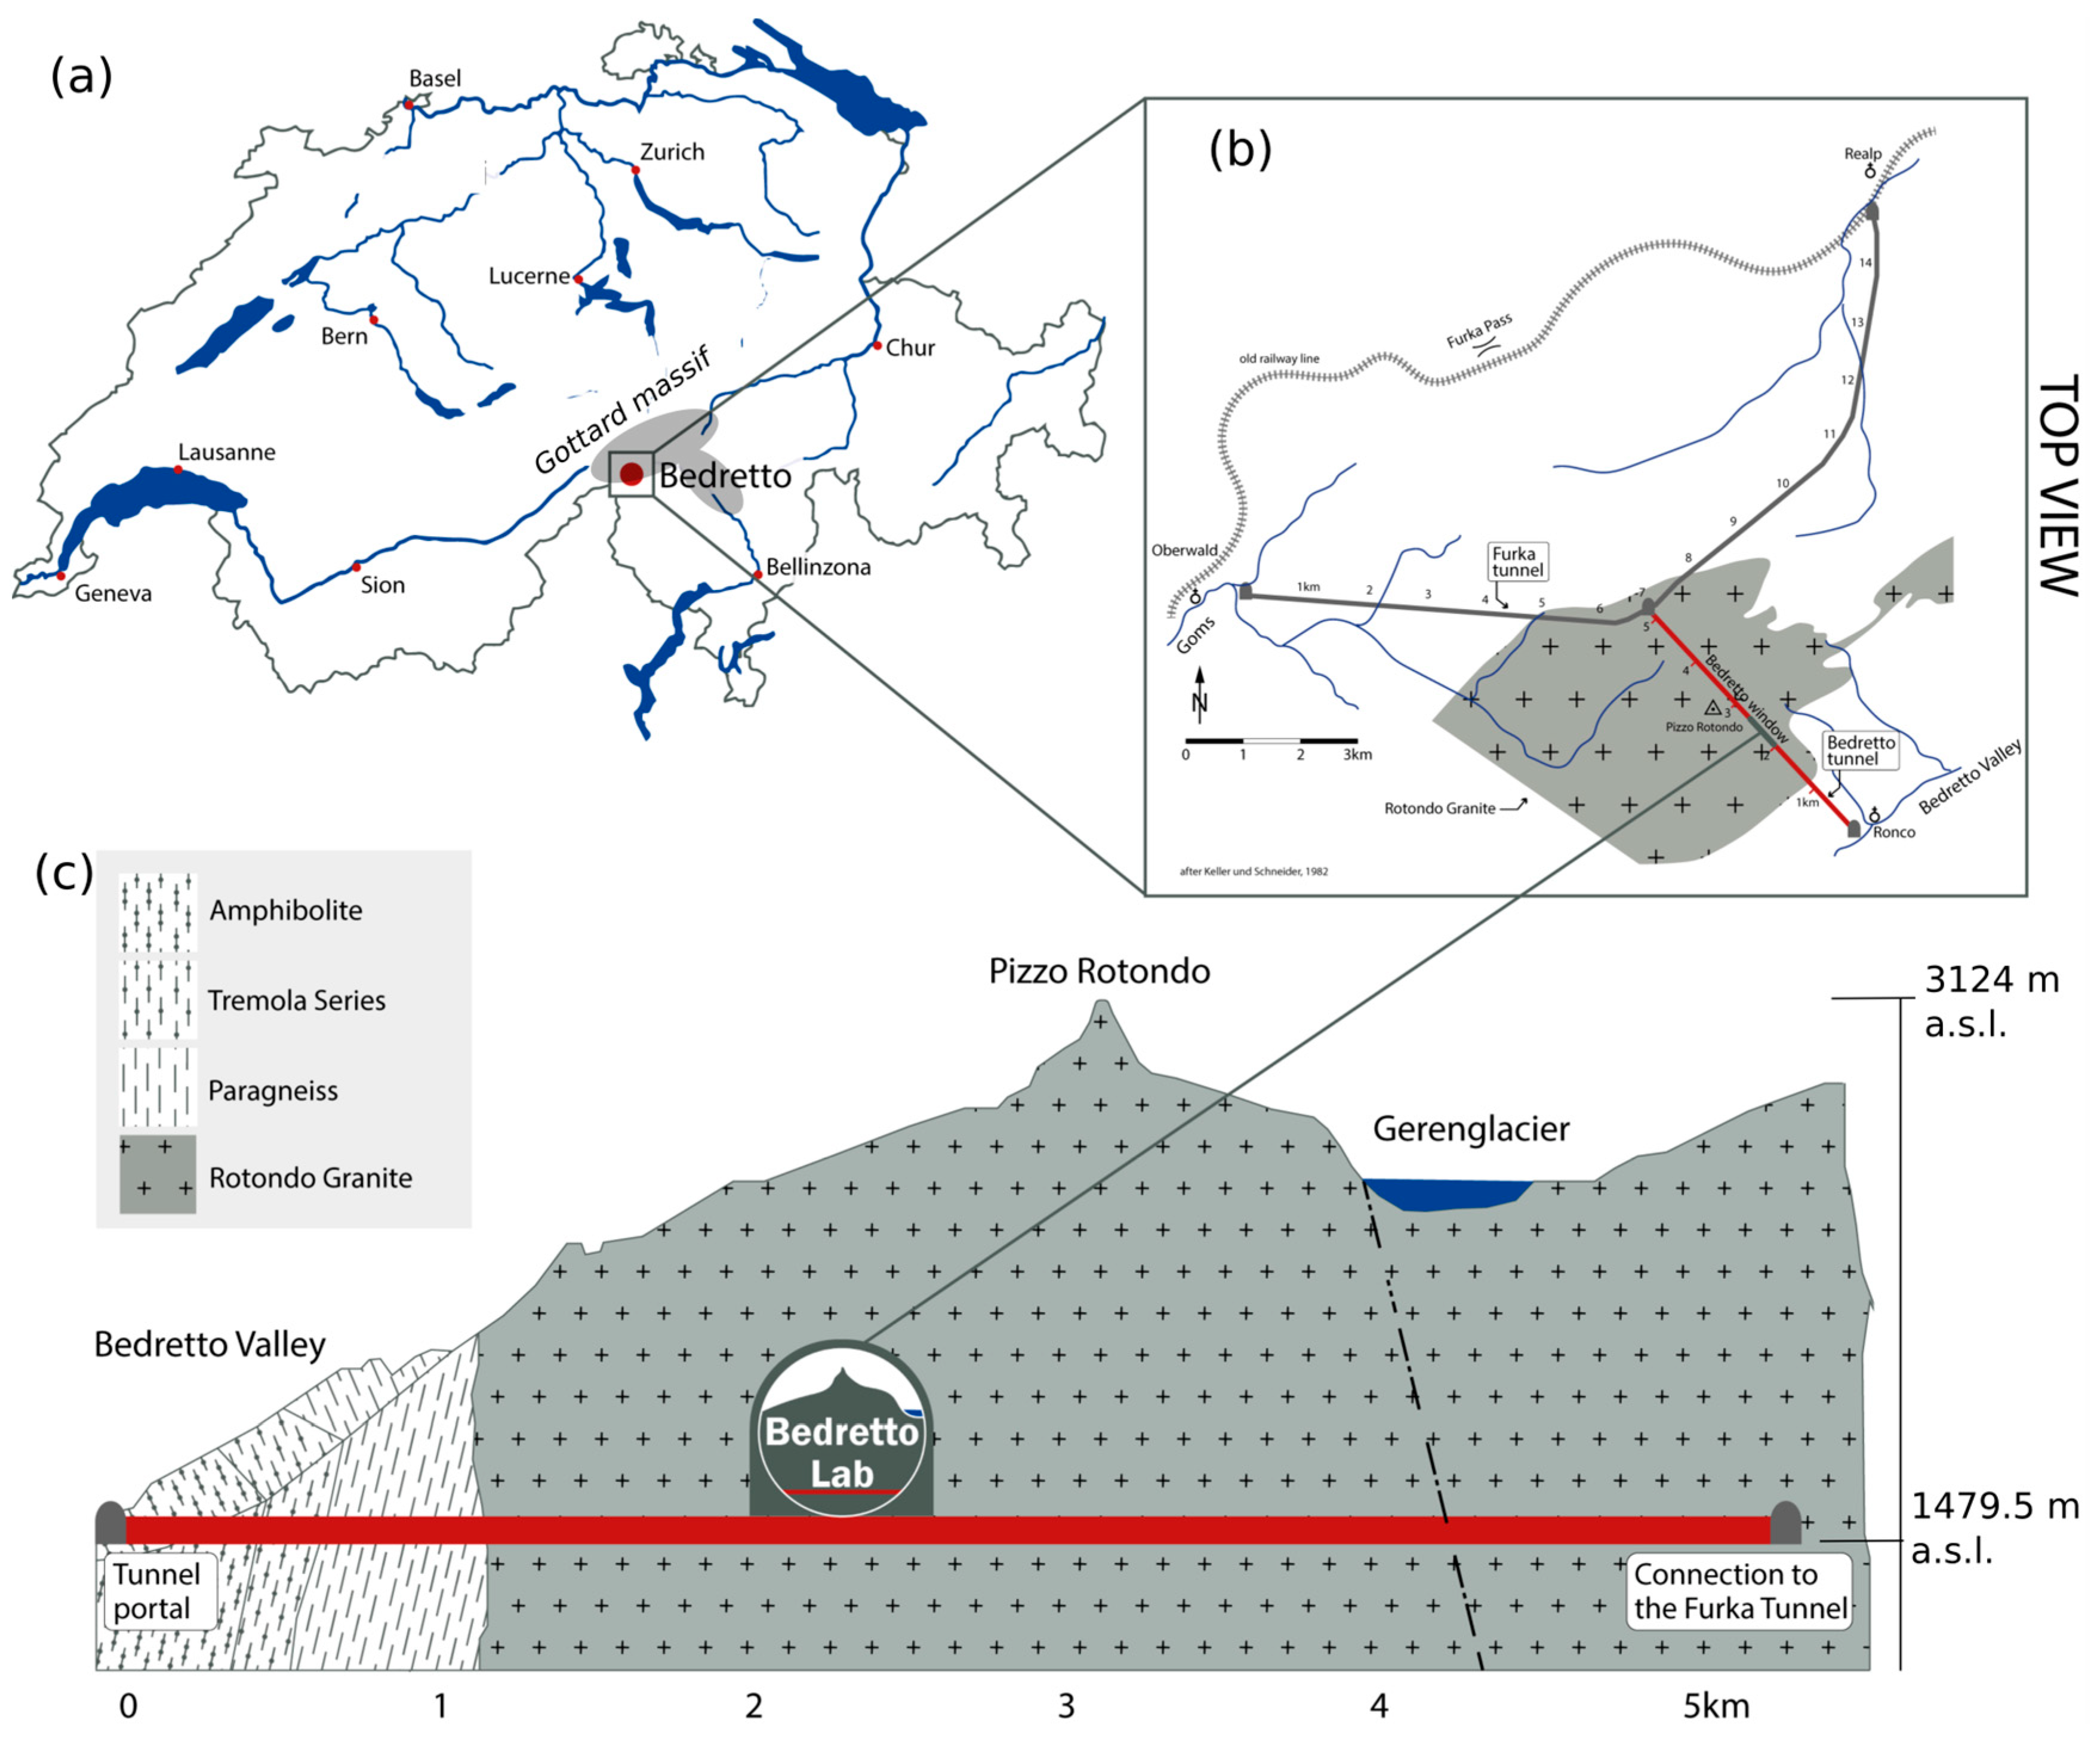
3.1.2. Test Site
3.2. Monitoring Network Design
3.3. Boreholes
3.3.1. Boreholes: Objectives and Requirements
3.3.2. Boreholes: Implementation
3.3.3. Boreholes: Results
3.4. Installation and Guidance System
3.4.1. Installation and Guidance System: Objectives and Requirements
3.4.2. Installation and Guidance System: Implementation
3.4.3. Installation and Guidance System: Results
3.5. Geomechanics
3.5.1. Geomechanics: Objectives and Requirements
3.5.2. Geomechanics: Implementation
3.5.3. Geomechanics: Results
3.6. Seismology
3.6.1. Seismology: Objectives and Requirements
3.6.2. Seismology: Implementation
3.6.3. Seismology: Results
3.7. Active Seismics
3.7.1. Active Seismics: Objectives and Requirements
3.7.2. Active Seismics: Implementation
3.7.3. Active Seismics: Results
3.8. Installation
3.8.1. Installation: Objectives and Requirements
3.8.2. Installation: Implementation
3.9. Cementation
3.9.1. Cementation: Objectives and Requirements
3.9.2. Cementation: Implementation
3.9.3. Cementation: Results
4. Discussion and Conclusions
- Higher uncertainties in borehole geometry and borehole quality due to the higher stresses;
- Difficulties due to borehole roughness to guide instrumentation safely to the anticipated depth without blockage or sensor/cable damage;
- Damage to sensors due to water intrusion and high pressures in long boreholes;
- Sealing the boreholes without unintended channeling, fracturing owing to expanding cement, cement loss, or uncontrolled inflow of mountain water diminishing the cement quality.
- The novel instrumentation setup allowed the installation of different sensors in the same borehole and the combined monitoring of seismo-hydromechanical processes. The monitoring network has been in use since autumn 2021 for a series of stimulation experiments.
- All instruments were successfully brought into the boreholes and to their final position despite substantial breakout zones. Blockage of the system was successfully prevented.
- Boreholes were successfully sealed using a purpose-made slurry. Challenges (10 m sand column in MB3; conductive short-cut between MB1 and ST2) were controlled with LCM cement slurry and sealed off.
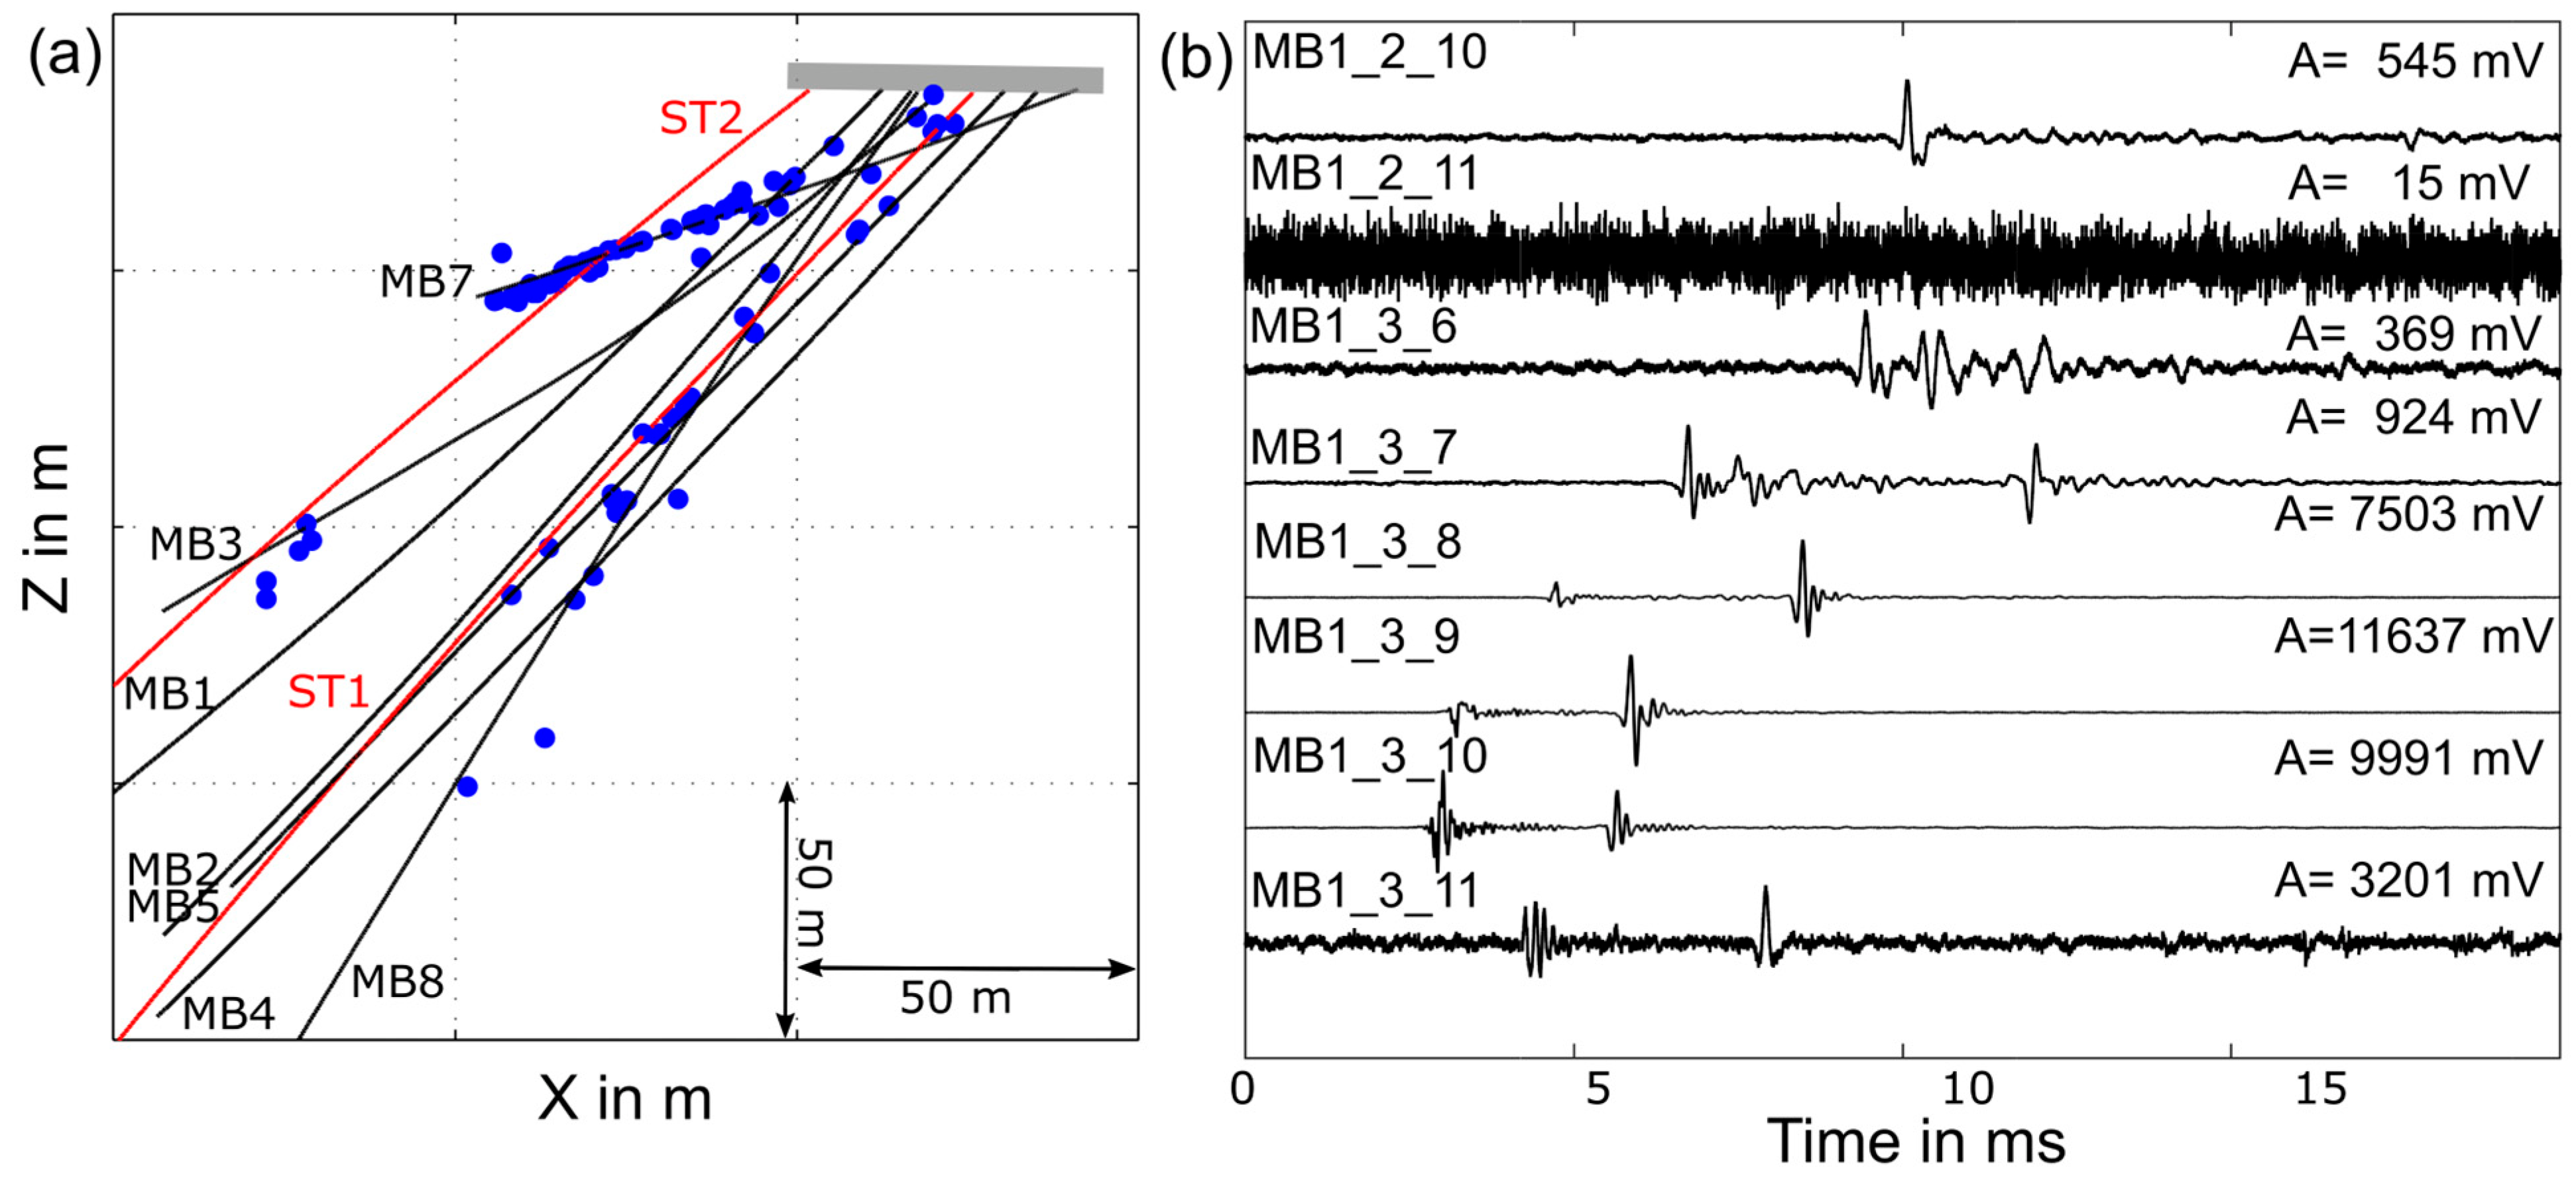
- High-quality data were successfully recorded from each sensor type. The recording goals were reached inside the high-resolution monitoring volume.
- Curvature in borehole trajectories and clogging of boreholes (MB3 and MB4) in later time periods required altering the sensor geometry several times, which was logistically a problem and caused delays.
- While sealing successfully prevented drainage through the boreholes, we observed that some cables caused drainage. Most importantly, the multi-fiber cables used for installing FBGs caused a small amount of water drainage through the interior of the cable. In addition, three coaxial cables of one accelerometer leaked water, while the specially designed multi-coaxial cable remained impermeable. Whether this low-level drainage is influencing the experiments is subject of further investigations.
- A significant number of sensors are not recording data (Table 1). FBG sensors were lost due to damage in cables and seismic sensors failed due to electronics damaged by pressure and humidity. Redundancy in the network design allowed to compensate for broken sensors to some extent and the monitoring goals were achieved within the high-resolution monitoring volume. The monitoring is diminished in the deep parts of the experiment volume owing to broken sensors.
- The overall logistics were challenging. Moreover, individual pieces were handy, the total sum of material added up to several tons, which had to be transported into the tunnel and installed into the borehole by hand.
- Break up of drilling and instrumentation into several campaigns. This allowed us to adjust the borehole geometry and the sensor positions based on logging results and gave us time to react to problems encountered and adjust the plans.
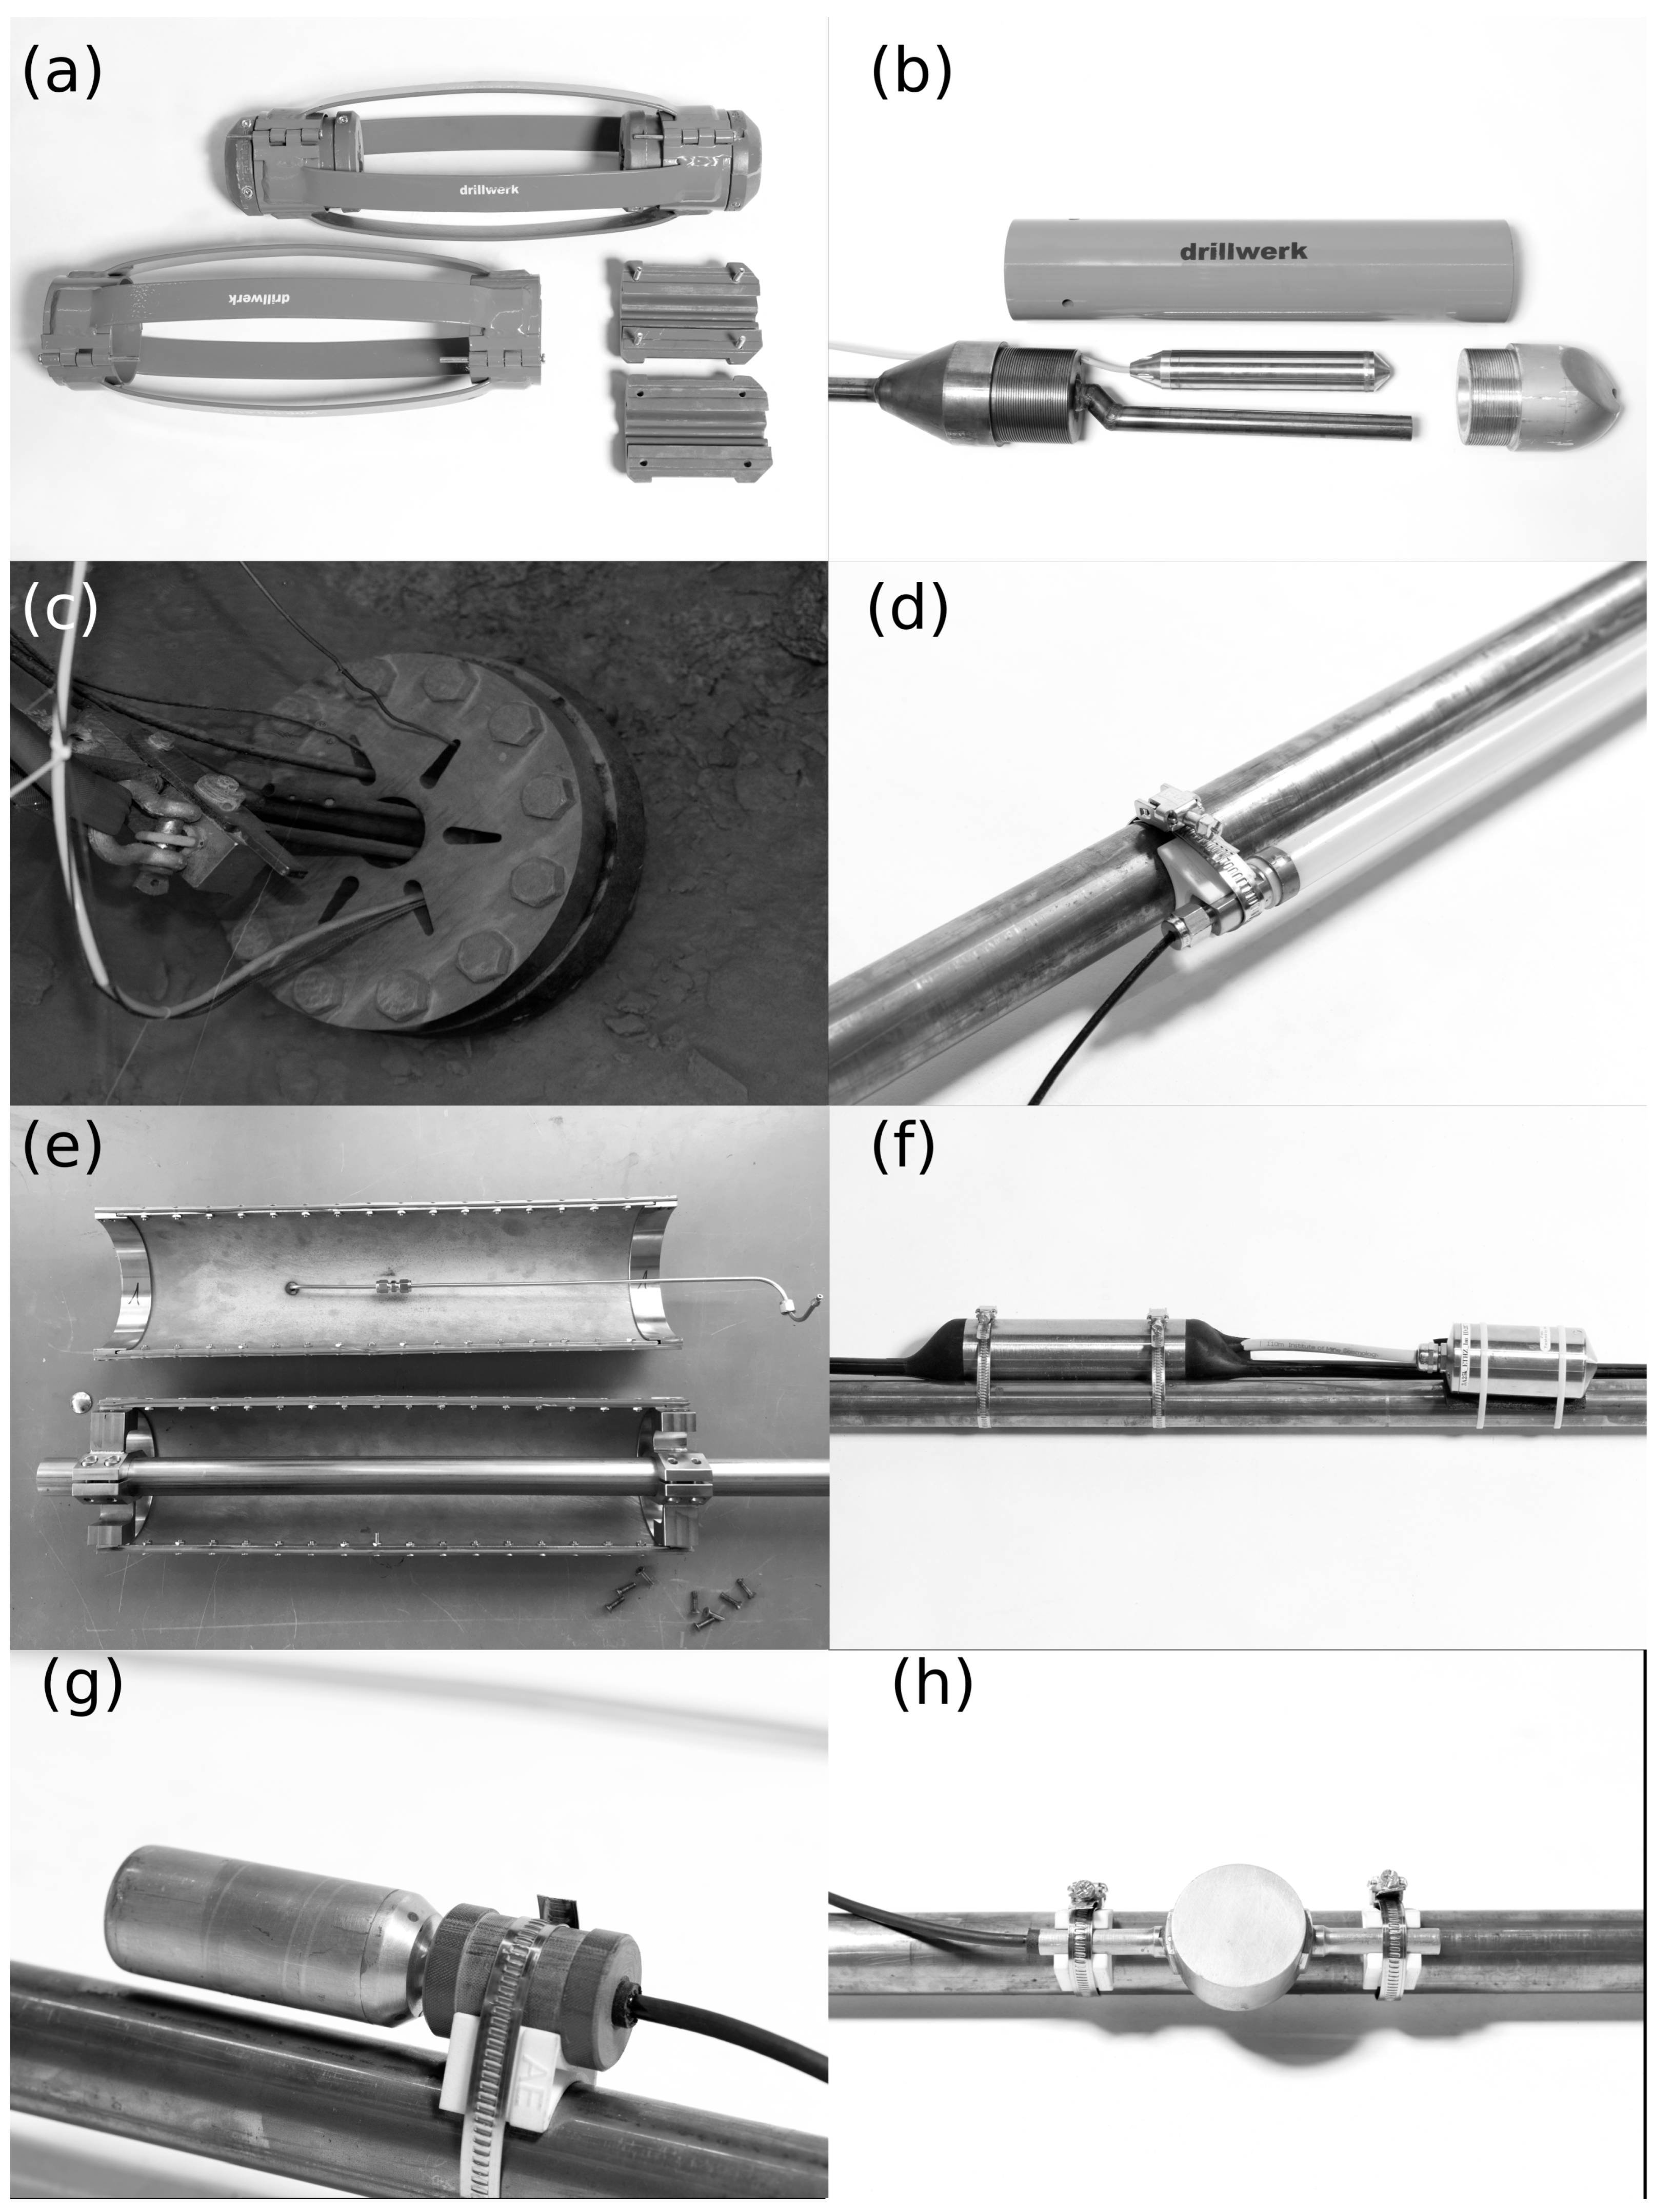
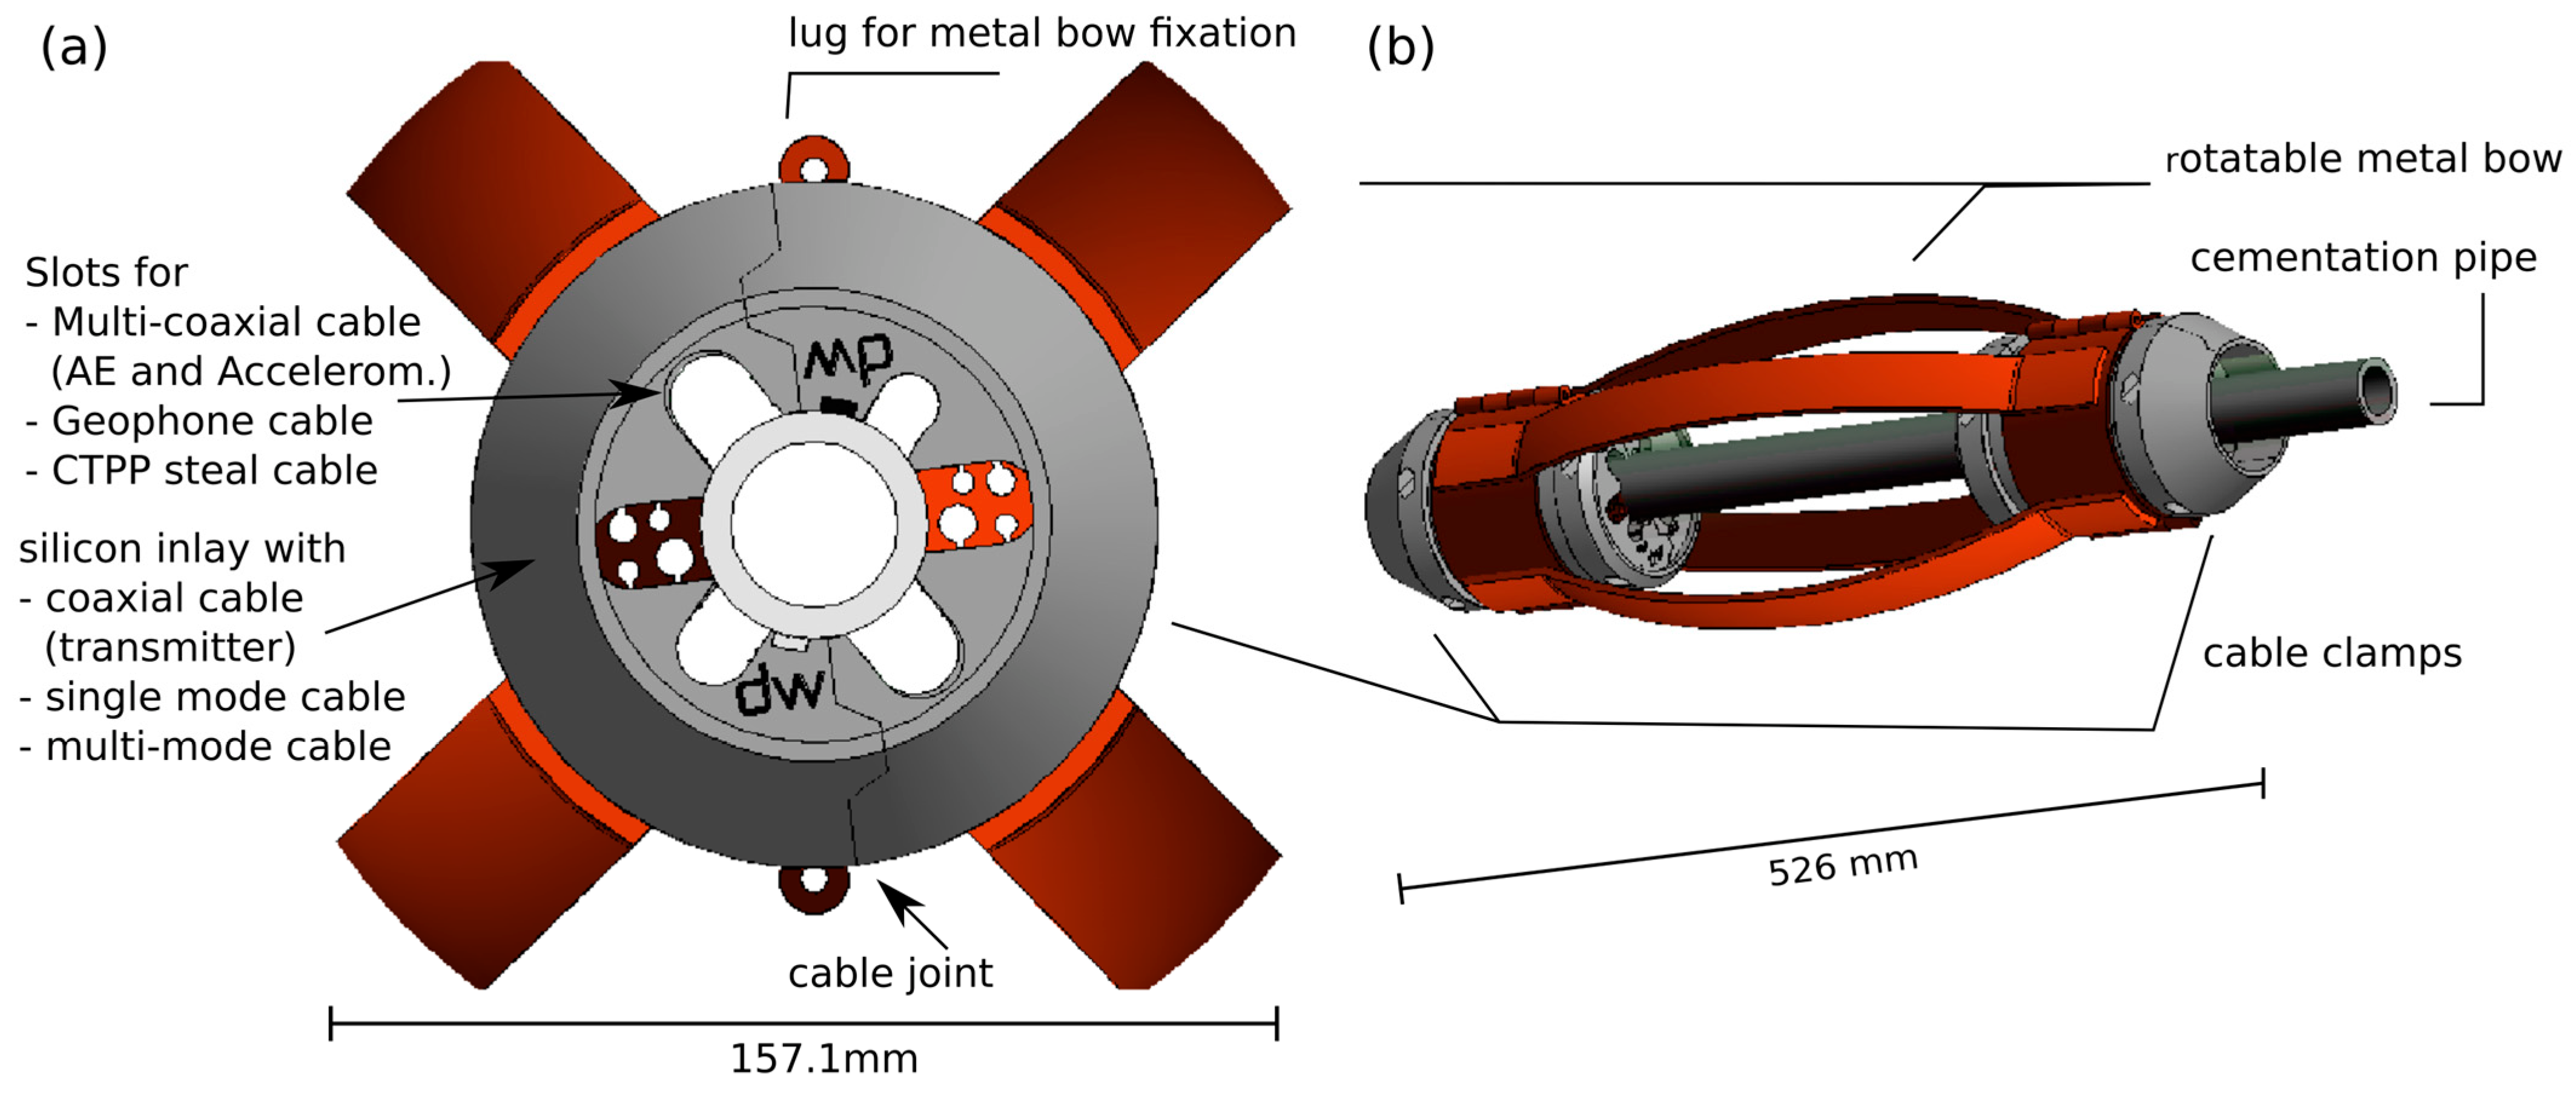
- A centralizer with integrated cable clamp for cable protection and guidance.
- Individual design of the cementing operations for each borehole to address borehole-specific difficulties and the sealing of loss zones.
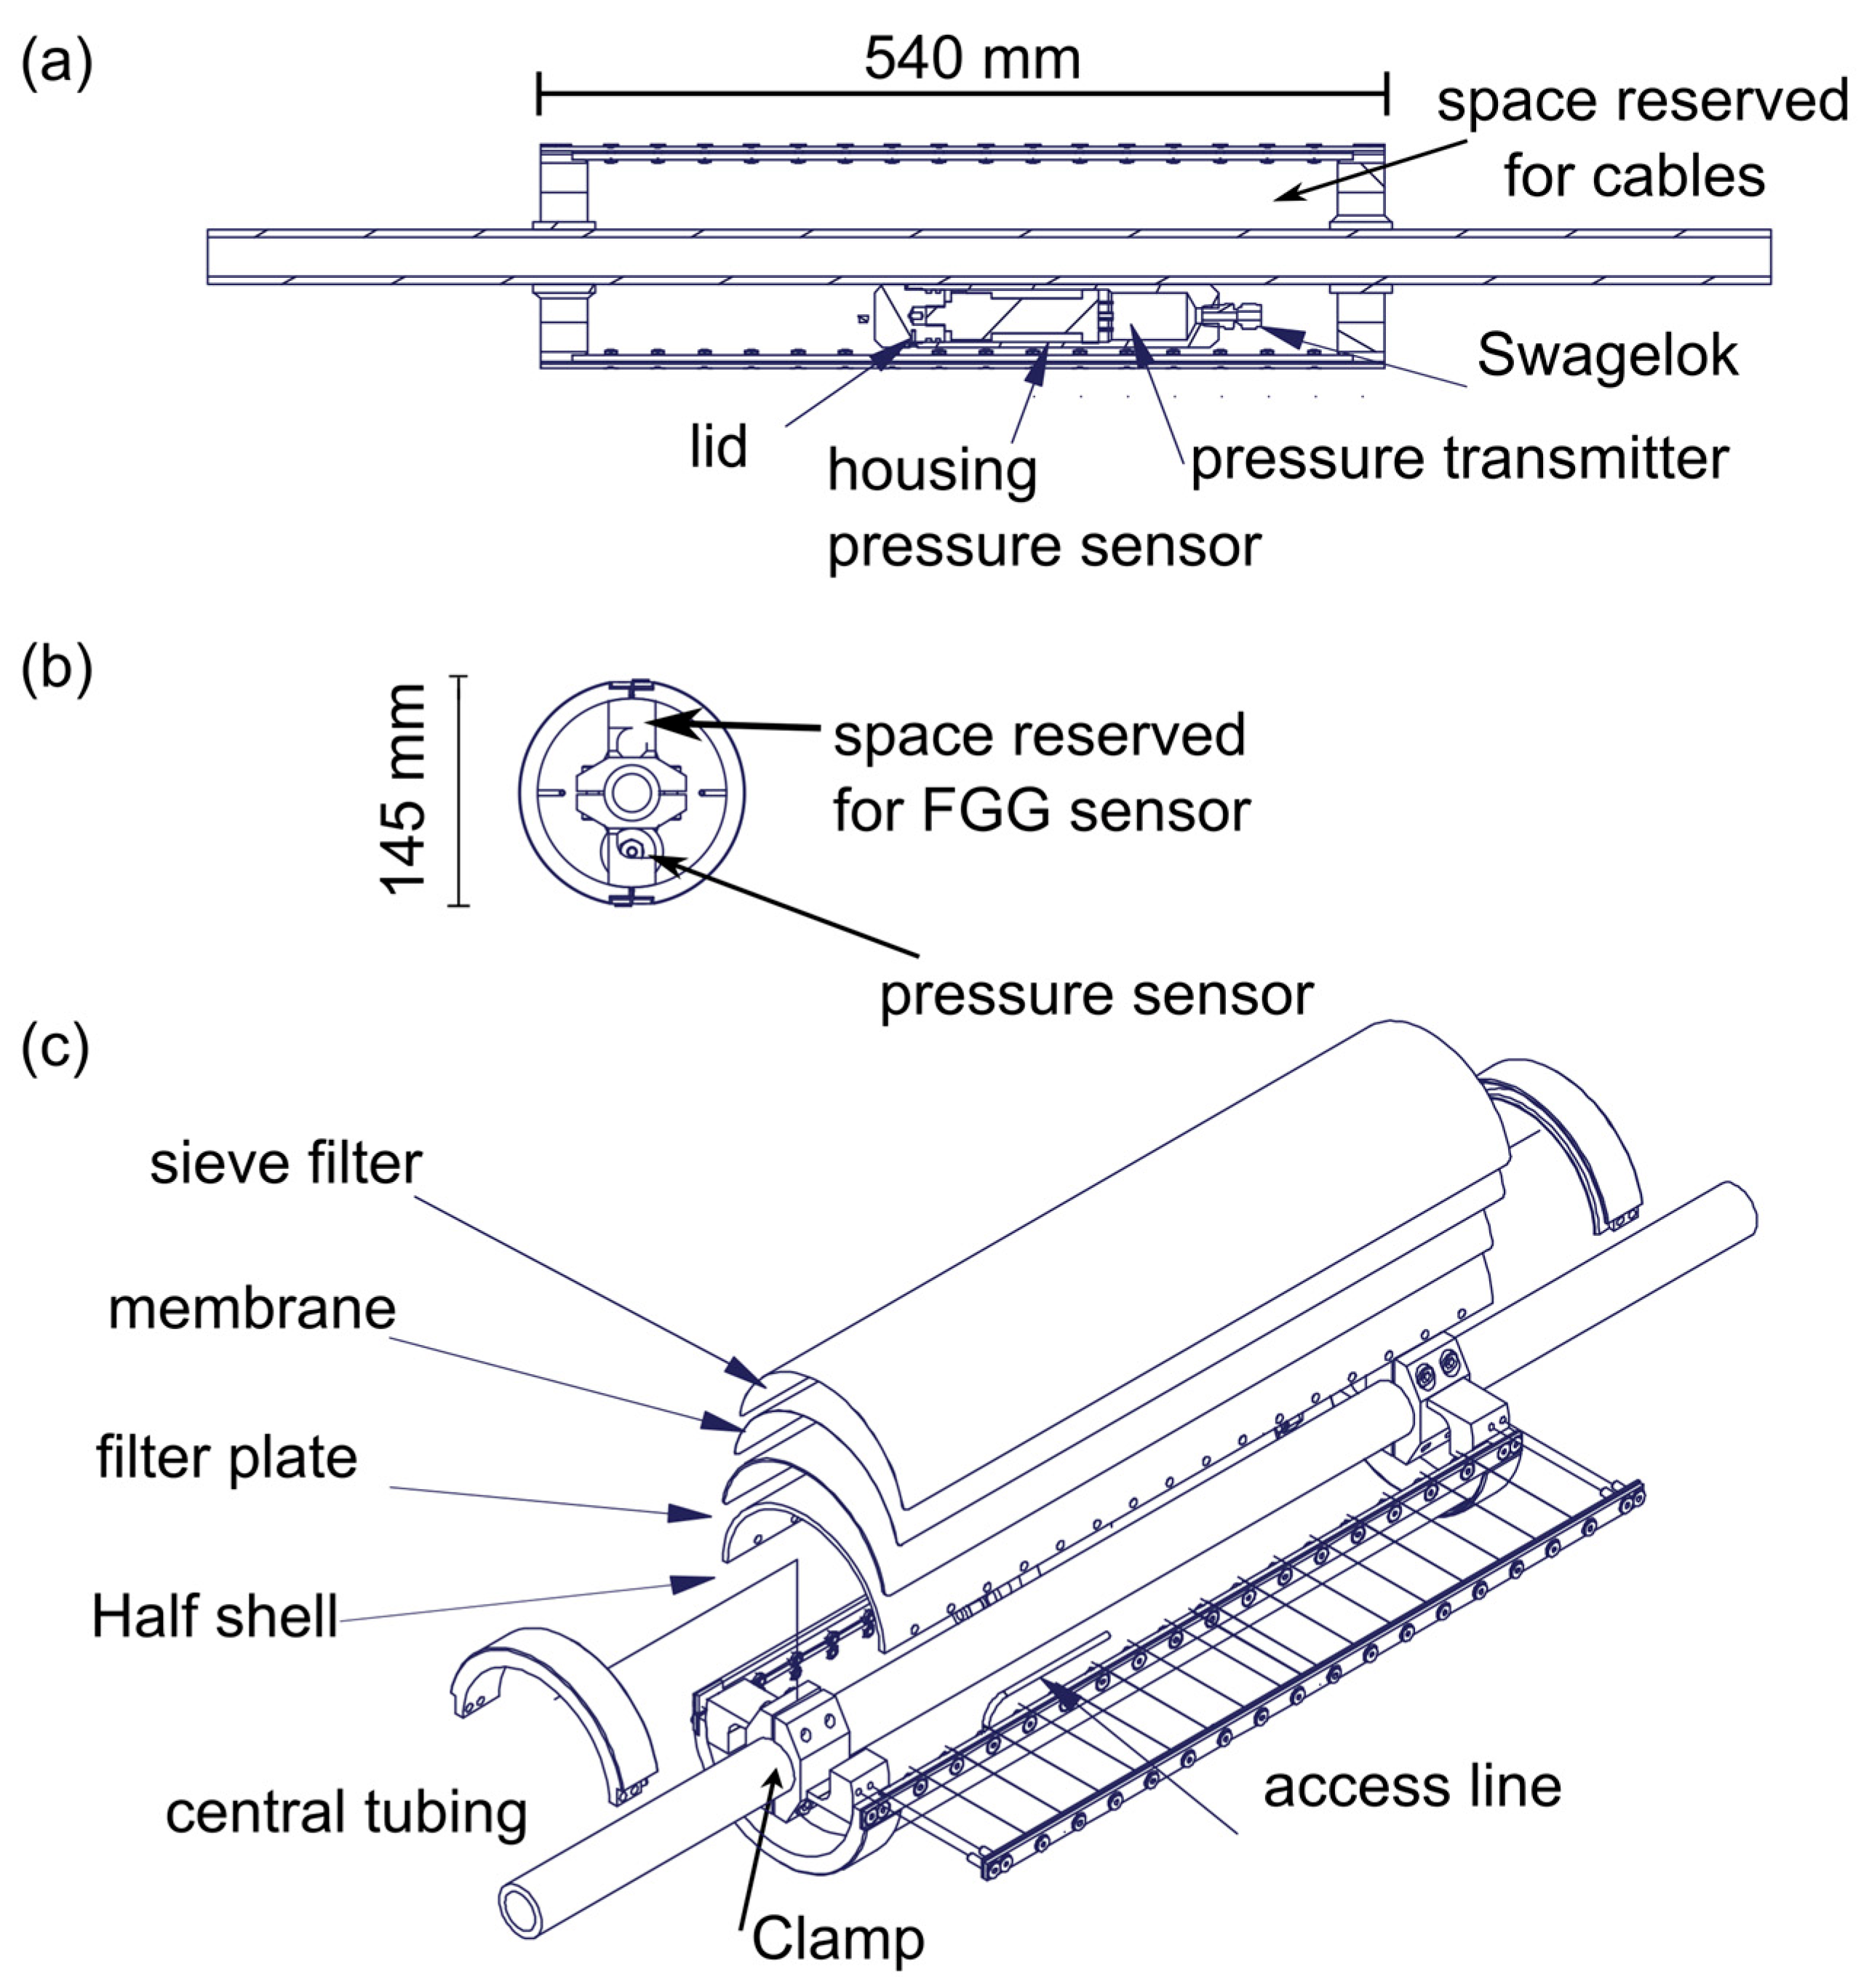
- Cementable tube pore pressure sensor, for true pore pressure measurements in cemented boreholes and simultaneous installation with FBG sensors.
Author Contributions
Funding
Institutional Review Board Statement
Informed Consent Statement
Data Availability Statement
Acknowledgments
Conflicts of Interest
References
- Young, R.P.; Hazzard, J.F.; Pettitt, W.S. Seismic and Micromechanical Studies of Rock Fracture. Geophys. Res. Lett. 2000, 27, 1767–1770. [Google Scholar] [CrossRef]
- Ogasawara, H. The Research Group for Semi-Controlled Earthquake-Generation Experiments in South African Deep Gold Mines. Monitoring of Rock Mass Behavior at the Closest Proximity to Hypocenters in South African Gold Mines. Sci. Drill. 2007, 88–91, Special Issue. [Google Scholar] [CrossRef]
- Reches, Z. The DAFSAM and NELSAM Teams Building a Natural Earthquake Laboratory at Focal Depth (DAFSAM-NELSAM Project, South Africa). Sci. Drill. 2006, 3, 30–33. [Google Scholar] [CrossRef]
- Plenkers, K.; Kwiatek, G.; Nakatani, M.; Dresen, G.; The JAGUARS Group. Observation of Seismic Events with Frequencies f > 25 kHz at Mponeng Gold Mine, South Africa. Seism. Res. Lett. 2010, 81, 467–479. [Google Scholar] [CrossRef]
- Yabe, Y.; Nakatani, M.; Naoi, M.; Philipp, J.; Janssen, C.; Watanabe, T.; Katsura, T.; Kawakata, H.; Georg, D.; Ogasawara, H. Nucleation Process of an M2 Earthquake in a Deep Gold Mine in South Africa Inferred from On-Fault Foreshock Activity: On-Fault Foreshocks of M2 Earthquake. J. Geophys. Res. Solid Earth 2015, 120, 5574–5594. [Google Scholar] [CrossRef] [Green Version]
- Pettit, W.S.; Baker, C.; Young, R.P. Using Acoustic Emission for Assessment of Damage in Rock around Engineered Structures at the Äspö Hard Rock Laboratory. In Proceedings of the 5th North American Rock Mechanics Symposium, Toronto, ON, Canada, 7–10 July 2002. [Google Scholar]
- Popp, T.; Minkley, W.; Wiedemann, M.; Salzer, K.; Doerner, D. Gas Pressure Effects on Salt—The Large Scale In-Situ Test Merkers. In Mechanical Behavior of Salt VIII; Balkema, Taylor Francis Group: London, UK, 2015; pp. 127–136. ISBN 978-1-315-67885-6. [Google Scholar]
- Müller, H.R.; Garitte, B.; Vogt, T.; Köhler, S.; Sakaki, T.; Weber, H.; Spillmann, T.; Hertrich, M.; Becker, J.K.; Giroud, N.; et al. Implementation of the Full-Scale Emplacement (FE) Experiment at the Mont Terri Rock Laboratory. Swiss J. Geosci. 2017, 110, 287–306. [Google Scholar] [CrossRef] [Green Version]
- Butt, S.D.; Mukherjee, C.; Lebans, G. Evaluation of Acoustic Attenuation as an Indicator of Roof Stability in Advancing Headings. Int. J. Rock Mech. Min. Sci. 2000, 37, 1123–1131. [Google Scholar] [CrossRef]
- Manthei, G.; Plenkers, K. Review on In Situ Acoustic Emission Monitoring in the Context of Structural Health Monitoring in Mines. Appl. Sci. 2018, 8, 1595. [Google Scholar] [CrossRef] [Green Version]
- Guglielmi, Y.; Cappa, F.; Avouac, J.-P.; Henry, P.; Elsworth, D. Seismicity Triggered by Fluid Injection–Induced Aseismic Slip. Science 2015, 348, 1224–1226. [Google Scholar] [CrossRef] [Green Version]
- Zang, A.; Stephansson, O.; Stenberg, L.; Plenkers, K.; Specht, S.; Milkereit, C.; Schill, E.; Kwiatek, G.; Dresen, G.; Zimmermann, G.; et al. Hydraulic Fracture Monitoring in Hard Rock at 410 m Depth with an Advanced Fluid-Injection Protocol and Extensive Sensor Array. Geophys. J. Int. 2017, 208, 790–813. [Google Scholar] [CrossRef] [Green Version]
- Amann, F.; Gischig, V.; Evans, K.; Doetsch, J.; Jalali, R.; Valley, B.; Krietsch, H.; Dutler, N.; Villiger, L.; Brixel, B.; et al. The Seismo-Hydromechanical Behavior during Deep Geothermal Reservoir Stimulations: Open Questions Tackled in a Decameter-Scale In Situ Stimulation Experiment. Solid Earth 2018, 9, 115–137. [Google Scholar] [CrossRef] [Green Version]
- Kneafsey, T.J.; Dobson, P.F.; Ajo-Franklin, J.B.; Guglielmi, Y.; Valladao, C.A.; Blankenship, D.A.; Schwering, P.C.; Knox, H.A.; White, M.D.; Johnson, T.C.; et al. EGS Collab Project: Status, Tests, and Data; Lawrence Berkeley National Laboratory: Berkeley, CA, USA, 2019. [Google Scholar]
- Boese, C.M.; Kwiatek, G.; Fischer, T.; Plenkers, K.; Starke, J.; Blümle, F.; Janssen, C.; Dresen, G. Seismic Monitoring of the STIMTEC Hydraulic Stimulation Experiment in Anisotropic Metamorphic Gneiss. Solid Earth 2022, 13, 323–346. [Google Scholar] [CrossRef]
- Gischig, V.S.; Giardini, D.; Amann, F.; Hertrich, M.; Krietsch, H.; Loew, S.; Maurer, H.; Villiger, L.; Wiemer, S.; Bethmann, F.; et al. Hydraulic Stimulation and Fluid Circulation Experiments in Underground Laboratories: Stepping up the Scale towards Engineered Geothermal Systems. Geomech. Energy Environ. 2020, 24, 100175. [Google Scholar] [CrossRef]
- Zhang, S.; Ma, X.; Bröker, K.; van Limborgh, R.; Wenning, Q.; Hertrich, M.; Giardini, D. Fault Zone Spatial Stress Variations Revealed by Breakout Observations within an Array of Boreholes Penetrating a Granitic Rock Mass. J. Geophy. Res. Solid Earth 2023. submitted. [Google Scholar]
- Ogasawara, H.; Takeuchi, J.; Shimoda, N.; Nakatani, M.; Kato, A.; Iio, Y.; Kawakata, H.; Yamada, T.; Yamauchi, T.; Ishii, H.; et al. Multidisciplinary Monitoring of the Entire Life Span of an Earthquake in South African Gold Mines. In Proceedings of the RaSiM6: Proceedings of the Sixth International Symposium on Rockburst and Seismicity in Mines Proceedings, Perth, Australia, 9–11 March 2005; Potvin, Y., Hudyma, M., Eds.; Australian Centre for Geomechanics: Perth, Australia, 2005; pp. 393–398. [Google Scholar]
- Krietsch, H.; Gischig, V.S.; Doetsch, J.; Evans, K.F.; Villiger, L.; Jalali, M.; Valley, B.; Löw, S.; Amann, F. Hydromechanical Processes and Their Influence on the Stimulation Effected Volume: Observations from a Decameter-Scale Hydraulic Stimulation Project. Solid Earth 2020, 11, 1699–1729. [Google Scholar] [CrossRef]
- Kwiatek, G.; Martínez-Garzón, P.; Plenkers, K.; Leonhardt, M.; Zang, A.; von Specht, S.; Dresen, G.; Bohnhoff, M. Insights Into Complex Subdecimeter Fracturing Processes Occurring during a Water Injection Experiment at Depth in Äspö Hard Rock Laboratory, Sweden. J. Geophys. Res. Solid Earth 2018, 123, 6616–6635. [Google Scholar] [CrossRef] [Green Version]
- Niemz, P.; Cesca, S.; Heimann, S.; Grigoli, F.; von Specht, S.; Hammer, C.; Zang, A.; Dahm, T. Full-Waveform-Based Characterization of Acoustic Emission Activity in a Mine-Scale Experiment: A Comparison of Conventional and Advanced Hydraulic Fracturing Schemes. Geophys. J. Int. 2020, 222, 189–206. [Google Scholar] [CrossRef]
- Villiger, L.; Gischig, V.S.; Doetsch, J.; Krietsch, H.; Dutler, N.O.; Jalali, M.; Valley, B.; Selvadurai, P.A.; Mignan, A.; Plenkers, K.; et al. Influence of Reservoir Geology on Seismic Response during Decameter-Scale Hydraulic Stimulations in Crystalline Rock. Solid Earth 2020, 11, 627–655. [Google Scholar] [CrossRef]
- Schoenball, M.; Ajo-Franklin, J.B.; Blankenship, D.; Chai, C.; Chakravarty, A.; Dobson, P.; Hopp, C.; Kneafsey, T.; Knox, H.A.; Maceira, M. Creation of a Mixed-Mode Fracture Network at Mesoscale through Hydraulic Fracturing and Shear Stimulation. JGR Solid Earth 2020, 125. [Google Scholar] [CrossRef]
- Ellsworth, W.L. Injection-Induced Earthquakes. Science 2013, 341, 1225942. [Google Scholar] [CrossRef]
- McGarr, A. Maximum Magnitude Earthquakes Induced by Fluid Injection: Limits on Fluid Injection Earthquakes. J. Geophys. Res. Solid Earth 2014, 119, 1008–1019. [Google Scholar] [CrossRef]
- Kwiatek, G.; Saarno, T.; Ader, T.; Bluemle, F.; Bohnhoff, M.; Chendorain, M.; Dresen, G.; Heikkinen, P.; Kukkonen, I.; Leary, P.; et al. Controlling Fluid-Induced Seismicity during a 6.1-Km-Deep Geothermal Stimulation in Finland. Sci. Adv. 2019, 5, eaav7224. [Google Scholar] [CrossRef] [Green Version]
- Manthei, G.; Eisenblätter, J.; Dahm, T. Moment Tensor Evaluation of Acoustic Emission Sources in Salt Rock. Constr. Build. Mater. 2001, 15, 297–309. [Google Scholar] [CrossRef]
- Gischig, V.S.; Doetsch, J.; Maurer, H.; Krietsch, H.; Amann, F.; Evans, K.F.; Nejati, M.; Jalali, M.; Valley, B.; Obermann, A.C.; et al. On the Link between Stress Field and Small-Scale Hydraulic Fracture Growth in Anisotropic Rock Derived from Microseismicity. Solid Earth 2018, 9, 39–61. [Google Scholar] [CrossRef] [Green Version]
- Fu, P.; Schoenball, M.; Ajo-Franklin, J.B.; Chai, C.; Maceira, M.; Morris, J.P.; Wu, H.; Knox, H.; Schwering, P.C.; White, M.D.; et al. Close Observation of Hydraulic Fracturing at EGS Collab Experiment 1: Fracture Trajectory, Microseismic Interpretations, and the Role of Natural Fractures. JGR Solid Earth 2021, 126. [Google Scholar] [CrossRef]
- Schneider, T.R. Basistunnel Furka—Geologische Aufnahme des Fensters Bedretto; 1985. [Google Scholar]
- Ma, X.; Hertrich, M.; Amann, F.; Bröker, K.; Gholizadeh Doonechaly, N.; Gischig, V.; Hochreutener, R.; Kästli, P.; Krietsch, H.; Marti, M.; et al. Multi-Disciplinary Characterizations of the BedrettoLab—A New Underground Geoscience Research Facility. Solid Earth 2022, 13, 301–322. [Google Scholar] [CrossRef]
- Wiemer, S.; Kremer, K.; Edwards, B.; Cauzzi, C.; Wössner, J.; Fäh, D.; Kästli, P.; Danciu, L.; Hiemer, S. Seismic Hazard Model 2015 for Switzerland (SUIhaz2015). 2016. [Google Scholar] [CrossRef]
- Husen, S.; Kissling, E.; von Deschwanden, A. Induced Seismicity during the Construction of the Gotthard Base Tunnel, Switzerland: Hypocenter Locations and Source Dimensions. J. Seismol. 2012, 16, 195–213. [Google Scholar] [CrossRef] [Green Version]
- Krietsch, H.; Gischig, V.; Jalali, R.; Doetsch, J.; Valley, B.; Amann, F. A Comparison of FBG- and Brillouin-Strain Sensing in the Framework of a Decameter-Scale Hydraulic Stimulation Experiment. In Proceedings of the 52nd U.S. Rock Mechanics/Geomechanics Symposium, Seattle, WA, USA, 17–20 June 2018. ARMA 18-0800. [Google Scholar]
- Gholizadeh Doonechaly, N.; Reinicke, A.; Hertrich, M.; Plenkers, K.; Obermann, A.C.; Fischli, F.; Maurer, H.; Wiemer, S.; Giardini, D. Multiphysics Monitoring of Cementation Operation: Implications for Wellbore Integrity and Hydrogeological Characterization. Environ. Earth Sci. (under-review).
- Gischig, V.; Bethmann, F.; Hertrich, M.; Wiemer, S.; Mignan, A.; Broccardo, M.; Villiger, L.; Obermann, A.; Diehl, T. Induced Seismic Hazard and Risk Analysis of Hydraulic Stimulation Experiments at the Bedretto Underground Laboratory for Geosciences and Geoenergies (BULGG); ETH Zurich, Swiss Competence Center for Energy Research—Supply of Electricity (SCCER-SoE): Zurich, Switzerland, 2019. [Google Scholar] [CrossRef]
- Diehl, T.; Clinton, J.; Cauzzi, C.; Kraft, T.; Kästli, P.; Deichmann, N.; Massin, F.; Grigoli, F.; Molinari, I.; Böse, M.; et al. Earthquakes in Switzerland and Surrounding Regions during 2017 and 2018. Swiss J. Geosci. 2021, 114, 4. [Google Scholar] [CrossRef]
- Marelli, S.; Manukyan, E.; Maurer, H.; Greenhalgh, S.A.; Green, A.G. Appraisal of Waveform Repeatability for Crosshole and Hole-to-Tunnel Seismic Monitoring of Radioactive Waste Repositories. Geophysics 2010, 75, Q21–Q34. [Google Scholar] [CrossRef]
- Plenkers, K.; Manthei, G.; Kwiatek, G. Underground In-Situ Acoustic Emission in Study of Rock Stability and Earthquake Physics. In Acoustic Emission Testing; Grosse, C.U., Ohtsu, M., Aggelis, D.G., Shiotani, T., Eds.; Springer Tracts in Civil Engineering; Springer International Publishing: New York, NY, USA, 2022; pp. 403–476. ISBN 978-3-030-67935-4. [Google Scholar]
- Ohtsu, M.; Aggelis, D.G. Sensors and Instruments. In Acoustic Emission Testing; Springer: Cham, Switzerland, 2022; pp. 21–44. ISBN 978-3-030-67936-1. [Google Scholar]
- Plenkers, K. On the Characteristics of Mining-Induced Seismicity with Magnitudes -5 < Mw < -1 2010. Ph.D. Thesis, 2010. Available online: https://gfzpublic.gfz-potsdam.de/pubman/faces/ViewItemFullPage.jsp?itemId=item_244426_1 (accessed on 13 December 2022).
- Kwiatek, G.; Plenkers, K.; Dresen, G.; JAGUARS Research Group. Source Parameters of Picoseismicity Recorded at Mponeng Deep Gold Mine, South Africa: Implications for Scaling Relations. Bull. Seismol. Soc. Am. 2011, 101, 2592–2608. [Google Scholar] [CrossRef]


| Sensors | No. | Monitoring Borehole | Sensor Length in mm | Sensor Diameter in mm | Custom Made |
|---|---|---|---|---|---|
| Rod System | |||||
| Central pipe | 763 | 1, 3, 4, 5, 7, 8 | 3000 | 33.7 | Yes |
| Centralizer | >800 | 1, 3, 4, 5, 7, 8 | 526 | 157.1 | Yes |
| Frontshoe | 6 | 1, 3, 4, 5, 7, 8 | 955 | 141.3 | Yes |
| Endpacker | 3 | 1, 3, 4 | 1490.5 | 168 | Yes |
| Multipacker | 7 (6) | 2 | 1000 | 88 | Yes |
| Seismology | |||||
| Geophone | 6 (5) | 1, 3, 4, 5, 7, 8 | 350 | 56 | Yes |
| Wilcoxon acc. | 4 (2) | 1, 4, 5, 7 | 110 | 49.9 | Yes |
| Endevco acc. | 3 (3) | 1, 3, 4 | 110 | 49.9 | Yes |
| AE sensor | 60 (38) | 1, 3, 4, 5, 7, 8 | 117 | 30 | Yes |
| Geomechanics | |||||
| Pressure sensor | 7 (6) | 2 | 110 | 30 | No |
| CTPP | 4 (4) | 5, 8 | 540 | 145 (123) | Yes |
| FBG | 70 (58) | 1, 5, 7, 8 | 1070 | 17.5 | No |
| Fiber-optic cable | full length | 1, 3, 4, 5, 7, 8 | - | - | No |
| Ap. Geophysics | |||||
| Ult. transmitter | 12 (12) | 1, 3, 4, 5, 7, 8 | 100 | 50/70 | Yes |
| Borehole | Length in m | Mean Azimuth | Mean Dip | Max. Deviation in m | Distance to STI11 in m | Borehole Diam. in mm |
|---|---|---|---|---|---|---|
| ST1 | 404.8 | 227.10 | 49.15 | 20.9 | - | 216 |
| ST2 | 350.9 | 224.68 | 41.79 | 25.1 | 32.9–47.0 | 216 |
| MB1 | 304.2 | 227.56° | 40.3 | 24.4 | 19.9–45.4 | 165 |
| MB2 | 221.7 | 227.66 | 48.0 | 7.7 | 13.4–16.5 | 101 |
| MB3 | 189.6 | 225.84 | 32.56 | 24.8 | 6.7–45.3 | 165 |
| MB4 | 253.3 | 226.46 | 45.43 | 15.5 | 12.8–16.3 | 165 |
| MB5 | 221.8 | 225.63 | 44.42 | 9.4 | 6.3–13.4 | 165 |
| MB7 | 101.1 | 252.11 | 23.62 | 11.2 | 13.2–35.7 | 165 |
| MB8 | 252.0 | 219.36 | 52.41 | 12.9 | 11.1–25.6 | 165 |
| Sensor | Sensor Type | Manu-Facturer | Frequency Range in Hz | Digitizer | Location | |
|---|---|---|---|---|---|---|
| Regional Seismology | STS2 | Broadband Seismometer | Quanterra | 0.08–50 | Nanometri. Centaur | Tunnel |
| Strong Motion Seism. | Episensor | Accelero-meter | Kinematrics | DC-200 | Nanometri. Centaur | Tunnel |
| Microseismicity | MBAS Single | 227.56° | Geotomog. | 100–1000 | Nanometri. | 5 m boreh. |
| GS-100 Hz | 227.66 | IMS | 100–1000 | Centaur | MB | |
| PSS-56 | 225.84 | Avalon | 15–1600 | MB | ||
| Nano-seismicity | ACC-3A25 | Piezoelec. Accelerom. | IMS | 50–25,000 | GMuG | MB |
| ACC-45A19 | 50–6000 | AEsystem | MB | |||
| Pico-seismicity | GMuG-Ma-Blc-30–35 | AE Sensor | GMuG | 1000–50,000 | GMuG AEsystem | MB |
| w/c | Bentonite | UW Compound | Sikament S12 | Density in g/cm3 | Thicken. Time | Marsh Funnel t | Viscosity in cP * | Free Water in vol% | P Loss ** in kPa/m | |
|---|---|---|---|---|---|---|---|---|---|---|
| Slurry 0 (base line) | 0.6 | - | - | - | 1.57 | >6 h | 45 s | 33 | Not measured | 2.8 |
| Slurry 1 | 0.5 | - | - | 0.8 wt% | 1.63 | >6 h | 44 s | 32 | 10 | - |
| Slurry 2 | 0.5 | 0.5 wt% | - | 1.0 wt% | 1.52 | 6 h | 47 s | 36 | 1.5 | 3.4 |
| Slurry 3 | 0.5 | 0.4 wt% | 0.4 wt% | 1.7 wt% | 1.72 | >4 h | 105 s | 130 | 0.0 | 5.3 |
| Slurry 4 | 0.5 | 0.6 wt% | 0.7 wt% | 1.2 wt% | 1.8 | >4 h | 140 s | 200 | 0.0 | 20.3 |
| Borehole | Pre-Lead Slurry | Lead Slurry | Tail Slurry | Excess Volume |
|---|---|---|---|---|
| MB3 | 200 l UW cement * | 1000 l Slurry 4 + LCM | 3000 l Slurry 3 | 800 l Slurry 3 |
| MB4 | - | 1000 l Slurry 4 + LCM | 4500 l Slurry 3 | 1000 l Slurry 3 |
| MB1 ** | - | 2600 l Slurry 4 + LCM | 2000 l Slurry 3 | 2400 l Slurry 4 + LCM |
| MB7 | - | - | 2000 l Slurry 3 | 700 l Slurry 3 |
| MB5 | - | 2000 l Slurry 4 + LCM | 2100 l Slurry 3 | 2700 l Slurry 4 + LCM |
| MB8 | - | 2700 l Slurry 4 + LCM | 2000 l Slurry 3 + LCM | 2800 l Slurry 4 + LCM |
Disclaimer/Publisher’s Note: The statements, opinions and data contained in all publications are solely those of the individual author(s) and contributor(s) and not of MDPI and/or the editor(s). MDPI and/or the editor(s) disclaim responsibility for any injury to people or property resulting from any ideas, methods, instructions or products referred to in the content. |
© 2023 by the authors. Licensee MDPI, Basel, Switzerland. This article is an open access article distributed under the terms and conditions of the Creative Commons Attribution (CC BY) license (https://creativecommons.org/licenses/by/4.0/).
Share and Cite
Plenkers, K.; Reinicke, A.; Obermann, A.; Gholizadeh Doonechaly, N.; Krietsch, H.; Fechner, T.; Hertrich, M.; Kontar, K.; Maurer, H.; Philipp, J.; et al. Multi-Disciplinary Monitoring Networks for Mesoscale Underground Experiments: Advances in the Bedretto Reservoir Project. Sensors 2023, 23, 3315. https://doi.org/10.3390/s23063315
Plenkers K, Reinicke A, Obermann A, Gholizadeh Doonechaly N, Krietsch H, Fechner T, Hertrich M, Kontar K, Maurer H, Philipp J, et al. Multi-Disciplinary Monitoring Networks for Mesoscale Underground Experiments: Advances in the Bedretto Reservoir Project. Sensors. 2023; 23(6):3315. https://doi.org/10.3390/s23063315
Chicago/Turabian StylePlenkers, Katrin, Andreas Reinicke, Anne Obermann, Nima Gholizadeh Doonechaly, Hannes Krietsch, Thomas Fechner, Marian Hertrich, Karam Kontar, Hansruedi Maurer, Joachim Philipp, and et al. 2023. "Multi-Disciplinary Monitoring Networks for Mesoscale Underground Experiments: Advances in the Bedretto Reservoir Project" Sensors 23, no. 6: 3315. https://doi.org/10.3390/s23063315
APA StylePlenkers, K., Reinicke, A., Obermann, A., Gholizadeh Doonechaly, N., Krietsch, H., Fechner, T., Hertrich, M., Kontar, K., Maurer, H., Philipp, J., Rinderknecht, B., Volksdorf, M., Giardini, D., & Wiemer, S. (2023). Multi-Disciplinary Monitoring Networks for Mesoscale Underground Experiments: Advances in the Bedretto Reservoir Project. Sensors, 23(6), 3315. https://doi.org/10.3390/s23063315