
Influence of the Backward Fall Technique on the Transverse Linear Acceleration of the Head during the Fall


Abstract
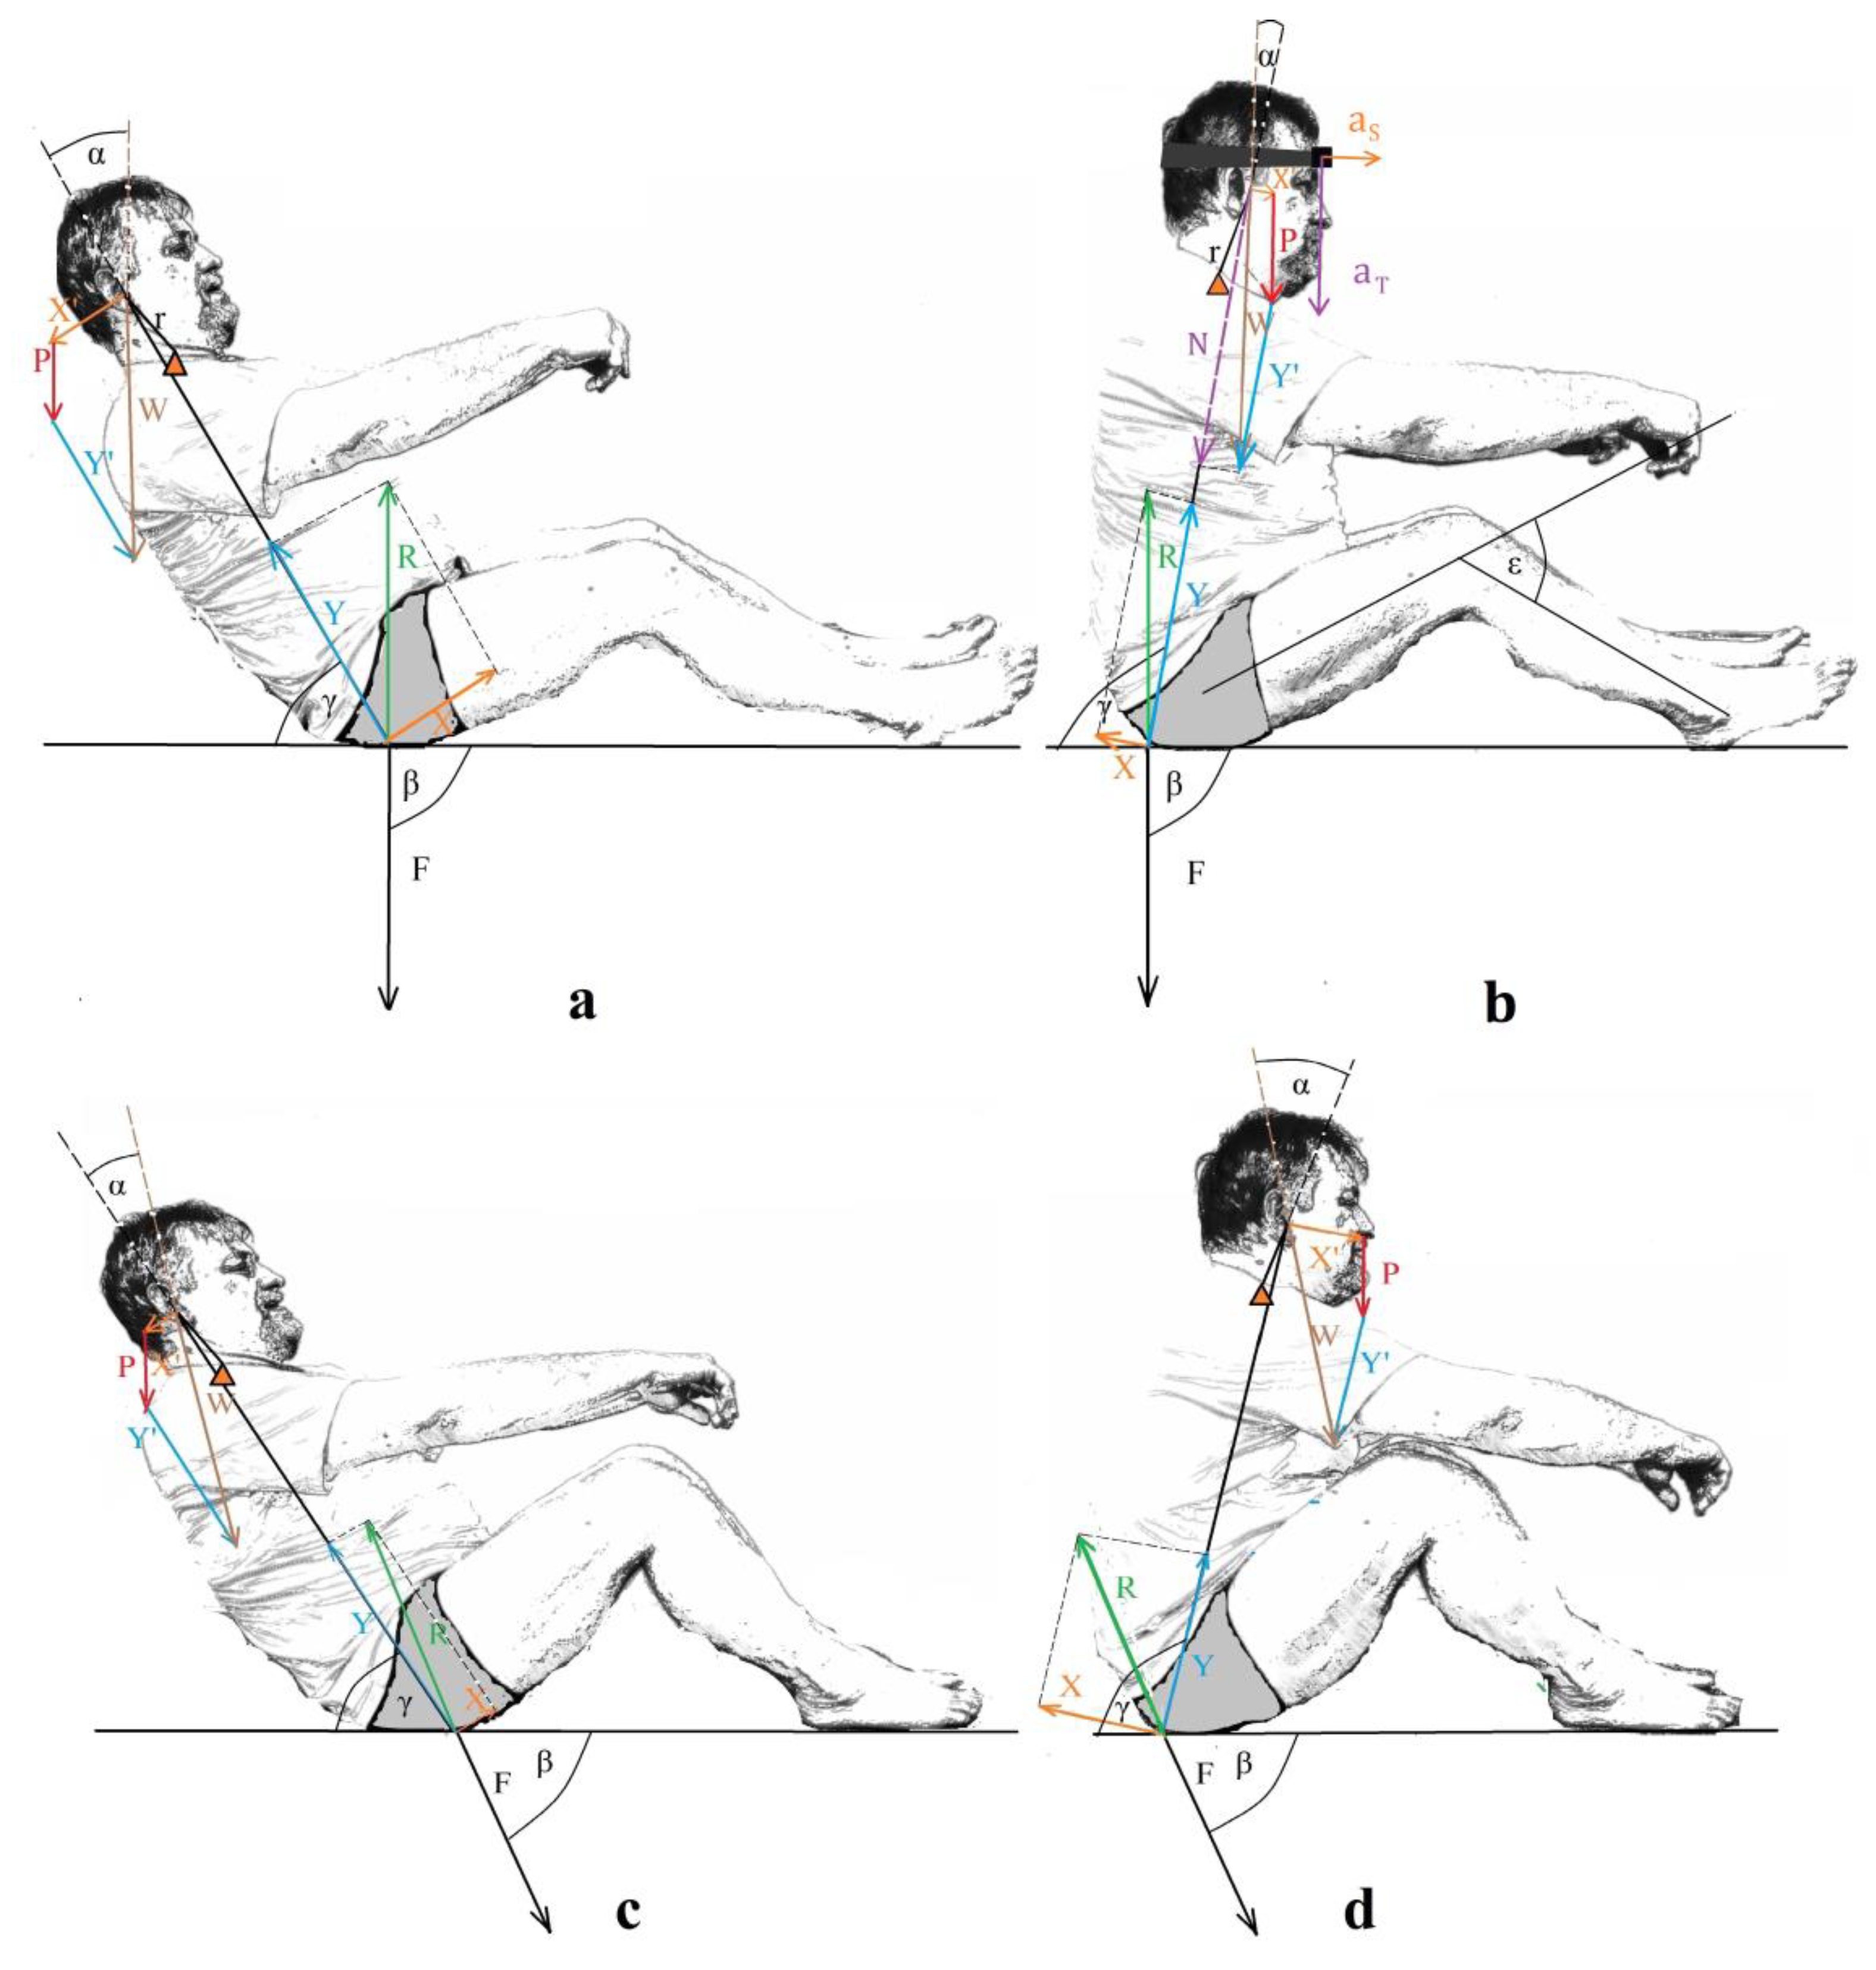
1. Introduction
2. Materials and Methods
2.1. Research Material
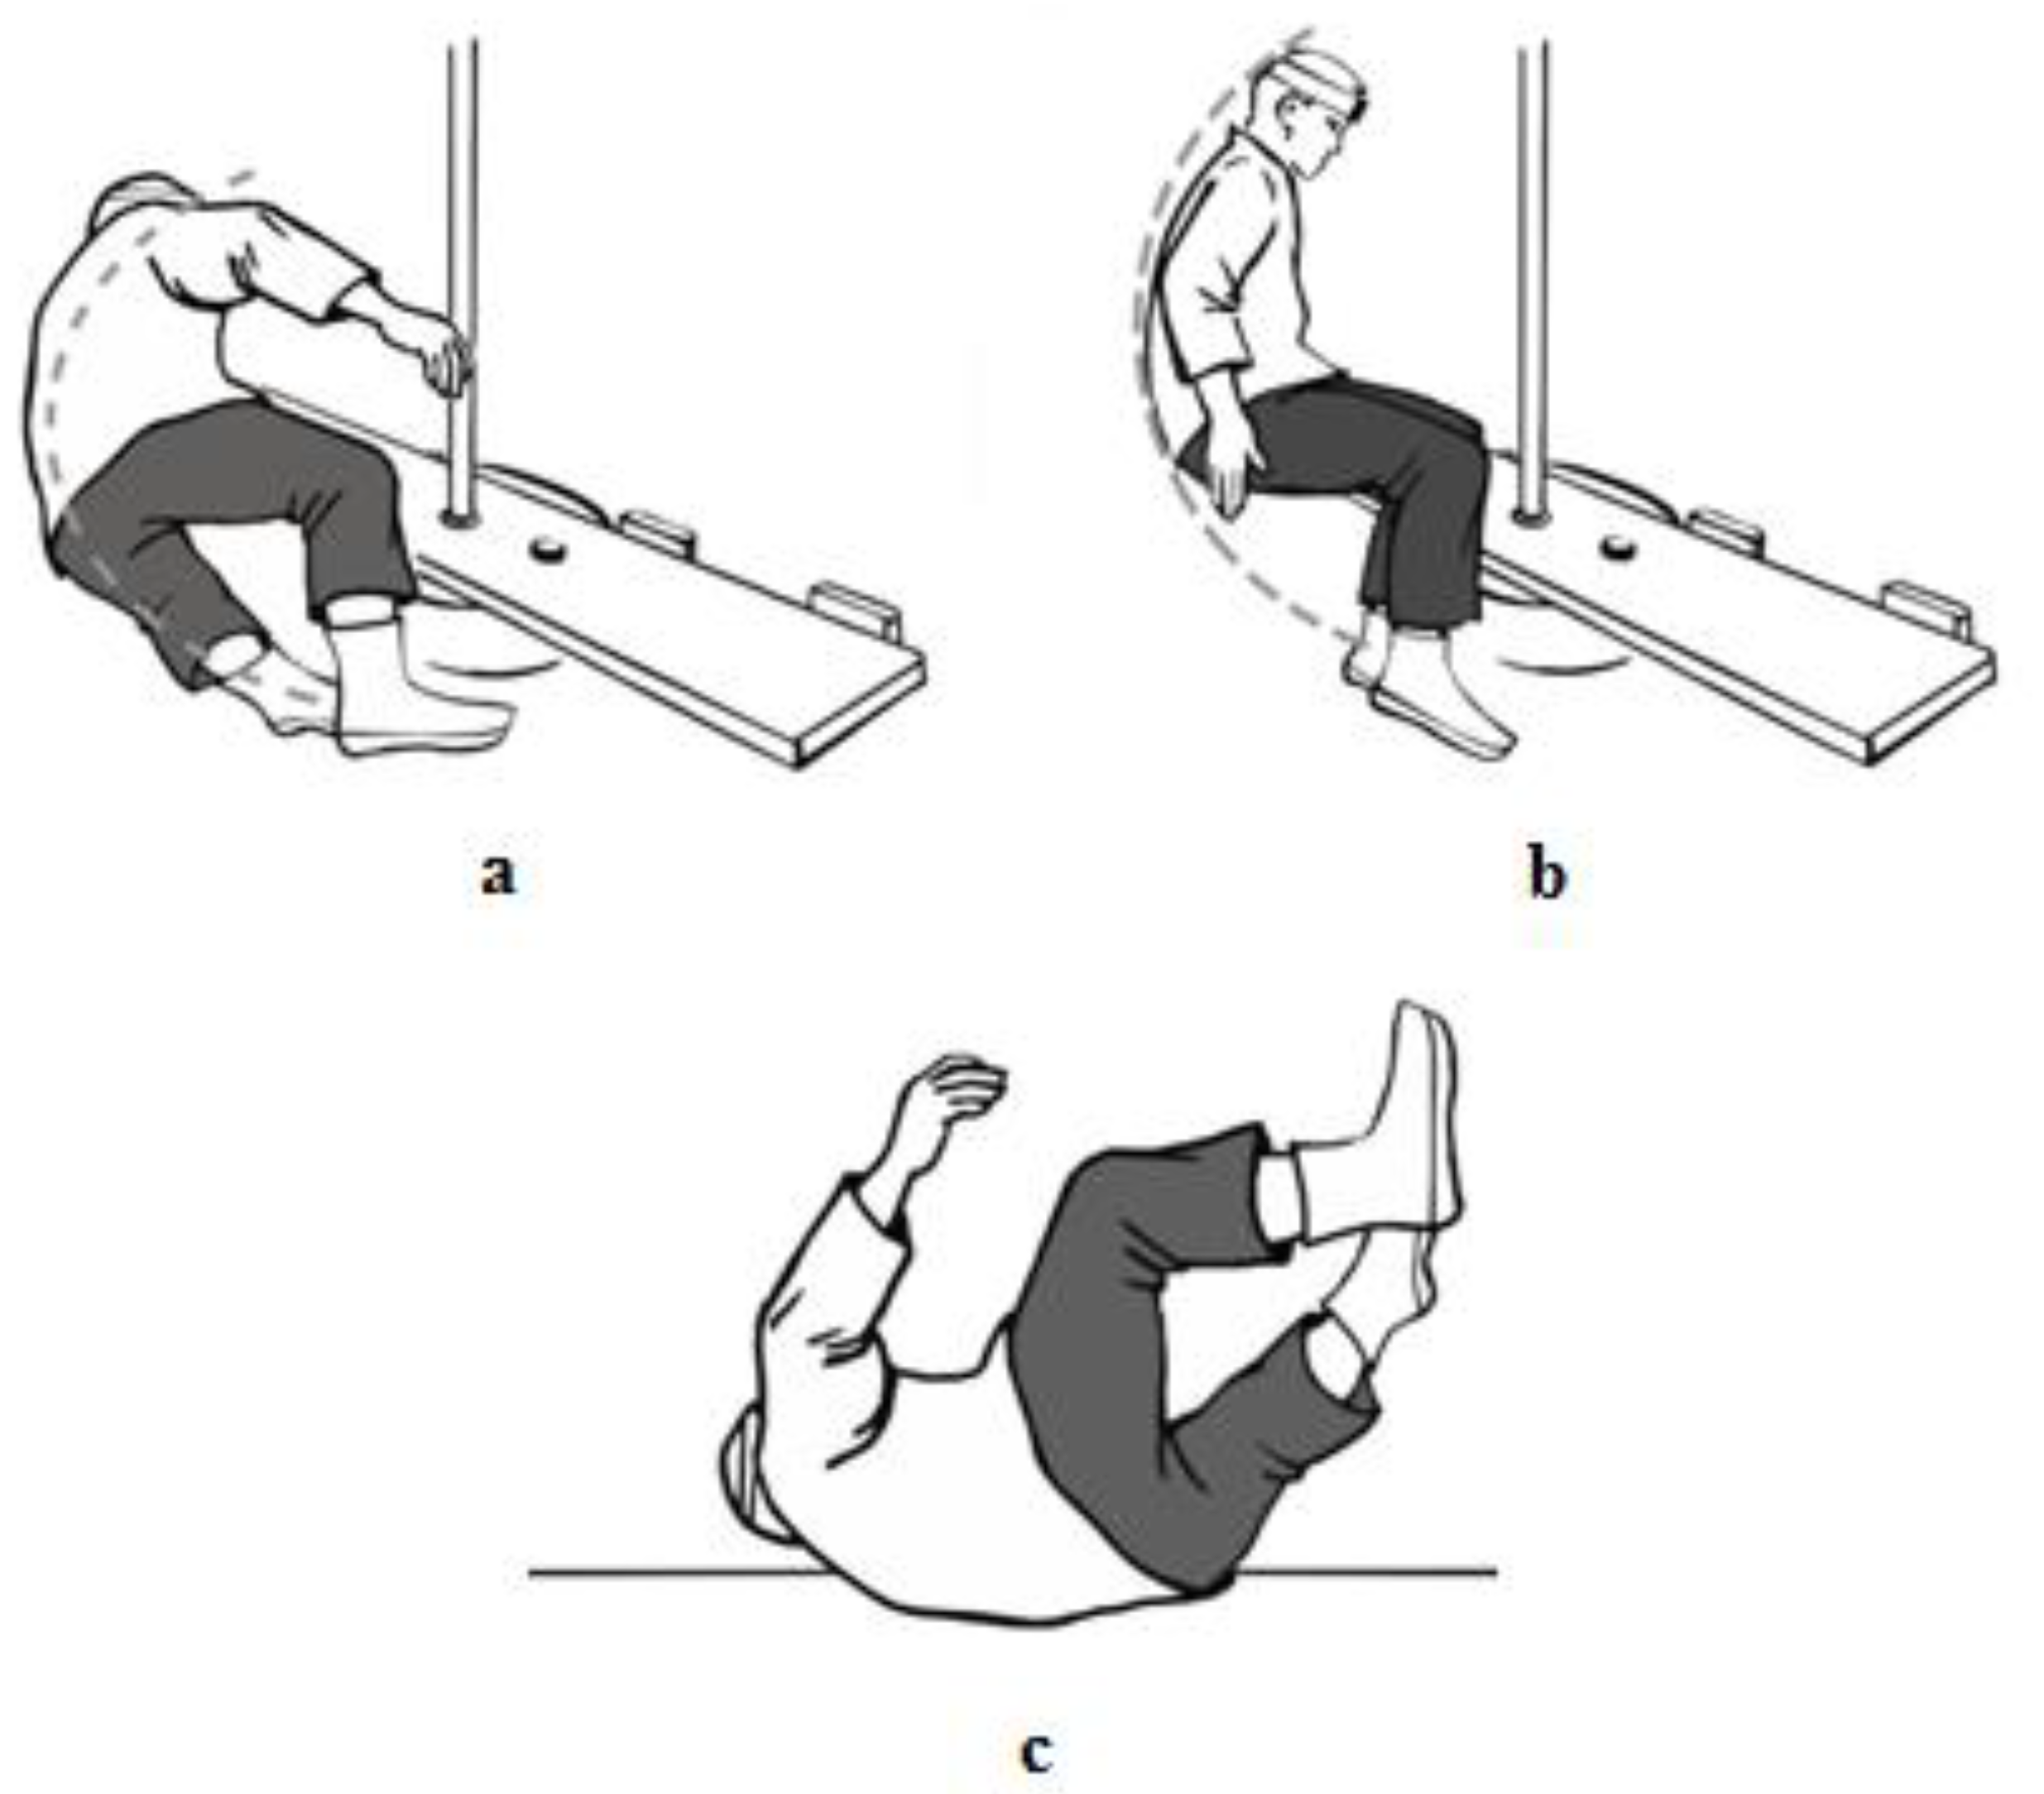
2.2. Research Method
2.3. Statistical Methods
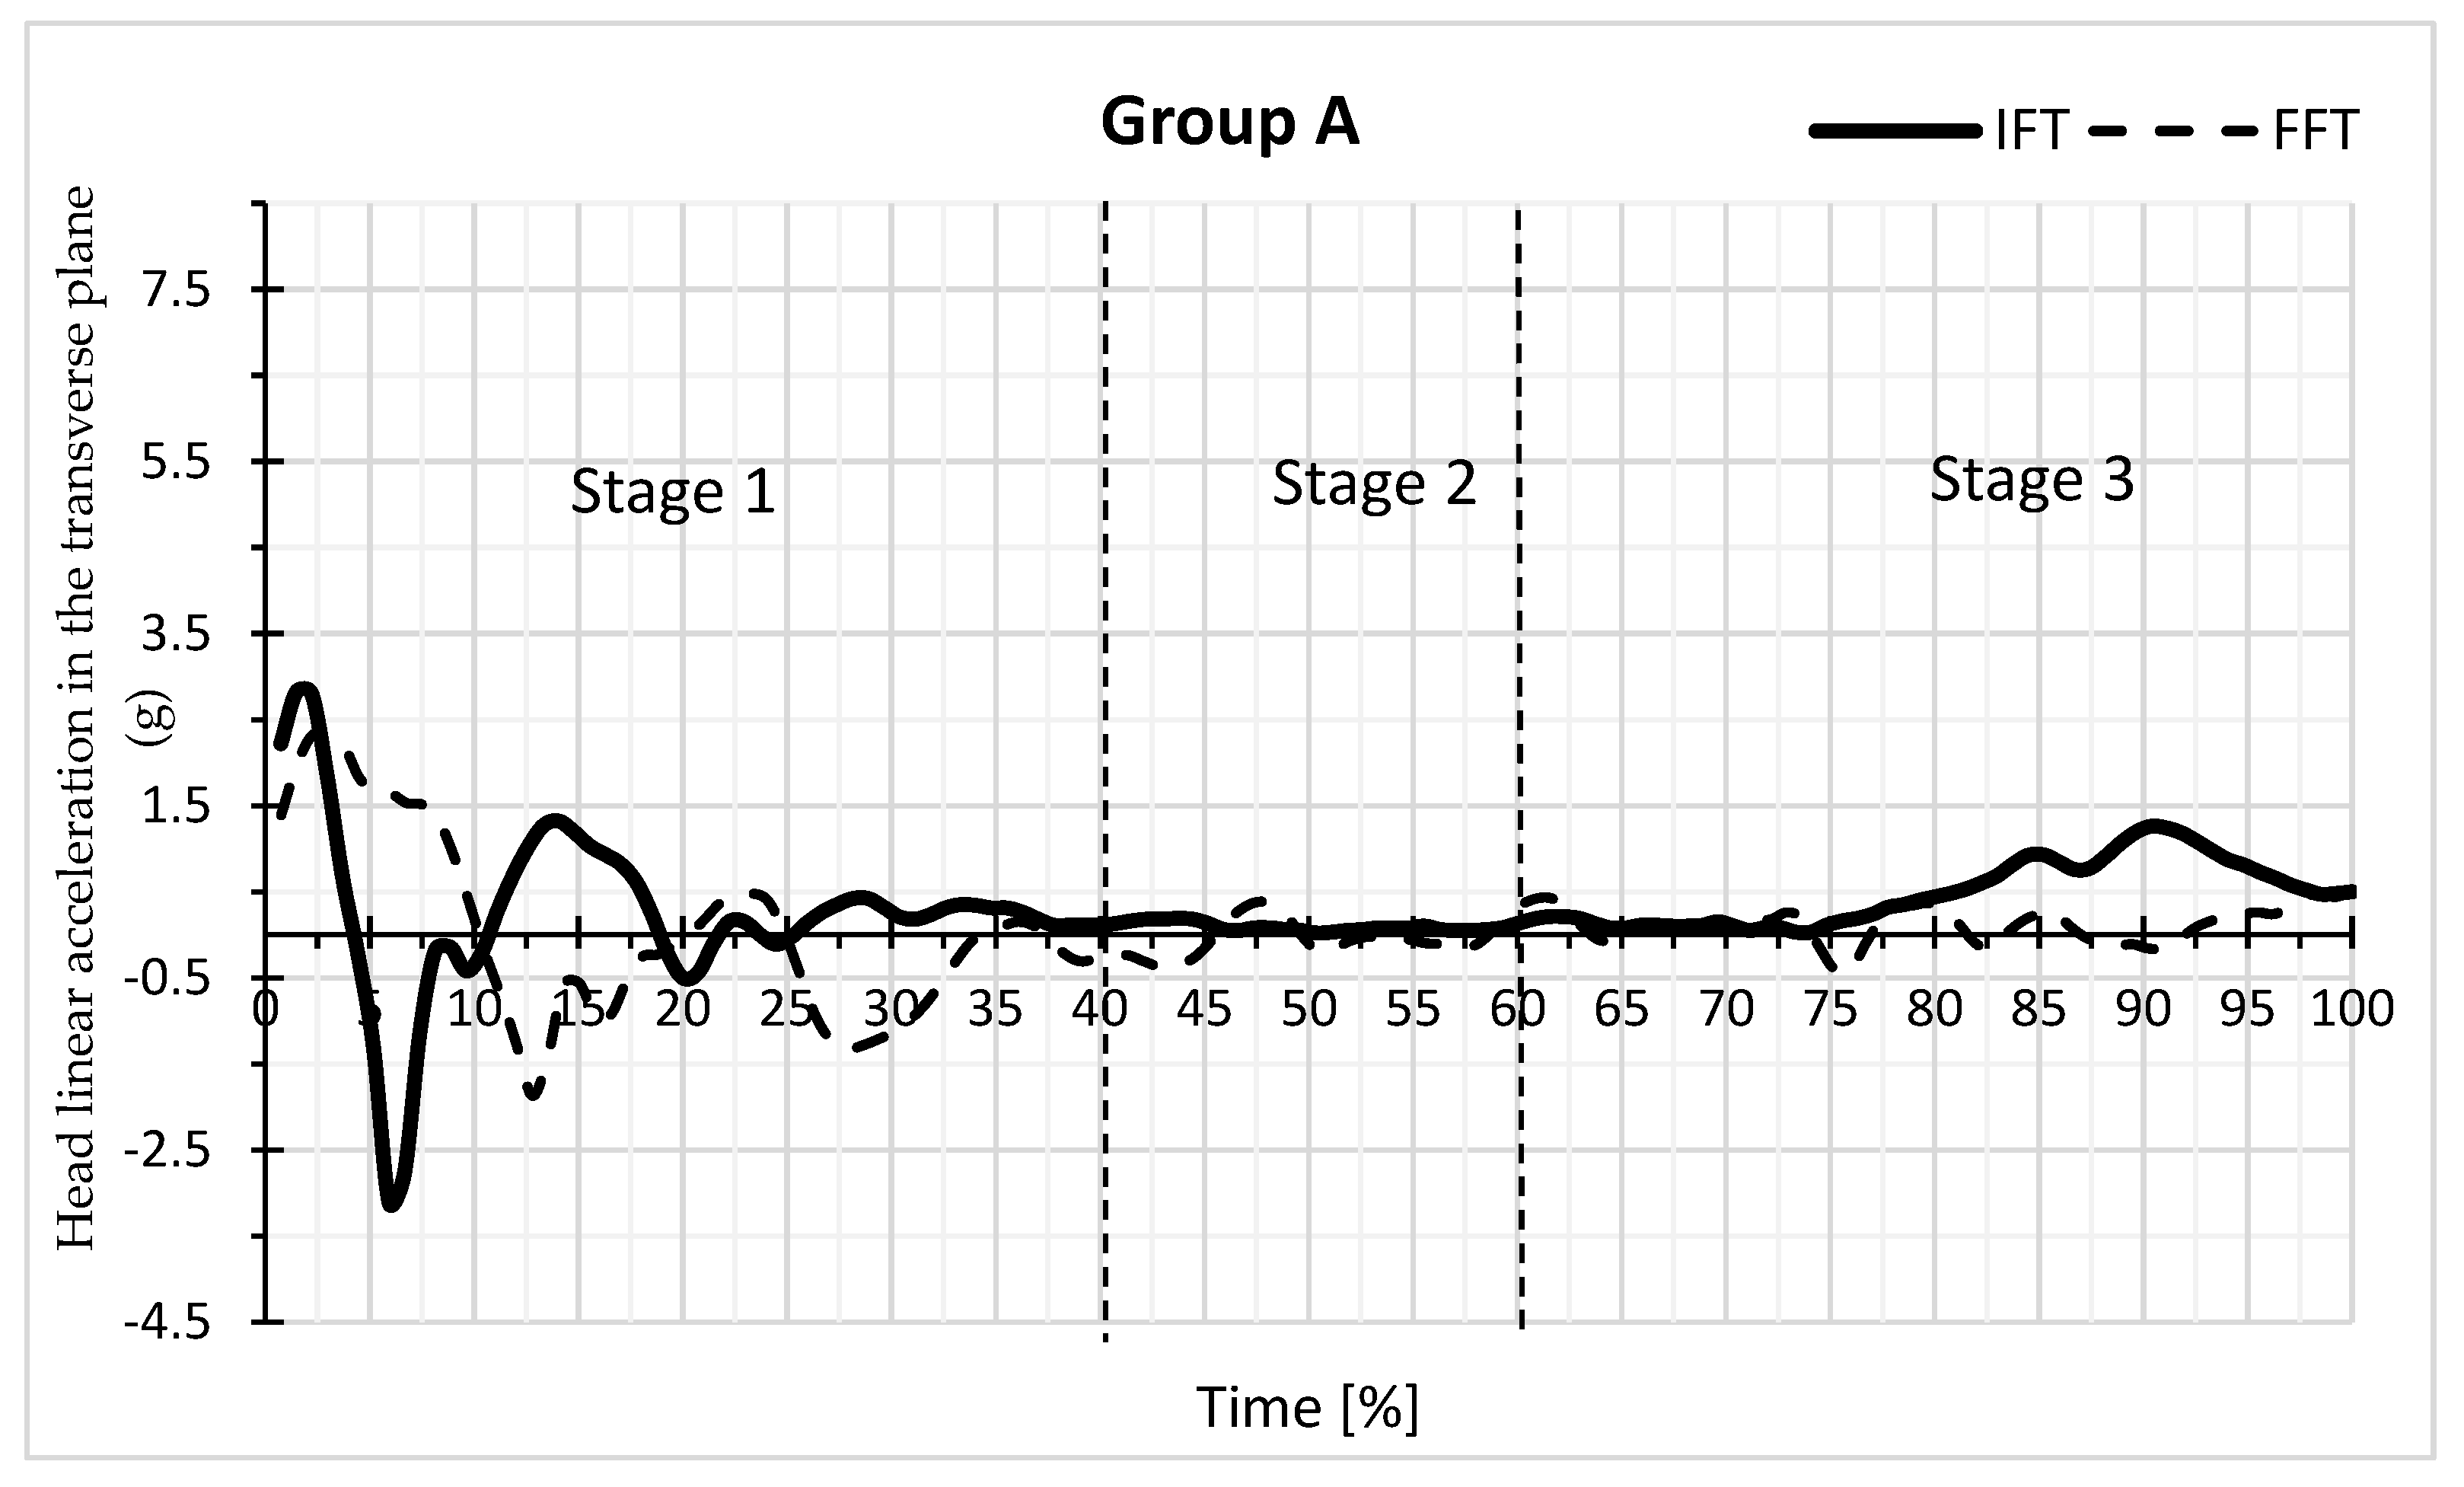
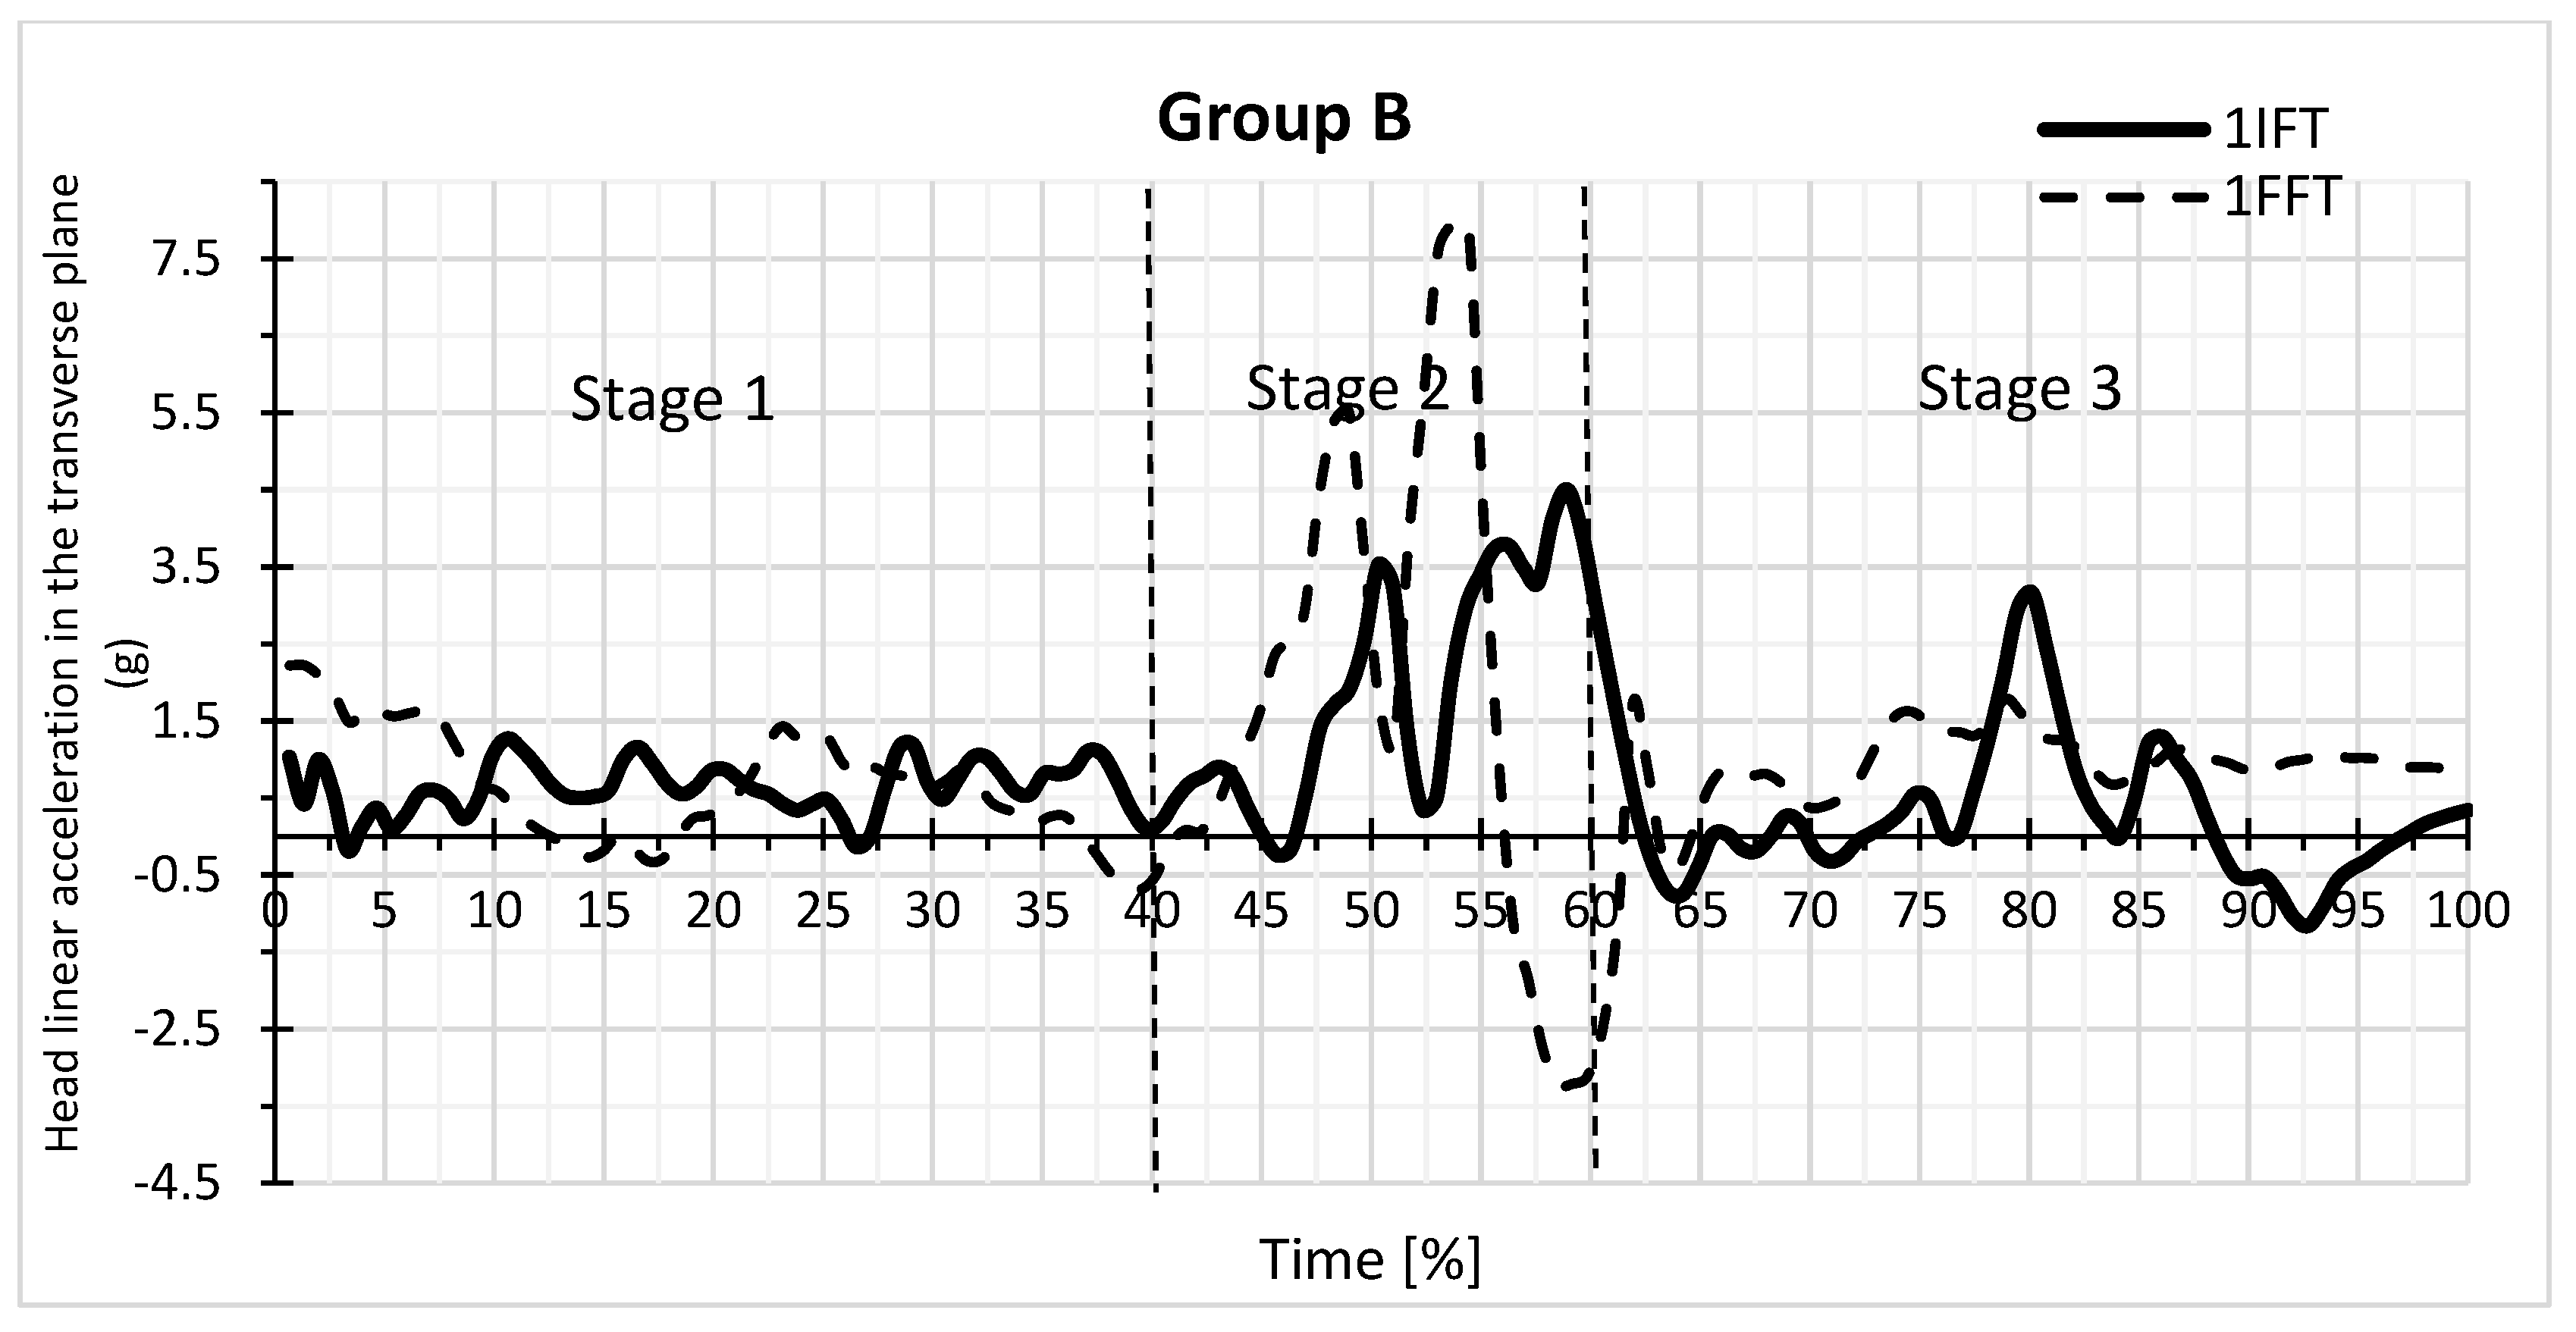
3. Results
4. Discussion
5. Conclusions
Supplementary Materials
Author Contributions
Funding
Institutional Review Board Statement
Informed Consent Statement
Data Availability Statement
Conflicts of Interest
References
- Yoshida, S. A Global Report on Falls Prevention. Epidemiology of Falls Geneva: World Health Organization. 2007. Available online: https://www.who.int/ageing/projects/1.Epidemiologyoffallsinolderage.pdf (accessed on 25 August 2022).
- World Health Organization. Violence and Injury Prevention and Disability. 2020. Available online: https://www.who.int/violence_injury_prevention/other_injury/falls/en/ (accessed on 25 August 2022).
- Society, A.G.; Society, G.; Of, A.A. On Falls Prevention OSP. Guideline for the Prevention of Falls in Older Persons. J. Am. Geriatr. Soc. 2001, 49, 664–672. [Google Scholar] [CrossRef]
- Hsu, I.L.; Li, C.Y.; Chu, D.C.; Chien, L.C. An Epidemiological Analysis of Head Injuries in Taiwan. Int. J. Environ. Res. Public Health 2018, 15, 2457. [Google Scholar] [CrossRef]
- Kallin, K.; Jensen, J.; Olsson, L.L.; Nyberg, L.; Gustafson, Y. Why the elderly fall in residential care facilities, and suggested remedies. J. Fam. Pract. 2004, 53, 41–52. [Google Scholar]
- Bhatt, T.; Pai, Y.C. Generalization of Gait Adaptation for Fall Prevention: From Moveable Platform to Slippery Floor. J. Neurophysiol. 2009, 101, 948–957. [Google Scholar] [CrossRef] [PubMed]
- Owings, T.M.; Pavol, M.J.; Grabiner, M.D. Mechanisms of failed recovery following postural perturbations on a motorized treadmill mimic those associated with an actual forward trip. Clin. Biomech. 2001, 16, 813–819. [Google Scholar] [CrossRef]
- Grabiner, M.D.; Donovan, S.; Bareither, M.L.; Marone, J.R.; Hamstra-Wright, K.; Gatts, S.; Troy, K. Trunk kinematics and fall risk of older adults: Translating biomechanical results to the clinic. J. Electromyogr. Kinesiol. 2008, 18, 197–204. [Google Scholar] [CrossRef] [PubMed]
- Kalina, R.M.; Barczyński, B.J.; Klukowski, K.; Langfort, L.; Gasienica-Walczak, B. The method to evaluate the susceptibility to injuries during the fall—Validation procedure of the specific motor test. Arch. Budo 2011, 7, 201–215. [Google Scholar]
- Mroczkowski, A. Susceptibility to Head Injury during Backward Fall with Side Aligning of the Body. Appl. Sci. 2020, 22, 8239. [Google Scholar] [CrossRef]
- Mroczkowski, A. Influence of the Backward Fall Technique on the Sagittal Linear Acceleration of the Head during a Fall. Int. J. Environ. Res. Public Health 2022, 19, 753. [Google Scholar] [CrossRef] [PubMed]
- Kalina, R.M.; Barczyński, B.J. EKO-AGRO-FITNESS original author continuous program of health-oriented and ecological education in the family, among friends or individually implemented—The premises and assumptions. Arch. Budo 2010, 6, 179–184. [Google Scholar]
- Mroczkowski, A.; Sikorski, M.M. The susceptibility to body injuries during a fall and abilities related to motor coordination of children aged 10 to 12. Arch. Budo Sci. Martial Arts Extrem. Sports 2015, 11, 65–71. [Google Scholar]
- Mroczkowski, A. Factors putting the head at the risk of injury during backward fall. Ido Mov. Cult. J. Martial Arts Anthropol. 2021, 21, 19–27. [Google Scholar] [CrossRef]
- Momola, I.; Cynarski, W.J. Safe falls in the lessons of physical education. Ido Mov. Cult. J. Martial Arts Anthropol. 2006, 6, 124–131. [Google Scholar]
- Meng, L.; Ceccarelli, M.; Yu, Z.; Chen, X.; Huang, Q. An experimental characterization of human falling down. Mech. Sci. 2017, 8, 79–89. [Google Scholar] [CrossRef]
- Tan, J.-S.; Eng, J.J.; Robinovitch, S.N.; Warnick, B. Wrist impact velocities are smaller in forward falls than backward falls from standing. J. Biomech. 2006, 39, 1804–1811. [Google Scholar] [CrossRef] [PubMed]
- Wang, Y.; Peng, X.; Guo, Z. Biomechanical analysis of C4–C6 spine segment considering anisotropy of annulus fibrosus. Biomed. Eng. Biomed. Tech. 2013, 58, 343–351. [Google Scholar] [CrossRef] [PubMed]
- Montemurro, N.; Perrini, P.; Mangini, V.; Galli, M.; Papini, A. The Y-shaped trabecular bone structure in the odontoid process of the axis: A CT scan study in 54 healthy subjects and biomechanical considerations. J. Neurosurg. Spine 2019, 30, 585–592. [Google Scholar] [CrossRef]
- Kalina, R.M.; Jagiełło, W.; Barczyński, B.J. The method to evaluate the body balance disturbation tolerance skills—Validation procedure of the “Rotational Test”. Arch. Budo 2013, 9, 59–69. [Google Scholar] [CrossRef]
- Available online: http://smaes.archbudo.com/page/display/id/11/title/relative-immobility/ (accessed on 25 August 2022).
- Toronjo-Hornillo, L.; DelCastillo-Andrés, Ó.; Campos-Mesa, M.D.C.; Bernier, V.M.D.; Sánchez, M.L.Z. Effect of the Safe Fall Programme on Children’s Health and Safety: Dealing Proactively with Backward Falls in Physical Education Classes. Sustainability 2018, 10, 1168. [Google Scholar] [CrossRef]
- Del Castillo-Andrés, O.; Toronjo-Hornillo, L.; Moya-Martínez, I.; Campos-Mesa, M. Propuesta de un programa de prevención de lesiones en voleibol femenino infantil y cadete. Sport TK Revista Euroam. De Cienc. Del Deport. 2019, 8, 7–12. [Google Scholar] [CrossRef]
- DelCastillo-Andrés, Ó.; Toronjo-Hornillo, L.; Rodríguez-López, M.; Castañeda-Vázquez, C.; Campos-Mesa, M.D.C. Children’s Improvement of a Motor Response during Backward Falls through the Implementation of a Safe Fall Program. Int. J. Environ. Res. Public Health 2018, 15, 2669. [Google Scholar] [CrossRef]
- Mroczkowski, A.; Mosler, D. Diagnosis of Motor Habits during Backward Fall with Usage of Rotating Training Simulator. In Sport and Exercise Science; Merc, M., Ed.; InTech: Rijeka, Croatia, 2018. [Google Scholar] [CrossRef]
- Mroczkowski, A. Rotating training simulator—An apparatus used for determining the moment of inertia, assisting learning various motor activities during rotational movements and simulating falls imposed by internal force. Arch. Budo Sci. Martial Arts Extrem. Sports 2014, 10, 69–74. [Google Scholar]
- Clayton, J.L.; Harris, M.B.; Weintraub, S.L.; Marr, A.; Timmer, J.; Stuke, L.E.; McSwain, N.E.; Duchesne, J.C.; Hunt, J.P. Risk factors for cervical spine injury. Injury 2012, 43, 431–435. [Google Scholar] [CrossRef] [PubMed]
- Court-Brown, C.; Heckman, J.; McQueen, M.; Ricci, W.; McKee, M. Rockwood and Green’s Fractures in Adults, 8th ed.; Lippincott: New York, NY, USA, 2015. [Google Scholar]
- Tile, M. Acute Pelvic Fractures: I. Causation and Classification. J. Am. Acad. Orthop. Surg. 1996, 4, 143–151. [Google Scholar] [CrossRef]
- Abernathy, B.R.; Schroder, L.K.; Bohn, D.C.; Switzer, J.A. Low-Energy Pelvic Ring Fractures: A Care Conundrum. Geriatr. Orthop. Surg. Rehabil. 2021, 12, 1–7. [Google Scholar] [CrossRef]
- Fuchs, T.; Rottbeck, U.; Hofbauer, V.; Raschke, M.; Stange, R. Beckenringfrakturen im Alter. Unfallchirurg 2011, 114, 663–670. [Google Scholar] [CrossRef]
- Leslie, M.; Baumgaertner, M.R. Osteroporotic pelvic ring injuries. Orthop. Clin. North Am. 2013, 44, 217–224. [Google Scholar] [CrossRef]
- Oberkircher, L.; Ruchholtz, S.; Rommens, P.M.; Hofmann, A.; Bücking, B.; Krüger, A. Osteoporotic Pelvic Fractures. Dtsch Arztebl Int. 2018, 115, 70–80. [Google Scholar] [CrossRef] [PubMed]
- Mroczkowski, A. Susceptibility to fall injury in students of Physical Education practising handball. Arch. Budo Sci. Martial Arts Extrem. Sports 2018, 14, 109–115. [Google Scholar]
- Available online: http://www.letsense.net/free4act_eng.php (accessed on 25 August 2022).
- Feldman, F.; Robinovitch, S.N. Reducing hip fracture risk during sideways falls: Evidence in young adults of the protective effects of impact to the hands and stepping. J. Biomech. 2007, 40, 2612–2618. [Google Scholar] [CrossRef] [PubMed]
- Mroczkowski, A. Motor safety of a man during a fall. Arch. Budo 2015, 11, 293–303. [Google Scholar]
- Mroczkowski, A.; Hes, B. Motor safety during trampolining. Arch. Budo Sci. Martial Arts Extrem. Sports 2015, 11, 57–64. [Google Scholar]
- Reguli, Z.; Senkyr, J.; Vit, M. Questioning the Concept of General Falling Techniques. In Proceedings of the 1st World Congress on Health and Martial Arts in Interdisciplinary Approach, HMA 2015, Czestochowa, Poland, 17–19 September 2015; Kalina, R.M., Ed.; Archives of Budo: Warsaw, Poland, 2015; pp. 63–67. [Google Scholar]
- Cham, R.; Redfern, M.S. Heel contact dynamics during slip events on level and inclined surfaces. Saf. Sci. 2002, 40, 559–576. [Google Scholar] [CrossRef]
- Groen, B.; Weerdesteyn, V.; Duysens, J. Martial arts fall techniques decrease the impact forces at the hip during sideways falling. J. Biomech. 2007, 40, 458–462. [Google Scholar] [CrossRef]
- Groen, B.E.; Smulders, E.; de Kam, D.; Duysens, J.; Weerdesteyn, V. Martial arts fall training to prevent hip fractures in the elderly. Osteoporos. Int. 2009, 21, 215–221. [Google Scholar] [CrossRef]
- Weerdesteyn, V.; Groen, B.; van Swigchem, R.; Duysens, J. Martial arts fall techniques reduce hip impact forces in naive subjects after a brief period of training. J. Electromyogr. Kinesiol. 2008, 18, 235–242. [Google Scholar] [CrossRef] [PubMed]


| Time % | Mean A IFT | SD A IFT | Min A IFT | Max A IFT | Mean A FFT | SD A FFT | Min A FFT | Max A FFT | Difference (IFT–FFT) | p |
|---|---|---|---|---|---|---|---|---|---|---|
| 0 | 1.84 | 1.15 | −0.58 | 3.58 | 2.56 | 1.49 | −0.42 | 5.03 | −0.71 | 0.0128 |
| 5 | 0.07 | 1.84 | −1.62 | 3.53 | −0.58 | 2.23 | −3.51 | 2.38 | 0.64 | 0.2265 |
| 10 | −0.23 | 1.69 | −1.85 | 4.37 | −0.01 | 0.98 | −2.61 | 1.52 | −0.22 | 0.5420 |
| 15 | 0.26 | 1.57 | −3.76 | 1.54 | −0.53 | 1.27 | −2.86 | 1.25 | 0,80 | 0.0292 |
| 20 | −0.99 | 0.97 | −2.38 | 0.46 | 0.24 | 0.77 | −1.44 | 1.51 | −1.24 | 0.0001 |
| 25 | −0.14 | 0.40 | −0.89 | 0.39 | 0.43 | 0.99 | −0.65 | 2.43 | −0.56 | 0.0373 |
| 30 | 0.16 | 0.47 | −1.02 | 0.72 | −0.13 | 0.85 | −1.32 | 1.35 | 0.29 | 0.1709 |
| 35 | 0.15 | 0.25 | −0.48 | 0.46 | −0.11 | 0.63 | −1.22 | 1.26 | 0.26 | 0.1657 |
| 40 | 0.17 | 0.20 | −0.27 | 0.50 | 0.04 | 0.36 | −0.80 | 0.62 | 0.12 | 0.2011 |
| 45 | 0.20 | 0.16 | −0.08 | 0.58 | −0.03 | 0.45 | −0.79 | 0.61 | 0.23 | 0.0559 |
| 50 | 0.20 | 0.25 | −0.45 | 0.75 | −0.08 | 0.48 | −1.29 | 0.35 | 0.27 | 0.0128 |
| 55 | 0.10 | 0.23 | −0.50 | 0.39 | 0.13 | 0.29 | −0.28 | 0.90 | −0.03 | 0.8068 |
| 60 | 0.11 | 0.23 | −0.40 | 0.41 | 0.22 | 0.18 | −0.11 | 0.51 | −0.11 | 0.1641 |
| 65 | 0.03 | 0.31 | −0.72 | 0.42 | 0.13 | 0.19 | −0.23 | 0.42 | −0.10 | 0.1540 |
| 70 | −0.11 | 0.61 | −1.76 | 0.39 | 0.02 | 0.40 | −1.07 | 0.37 | −0.13 | 0.3638 |
| 75 | 0.08 | 0.23 | −0.53 | 0.41 | 0.01 | 0.63 | −1.74 | 0.55 | 0.08 | 0.6251 |
| 80 | 0.32 | 0.16 | −0.01 | 0.59 | 0.20 | 0.68 | −1.42 | 1,12 | 0.12 | 0.4549 |
| 85 | 0.49 | 0.45 | −0.41 | 1.08 | 0.44 | 0.45 | −0.38 | 1.14 | 0.05 | 0.6502 |
| 90 | 0.70 | 0.41 | 0.07 | 1.38 | 0.42 | 0.40 | −0.15 | 1.05 | 0.28 | 0.0314 |
| 95 | 0.56 | 0.40 | −0.23 | 1.02 | 0.42 | 0.33 | −0.12 | 0.95 | 0.13 | 0.2710 |
| 100 | 0.58 | 0.33 | −0.18 | 0.95 | 0.48 | 0.32 | −0.02 | 1.12 | 0.09 | 0.4270 |
| Mean | 0.22 | 0.51 | 0.20 | 0.61 | 0.01 | 0.8966 |
| Time % | Mean B IFT | SD B IFT | Min B IFT | Max B IFT | Mean B FFT | SD B FFT | Min B FFT | Max B FFT | Difference (IFT–FFT) | p |
|---|---|---|---|---|---|---|---|---|---|---|
| 0 | 0.81 | 0.66 | −0.77 | 1l70 | 0.76 | 0.77 | −0.62 | 2.22 | 0.05 | 0.7929 |
| 5 | 0.41 | 0.72 | −0.85 | 2.14 | 0.69 | 0.78 | −0,72 | 2.08 | −0.28 | 0.0957 |
| 10 | 0.64 | 0.62 | −0.51 | 1.96 | 0.60 | 0.77 | −0.38 | 2.50 | 0.04 | 0.8274 |
| 15 | 0.88 | 0.58 | −0.38 | 2.23 | 0.88 | 1.19 | −0.63 | 4.69 | −0.01 | 0.9862 |
| 20 | 0.73 | 0.74 | −0.56 | 2.94 | 1,04 | 1.16 | −2.03 | 3.05 | −0.31 | 0.2395 |
| 25 | 0.81 | 1.23 | −2.62 | 3.98 | 0.88 | 1.34 | −3.34 | 2.99 | −0.07 | 0.8784 |
| 30 | 1.47 | 1.68 | −1.23 | 5.45 | 0.73 | 0.92 | −1.17 | 2.77 | 0.74 | 0.0780 |
| 35 | 0.70 | 1.58 | −3.52 | 3.35 | 0.72 | 0.86 | −0.60 | 3.40 | −0.03 | 0.9446 |
| 40 | 0.98 | 2.46 | −3.26 | 7.88 | 0.44 | 1.24 | −2.85 | 2.23 | 0.53 | 0.2951 |
| 45 | 0.01 | 2.23 | −6.64 | 3.46 | 0.77 | 0.93 | −1.26 | 2.58 | −0.75 | 0.1328 |
| 50 | 0.30 | 2.46 | −6.68 | 7.03 | 1.10 | 1.35 | −1.68 | 4.53 | −0.80 | 0.2544 |
| 55 | −0.14 | 1.71 | −4.24 | 3.42 | 1.38 | 2.14 | −1.42 | 7.97 | −1.52 | 0.0188 |
| 60 | 0.41 | 1.84 | −3.56 | 3.34 | 0.25 | 1.96 | −2.99 | 3.94 | 0.16 | 0.8084 |
| 65 | −0.34 | 1.85 | −5.28 | 2.80 | 1.19 | 1.38 | −0.82 | 4.10 | −1.53 | 0.0016 |
| 70 | −0.22 | 1.56 | −4.70 | 2.27 | −0.11 | 1.58 | −3.08 | 3.28 | −0.10 | 0.7186 |
| 75 | 0.27 | 0.88 | −1.03 | 2.82 | 0.28 | 1.35 | −1.81 | 2.79 | −0.01 | 0.9833 |
| 80 | 0.11 | 1.16 | −3.25 | 3.12 | 0.24 | 1.80 | −3.65 | 4.40 | −0.14 | 0.7469 |
| 85 | 0.07 | 1.34 | −5.10 | 2.16 | 0.19 | 0.89 | −2.13 | 1.51 | −0.12 | 0.5783 |
| 90 | 0.07 | 0.70 | −1.61 | 1.19 | 0.20 | 1.10 | −3.75 | 1.65 | −0.13 | 0.4459 |
| 95 | 0.35 | 1.18 | −1.31 | 4.56 | 0.25 | 0.71 | −1.03 | 1.84 | 0.10 | 0.6135 |
| 100 | 0.05 | 1.03 | −3.82 | 0.97 | 0.36 | 0.73 | −1.31 | 1.32 | −0.31 | 0.1091 |
| Mean | 0.40 | 0.46 | 0.61 | 0.39 | 0.55 | 0.0881 |
| Time % | Mean A IFT | Mean B IFT | Difference | p |
|---|---|---|---|---|
| 0 | 1.8426 | 0.8114 | 1.0313 | 0.0009 |
| 5 | 0.0682 | 0.4094 | −0.3412 | 0.4271 |
| 10 | −0.2316 | 0.6361 | −0.8677 | 0.0308 |
| 15 | 0.2604 | 0.8781 | −0.6176 | 0.0944 |
| 20 | −0.9944 | 0.7308 | −1.7252 | 0.0000 |
| 25 | −0.1351 | 0.8116 | −0.9467 | 0.0026 |
| 30 | 0.1621 | 1.4730 | −1.3109 | 0.0022 |
| 35 | 0.1547 | 0.6952 | −0.5405 | 0.1479 |
| 40 | 0.1653 | 0.9770 | −0.8117 | 0.1596 |
| 45 | 0.1966 | 0.0125 | 0.1842 | 0.7216 |
| 50 | 0.1955 | 0.3011 | −0.1056 | 0.8535 |
| 55 | 0.1022 | −0.1390 | 0.2412 | 0.5458 |
| 60 | 0.1122 | 0.4080 | −0.2958 | 0.4922 |
| 65 | 0.0268 | −0.3409 | 0.3677 | 0.3992 |
| 70 | −0.1122 | −0.2156 | 0.1034 | 0.7877 |
| 75 | 0.0813 | 0.2723 | −0.1910 | 0.3631 |
| 80 | 0.3203 | 0.1052 | 0.2151 | 0.4264 |
| 85 | 0.4946 | 0.0658 | 0.4289 | 0.1898 |
| 90 | 0.7024 | 0.0680 | 0.6344 | 0.0014 |
| 95 | 0.5567 | 0.3522 | 0.2045 | 0.4751 |
| 100 | 0.5753 | 0.0464 | 0.5289 | 0.0385 |
| Mean | 0.2164 | 0.3960 | −0.1796 | 0.2308 |
| Time % | Mean A FFT | Mean B FFT | Difference | p |
|---|---|---|---|---|
| 0 | 2.5558 | 0.7609 | 1.7949 | 0.0000 |
| 5 | −0.5765 | 0.6920 | −1.2685 | 0.0167 |
| 10 | −0.0111 | 0.5960 | −0.6070 | 0.0321 |
| 15 | −0.5347 | 0.8835 | −1.4183 | 0.0007 |
| 20 | 0.2435 | 1.0393 | −0.7958 | 0.0149 |
| 25 | 0.4287 | 0.8820 | −0.4534 | 0.2325 |
| 30 | −0.1314 | 0.7322 | −0.8636 | 0.0035 |
| 35 | −0.1052 | 0.7204 | −0.8255 | 0.0013 |
| 40 | 0.0417 | 0.4442 | −0.4025 | 0.1801 |
| 45 | −0.0322 | 0.7669 | −0.7990 | 0.0015 |
| 50 | −0.0787 | 1.1034 | −1.1821 | 0.0008 |
| 55 | 0.1283 | 1.3847 | −1.2564 | 0.0153 |
| 60 | 0.2244 | 0.2512 | −0.0268 | 0.9531 |
| 65 | 0.1280 | 1.1941 | −1.0661 | 0.0019 |
| 70 | 0.0198 | −0.1125 | 0.1323 | 0.7244 |
| 75 | 0.0053 | 0.2791 | −0.2738 | 0.4217 |
| 80 | 0.2029 | 0.2437 | −0.0408 | 0.9263 |
| 85 | 0.4447 | 0.1886 | 0.2561 | 0.2643 |
| 90 | 0.4191 | 0.2021 | 0.2170 | 0.4224 |
| 95 | 0.4230 | 0.2530 | 0.1700 | 0.3426 |
| 100 | 0.4816 | 0.3591 | 0.1225 | 0.5035 |
| Mean | 0.2037 | 0.6126 | −0.4089 | 0.0136 |
| Variable | N | Mean | Minimum | Maximum | Std. Deviat. |
|---|---|---|---|---|---|
| AIFT | 19 | 4.2476 | 1.7160 | 7.2350 | 1.6715 |
| AFFT | 19 | 5.2437 | 2.8550 | 8.3880 | 1.5784 |
| BIFT | 22 | 6.8337 | 3.9620 | 14.5560 | 2.2266 |
| BFFT | 22 | 5.6100 | 1.8380 | 10.4770 | 2.1339 |
| Mean Group A | Mean Group B | p | |
|---|---|---|---|
| AIFT vs. BIFT | 4.2476 | 6.8337 | 0.0002 |
| AFFT vs. BFFT | 5.2437 | 5.6100 | 0.5413 |
| Std. Deviat. | Std. Deviat. | Quotient F | p | |
|---|---|---|---|---|
| Time % | AIFT | BIFT | variance | variance |
| cz0 | 1.1459 | 0.6558 | 3.0536 | 0.0159 |
| cz5 | 1.8418 | 0.7164 | 6.6098 | 0.0001 |
| cz10 | 1.6933 | 0.6177 | 7.5140 | 0.0000 |
| cz15 | 1.5709 | 0.5848 | 7.2158 | 0.0000 |
| cz20 | 0.9685 | 0.7437 | 1.6957 | 0.2458 |
| cz25 | 0.3971 | 1.2252 | 9.5175 | 0.0000 |
| cz30 | 0.4739 | 1.6814 | 12.5879 | 0.0000 |
| cz35 | 0.2531 | 1.5757 | 38.7698 | 0.0000 |
| cz40 | 0.1953 | 2.4569 | 158.2053 | 0.0000 |
| cz45 | 0.1597 | 2.2279 | 194.5936 | 0.0000 |
| cz50 | 0.2528 | 2.4603 | 94.7015 | 0.0000 |
| cz55 | 0.2284 | 1.7091 | 55.9947 | 0.0000 |
| cz60 | 0.2317 | 1.8438 | 63.3288 | 0.0000 |
| cz65 | 0.3124 | 1.8545 | 35.2321 | 0.0000 |
| cz70 | 0.6079 | 1.5616 | 6.6003 | 0.0002 |
| cz75 | 0.2350 | 0.8763 | 13.9080 | 0.0000 |
| cz80 | 0.1571 | 1.1556 | 54.0776 | 0.0000 |
| cz85 | 0.4473 | 1.3357 | 8.9172 | 0.0000 |
| cz90 | 0.4142 | 0.7036 | 2.8855 | 0.0269 |
| cz95 | 0.4039 | 1.1760 | 8.4791 | 0.0000 |
| cz100 | 0.3335 | 1.0292 | 9.5211 | 0.0000 |
| Std. Deviat. | Std. Deviat. | Quotient F | p | |
|---|---|---|---|---|
| Time % | AFFT | BFFT | variance | variance |
| cz0 | 1.4915 | 0.7739 | 3.7145 | 0.0049 |
| cz5 | 2.2295 | 0.7826 | 8.1167 | 0.0000 |
| cz10 | 0.9816 | 0.7651 | 1.6461 | 0.2730 |
| cz15 | 1.2698 | 1.1949 | 1.1294 | 0.7821 |
| cz20 | 0.7711 | 1.1570 | 2.2517 | 0.0869 |
| cz25 | 0.9916 | 1,3428 | 1.8338 | 0.1982 |
| cz30 | 0.8472 | 0.9174 | 1.1726 | 0.7388 |
| cz35 | 0,6299 | 0.8577 | 1.8540 | 0.1904 |
| cz40 | 0.3636 | 1.2383 | 11.5963 | 0.0000 |
| cz45 | 0.4538 | 0.9303 | 4.2037 | 0.0033 |
| cz50 | 0.4776 | 1.3489 | 7.9765 | 0.0000 |
| cz55 | 0.2918 | 2.1390 | 53.7226 | 0.0000 |
| cz60 | 0.1795 | 1.9614 | 119.4337 | 0.0000 |
| cz65 | 0.1918 | 1.3825 | 51.9642 | 0.0000 |
| cz70 | 0.3981 | 1.5791 | 15.7371 | 0.0000 |
| cz75 | 0.6285 | 1.3471 | 4.5937 | 0.0019 |
| cz80 | 0.6814 | 1.7982 | 6.9631 | 0.0001 |
| cz85 | 0.4531 | 0.8900 | 3.8584 | 0.0054 |
| cz90 | 0.3992 | 1.1040 | 7.6487 | 0.0001 |
| cz95 | 0.3287 | 0.7072 | 4.6283 | 0.0018 |
| cz100 | 0.3189 | 0.7319 | 5.2660 | 0.0008 |
Disclaimer/Publisher’s Note: The statements, opinions and data contained in all publications are solely those of the individual author(s) and contributor(s) and not of MDPI and/or the editor(s). MDPI and/or the editor(s) disclaim responsibility for any injury to people or property resulting from any ideas, methods, instructions or products referred to in the content. |
© 2023 by the authors. Licensee MDPI, Basel, Switzerland. This article is an open access article distributed under the terms and conditions of the Creative Commons Attribution (CC BY) license (https://creativecommons.org/licenses/by/4.0/).
Share and Cite
Mroczkowski, A.; Taiar, R. Influence of the Backward Fall Technique on the Transverse Linear Acceleration of the Head during the Fall. Sensors 2023, 23, 3276. https://doi.org/10.3390/s23063276
Mroczkowski A, Taiar R. Influence of the Backward Fall Technique on the Transverse Linear Acceleration of the Head during the Fall. Sensors. 2023; 23(6):3276. https://doi.org/10.3390/s23063276
Chicago/Turabian StyleMroczkowski, Andrzej, and Redha Taiar. 2023. "Influence of the Backward Fall Technique on the Transverse Linear Acceleration of the Head during the Fall" Sensors 23, no. 6: 3276. https://doi.org/10.3390/s23063276
APA StyleMroczkowski, A., & Taiar, R. (2023). Influence of the Backward Fall Technique on the Transverse Linear Acceleration of the Head during the Fall. Sensors, 23(6), 3276. https://doi.org/10.3390/s23063276