Article

A Quantitative Study of a Directional Heat Island in Hefei, China Based on Multi-Source Data

1
College of Resources and Environment, Anhui Agricultural University, Hefei 230036, China
2
Jiangsu Provincial Key Laboratory of Geographic Information Science and Technology, International Institute for Earth System Science, Nanjing University, Nanjing 210046, China
3
School of Geographic and Biologic Information, Nanjing University of Posts and Telecommunications, Nanjing 210023, China
4
School of Civil Engineering, Hefei University of Technology, Hefei 230009, China
5
The Centre d’ Etudes Spatiales de la Biosphere, University of Toulouse, 31062 Toulouse, France
*
Author to whom correspondence should be addressed.
Sensors 2023, 23(6), 3041; https://doi.org/10.3390/s23063041
Submission received: 25 January 2023 / Revised: 21 February 2023 / Accepted: 9 March 2023 / Published: 11 March 2023
(This article belongs to the Section Environmental Sensing)

Abstract

:
Surface urban heat islands (SUHIs) are essential for evaluating urban thermal environments. However, current quantitative studies of SUHIs ignore the thermal radiation directionality (TRD), which directly affects study precision; furthermore, they fail to assess the effects of TRD characteristics at different land-use intensities, on the quantitative studies of SUHIs. To bridge this research gap, this study eliminates the interference of atmospheric attenuation and daily temperature variation factors, in quantifying the TRD based on land surface temperature (LST), from MODIS data and station air temperature data for Hefei (China) from 2010–2020. The influence of TRD on SUHI intensity quantification was evaluated by comparing the TRD under different land-use intensities in Hefei. The results show that: (1) daytime and nighttime directionality can reach up to 4.7 K and 2.6 K, and occur in areas with the highest and medium urban land-use intensity, respectively. (2) There are two significant TRD hotspots for daytime urban surfaces, where the sensor zenith angle is approximately the same as the forenoon solar zenith angle, and where the sensor zenith angle is near its nadir in the afternoon. (3) The TRD can contribute up to 2.0 K to the results of assessing the SUHI intensity based on satellite data, which is approximately 31–44% of the total SUHI in Hefei.

1. Introduction

Land surface temperature (LST) is one of the key parameters for studying processes in land surface systems at regional and global scales, enabling monitoring of the spatial and temporal variability in the energy balance state at the surface [1,2,3,4]. Satellite thermal infrared remote sensing is an effective means of obtaining LST [5,6,7,8]. With the rapid development of remote sensing technology and inversion algorithms, LST data obtained by thermal infrared remote sensing inversion algorithms are widely used in various fields, such as evapotranspiration and soil moisture estimation [9], urban heat island studies [10,11,12,13], disaster monitoring [14], and environmental monitoring [15]. As the main parameter for the quantitative study of surface urban heat islands (SUHIs), LST is an important data source for monitoring urban thermal environments [4]. At present, domestic and foreign scholars have made many achievements in the quantitative assessment of SUHI [16,17], the distribution characteristics of SUHI [18,19], and the analysis of SUHI influencing factors [20,21], based on LST. Studies have shown that the heterogeneity of urban and suburban surfaces, caused by the substitution of natural surfaces by large impervious surfaces during urbanization, is the fundamental reason for the formation of SUHI [22,23,24]. Urban land cover types [25,26,27,28] and urban forms [29,30] have direct driving effects on SUHI formation and development, while regional climate [31,32], human activities [29,33], and the built-up area [34] also affect the intensity and distribution of SUHI. However, these studies do not consider surface temperature directionality when calculating SUHI intensity by LST, thus measuring the urban thermal environment, which affects the accuracy of the studies to some extent. This problem of surface temperature directionality is called thermal radiation directionality (TRD). Because of the complex and diverse characteristics of urban surface structures, there are significant differences in the TRD. In highly urbanized areas, the daytime TRD can reach up to 10 K [35].
At present, research on TRD mainly adopts two methods: model simulations and observational tests. The observational tests are classified according to the observation height: ground-based, airborne, and satellite. In early tests on the surface temperature of the vegetation canopy, scholars found that the temperature varied with the viewing angle [36,37,38]. Moreover, an in-depth observational study on the vegetation TRD revealed that the vegetation TRD was significantly correlated with season, solar zenith angle, and solar azimuth [39], while it was also influenced by the component temperature, component emissivity, component proportion, and inter-component scattering effect [40]. As research on TRD progressed, observational tests on the urban surface were also carried out. However, because of the complexity of urban surface 3D structures, some observational tests have been conducted with thermal infrared imagers, in small study areas [41]. Ground-based observation platforms are more suitable for the TRD study of vegetation or small-scale urban surfaces, because of their narrow field-of-view coverage, and it is difficult to observe study areas with a large-scale and complex surface structure. With the development of airborne remote sensing technology, airborne platform tests compensate for the shortage of ground-based platforms in the coverage range of the field-of-view, and focus on the comparative study of the ground surface in different areas of the city. An airborne observation test by Lagouarde et al. [42] showed that the density of buildings has an important influence on the discrepancy in the directionality of surface thermal radiation in different areas of the city, with maximum TRD differences of up to 7 K. Jiang et al. [43] found that the maximum directional temperature difference in a residential area of Nanjing reached 14 K during the day and up to 3.5 K at night, in their tests observing the TRD. The TRD can reach up to 14 K in the center of Toulouse, France, during the winter [44], while the maximum temperature difference caused by the angle of observation exceeds 9.0 K in the center of Vancouver, Canada, during the summer [4]. Although airborne platforms solve the issue of a narrow field-of-view of ground observations, airborne tests are limited by observation time, space, and expense when studying a larger range of observation objects. Compared with ground and airborne observation platforms, satellites have the advantages of strong periodicity, high resolution, and wide global coverage; however, satellite sensor platforms that can simultaneously perform multi-angle observations are yet to be developed. Therefore, the directionality of satellite observations of LST is generally studied by satellite sensors with a wide field-of-view, such as ATSR, MODIS, AVHRR, and VIIRS. Among them, MODIS can conduct daily period observations of the Earth’s surface within the zenith angle observation range of −65° and 65°. However, MODIS does not acquire multi-angle LST instantaneously, and raw LST data cannot be used directly for TRD quantification. Hu et al. [45] proposed a method to obtain MODIS multi-angle LST data, which reduces the errors resulting from instantaneous field-of-view problems, by analyzing MODIS LST data in a long time series. On this basis, the effects of atmospheric attenuation and daily weather variability were eliminated by the difference in surface temperature and air temperature between urban land and adjacent urban water, and the LST related only to the observation angle was obtained. This study is the first of its kind to directly evaluate the effect of TRD on satellite-based SUHI measurements based on directional temperature and land-use intensity. The results show that TRD is up to 9 K during the day and is weaker at night, in addition to leading to an error of 2.3 K in SUHI intensity. Wang et al. [46] adapted Hu’s method, to evaluate the effect of weather variability and solar angle variability by model simulations, which simplified the method of estimating the TRD based on MODIS, but the model still needs further precision validation.
Because of the heterogeneity and geometric structural characteristics of the urban surface, there are discrepancies in the thermal radiation received by different observation directions, resulting in a more significant TRD for the same observation. The TRD intensity also differs significantly under different land cover types; therefore, it is necessary to consider the TRD characteristics of each land cover type when conducting quantitative studies on SUHI intensity. However, the current urban heat island index calculation, using surface temperature without considering directionality, cannot truly reflect the actual situation of SUHI intensity. Moreover, there are various factors affecting the urban TRD, including observation time [44,47], surface geometric structure [48,49,50,51,52], physical properties of materials [49,53,54], and spatial locations between the sun-surface-sensor [55,56,57]; thus, most TRD studies selected more delineated partial surfaces of one or multiple cities for observation or model simulation, and rarely integrated the TRD with SUHI intensity.
Therefore, in this study, we quantified the TRD for different land-use intensities in Hefei for long time series (11 warm seasons) data by using the characteristics of the water body, approximating the Lambertian body to reduce the angular effect of atmospheric attenuation and the effect of daily temperature variations in LST. We also evaluated the influence of the TRD on the quantitative study of SUHI intensity, through a comparative analysis of the TRD for different land-use intensities. The significance of this study is to quantify the urban TRD in Hefei under different land-use intensities over a long time series, and to evaluate the impact of TRD on the results of SUHI intensity, based on satellite data, which provides a methodological case for quantifying urban TRD, to improve the accuracy of quantitative research on SUHI intensity.

2. Materials and Methods

2.1. Study Area

Hefei, Anhui Province, China, was selected as the study area (Figure 1). Hefei, the capital of Anhui Province, is located between the Yangtze River and Huaihe River in the central part of Anhui Province. Its geographical range spans 116°41′–117°58′ E and 30°57′–32°32′ N [58], and it has a subtropical monsoon humid climate, with a clear monsoon season, four distinct seasons, mild climate, and overall moderate rainfall [59]. Chaohu Lake is located in central Anhui Province, surrounded by Hefei, Chaohu, Feidong, Feixi, and Lujiang, with a length of 55 km from east to west, a width of 21 km from north to south, a perimeter of 176 km, an average depth of 2.89 m, an area of 780 km2, and a volume of 2.07 billion m3; it is known as one of the five famous freshwater lakes in China [60,61]. Due to the continuous expansion of urban construction and the rapid growth of the total urban population in Hefei, the resource utilization and ecological environment in the area have been seriously affected, leading to significant changes in the nature of the underlying urban surface and a dramatic increase in anthropogenic heat emissions. While the rapid economic development of Hefei has led to increasingly prominent thermal environmental problems in Hefei. To evaluate the influence of TRD on SUHI intensity, this study analyzes the TRD variation characteristics of land-use intensity at all levels, under different satellite overpass times. Therefore, this study evaluated the entire jurisdiction of Hefei in the study (there are obvious differences in the level of urbanization among Shushan District, Baohe District, Luyang District, Yaohai District, Feixi County, Feidong County, Lujiang County, Changfeng County, and Chaohu City).

2.2. Data

MODIS sensors carry out periodic observations of the Earth’s surface using NASA’s Terra and Aqua polar-orbit satellites. The data acquired by MODIS sensors have high time-space-spectral comprehensive resolution, wide coverage, and free access; however, compared with airborne platform observation or quasi-simultaneous directional model simulation, it is difficult to perform multi-angle observations of the same ground object in an instantaneous field-of-view [62]. Therefore, this study selected long-term series statistics of LST data in Hefei, to reduce the observation error caused by the non-instantaneous field-of-view. MODIS daily LST products (MOD11_A1 and MYD11_A1) are the main data used for LST directionality assessment, and the four overpass times of the satellite (which can be queried by https://oceandata.sci.gsfc.nasa.gov/overpass_pred/ (accessed on 15 August 2022)) were 10:30 (Terra-day), 13:30 (Aqua-day), 22:30 (Terra-night), and 01:30 (Aqua-night) Beijing time. Moreover, the sensor zenith angle (SZA) data utilized in this study were derived from viewing angle data from MODIS daily LST products. According to the above requirements for experimental data, this study collected MODIS daily LST products for May–September 2010–2020. To reduce the effect of cloud occlusion pixels, such as cloud edges, the lowest LST threshold was set to 270 K and low-temperature anomalies were removed. Considering that the summer LST changes and directional differences are more obvious [47], to avoid the influence of seasonal changes in surface vegetation and differences in snow cover on the reflectance of various objects on the urban surface received by the sensor, this study selected May–September, over 11 years, as the observation period. In addition, this study is based on MODIS LST data, because the MODIS data are influenced by atmospheric attenuation factors, and considering the problem of daily temperature variation, the hourly air temperature data of Hefei land and Chaohu Lake, combined with MODIS LST data, were used to reduce the interference of atmospheric factors on urban TRD quantification (the air temperature data of Hefei land were taken from www.ncei.noaa.gov/maps/hourly/ (accessed on 29 December 2021) and the air temperature data of Chaohu Lake were obtained from the Anhui Meteorological Service). Finally, to calculate the influence of TRD on the quantitative study of SUHI intensity, this study selected the 2015 impervious surface cover data of Hefei as the base data of land-use intensity, and resampled the impervious surface cover data to the image element scale of 1 km, for coupling with MODIS LST data.

2.3. Methodology

The real surface is a non-Lambert body, and the urban surface has a complex three-dimensional structure; therefore, the surface component temperature and the difference in emissivity between components must be considered in the quantitative study of urban surface heat island intensity. A water body is similar to a Lambert body and shows a relatively uniform temperature distribution when observed from different angles [63,64]. The physical characteristics of a water body can be used to separate the components of MODIS LST products, other than directional factors such as the angle effect of atmospheric attenuation and daily weather variations.

2.3.1. Separating the Angular Effect of Atmospheric Attenuation

The MODIS LST product used in this study was retrieved using the generalized split-window algorithm [65]. Compared with other retrieval algorithms, the algorithm eliminates the atmospheric effect, by the absorption difference of adjacent thermal infrared bands, when performing atmospheric correction, rather than directly using radiative transfer model parameters and atmospheric profile parameters; it is difficult to determine the source of atmospheric attenuation factors for LST [45]. Thus, MODIS LST data may be influenced by atmospheric attenuation, except for the TRD. In this study, to quantify the directionality of the TRD, the influence of atmospheric attenuation was mainly manifested in the interference of the angular effect of atmospheric attenuation. For the interference of atmospheric attenuation factors, we selected Hefei and Chaohu Lake, which are closely connected spatially, as the land surface and the water surface in this study. First, it can be assumed that the atmospheric conditions of both are similar, and the LSTs of land and water have similar atmospheric attenuation effects, under the same sensor zenith and azimuth angles. Second, based on this assumption, it is feasible to separate the interference of atmospheric attenuation through the difference between the LSTs of land and water, as well as the characteristics of the water body, without obvious TRD, as shown in Equation (1).
Δ L S T ( t ) = L S T ( t )     L S T w a t e r ( t )         ¯
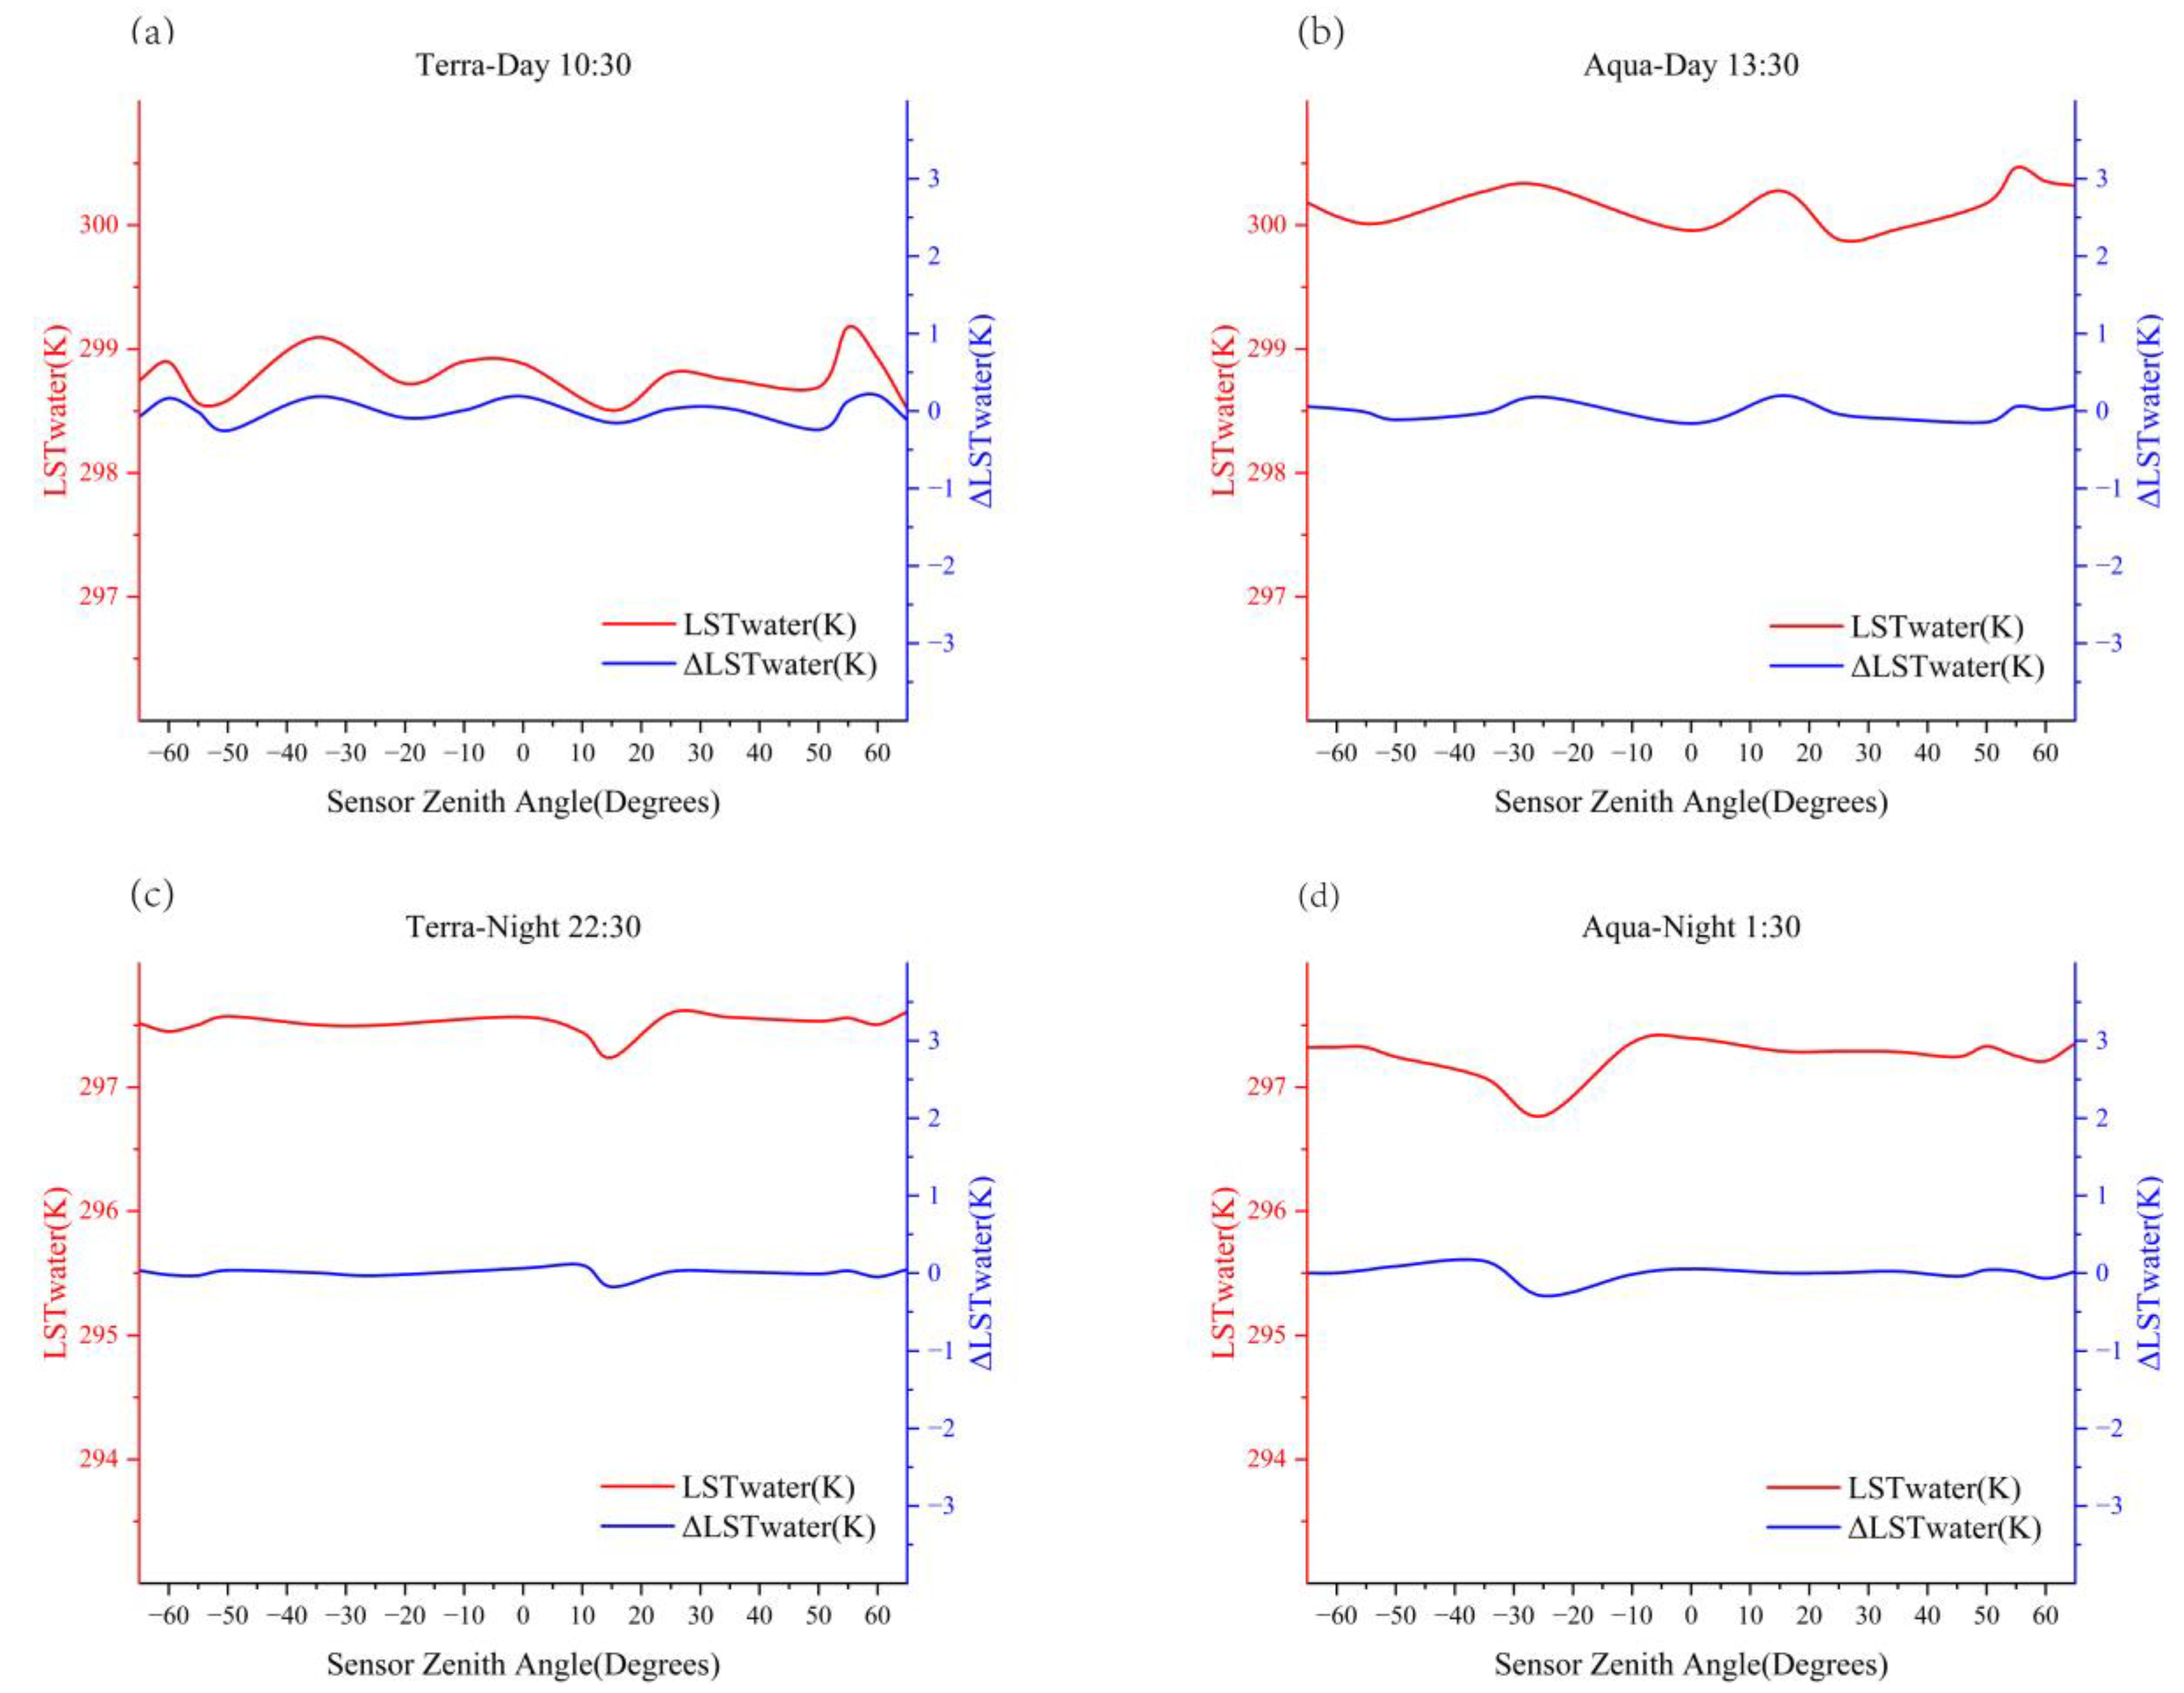
where t is the satellite overpass time, L S T ( t ) is the LST of the satellite overpass time. ( L S T ( t ) is obtained by calculating the average value of all pixels over the land in Hefei, on a daily scale, during each overpass time over the study period. In addition, the L S T ( t ) at different angles is obtained by calculating the average value of all land pixels in Hefei at that angle, on a daily scale, during each overpass time over the study period.) L S T w a t e r ( t ) ¯ is the average LST of all the water body pixels in the region, and Δ L S T ( t ) is the difference between land LST and water LST. The complex three-dimensional structure of the land surface leads to differences in LST observed in different directions. Several steps are required to verify that the surface structure of the water body has no obvious directional characteristics, and to evaluate the feasibility of the method of eliminating the atmospheric attenuation angle effect using Equation (1). First, the Δ L S T w a t e r ( t ) is obtained, by counting the L S T w a t e r ( t ) of different SZAs during each satellite overpass and combining with Equation (1). Second, the fluctuations in L S T w a t e r ( t ) and Δ L S T w a t e r ( t ) at different angles are used to verify the TRD characteristics of the water body, and to evaluate the effectiveness of this study in separating atmospheric attenuation interference. In this study, we found that the MODIS sensor covered a maximum viewing angle of 12° when overpassing Hefei and cannot cover the entire study area range; thus, it is important to note the difference in the SZAs when analyzing changes in Δ L S T ( t ) at different angles. To solve this problem, this study divides all SZAs into one group every 5°, and L S T w a t e r ( t ) in each group is averaged as L S T w a t e r ( t ) ¯ , to analyze the influence of SZA difference on Δ L S T w a t e r ( t ) (because for some overpass times the viewing angles of Chaohu water are incomplete, some intervals are averaged at intervals of 10°). As shown in Figure 2, the changes in L S T w a t e r ( t ) (red line, left y-axis) and Δ L S T w a t e r   ( t ) (blue line, right y-axis) in the Chaohu Lake waters of Hefei, during each satellite overpass, show small fluctuations and are generally stable. This shows that the LST of Chaohu Lake has a relatively uniform distribution, with a maximum difference of 0.46 K when observed at different SZAs, which is consistent with the observed results of TRD on the sea surface [47]. Therefore, the more homogeneous surface structure of the water body has no obvious TRD characteristics, and it is feasible to use the uniform surface structure characteristics of the water body to eliminate the atmospheric attenuation angle effect factors. However, the fluctuations in L S T w a t e r ( t ) and Δ L S T w a t e r   ( t ) are highly correlated in Figure 2, and the fluctuation in Δ L S T w a t e r   ( t ) is smaller than that in L S T w a t e r ( t ) . The influence of atmospheric attenuation angle effect of LST pixels in MODIS water can be effectively reduced by Equation (1), for the same sensor zenith and azimuth angle. As mentioned above, land and water pixels have the same atmospheric attenuation effect under the same or similar sensor angles. Therefore, this method can be applied to land pixels. Theoretically, the distribution of Δ L S T w a t e r   ( t ) will be almost uniform after eliminating the atmospheric attenuation angle effect, but the distribution of Δ L S T w a t e r   ( t ) still has small fluctuations, as shown in Figure 2. This shows that the influence of atmospheric factors cannot be completely separated by Equation (1) alone.

2.3.2. Separating the Effect of Daily Weather Variations

In this study, the statistics of Δ L S T w a t e r   ( t ) under different viewing sensor zenith angles, show that the sensor cannot cover all viewing zenith angles during the satellite overpass. Moreover, we found that the coverage of SZAs varies during the daily satellite overpass, and a larger zenith angle range corresponds to more observational data (the range of the SZA coverage also affects the number of clear-sky data for this zenith angle group). Therefore, the zenith angles of different coverage ranges will have different clear-sky data values, which will directly affect the LST under the zenith angles. In addition, according to the physical properties of land and water, the diurnal variation in water temperature is smaller than that of land; thus, daily weather variability has a greater impact on Δ L S T in land areas. To reduce the effect of daily weather variability, and to solve the problem of differences in the distribution of clear and cloudy days between the SZA groups in the directional quantization process, this study introduced near-surface meteorological data from land and adjacent water (meteorological station locations are shown in Figure 1), to correct the effect of daily weather variations, as shown in Equation (2).
Δ T a i r ( t ) = T a i r , l a n d ( t ) T a i r , w a t e r ( t )
where Δ T a i r ( t ) is the air temperature difference between the land of Hefei and Chaohu water during each satellite overpass, T a i r , l a n d ( t ) is the air temperature of land during each satellite overpass ( T a i r , l a n d ( t ) is obtained by calculating the daily average air temperature of the land, during each overpass time, in each year over the study period), and T a i r , w a t e r ( t ) is the air temperature of water during each satellite overpass ( T a i r , w a t e r ( t ) is obtained by calculating the daily average air temperature of the water, during each overpass time, in each year over the study period). The air temperature data in this study were derived from the records of regional near-surface meteorological stations, which were not affected by TRD, and there was a strong correlation between the air temperature and surface temperature data [66,67]. Thus, this study is feasible for solving the impact of surface temperature variations by analyzing air temperature variations. In addition, considering the radiation temperature, the physical mechanism of air temperature, and differences in land and water observation locations, daily weather variations may represent only a portion of the daily variations in Δ L S T in Hefei. Thus, this study introduces the influence coefficient α , and uses Equation (3) to separate the impact of this factor.
Δ L S T Δ T a i r ( t ) = Δ L S T ( t ) α × ( Δ T a i r ( t ) Δ T a i r ¯ )
where Δ L S T ( t ) is the difference between land and water LST during each satellite overpass ( Δ L S T ( t ) is calculated on a daily basis as the difference between the average LST of all land pixels and all water pixels in Hefei, during each overpass time, in each year over the study period), Δ L S T Δ T a i r ( t ) is Δ L S T ( t ) after reducing the influence of daily weather variations, Δ T a i r ( t ) is the difference in air temperature between land and water during each time of satellite overpass, Δ T a i r ¯ is the average value of Δ T a i r ( t ) at four different times of satellite overpass, and α is the influence coefficient of daily weather variations on the daily variations in Δ L S T .
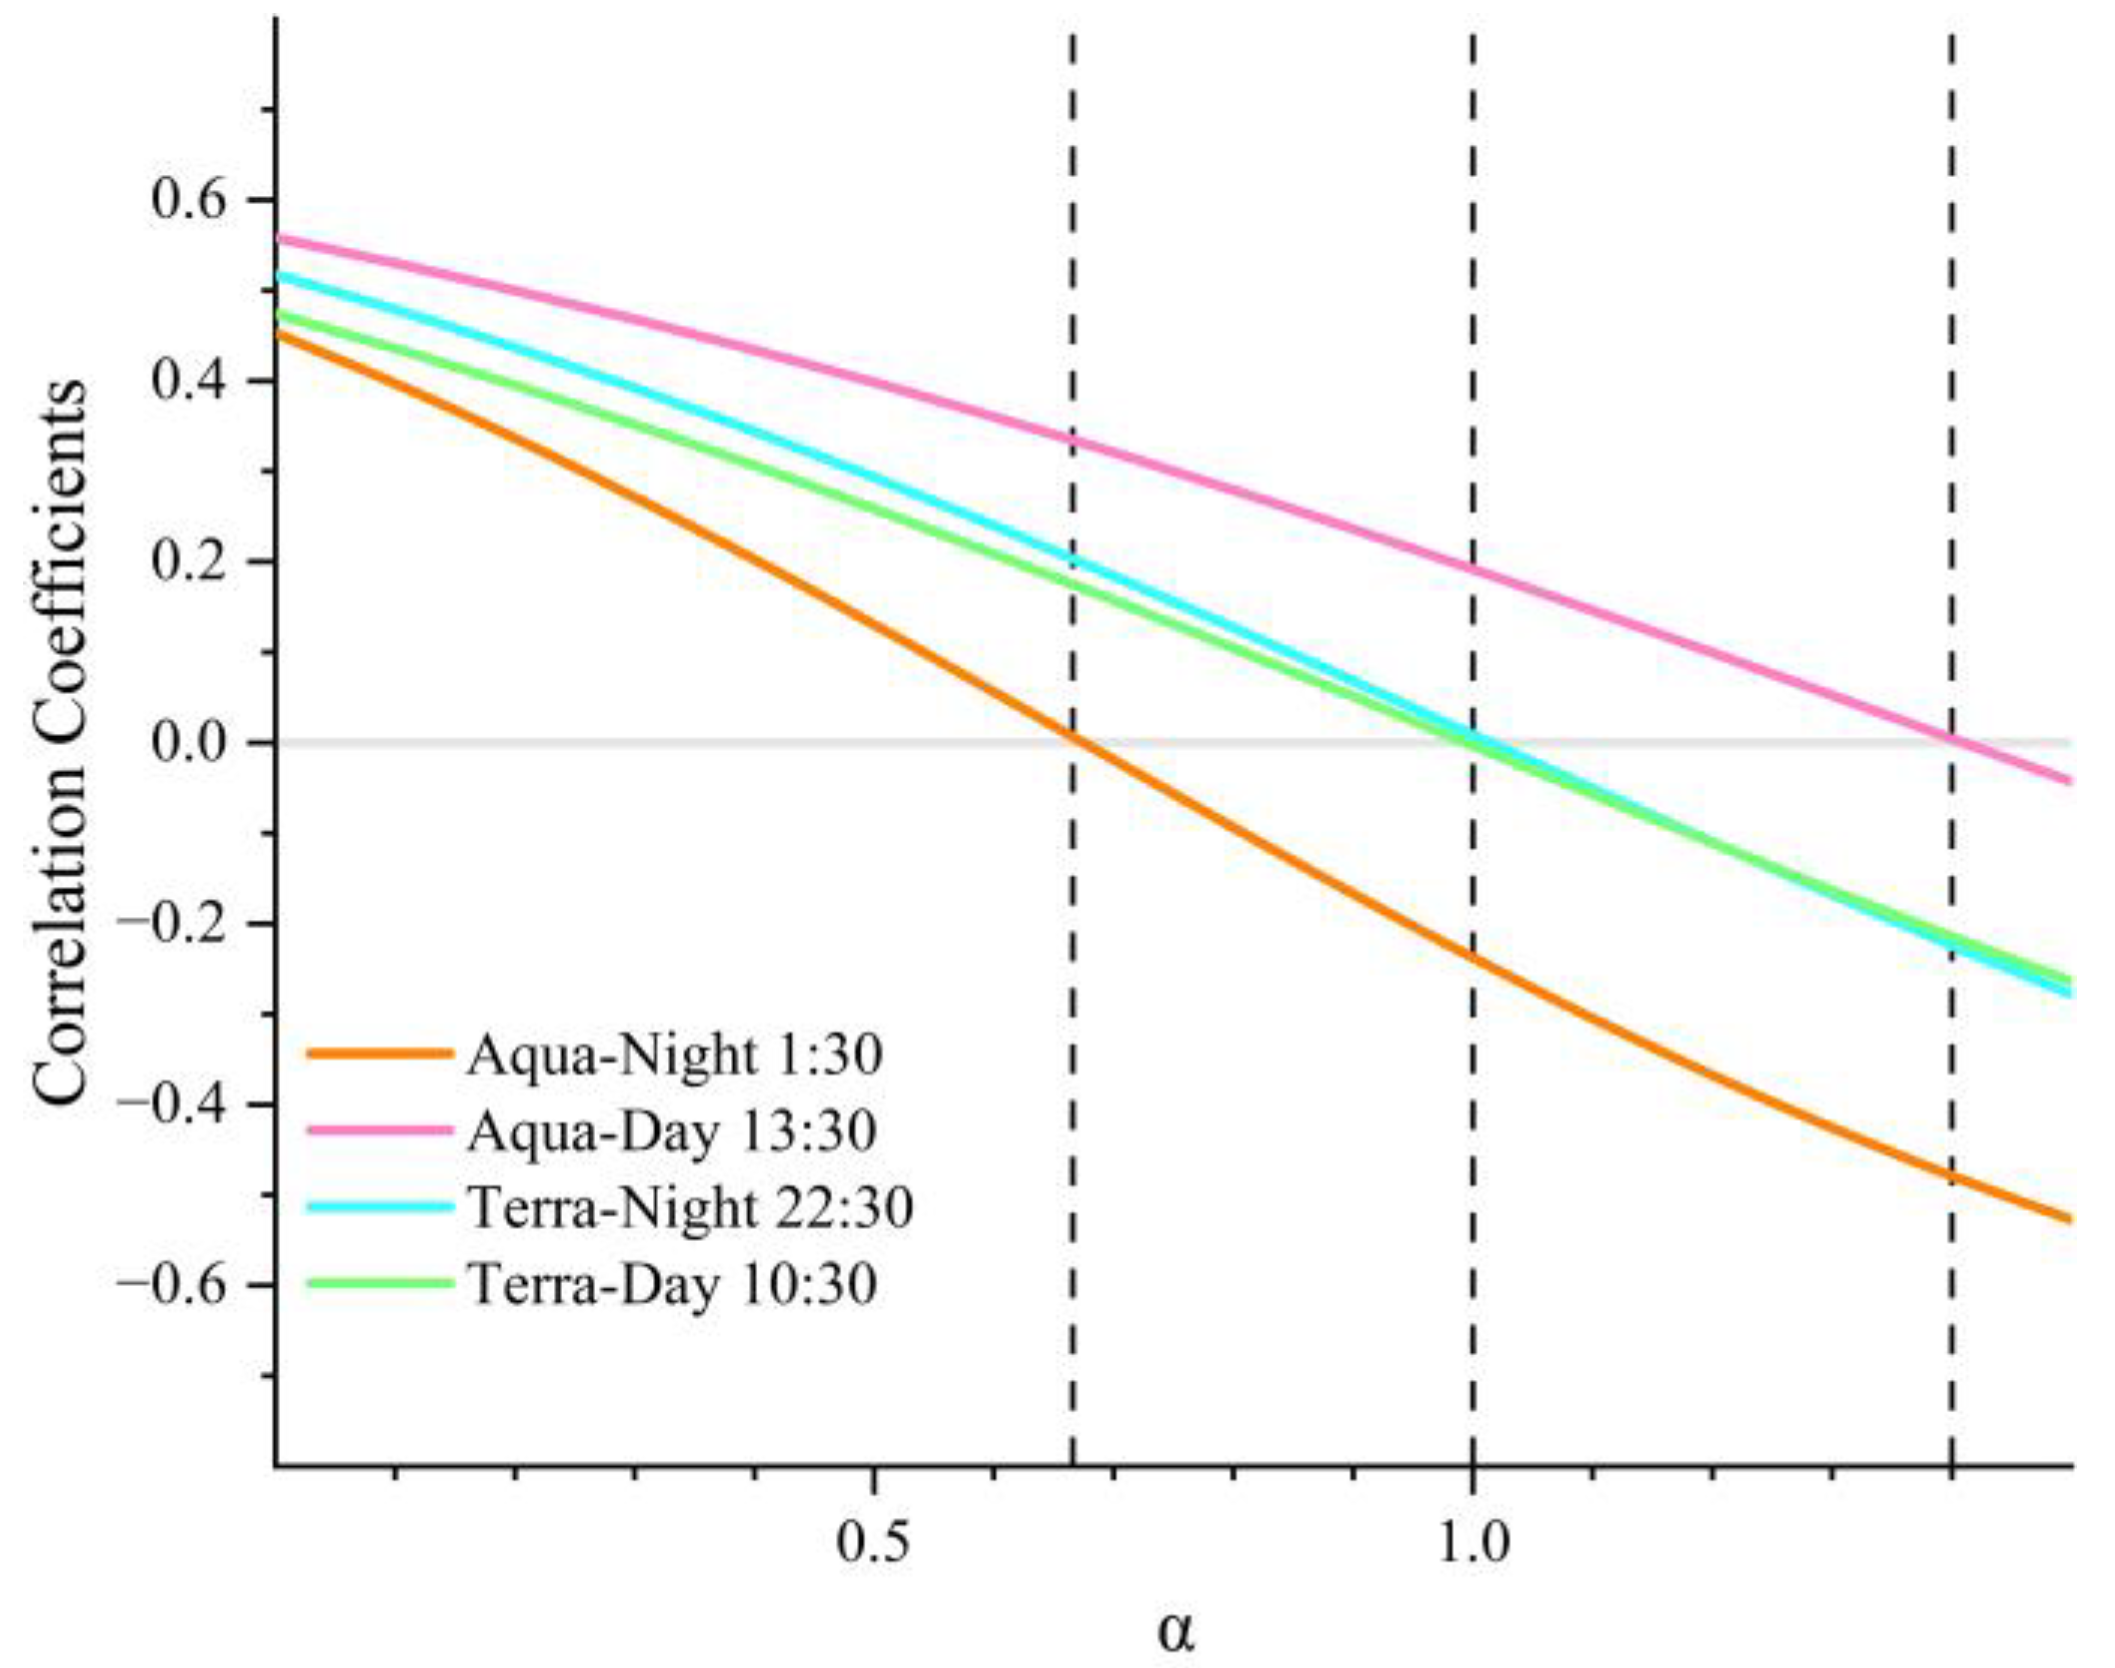
In Figure 3, we find that Δ L S T Δ T a i r and Δ T a i r show a correlation of approximately 0.5 for different satellite overpass times when α is 0 in Equation (3), during the 11 year study period, which verifies that there is a correlation between LST and air temperature. Therefore, it is feasible to reduce the effects of daily weather variations using Equation (3). In this study, the value of α is used as an adjustment factor, to account for the effect of daily air temperature variability on LST. The α values were determined by evaluating the correlation between Δ L S T Δ T a i r and Δ T a i r at different values. The final α value was determined by identifying when the correlation between Δ L S T Δ T a i r and Δ T a i r was minimized in the time series. Specifically, α values of 1, 1.4, 1, and 0.7, were found to minimize the correlation between Δ T a i r and Δ T a i r for Terra-day, Aqua-day, Terra-night, and Aqua-night, respectively, thus minimizing the effect of daily air temperature variability. In addition to the intuitive effect of daily temperature variations, other factors, such as surface humidity and wind, also affect the Δ L S T Δ T a i r . However, because the analysis of Δ L S T Δ T a i r was highly aggregated in time and space in the later stage of this study, it reduced the influence of variations in other factors on our results.

2.3.3. Relationship between SUHI Intensity and TRD

In previous sections, a method to reduce the interference of atmospheric factors was discussed. Furthermore, the Δ L S T Δ T a i r was obtained by reducing the atmospheric attenuation angle effect, daily weather variations, and other factors. To evaluate the influence of the TRD on the SUHI intensity in Hefei, this section introduces the maximum temperature difference between different SZAs, δ L S T d i r , m a x m i n (see Equation (4)), as the effective thermal anisotropy [49] (also referred to as TRD in this study). Additionally, the urban heat island curve (UHIC) method [68] is introduced, based on the effective thermal anisotropy. The UHIC method can be used not only to explore the spatial relationship between LST and urban land-use intensity, but also to describe the temperature variations in the spatial aggregation of different gridded land-use data. First, we used the impervious surface percentage grid data, at the 1 km pixel scale, of Hefei as the basis for the division of SUHI intensity, and divided all grid units in Hefei into nine categories, except Chaohu Lake. The pixels under each category had corresponding LST values. Finally, we divided all the SZAs into seven groups to calculate each group’s maximum SUHI value, to evaluate the impact of the TRD on the SUHI in Hefei.
δ L S T d i r , m a x m i n = m a x ( Δ L S T Δ T a i r ( θ ) ) m i n ( Δ L S T Δ T a i r ( θ ) )      
where δ L S T d i r , m a x m i n is the maximum temperature difference at different SZAs. As the sensor azimuthal variations in this study were small, only the variations in zenith angles should be considered for δ L S T d i r , m a x m i n . m a x ( Δ L S T Δ T a i r ( θ ) ) and m i n ( Δ L S T Δ T a i r ( θ ) ) represent the maximum and minimum values of Δ L S T Δ T a i r observed at different SZAs, respectively.

3. Results

3.1. Spatial and Temporal Distribution Characteristics of TRD

In this study, the land-use intensity was divided by the impervious surface percentage grid data of Hefei, at the 1 km pixel scale, and the Δ L S T Δ T a i r of different SZAs at each overpass time was calculated, and the results are shown in Figure 4. To ensure the statistical significance of the data and avoid the contingency and outliers caused by the small number of pixels, this study set the pixel number threshold to 100 when counting the pixel number of each SZA for different land-use intensities.
It can be seen from Figure 4 that Δ L S T Δ T a i r changes more strongly during the day than at night, and an obvious Δ L S T Δ T a i r hotspot appears at 10:30, when the SZA is 20° (see Figure 4a), and this hotspot is more obvious in areas with higher urban land-use intensity. Moreover, we found that the SZA was approximately the same as that of the sun at this time, but the position of the sun and the sensor were not on the same side. The appearance of this hotspot was most likely caused by the higher proportion of the sunlight surface observed under the 20° zenith angle compared to other zenith angles. In addition, another hotspot appeared at 13:30, when the sensor was near the zenith position (see Figure 4b). The reason for this, is that the sensor and sun were located on the same side at this time, and the sunlight surface accounted for a relatively high proportion of the response. Notably, the SZA was near the nadir at this time; compared with other SZAs, the roof and street components in the field-of-view accounted for a relatively high proportion of the response. Meanwhile, the roof and part of the street were affected by sunlight for a long time, combined with the heat accumulation of building materials, this resulted in localized high temperatures on the ground surface under this SZA. Studies on the roof, street, and wall component temperature comparisons can be found in [49,53]. In addition, the Δ L S T Δ T a i r fluctuation was more obvious when the daytime SZA was close to the maximum, and the proportion of the wall component in the field-of-view was higher at this angle. Compared with roofs, walls were vulnerable to the shadow of other buildings and the influence of the solar position, and the distribution of sunlight was more complex, while wall heat increase was not as obvious as that of roofs, streets, and other components. Therefore, Δ L S T Δ T a i r under a larger SZA during the day was relatively low, and there was also a large difference between the wall-to-wall temperatures for different times and proportions of sunlight surface, which is essentially the same as the results of the multi-angle observations in Toulouse [42]. At night, the Δ L S T Δ T a i r distribution of each SZA was significantly different from that of the daytime, and the overall distribution characteristics were low in the middle, and high on both sides (Figure 4c,d). This distribution characteristic was mainly caused by the high proportion of wall components in the field-of-view, when the SZA was large at night, and the thermal insulation effect of walls outperformed those of roofs and streets [69,70]; thus, the overall nighttime temperature was higher at this SZA.
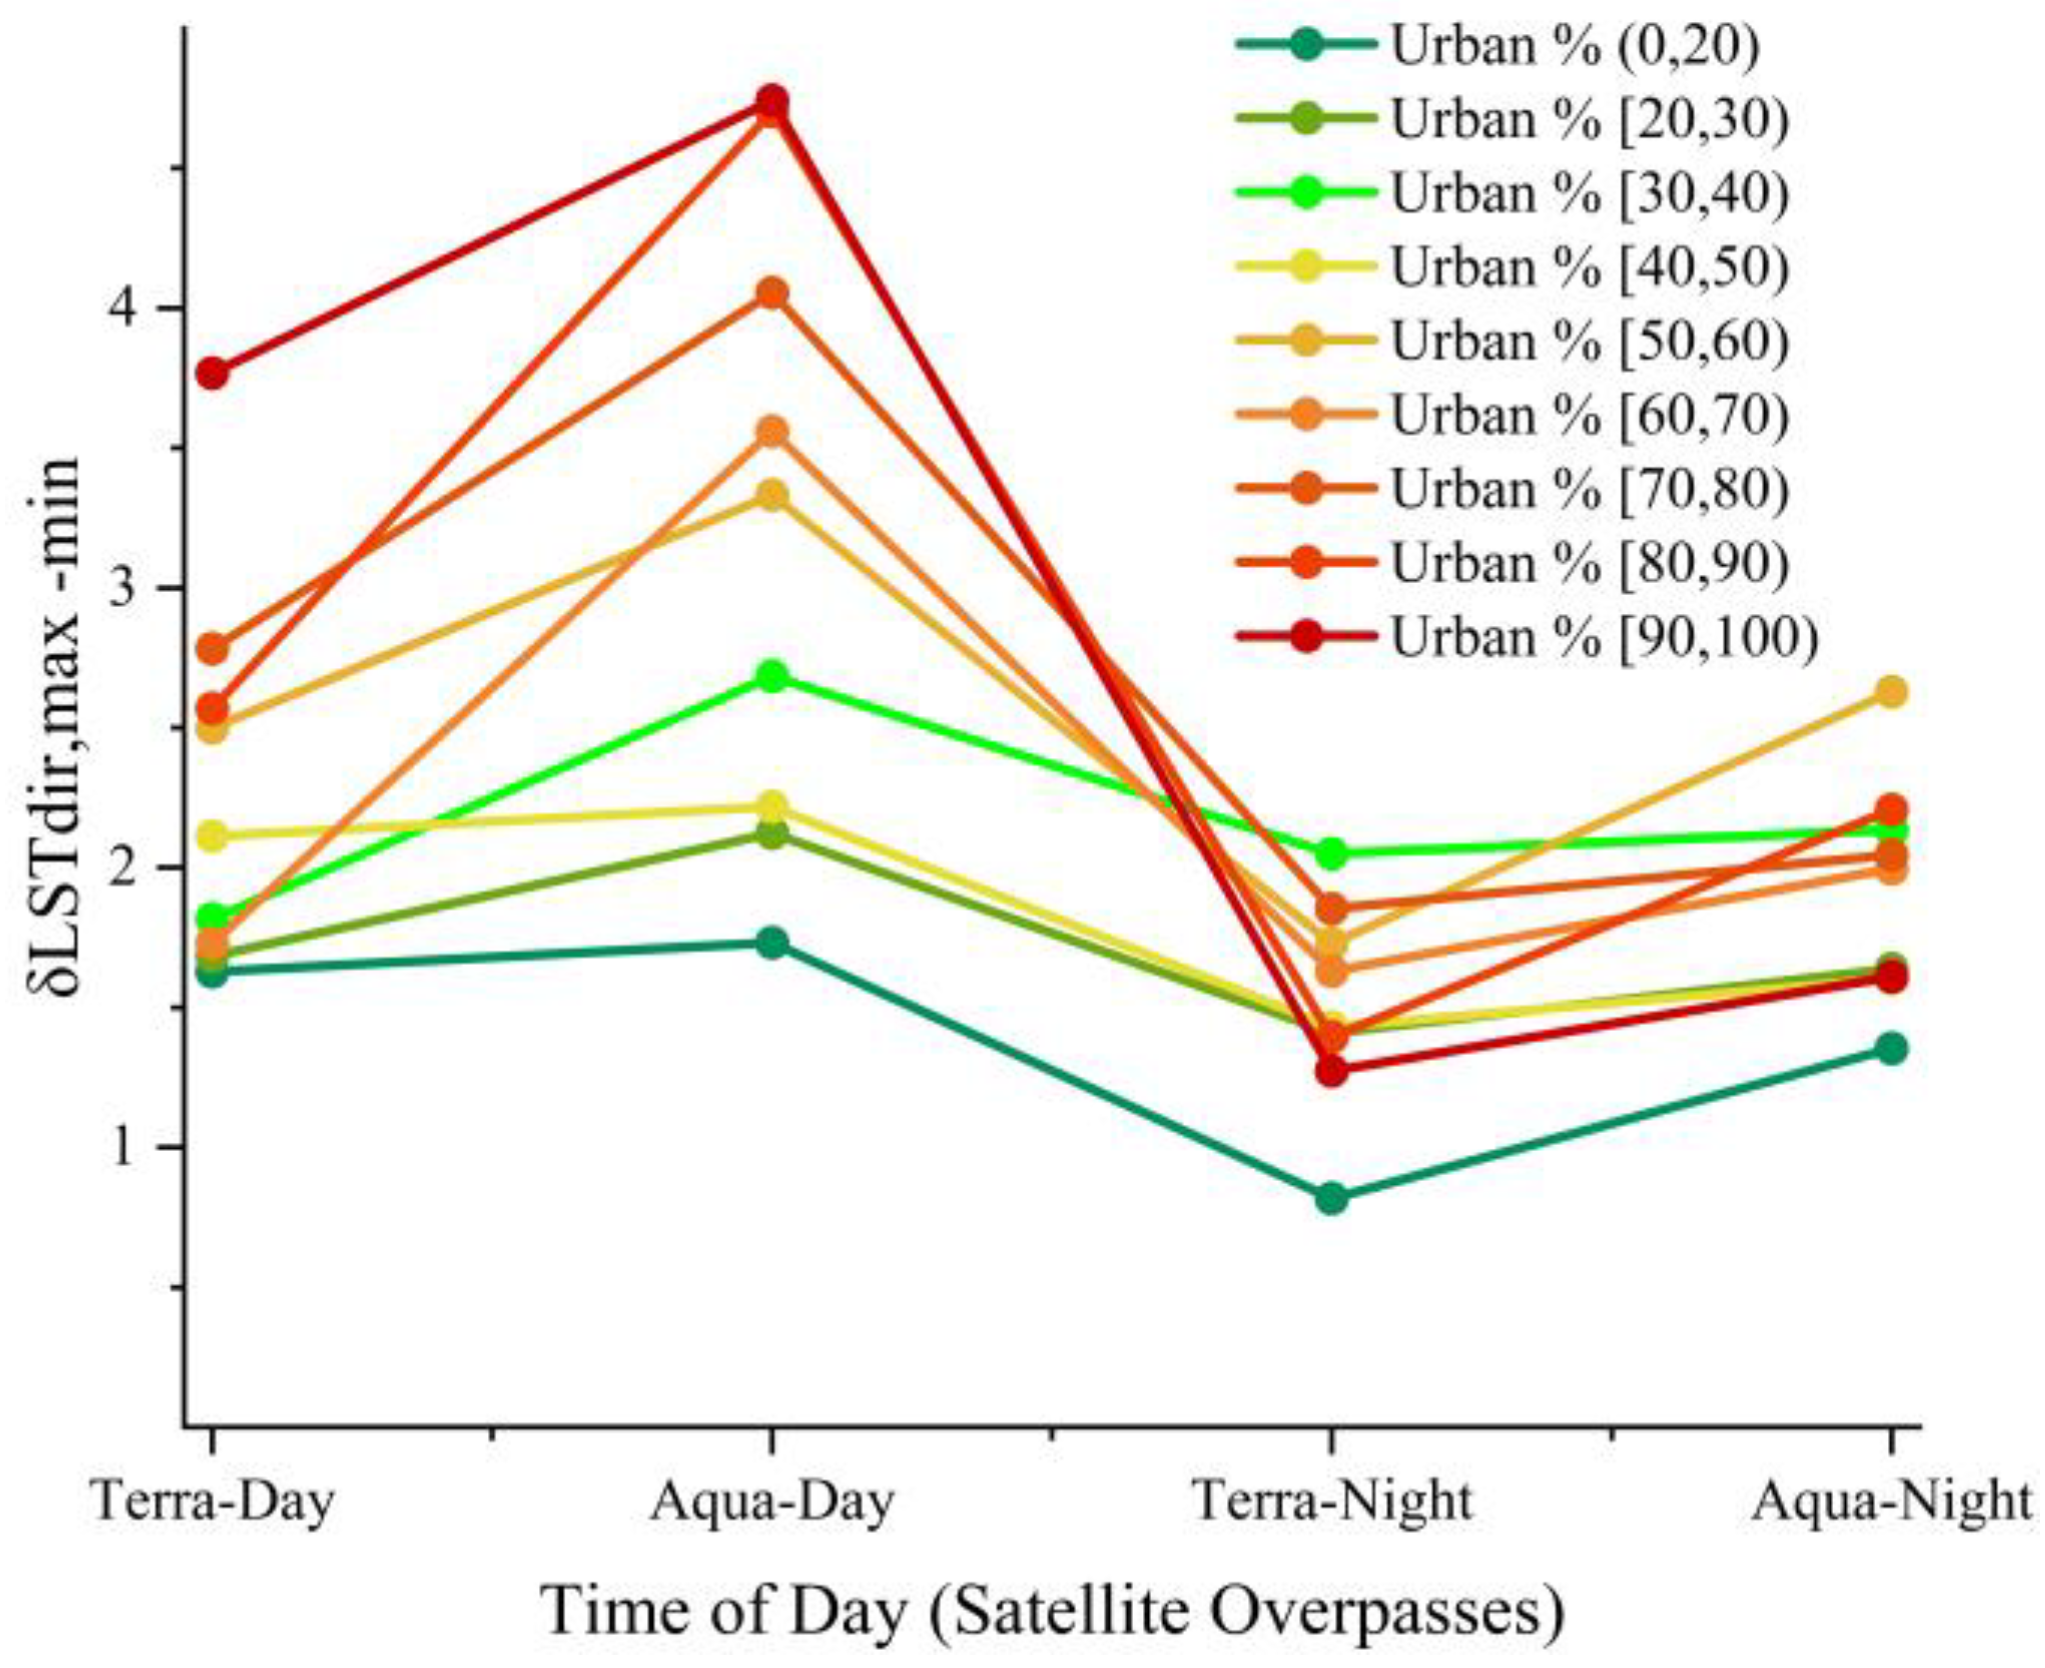
As shown in Figure 5, the maximum TRD of Hefei reaches 4.7 K, which appears in the land-use intensity group with the highest degree of urbanization, in the afternoon. This result is consistent with the research results of TRD in Chicago and New York [45], both spatially and temporally; however, there are significant differences in TRD intensity. This is closely associated with the level of urbanization development in the study area, the shape of the surface structure of the study area, and differences in the climatic environment. To further understand the differences in urban surface structure among Chicago, New York, and Hefei, this study compared and analyzed Google Earth and building height data for these cities. The results show that the low-rise buildings in Chicago and New York are densely and mostly regularly distributed, in residential areas and other land types with relatively low economic value, whereas the high-rise buildings show relatively scattered and irregular distribution, mostly concentrated in urban economic centers. Within the time range of this study, the urban surface of Hefei was mostly composed of densely packed middle- and high-rise buildings, with block distribution, and relatively low-rise buildings with a dense and regular distribution. Most middle- and high-rise buildings in Hefei are widely distributed, and are found in residential areas built around commercial areas, which is caused by the large population and shortage of land in Hefei, resulting in high-rise residential areas. Combined with the above differences in TRD intensity, there is a significant connection between the height of urban buildings and the density of their distribution and TRD. Regarding the influence of the three-dimensional structure of urban surfaces on TRD, scholars have obtained similar results through models or observations, in which urban landscapes with medium-density high-rise buildings, show higher TRD [49,52,71].

3.2. Influence of TRD on SUHI Quantification

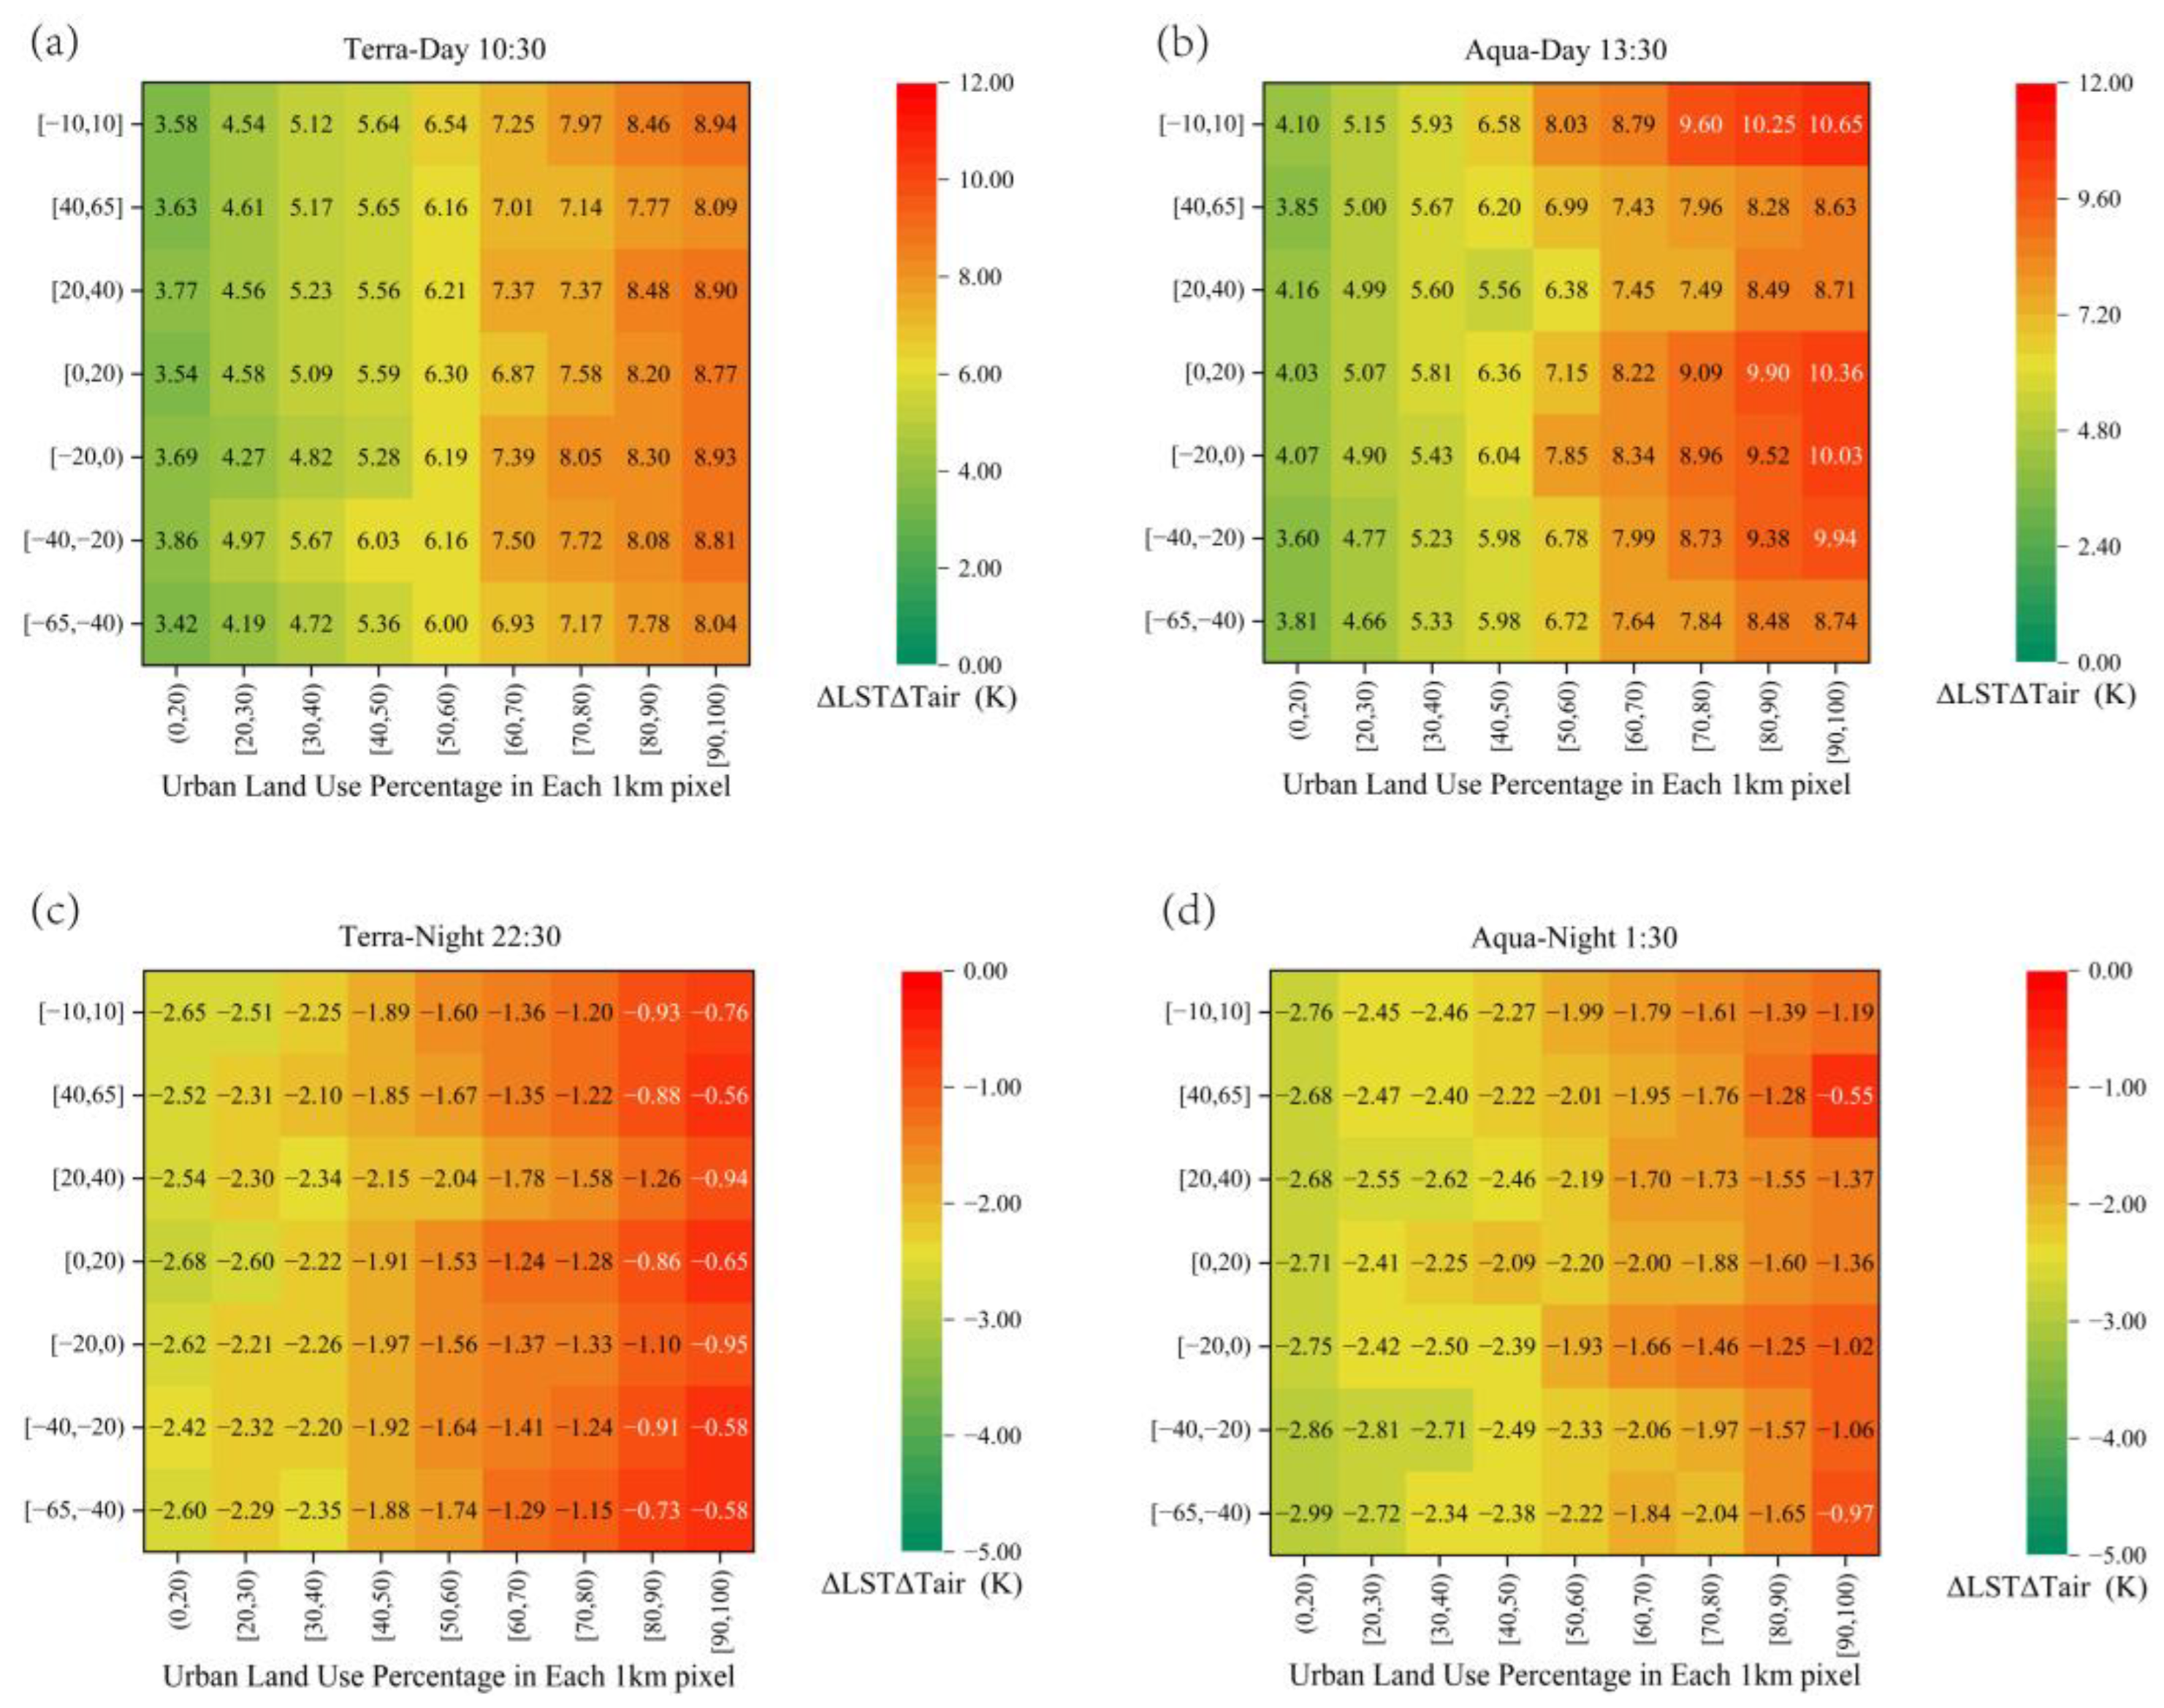
In this study, all SZAs were divided into seven groups of SZA ranges, and the Δ L S T Δ T a i r for each SZA group was counted, based on Δ L S T Δ T a i r under different land-use intensity percentages, as shown in Figure 6. The Δ L S T Δ T a i r in the afternoon, near the zenith position, was larger than the angle groups at other times and positions. This distribution feature was mainly caused by the different sunlight and shadow conditions of the observed objects at different sensor-sun-ground positions, as well as the different component area proportions of the surface, roof, wall, etc., in the field-of-view of the SZA group. At nighttime, we found that the distribution of Δ L S T Δ T a i r was the opposite of that in the daytime, with the larger viewing angle group (when the SZA in this group was close to maximum) being higher than in the other groups. This distribution feature occurs because, when the conditions of sunlight and shadow components are relatively uniform, the main source of temperature variation is related to the thermal inertia of the materials of urban surface attachment and the anthropogenic thermal contribution inside the buildings. For example, in the [−65, −40] zenith angle group in Figure 6c,d, when the sensor observation location is close to the ground, the component of the wall within the sensor has a higher areal proportion compared to the other components, and the wall is warmer than the roof and street because of the difference in the insulation properties of the building material [35,69,70]. Therefore, Δ L S T Δ T a i r fluctuated more smoothly at night. Moreover, the temperature variation characteristics of the zenith angle group were opposite to those in the daytime.
Based on the statistics of Δ L S T Δ T a i r for each zenith angle group, this study directly evaluated the influence of TRD on SUHI quantification, and the results are shown in Figure 7. The SUHI was higher in areas with high land-use intensity percentages and developed urbanization levels, than in other areas. In addition, in Figure 7, there is a more significant difference in temperature for the same land-use intensity percentage under different SZA groups, which is mainly caused by the influence of TRD, and generates up to 2.0 K uncertainty for quantifying the SUHI in Hefei, which is approximately 31–44% of the total SUHI. Moreover, the impact of TRD during the daytime was more significant than that at nighttime, averaging approximately 1.37 K, compared to only 0.61 K at night. This is roughly the same as in the study of urban TRDs in New York and Chicago [45]. Despite a certain demonstration of the generalizability of using water bodies to separate disturbances and thus quantify TRD, the results are still not directly applicable to the quantification of global heat island intensity, as the key factor is the significant differences in the surface structure and geo-climatic environments of different cities.

4. Discussion

This study conducted a comprehensive analysis of the TRD in Hefei, based on eleven years of MODIS LST data, and reduced the angular effect of atmospheric attenuation and the effect of daily temperature variations in quantifying the TRD, and finally evaluated the impact of TRD on the quantification of SUHI intensity, observed by satellite. However, the present study has room for further improvement. In this study, a land-use intensity division was constructed based on impervious surface data, and the variability characteristics of TRD under different land-use intensities were analyzed. However, because of the difficulty in obtaining 3D morphological data (such as the ratio of urban building height and street width) in Hefei, a specific analysis of the relationship between the urban 3D morphological ratio and the spatial and temporal variation patterns of urban TRD and hotspot distribution, needs to be further developed. Land-use types have a significant impact on the distribution of TRD. Different types of land use, such as buildings, roads, green spaces, and farmland, exhibit distinct abilities to reflect, absorb, and conduct solar radiation, thereby impacting the directional distribution of LST. In this study, the prevalence of farmland in the study area, relative to cities such as New York and Chicago, with less farmland, leads to a lower overall SUHI and TRD in Hefei. To enhance our comprehension of the changes in TRD resulting from varying land-use intensities, a quantitative investigation of the impact of specific land-use types on TRD should be conducted in the future. This can be achieved by subdividing land-use types and identifying the differences and patterns in TRD for each type. Moreover, by comparing the TRD intensity with the SUHI of different land-use types, we can obtain a more precise evaluation of the influence of land-use types on the formation of urban heat islands. To address the problem of MODIS’s non-instantaneous field-of-view observations, this study analyzes long time series of MODIS LST data, to decrease the uncertainty caused by the instantaneous field-of-view problem and to ensure accuracy in quantifying the TRD. In the future, this problem can be addressed by methodological improvements. For example, the sensor field-of-view is restricted to a narrow range, in which all pixels are observed at the same overpass time [72,73]. Finally, for the analysis of the results, we find that in the comparative analysis of the urban TRD in Hefei, New York, and Chicago, there are significant differences in the intensity of directionality among the three cities, but there are similarities in the distribution of directional hotspots, and the characteristics of variation in directionality under different land-use intensities. These similarities may primarily be attributed to the similarities in the layout of urban structures, population density, and building materials among the three cities. Additionally, the similar climatic conditions among the three cities may contribute to this phenomenon. To investigate whether different urban study areas have the commonality of directional hotspot distribution and variation characteristics, we will conduct a comprehensive study and analysis of multiple cities in different geographical locations globally, in the future, and thus explore the pattern of TRD hotspot distribution.

5. Conclusions

Based on the problem that TRD interferes with the quantification of SUHI intensity, this study collates and counts MODIS LST data for the warm months (May–September) in Hefei, over eleven years. Based on the differences in surface materials between land and adjacent water bodies, the similarity of daily weather variations, and the similarity of the angular effect of atmospheric attenuation, we separated atmospheric attenuation and daily weather variations from the MODIS LST data, to quantify the TRD at each land-use intensity. Finally, we evaluated the influence of the TRD on the SUHI based on satellite data, by comparing the SUHI of each SZA group. The results show that: (1) there is a significant diurnal difference in the urban TRD, and the TRD in the highest urbanized areas can reach up to 4.6 K during the daytime, while it is relatively low at night, but still up to 2.6 K. This result is similar to the results of aerial observations and urban TRD model simulations, in terms of the spatial and temporal distribution characteristics of TRD. (2) During the daytime, two directional “hot spot” features are observed: one is in the forenoon, where the SZA is approximately the same as the solar zenith angle, but the sensor and sun are positioned on opposite sides. The other is in the afternoon, when the SZA is near the nadir, and the sensor and sun positions are on the same side. The causes of both hotspots are related to the proportion of the sunlight shadowing component. (3) Urban morphological characteristics, local land and water layouts, and climatic environment are important factors that cause differences in the intensity of TRD among cities. (4) The effect of the TRD on SUHI intensity, quantified based on satellite data in Hefei, is approximately 2.0 K, which is approximately 31–44% of the total SUHI in Hefei. This study quantitatively evaluates the influence of urban TRD on SUHI and provides theoretical guidance for quantitative and accurate remote sensing estimation of the urban heat island, which is expected to promote the development of quantitative urban environment thermal remote sensing monitoring.

Author Contributions

Conceptualization, B.S., L.T. and L.J.; methodology, L.T. and B.S.; formal analysis, B.S. and J.Z.; writing—original draft preparation, B.S., L.T., L.J., J.Z. and J.G.; writing—review and editing, B.S., L.T. and L.J.; visualization, B.S. and J.Z.; supervision, L.T. and J.G.; project administration, L.T.; funding acquisition, L.T. All authors have read and agreed to the published version of the manuscript.

Funding

This research was funded by the National Natural Science Foundation of China, grant number 41801234.

Institutional Review Board Statement

Not applicable.

Informed Consent Statement

Not applicable.

Data Availability Statement

The data used to support the findings of this study area are available from the corresponding author upon request via email.

Acknowledgments

The air temperature data of Chaohu Lake was obtained from Anhui Meteorological Service. We thank them for their kind complimentary provision of these data.

Conflicts of Interest

The authors declare that they have no conflict of interest.

References

  1. Li, Z.L.; Tang, B.H.; Wu, H.; Ren, H.Z.; Yan, G.J.; Wan, Z.M.; Trigo, I.F.; Sobrino, J.A. Satellite-derived land surface temperature: Current status and perspectives. Remote Sens. Environ. 2013, 131, 14–37. [Google Scholar] [CrossRef] [Green Version]
  2. Sobrino, J.A.; Jimenez-Munoz, J.C. Minimum configuration of thermal infrared bands for land surface temperature and emissivity estimation in the context of potential future missions. Remote Sens. Environ. 2014, 148, 158–167. [Google Scholar] [CrossRef]
  3. Urbanski, J.A.; Wochna, A.; Bubak, I.; Grzybowski, W.; Lukawska-Matuszewska, K.; Lacka, M.; Sliwinska, S.; Wojtasiewicz, B.; Zajaczkowski, M. Application of Landsat 8 imagery to regional-scale assessment of lake water quality. Int. J. Appl. Earth Obs. 2016, 51, 28–36. [Google Scholar]
  4. Voogt, J.A.; Oke, T.R. Thermal remote sensing of urban climates. Remote Sens. Environ. 2003, 86, 370–384. [Google Scholar] [CrossRef]
  5. Duan, S.B.; Li, Z.L.; Leng, P. A framework for the retrieval of all-weather land surface temperature at a high spatial resolution from polar-orbiting thermal infrared and passive microwave data. Remote Sens. Environ. 2017, 195, 107–117. [Google Scholar] [CrossRef]
  6. Jiang, Y.; Lin, W.P. A Comparative Analysis of Retrieval Algorithms of Land Surface Temperature from Landsat-8 Data: A Case Study of Shanghai, China. Int. J. Environ. Res. Public Health 2021, 18, 5659. [Google Scholar] [CrossRef] [PubMed]
  7. Ye, X.; Ren, H.Z.; Zhu, J.S.; Fan, W.J.; Qin, Q.M. Split-Window Algorithm for Land Surface Temperature Retrieval from Landsat-9 Remote Sensing Images. IEEE Geosci. Remote Sens. Lett. 2022, 19, 1–5. [Google Scholar] [CrossRef]
  8. Zheng, X.P.; Li, Z.L.; Wang, T.X.; Huang, H.B.; Nerry, F. Determination of global land surface temperature using data from only five selected thermal infrared channels: Method extension and accuracy assessment. Remote Sens. Environ. 2022, 268, 112774. [Google Scholar] [CrossRef]
  9. Ma, Y.F.; Liu, S.M.; Song, L.S.; Xu, Z.W.; Liu, Y.L.; Xu, T.R.; Zhu, Z.L. Estimation of daily evapotranspiration and irrigation water efficiency at a Landsat-like scale for an arid irrigation area using multi-source remote sensing data. Remote Sens. Environ. 2018, 216, 715–734. [Google Scholar] [CrossRef]
  10. Lai, J.; Zhan, W.; Quan, J.; Liu, Z.; Li, L.; Huang, F.; Hong, F.; Liao, W. Reconciling Debates on the Controls on Surface Urban Heat Island Intensity: Effects of Scale and Sampling. Geophys. Res. Lett. 2021, 48, e2021GL094485. [Google Scholar] [CrossRef]
  11. Liu, Z.; Zhan, W.; Lai, J.; Bechtel, B.; Lee, X.; Hong, F.; Li, L.; Huang, F.; Li, J. Taxonomy of seasonal and diurnal clear-sky climatology of surface urban heat island dynamics across global cities. ISPRS J. Photogramm. Remote Sens. 2022, 187, 14–33. [Google Scholar] [CrossRef]
  12. Zhan, W.; Ju, W.; Hai, S.; Ferguson, G.; Quan, J.; Tang, C.; Guo, Z.; Kong, F. Satellite-Derived Subsurface Urban Heat Island. Environ. Sci. Technol. 2014, 48, 12134–12140. [Google Scholar] [CrossRef] [PubMed]
  13. Zhan, W.; Liu, Z.; Bechtel, B.; Li, J.; Lai, J.; Fu, H.; Li, L.; Huang, F.; Wang, C.; Chen, Y. Urban-Rural Gradient in Urban Heat Island Variations Responsive to Large-scale Human Activity Changes during Chinese New Year Holiday. Geophys. Res. Lett. 2022, 49, e2022GL100689. [Google Scholar] [CrossRef]
  14. Sekertekin, A.; Arslan, N. Monitoring thermal anomaly and radiative heat flux using thermal infrared satellite imagery—A case study at Tuzla geothermal region. Geothermics 2019, 78, 243–254. [Google Scholar] [CrossRef]
  15. Alvarez-Mendoza, C.I.; Teodoro, A.; Ramirez-Cando, L. Spatial estimation of surface ozone concentrations in Quito Ecuador with remote sensing data, air pollution measurements and meteorological variables. Environ. Monit. Assess. 2019, 191, 155. [Google Scholar] [CrossRef]
  16. Liu, Y.; Fang, X.Y.; Zhang, S.; Luan, Q.; Quan, W.J. Research on quantitative evaluations of heat islands for the Beijing-Tianjin-Hebei Urban Agglomeration. Shengtai Xuebao/Acta Ecol. Sin. 2017, 37, 5818–5835. [Google Scholar]
  17. Xue, X.; He, T.; Xu, L.; Tong, C.; Ye, Y.; Liu, H.; Xu, D.; Zheng, X. Quantifying the spatial pattern of urban heat islands and the associated cooling effect of blue–green landscapes using multisource remote sensing data. Sci. Total Environ. 2022, 843, 156829. [Google Scholar] [CrossRef] [PubMed]
  18. Zhang, Y.T.; Li, D.L.; Liu, L.B.; Liang, Z.; Shen, J.S.; Wei, F.L.; Li, S.C. Spatiotemporal Characteristics of the Surface Urban Heat Island and Its Driving Factors Based on Local Climate Zones and Population in Beijing, China. Atmosphere 2021, 12, 1271. [Google Scholar] [CrossRef]
  19. Hu, J.; Yang, Y.; Zhou, Y.; Zhang, T.; Ma, Z.; Meng, X. Spatial patterns and temporal variations of footprint and intensity of surface urban heat island in 141 China cities. Sustain. Cities Soc. 2021, 77, 103585. [Google Scholar] [CrossRef]
  20. Ejiagha, I.R.; Ahmed, M.R.; Dewan, A.; Gupta, A.; Rangelova, E.; Hassan, Q.K. Urban Warming of the Two Most Populated Cities in the Canadian Province of Alberta, and Its Influencing Factors. Sensors 2022, 22, 2894. [Google Scholar] [CrossRef] [PubMed]
  21. Mohammad, P.; Goswami, A.; Bonafoni, S. The Impact of the Land Cover Dynamics on Surface Urban Heat Island Variations in Semi-Arid Cities: A Case Study in Ahmedabad City, India, Using Multi-Sensor/Source Data. Sensors 2019, 19, 3701. [Google Scholar] [CrossRef] [Green Version]
  22. Bokaie, M.; Zarkesh, M.K.; Arasteh, P.D.; Hosseini, A. Assessment of Urban Heat Island based on the relationship between land surface temperature and Land Use/Land Cover in Tehran. Sustain. Cities Soc. 2016, 23, 94–104. [Google Scholar] [CrossRef]
  23. Cai, Y.; Zhang, H.; Zheng, P.; Pan, W. Quantifying the Impact of Land use/Land Cover Changes on the Urban Heat Island: A Case Study of the Natural Wetlands Distribution Area of Fuzhou City, China. Wetlands 2016, 36, 285–298. [Google Scholar] [CrossRef]
  24. Su, Y.-F.; Foody, G.M.; Cheng, K.-S. Spatial non-stationarity in the relationships between land cover and surface temperature in an urban heat island and its impacts on thermally sensitive populations. Landsc. Urban Plan. 2012, 107, 172–180. [Google Scholar] [CrossRef]
  25. Abulibdeh, A. Analysis of urban heat island characteristics and mitigation strategies for eight arid and semi-arid gulf region cities. Environ. Earth Sci. 2021, 80, 259. [Google Scholar] [CrossRef]
  26. Amir Siddique, M.; Wang, Y.; Xu, N.; Ullah, N.; Zeng, P. The Spatiotemporal Implications of Urbanization for Urban Heat Islands in Beijing: A Predictive Approach Based on CA–Markov Modeling (2004–2050). Remote Sens. 2021, 13, 4697. [Google Scholar] [CrossRef]
  27. Han, J.; Zhao, X.; Zhang, H.; Liu, Y. Analyzing the Spatial Heterogeneity of the Built Environment and Its Impact on the Urban Thermal Environment—Case Study of Downtown Shanghai. Sustainability 2021, 13, 11302. [Google Scholar] [CrossRef]
  28. Liu, F.; Hou, H.; Murayama, Y. Spatial Interconnections of Land Surface Temperatures with Land Cover/Use: A Case Study of Tokyo. Remote Sens. 2021, 13, 610. [Google Scholar] [CrossRef]
  29. Sidiqui, P.; Tariq, M.A.; Ng, A.W.M. An Investigation to Identify the Effectiveness of Socioeconomic, Demographic, and Buildings’ Characteristics on Surface Urban Heat Island Patterns. Sustainability 2022, 14, 2777. [Google Scholar]
  30. Erdem Okumus, D.; Terzi, F. Evaluating the role of urban fabric on surface urban heat island: The case of Istanbul. Sustain. Cities Soc. 2021, 73, 103128. [Google Scholar] [CrossRef]
  31. Shi, L.; Ling, F.; Foody, G.M.; Yang, Z.; Liu, X.; Du, Y. Seasonal SUHI Analysis Using Local Climate Zone Classification: A Case Study of Wuhan, China. Int. J. Environ. Res. Public Health 2021, 18, 7242. [Google Scholar] [CrossRef] [PubMed]
  32. Shi, Y.; Xiang, Y.; Zhang, Y. Urban Design Factors Influencing Surface Urban Heat Island in the High-Density City of Guangzhou Based on the Local Climate Zone. Sensors 2019, 19, 3459. [Google Scholar] [CrossRef] [PubMed] [Green Version]
  33. Johnson, D.P. Population-Based Disparities in U.S. Urban Heat Exposure from 2003 to 2018. Int. J. Environ. Res. Public Health 2022, 19, 12314. [Google Scholar] [CrossRef]
  34. Wu, Y.; Hou, H.; Wang, R.; Murayama, Y.; Wang, L.; Hu, T. Effects of landscape patterns on the morphological evolution of surface urban heat island in Hangzhou during 2000–2020. Sustain. Cities Soc. 2022, 79, 103717. [Google Scholar] [CrossRef]
  35. Lagouarde, J.P.; Henon, A.; Irvine, M.; Voogt, J.; Pigeon, G.; Moreau, P.; Masson, V.; Mestayer, P. Experimental characterization and modelling of the nighttime directional anisotropy of thermal infrared measurements over an urban area: Case study of Toulouse (France). Remote Sens. Environ. 2012, 117, 19–33. [Google Scholar] [CrossRef]
  36. Monteith, J.L.; Szeicz, G. Radiative temperature in the heat balance of natural surfaces. Q. J. R. Meteorol. Soc. 1962, 88, 496–507. [Google Scholar] [CrossRef]
  37. Kimes, D.S. Remote Sensing of Temperature Profiles in Vegetation Canopies Using Multiple View Angles And Inversion Techniques. IEEE Trans. Geosci. Remote Sens. 1981, 2, 85–90. [Google Scholar] [CrossRef]
  38. Merlin, O.; Chehbouni, A. Different approaches in estimating heat flux using dual angle observations of radiative surface temperature. Int. J. Remote Sens. 2004, 25, 275–289. [Google Scholar] [CrossRef]
  39. Jun, L.; Hao, S.; Qinan, L.; Xuejia, C.; Chong, L.; Huaguo, H. Field observations of background thermal radiation directionality in natural forests. J. Remote Sens. 2017, 21, 365–374. [Google Scholar]
  40. Cao, B.; Guo, M.; Fan, W.; Xu, X.; Peng, J.; Ren, H.; Du, Y.; Li, H.; Bian, Z.; Hu, T.; et al. A New Directional Canopy Emissivity Model Based on Spectral Invariants. IEEE Trans. Geosci. Remote Sens. 2018, 56, 6911–6926. [Google Scholar] [CrossRef] [Green Version]
  41. Adderley, C.; Christen, A.; Voogt, J.A. The effect of radiometer placement and view on inferred directional and hemispheric radiometric temperatures of an urban canopy. Atmos. Meas. Technol. 2015, 8, 2699–2714. [Google Scholar] [CrossRef] [Green Version]
  42. Lagouarde, J.P.; Moreau, P.; Irvine, M.; Bonnefond, J.M.; Voogt, J.A.; Solliec, F. Airborne experimental measurements of the angular variations in surface temperature over urban areas: Case study of Marseille (France). Remote Sens. Environ. 2004, 93, 443–462. [Google Scholar] [CrossRef]
  43. Jiang, L.; Zhan, W.F.; Tu, L.L.; Dong, P.; Wang, S.S.; Li, L.; Wang, C.L.; Wang, C.G. Diurnal variations in directional brightness temperature over urban areas through a multi-angle UAV experiment. Build. Environ. 2022, 222, 109408. [Google Scholar] [CrossRef]
  44. Lagouarde, J.-P.; Irvine, M. Directional anisotropy in thermal infrared measurements over Toulouse city centre during the CAPITOUL measurement campaigns: First results. Meteorol. Atmos. Phys. 2008, 102, 173–185. [Google Scholar] [CrossRef]
  45. Hu, L.Q.; Monaghan, A.; Voogt, J.A.; Barlage, M. A first satellite-based observational assessment of urban thermal anisotropy. Remote Sens. Environ. 2016, 181, 111–121. [Google Scholar] [CrossRef] [Green Version]
  46. Wang, D.; Chen, Y.; Hu, L.; Voogt, J.A. Urban Thermal Anisotropy: A Comparison among Observational and Modeling Approaches at Different Time Scales. IEEE Trans. Geosci. Remote Sens. 2022, 60, 1–15. [Google Scholar] [CrossRef]
  47. Coll, C.; Galve, J.M.; Niclos, R.; Valor, E.; Barbera, M.J. Angular variations of brightness surface temperatures derived from dual-view measurements of the Advanced Along-Track Scanning Radiometer using a new single band atmospheric correction method. Remote Sens. Environ. 2019, 223, 274–290. [Google Scholar] [CrossRef]
  48. Chen, S.; Ren, H.; Ye, X.; Dong, J.; Zheng, Y. Geometry and adjacency effects in urban land surface temperature retrieval from high-spatial-resolution thermal infrared images. Remote Sens. Environ. 2021, 262, 112518. [Google Scholar] [CrossRef]
  49. Krayenhoff, E.S.; Voogt, J.A. Daytime Thermal Anisotropy of Urban Neighbourhoods: Morphological Causation. Remote Sens. 2016, 8, 108. [Google Scholar] [CrossRef] [Green Version]
  50. Ru, C.; Duan, S.B.; Jiang, X.G.; Li, Z.L.; Jiang, Y.; Ren, H.; Leng, P.; Gao, M. Land Surface Temperature Retrieval from Landsat 8 Thermal Infrared Data over Urban Areas Considering Geometry Effect: Method and Application. IEEE Trans. Geosci. Remote Sens. 2022, 60, 1–16. [Google Scholar] [CrossRef]
  51. Wang, D.; Chen, Y.; Hu, L.; Voogt, J.A.; Gastellu-Etchegorry, J.-P.; Krayenhoff, E.S. Modeling the angular effect of MODIS LST in urban areas: A case study of Toulouse, France. Remote Sens. Environ. 2021, 257, 112361. [Google Scholar] [CrossRef]
  52. Wang, D.D.; Chen, Y.H. A Geometric Model to Simulate Urban Thermal Anisotropy in Simplified Dense Neighborhoods (GUTA-Dense). IEEE Trans. Geosci. Remote Sens. 2019, 57, 6226–6239. [Google Scholar] [CrossRef]
  53. Christen, A.; Meier, F.; Scherer, D. High-frequency fluctuations of surface temperatures in an urban environment. Theor. Appl. Climatol. 2012, 108, 301–324. [Google Scholar] [CrossRef]
  54. Pasha, Y.S.; Afshari, A. Assessment and Improvement of the Accuracy of Radiation Heat Transfer Estimation in Simplified Urban Canopy Models. Energy Procedia 2017, 143, 532–539. [Google Scholar] [CrossRef]
  55. Hilland, R.V.J.; Voogt, J.A. The effect of sub-facet scale surface structure on wall brightness temperatures at multiple scales. Theor. Appl. Climatol. 2020, 140, 767–785. [Google Scholar] [CrossRef] [Green Version]
  56. Hu, L.; Wendel, J. Analysis of urban surface morphologic effects on diurnal thermal directional anisotropy. ISPRS J. Photogramm. Remote Sens. 2019, 148, 1–12. [Google Scholar] [CrossRef]
  57. Pinheiro, A.C.T.; Privette, J.L.; Mahoney, R.; Tucker, C.J. Directional effects in a daily AVHRR land surface temperature dataset over Africa. IEEE Trans. Geosci. Remote Sens. 2004, 42, 1941–1954. [Google Scholar] [CrossRef]
  58. Wu, X. Construction and application of urban geospatial infrastructure framework in Hefei. Urban Geotech. Investig. Surv. 2007, 22, 23–25. [Google Scholar]
  59. Yao, X.; Chen, Y.; Zhang, Q.; Mou, Z.; Yao, X.; Ou, C. Assessment of the Urban Expansion and Its Impact on the Eco-Environment—A Case Study of Hefei Municipal Area. Sustainability 2022, 14, 10613. [Google Scholar] [CrossRef]
  60. Chen, X.; Yang, X.; Dong, X.; Liu, E. Environmental changes in Chaohu Lake (southeast, China) since the mid 20th century: The interactive impacts of nutrients, hydrology and climate. Limnologica 2013, 43, 10–17. [Google Scholar] [CrossRef]
  61. Yang, L.; Lei, K.; Meng, W.; Fu, G.; Yan, W. Temporal and spatial changes in nutrients and chlorophyll-α in a shallow lake, Lake Chaohu, China: An 11-year investigation. J. Environ. Sci. 2013, 25, 1117–1123. [Google Scholar] [CrossRef]
  62. Ren, H.Z.; Yan, G.J.; Liu, R.Y.; Li, Z.L.; Qin, Q.M.; Nerry, F.; Liu, Q. Determination of Optimum Viewing Angles for the Angular Normalization of Land Surface Temperature over Vegetated Surface. Sensors 2015, 15, 7537–7570. [Google Scholar] [CrossRef] [Green Version]
  63. Niclos, R.; Caselles, V.; Coll, C.; Valor, E.; Rubio, E. Autonomous measurements of sea surface temperature using in situ thermal infrared data. J. Atmos. Ocean. Technol. 2004, 21, 683–692. [Google Scholar] [CrossRef]
  64. Niclos, R.; Valor, E.; Caselles, V.; Coll, C.; Sanchez, J.M. In situ angular measurements of thermal infrared sea surface emissivity—Validation of models. Remote Sens. Environ. 2005, 94, 83–93. [Google Scholar] [CrossRef]
  65. Wan, Z.; Dozier, J. A generalized split-window algorithm for retrieving land-surface temperature from space. IEEE Trans. Geosci. Remote Sens. 1996, 34, 892–905. [Google Scholar]
  66. Benali, A.; Carvalho, A.C.; Nunes, J.P.; Carvalhais, N.; Santos, A. Estimating air surface temperature in Portugal using MODIS LST data. Remote Sens. Environ. 2012, 124, 108–121. [Google Scholar] [CrossRef]
  67. Prihodko, L.; Goward, S.N. Estimation of air temperature from remotely sensed surface observations. Remote Sens. Environ. 1997, 60, 335–346. [Google Scholar] [CrossRef]
  68. Hu, L.Q.; Brunsell, N.A. A new perspective to assess the urban heat island through remotely sensed atmospheric profiles. Remote Sens. Environ. 2015, 158, 393–406. [Google Scholar] [CrossRef]
  69. Monaghan, A.J.; Hu, L.Q.; Brunsell, N.A.; Barlage, M.; Wilhelmi, O.V. Evaluating the impact of urban morphology configurations on the accuracy of urban canopy model temperature simulations with MODIS. J. Geophys. Res. Atmos. 2014, 119, 6376–6392. [Google Scholar] [CrossRef] [Green Version]
  70. Oke, T.R.; Johnson, G.T.; Steyn, D.G.; Watson, I.D. Simulation of surface urban heat islands under ‘ideal’ conditions at night part 2: Diagnosis of causation. Bound.-Layer Meteorol. 1991, 56, 339–358. [Google Scholar] [CrossRef]
  71. Voogt, J.A.; Oke, T.R. Effects of urban surface geometry on remotely-sensed surface temperature. Int. J. Remote Sens. 1998, 19, 895–920. [Google Scholar] [CrossRef]
  72. Roth, M.; Oke, T.R.; Emery, W.J. Satellite-derived urban heat islands from three coastal cities and the utilization of such data in urban climatology. Int. J. Remote Sens. 1989, 10, 1699–1720. [Google Scholar] [CrossRef]
  73. Hu, L.Q.; Brunsell, N.A.; Monaghan, A.J.; Barlage, M.; Wilhelmi, O.V. How can we use MODIS land surface temperature to validate long-term urban model simulations? J. Geophys. Res. Atmos. 2014, 119, 3185–3201. [Google Scholar] [CrossRef] [Green Version]
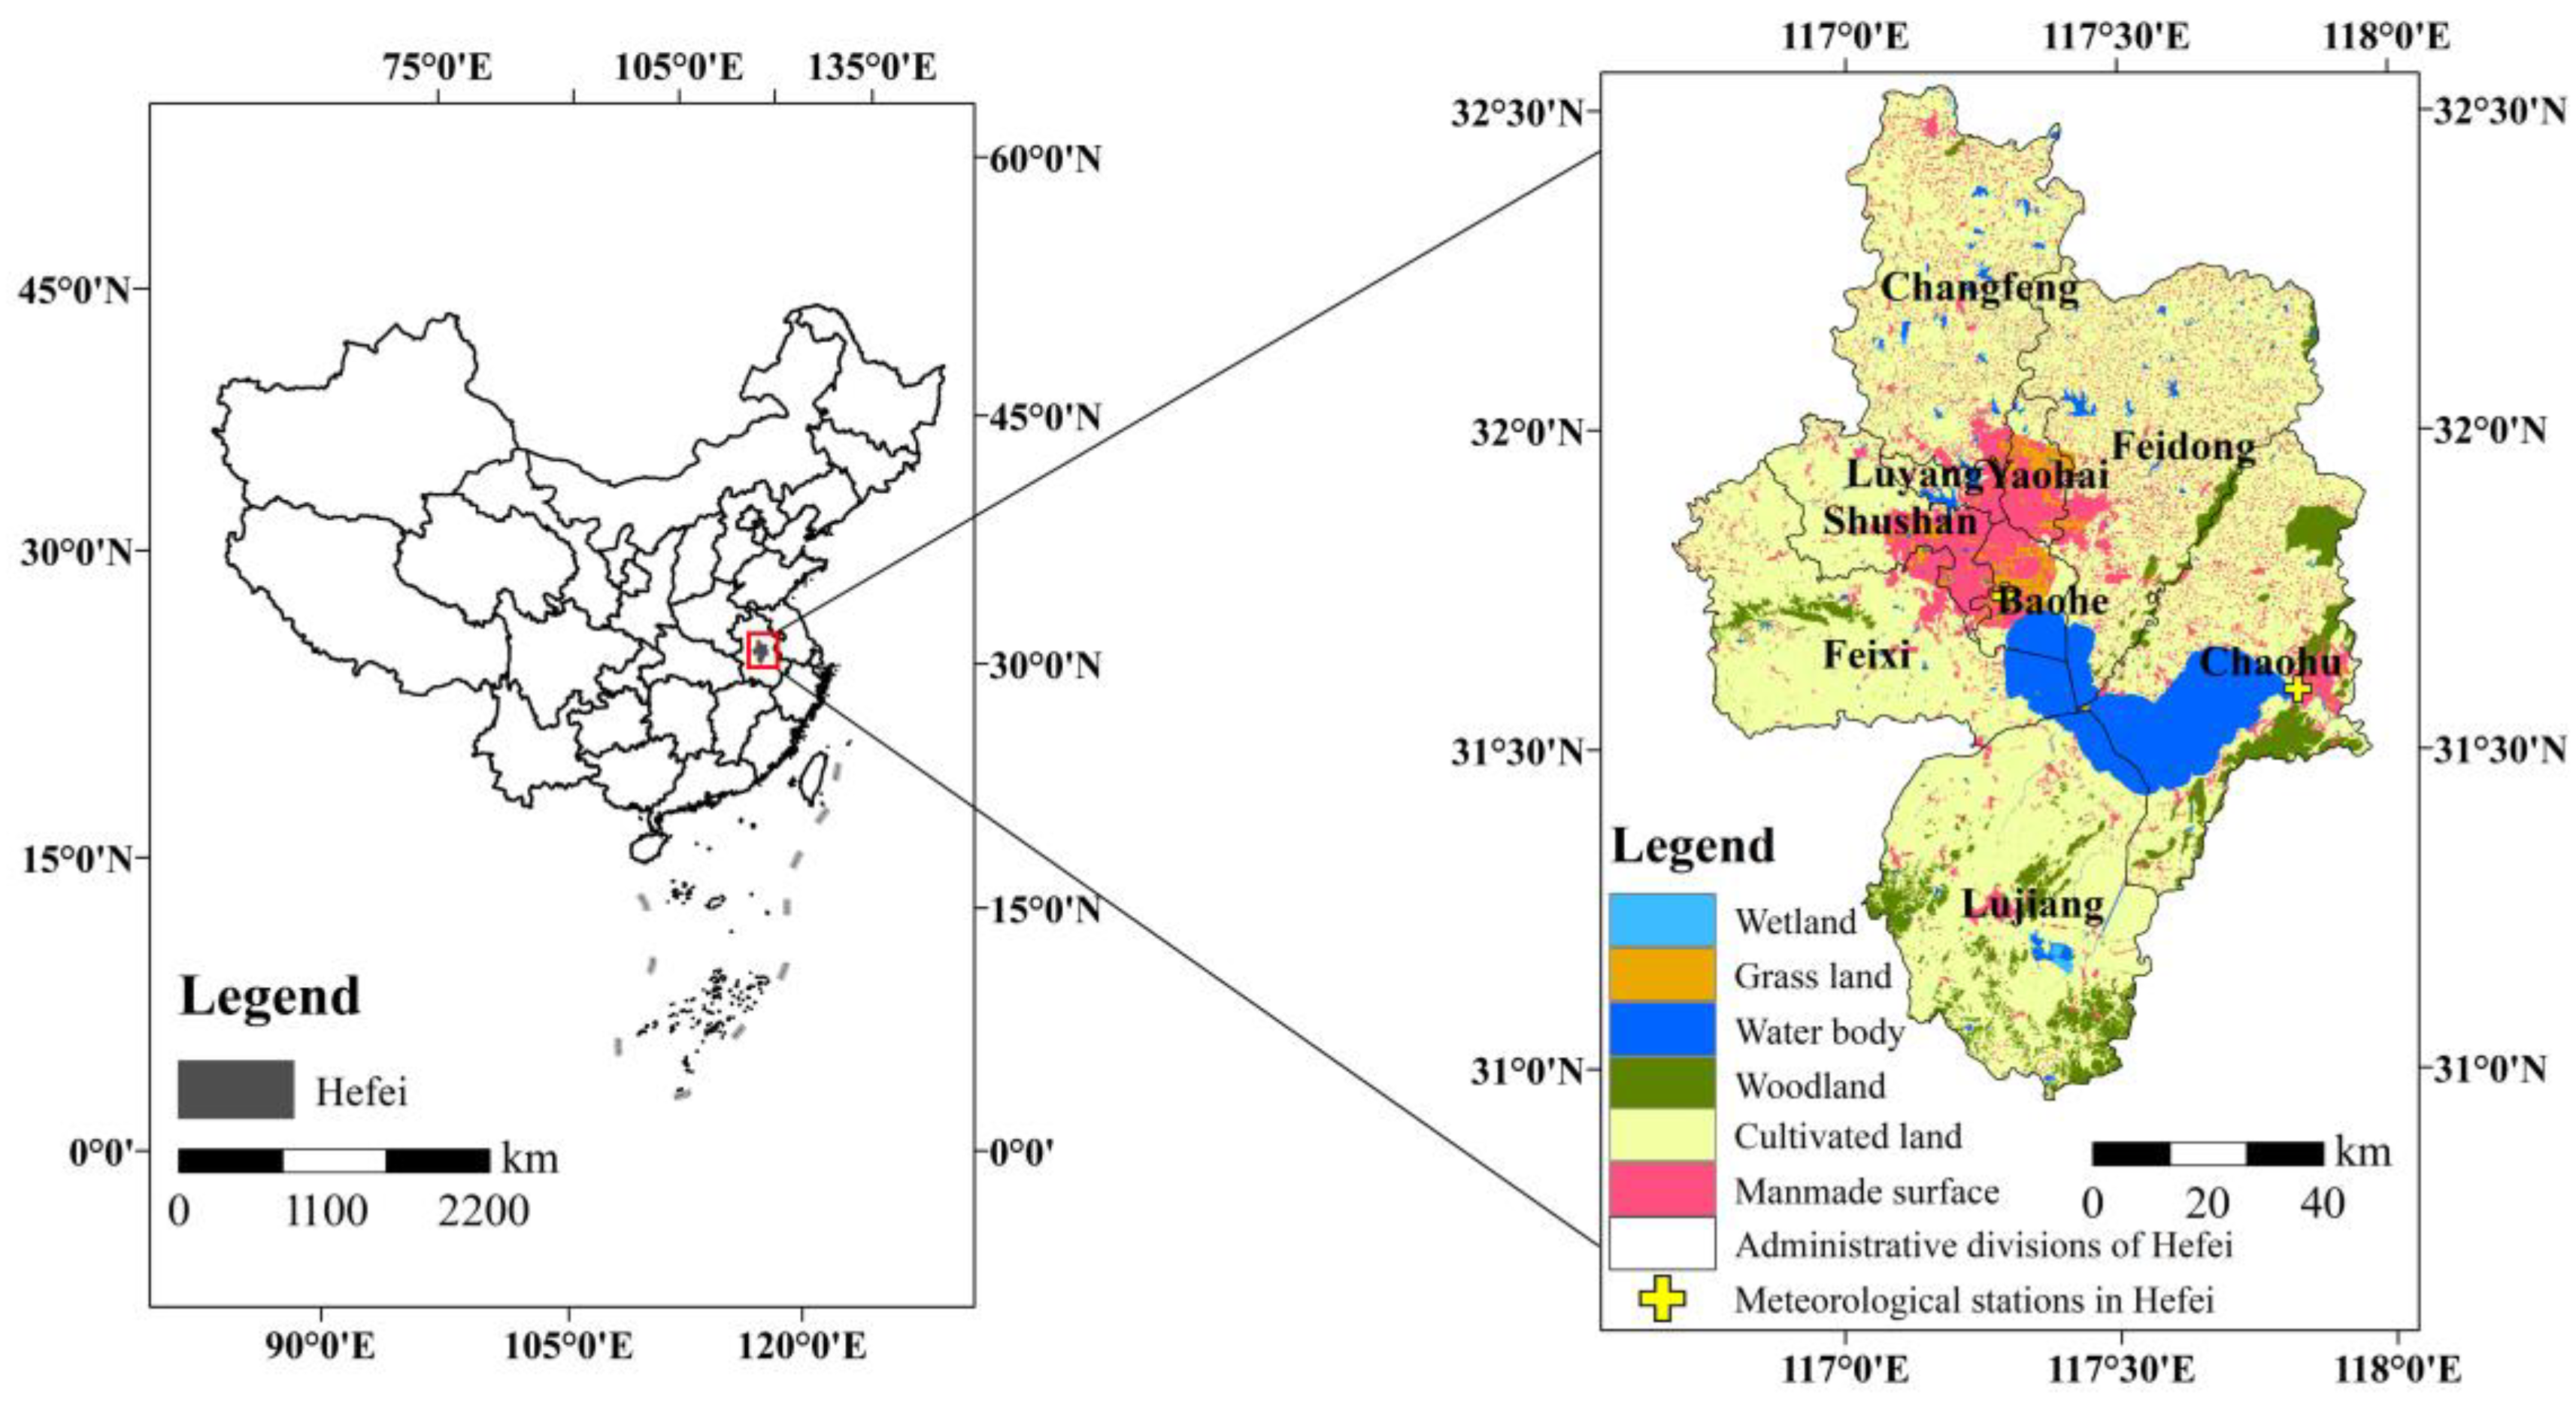
Figure 1. 1 km pixel scale land-use types for Hefei (approximately 127 km × 178 km) in 2020.
Sensors 23 03041 g001
Figure 2. Distribution of L S T w a t e r ( t ) (left y-axis, red) and   Δ L S T w a t e r   ( t ) (right y-axis, blue) at different sensor zenith angles (SZAs) (x axis), during each satellite overpass. The subfigures (ad) respectively display the distribution of L S T w a t e r ( t ) and   Δ L S T w a t e r   ( t ) at different SZAs during satellite overpass at 10:30, 13:30, 22:30, and 01:30.
Sensors 23 03041 g002
Figure 3. Pearson product moment correlation coefficient between Δ L S T Δ T a i r and Δ T a i r at different α values. The abscissa is the value of α and the ordinate is the correlation coefficient between Δ L S T Δ T a i r and Δ T a i r .
Sensors 23 03041 g003
Figure 4. Statistical distribution of average Δ L S T Δ T a i r of each zenith angle, under different land-use intensities, at each satellite overpass time for Hefei. The right y-axis is the number of pixels with different land-use intensities of each SZA (represented by a histogram); the left y-axis is the average Δ L S T Δ T a i r of each SZA, under different land-use intensities (represented by a line chart). The subfigures (ad) illustrate the statistical distribution of the average Δ L S T Δ T a i r for each zenith angle under different land-use intensities during satellite overpass at 10:30, 13:30, 22:30, and 01:30, respectively.
Sensors 23 03041 g004
Figure 5. Effective thermal anisotropy under different land-use intensity groups, at each satellite overpass time. The abscissa represents the four overpass times, the ordinate represents the effective thermal anisotropy, and the colored solid line represents the effective thermal anisotropy of the land-use intensity groups.
Sensors 23 03041 g005
Figure 6. Heat map of Δ L S T Δ T a i r distribution for each SZA group at different land-use intensity percentage, for the four overpass times. The abscissa represents the land-use intensity percentage in a 1 km grid cell, and the ordinate represents the SZA group. Specifically, the subfigures (ad) illustrate the distributions of Δ L S T Δ T a i r for each SZA group at different land-use intensity percentages during satellite overpass at 10:30, 13:30, 22:30, and 01:30, respectively.
Sensors 23 03041 g006
Figure 7. Line graph showing the maximum SUHI of each SZA group during each sensor overpass, the horizontal axis represents the four overpass times, the vertical axis represents the maximum SUHI, where the colored solid line is the variations in the maximum SUHI of each SZA group with respect to the satellite overpass time.
Sensors 23 03041 g007
Disclaimer/Publisher’s Note: The statements, opinions and data contained in all publications are solely those of the individual author(s) and contributor(s) and not of MDPI and/or the editor(s). MDPI and/or the editor(s) disclaim responsibility for any injury to people or property resulting from any ideas, methods, instructions or products referred to in the content.