

Smart Gateway for Healthcare Networks Based on Beam Steering Technology


Abstract
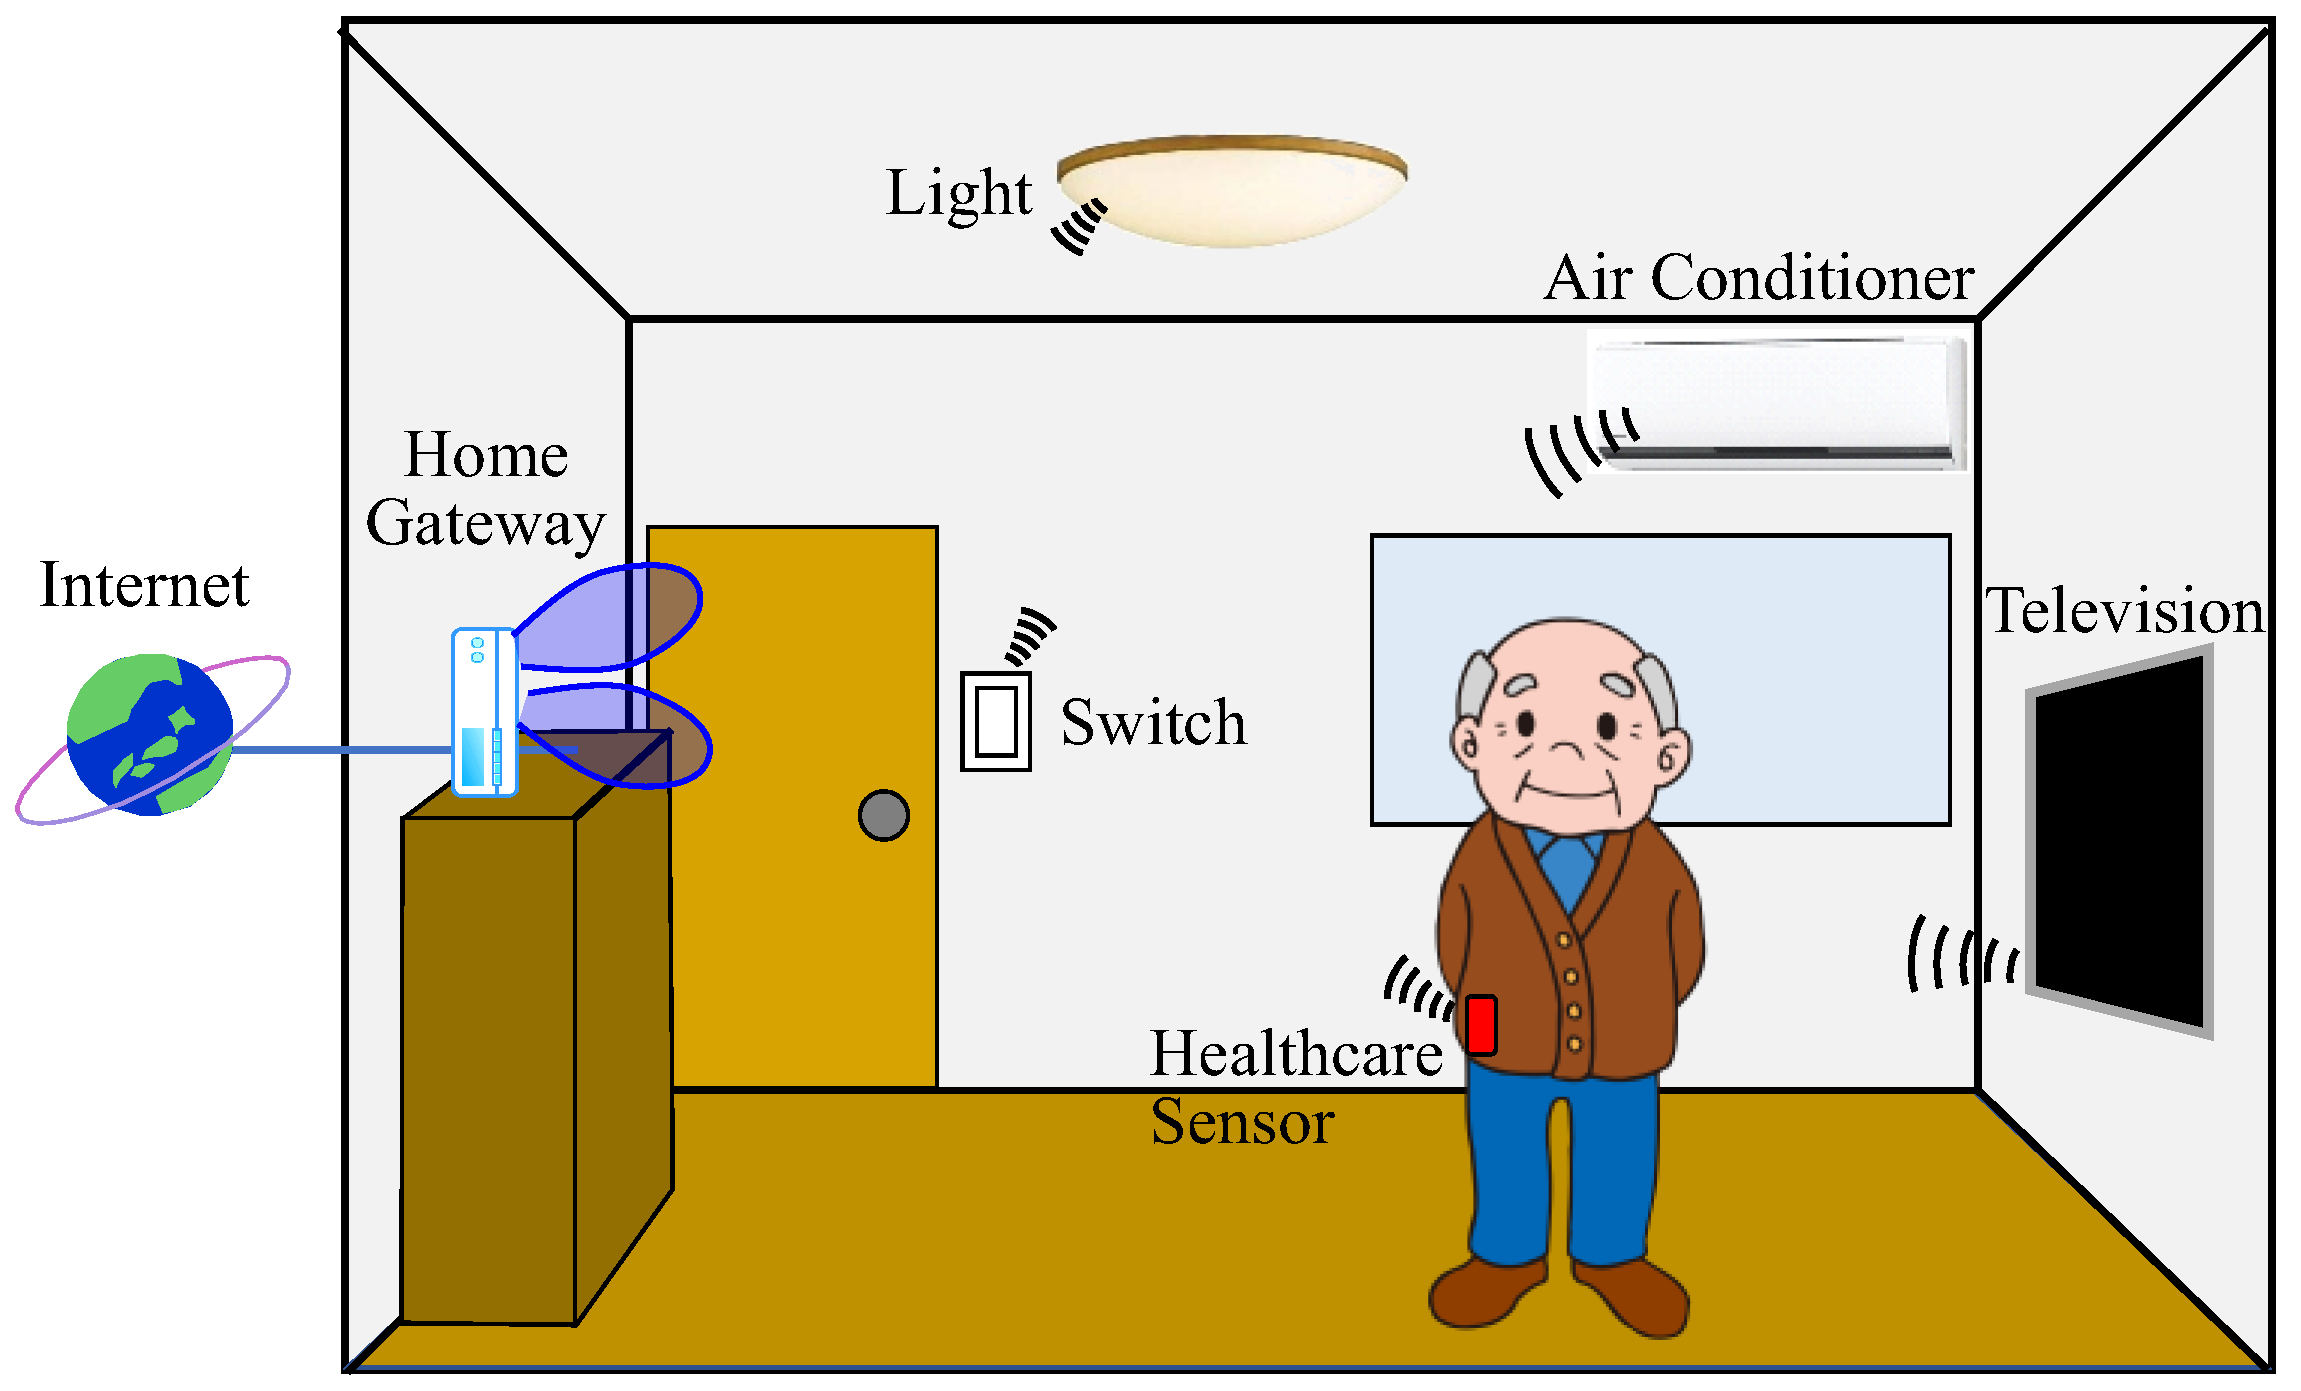
1. Introduction
2. Smart Gateway Antenna
2.1. Interferometric AOA Estimation Method
2.2. Mean IQ-Value Method in Rice Propagation Environment
2.3. Beam Steering Function
3. Directivity Measurements
3.1. Interferometric AOA Estimation
3.2. Beam Steering Function
4. AOA Estimation Using a Fading Emulator
5. Radio Propagation Experiments in an LOS Environment
6. Conclusions
Author Contributions
Funding
Institutional Review Board Statement
Informed Consent Statement
Data Availability Statement
Conflicts of Interest
References
- Whaiduzzaman, M.; Barros, A.; Chanda, M.; Barman, S.; Sultana, T.; Rahman, M.S.; Roy, S.; Fidge, C. A Review of Emerging Technologies for IoT-Based Smart Cities. Sensors 2022, 22, 9271. [Google Scholar] [CrossRef]
- Duroc, Y. From Identification to Sensing: RFID Is One of the Key Technologies in the IoT Field. Sensors 2022, 22, 7523. [Google Scholar] [CrossRef]
- Panigrahy, S.K.; Emany, H. A Survey and Tutorial on Network Optimization for Intelligent Transport System Using the Internet of Vehicles. Sensors 2023, 23, 555. [Google Scholar] [CrossRef]
- Khan, M.A.; Din, I.U.; Majali, T.; Kim, B.-S. A Survey of Authentication in Internet of Things-Enabled Healthcare Systems. Sensors 2022, 22, 9089. [Google Scholar] [CrossRef]
- Tong, X.; Yang, H.; Wang, L.; Miao, Y. The Development and Field Evaluation of an IoT System of Low-Power Vibration for Bridge Health Monitoring. Sensors 2019, 19, 1222. [Google Scholar] [CrossRef]
- Jang, Y.; Ryoo, I.; Kim, S. Smart Hospital Sensor Network Deployment for Mobile and Remote Healthcare System. Sensors 2021, 21, 5514. [Google Scholar] [CrossRef] [PubMed]
- Muminov, A.; Mukhiddinov, M.; Cho, J. Enhanced Classification of Dog Activities with Quaternion-Based Fusion Approach on High-Dimensional Raw Data from Wearable Sensors. Sensors 2022, 22, 9471. [Google Scholar] [CrossRef] [PubMed]
- Condon, F.; Martínez, J.M.; Eltamaly, A.M.; Kim, Y.-C.; Ahmed, M.A. Design and Implementation of a Cloud-IoT-Based Home Energy Management System. Sensors 2023, 23, 176. [Google Scholar] [CrossRef]
- Chen, X.; Ng, D.W.K.; Yu, W.; Larsson, E.G.; Al-Dhahir, N.; Schober, R. Massive access for 5G and beyond. IEEE J. Sel. Areas Commun. 2020, 39, 615–637. [Google Scholar] [CrossRef]
- IEEE Std 802.11-2012 (Revision of IEEE Std 802.11-2007); IEEE Standard for Information Technology–Telecommunications and Information Exchange between Systems Local and Metropolitan Area Networks–Specific Requirements Part 11: Wireless LAN Medium Access Control (MAC) and Physical Layer (PHY) Specifications. IEEE: New York, NY, USA, 2012; pp. 1–5229.
- Bluetooth. Available online: https://www.bluetooth.com/ (accessed on 31 January 2023).
- Stockman, H. Communication by means of reflected power. Proc. IRE 1948, 36, 1196–1204. [Google Scholar] [CrossRef]
- SigFox. Available online: https://www.sigfox.com/ (accessed on 31 January 2023).
- LoRa Alliance. Available online: https://www.lora-alliance.org/ (accessed on 31 January 2023).
- 3G Partnership Project. RP-161324 3GPP Work Item Description Enhancements of NB-IoT.
- Zafiri, F.; Gkelias, A.; Leung, K.K. A Survey of Indoor Localization Systems and Technologies. IEEE Commun. Surv. Tutor. 2019, 21, 2568–2599. [Google Scholar] [CrossRef]
- Li, G.; Geng, E.; Ye, Z.; Xu, Y.; Lin, J.; Pang, Y. Indoor Positioning Algorithm Based on the Improved RSSI Distance Model. Sensors 2018, 18, 2820. [Google Scholar] [CrossRef]
- Wang, Y.; Yang, X.; Zhao, Y.; Liu, Y.; Cuthbert, L. Bluetooth positioning using RSSI and triangulation methods. In Proceedings of the 2013 IEEE 10th Consumer Communications and Networking Conference (CCNC), Las Vegas, NV, USA, 11–14 January 2013; pp. 837–842. [Google Scholar]
- Wu, K.; Xiao, J.; Yi, Y.; Chen, D.; Luo, X.; Ni, L.M. CSI-based Indoor Localization. IEEE Trans. Parallel Distrib. Syst. 2013, 24, 1300–1309. [Google Scholar] [CrossRef]
- Dang, X.; Si, X.; Hao, Z.; Huang, Y. A Novel Passive Indoor Localization Method by Fusion CSI Amplitude and Phase Information. Sensors 2019, 19, 875. [Google Scholar] [CrossRef] [PubMed]
- Ohira, T.; Gyoda, K. Electronically steerable passive array radiator antennas for low-cost analog adaptive beamforming. In Proceedings of the 2000 IEEE International Conference on Phased Array Systems and Technology (PAST), Dana Point, CA, USA, 21–25 May 2000; pp. 101–104. [Google Scholar]
- Plapous, C.; Cheng, J.; Taillefer, E.; Hirata, A.; Ohira, T. Reactance domain MUSIC algorithm for electronically steerable parasitic array radiator. IEEE Trans. Antennas Propag. 2004, 52, 3257–3264. [Google Scholar] [CrossRef]
- Taillefer, E.; Hirata, A.; Ohira, T. Reactance-domain ESPRIT algorithm for a hexagonally shaped seven-element ESPAR antenna. IEEE Trans. Antennas Propag. 2005, 53, 3486–3495. [Google Scholar] [CrossRef]
- Iwamoto, D.; Honda, K.; Ogawa, K. Angle of arrival estimation with improved accuracy using the mean IQ-value method in a rician fading channel. In Proceedings of the 2017 Progress in Electromagnetics Research Symposium (PIERS), Singapore, 19–22 November 2017; pp. 1319–1325. [Google Scholar]
- Iwamoto, D.; Honda, K.; Ogawa, K. Interferometric angle-of-arrival estimation using a simple weight network. IEICE Commun. Express 2019, 8, 104–109. [Google Scholar] [CrossRef]
- Honda, K.; Li, K.; Ogawa, K. Weighted-Polarization Wearable MIMO Antenna with Three Orthogonally Arranged Dipoles Based on RF Signal Processing. IEICE Trans. Commun. 2016, 99, 58–68. [Google Scholar] [CrossRef]
- Murphy, S.; Eyring, P.M. 2-18GHz circular array interferometer DF antenna system. In Proceedings of the IEEE Antennas and Propagation Society International Symposium (APS), Atlanta, GA, USA, 21–26 July 1998; pp. 2332–2335. [Google Scholar]
- Moghaddasi, J.; Djerafi, T.; Wu, K. Multiport Interferometer-Enabled 2-D Angle of Arrival (AOA) Estimation System. IEEE Trans. Microw. Theory Tech. 2017, 65, 1767–1779. [Google Scholar] [CrossRef]
- Lee, J.-H.; Woo, J.-M. Interferometer Direction-Finding System with Improved DF Accuracy Using Two Different Array Configurations. IEEE Antennas Wirel. Propag. Lett. 2014, 14, 719–722. [Google Scholar] [CrossRef]
- Doan, S.V.; Vesely, J.; Janu, P.; Hubacek, P.; Tran, X.L. Optimized algorithm for solving phase interferometer ambiguity. In Proceedings of the 2016 17th International Radar Symposium (IRS), Krakow, Poland, 10–12 May 2016. [Google Scholar]
- Honda, K.; Fukushima, T.; Ogawa, K. Full-Azimuth Beam Steering MIMO Antenna Arranged in a Daisy Chain Array Structure. Micromachines 2020, 11, 871. [Google Scholar] [CrossRef]
- Rahman, M.M.; Ryu, H.-G. IoT Sensor Network Using ESPAR Antenna Based on Beam Scanning Method for Direction Finding. Sensors 2022, 22, 7341. [Google Scholar] [CrossRef] [PubMed]
- Panduro, M.A.; Mendez, A.L.; Dominguez, R.; Romero, G. Design of non-uniform circular antenna arrays for side lobe reduction using the method of genetic algorithms. Int. J. Electron. Commun. 2006, 60, 713–717. [Google Scholar] [CrossRef]
- Roy, G.G.; Das, S.; Chakraborty, P.; Suganthan, P.N. Design of Non-Uniform Circular Antenna Arrays Using a Modified Invasive Weed Optimization Algorithm. IEEE Trans. Antennas Propag. 2011, 59, 110–118. [Google Scholar] [CrossRef]
- Xie, T.; Shi, R.; Wang, S.; Wang, X.; Honda, K.; Li, K.; Lu, G. 2-Way Power Divider with Wide Tunable Power Ratio Range for Weighted-Polarization MIMO Antenna in BAN Radios at 2.45 GHz. IEEE Antennas Wirel. Propag. Lett. 2022, 21, 1333–1337. [Google Scholar] [CrossRef]
- Honda, K.; Li, K. Three-dimensional MIMO-OTA calibration to achieve the Gaussian angular power spectra in elevation. IEICE Commun. Express 2016, 10, 394–400. [Google Scholar] [CrossRef]
- Honda, K. A Method of Implementing a 4 × 4 Correlation Matrix for Evaluating the Uplink Channel Properties of MIMO Over-the-Air Apparatus. Sensors 2021, 21, 6184. [Google Scholar] [CrossRef] [PubMed]
- Honda, K. Over-the-Air Testing of a Massive MIMO Antenna with a Full-Rank Channel Matrix. Sensors 2022, 22, 1240. [Google Scholar] [CrossRef] [PubMed]
- Li, K.; Honda, K.; Ogawa, K. Rice Channel Realization for BAN Over-The-Air Testing Using a Fading Emulator with an Arm-Swinging Dynamic Phantom. IEICE Trans. Commun. 2015, 98, 543–553. [Google Scholar] [CrossRef]
- Yamamoto, N.; Shirakata, N.; Kobayashi, D.; Honda, K.; Ogawa, K. BAN Radio Link Characterization Using an Arm-Swinging Dynamic Phantom Replicating Human Walking Motion. IEEE Trans. Antennas Propag. 2013, 61, 4315–4326. [Google Scholar] [CrossRef]
- Ogawa, K.; Matsuyoshi, T.; Monma, K. An Analysis of the Performance of a Handset Diversity Antenna Influenced by Head, Hand and Shoulder Effects at 900 MHz: Part I -Effective Gain Characteristics. IEEE Trans. Veh. Technol. 2001, 50, 830–844. [Google Scholar] [CrossRef]
- Ogawa, K.; Matsuyoshi, T.; Iwai, H.; Hatakenaka, N. A high-precision real human phantom for EM evaluation of handheld terminals in a talk situation. In Proceedings of the IEEE Antennas and Propagation Society International Symposium (APS), Boston, MA, USA, 8–13 July 2001; pp. 68–71. [Google Scholar]
- Honda, K.; Li, K.; Ogawa, K. Shadowing-Fading BER Characterization of a BAN Diversity Antenna Based on Statistical Measurements of the Human Walking Motion. IEICE Trans. Commun. 2013, 96, 2530–2541. [Google Scholar] [CrossRef]
- Omote, K.; Sato, H.; Li, K.; Honda, K.; Koyanagi, Y.; Ogawa, K. Disk-Loaded Monopole Stacked with Patch Antenna. In Proceedings of the IEEE International Symposium on Antennas and Propagation & USNC/URSI National Radio Science Meeting (APS URSI), Vancouver, BC, Canada, 19–24 July 2015; pp. 709–710. [Google Scholar]


| ϕ = 0° | ϕ = 22.5° | ϕ = 45° | ||||
|---|---|---|---|---|---|---|
| wi | τi [°] | wi | τi [°] | wi | τi [°] | |
| #1 | 0.17 | −195 | 0.37 | −175 | 1.00 | 0 |
| #2 | 0.42 | −275 | 0.37 | −300 | 0.62 | −235 |
| #3 | 0.42 | −275 | 0.50 | −255 | 0.54 | −85 |
| #4 | 0.17 | −195 | 0.06 | −310 | 0.62 | −235 |
| #5 | 1.00 | 0 | 1.00 | 0 | 0.62 | −235 |
| ϕ = 0° | ϕ = 22.5° | ϕ = 45° | |||||||
|---|---|---|---|---|---|---|---|---|---|
| w | w2 | Att. [dB] | w | w2 | Att. [dB] | w | w2 | Att. [dB] | |
| #1 | 0.17 | 0.03 | 15.5 | 0.37 | 0.14 | 8.5 | 1.00 | 1.00 | 0.0 |
| #2 | 0.42 | 0.18 | 7.5 | 0.37 | 0.14 | 8.5 | 0.62 | 0.38 | 4.0 |
| #3 | 0.42 | 0.18 | 7.5 | 0.50 | 0.25 | 6.0 | 0.54 | 0.29 | 5.5 |
| #4 | 0.17 | 0.03 | 15.5 | 0.06 | 0.004 | 24.5 | 0.62 | 0.38 | 4.0 |
| #5 | 1.00 | 1.00 | 0.0 | 1.00 | 1.00 | 0.0 | 0.62 | 0.38 | 4.0 |
Disclaimer/Publisher’s Note: The statements, opinions and data contained in all publications are solely those of the individual author(s) and contributor(s) and not of MDPI and/or the editor(s). MDPI and/or the editor(s) disclaim responsibility for any injury to people or property resulting from any ideas, methods, instructions or products referred to in the content. |
© 2023 by the authors. Licensee MDPI, Basel, Switzerland. This article is an open access article distributed under the terms and conditions of the Creative Commons Attribution (CC BY) license (https://creativecommons.org/licenses/by/4.0/).
Share and Cite
Honda, K.; Takakura, K.; Otsubo, Y. Smart Gateway for Healthcare Networks Based on Beam Steering Technology. Sensors 2023, 23, 2959. https://doi.org/10.3390/s23062959
Honda K, Takakura K, Otsubo Y. Smart Gateway for Healthcare Networks Based on Beam Steering Technology. Sensors. 2023; 23(6):2959. https://doi.org/10.3390/s23062959
Chicago/Turabian StyleHonda, Kazuhiro, Kosuke Takakura, and Yuki Otsubo. 2023. "Smart Gateway for Healthcare Networks Based on Beam Steering Technology" Sensors 23, no. 6: 2959. https://doi.org/10.3390/s23062959
APA StyleHonda, K., Takakura, K., & Otsubo, Y. (2023). Smart Gateway for Healthcare Networks Based on Beam Steering Technology. Sensors, 23(6), 2959. https://doi.org/10.3390/s23062959