


Random Traffic Flow Simulation of Heavy Vehicles Based on R-Vine Copula Model and Improved Latin Hypercube Sampling Method


Abstract
1. Introduction
2. Statistical Characterization of Heavy Vehicle Load Parameters
2.1. Model Classification and Lane Occupancy
2.2. Vehicle Weight Statistics
2.3. Daily Traffic Statistics
2.4. Vehicle Speed Statistics
3. Six-Dimensional Joint Distribution Model for Heavy Vehicle Weight
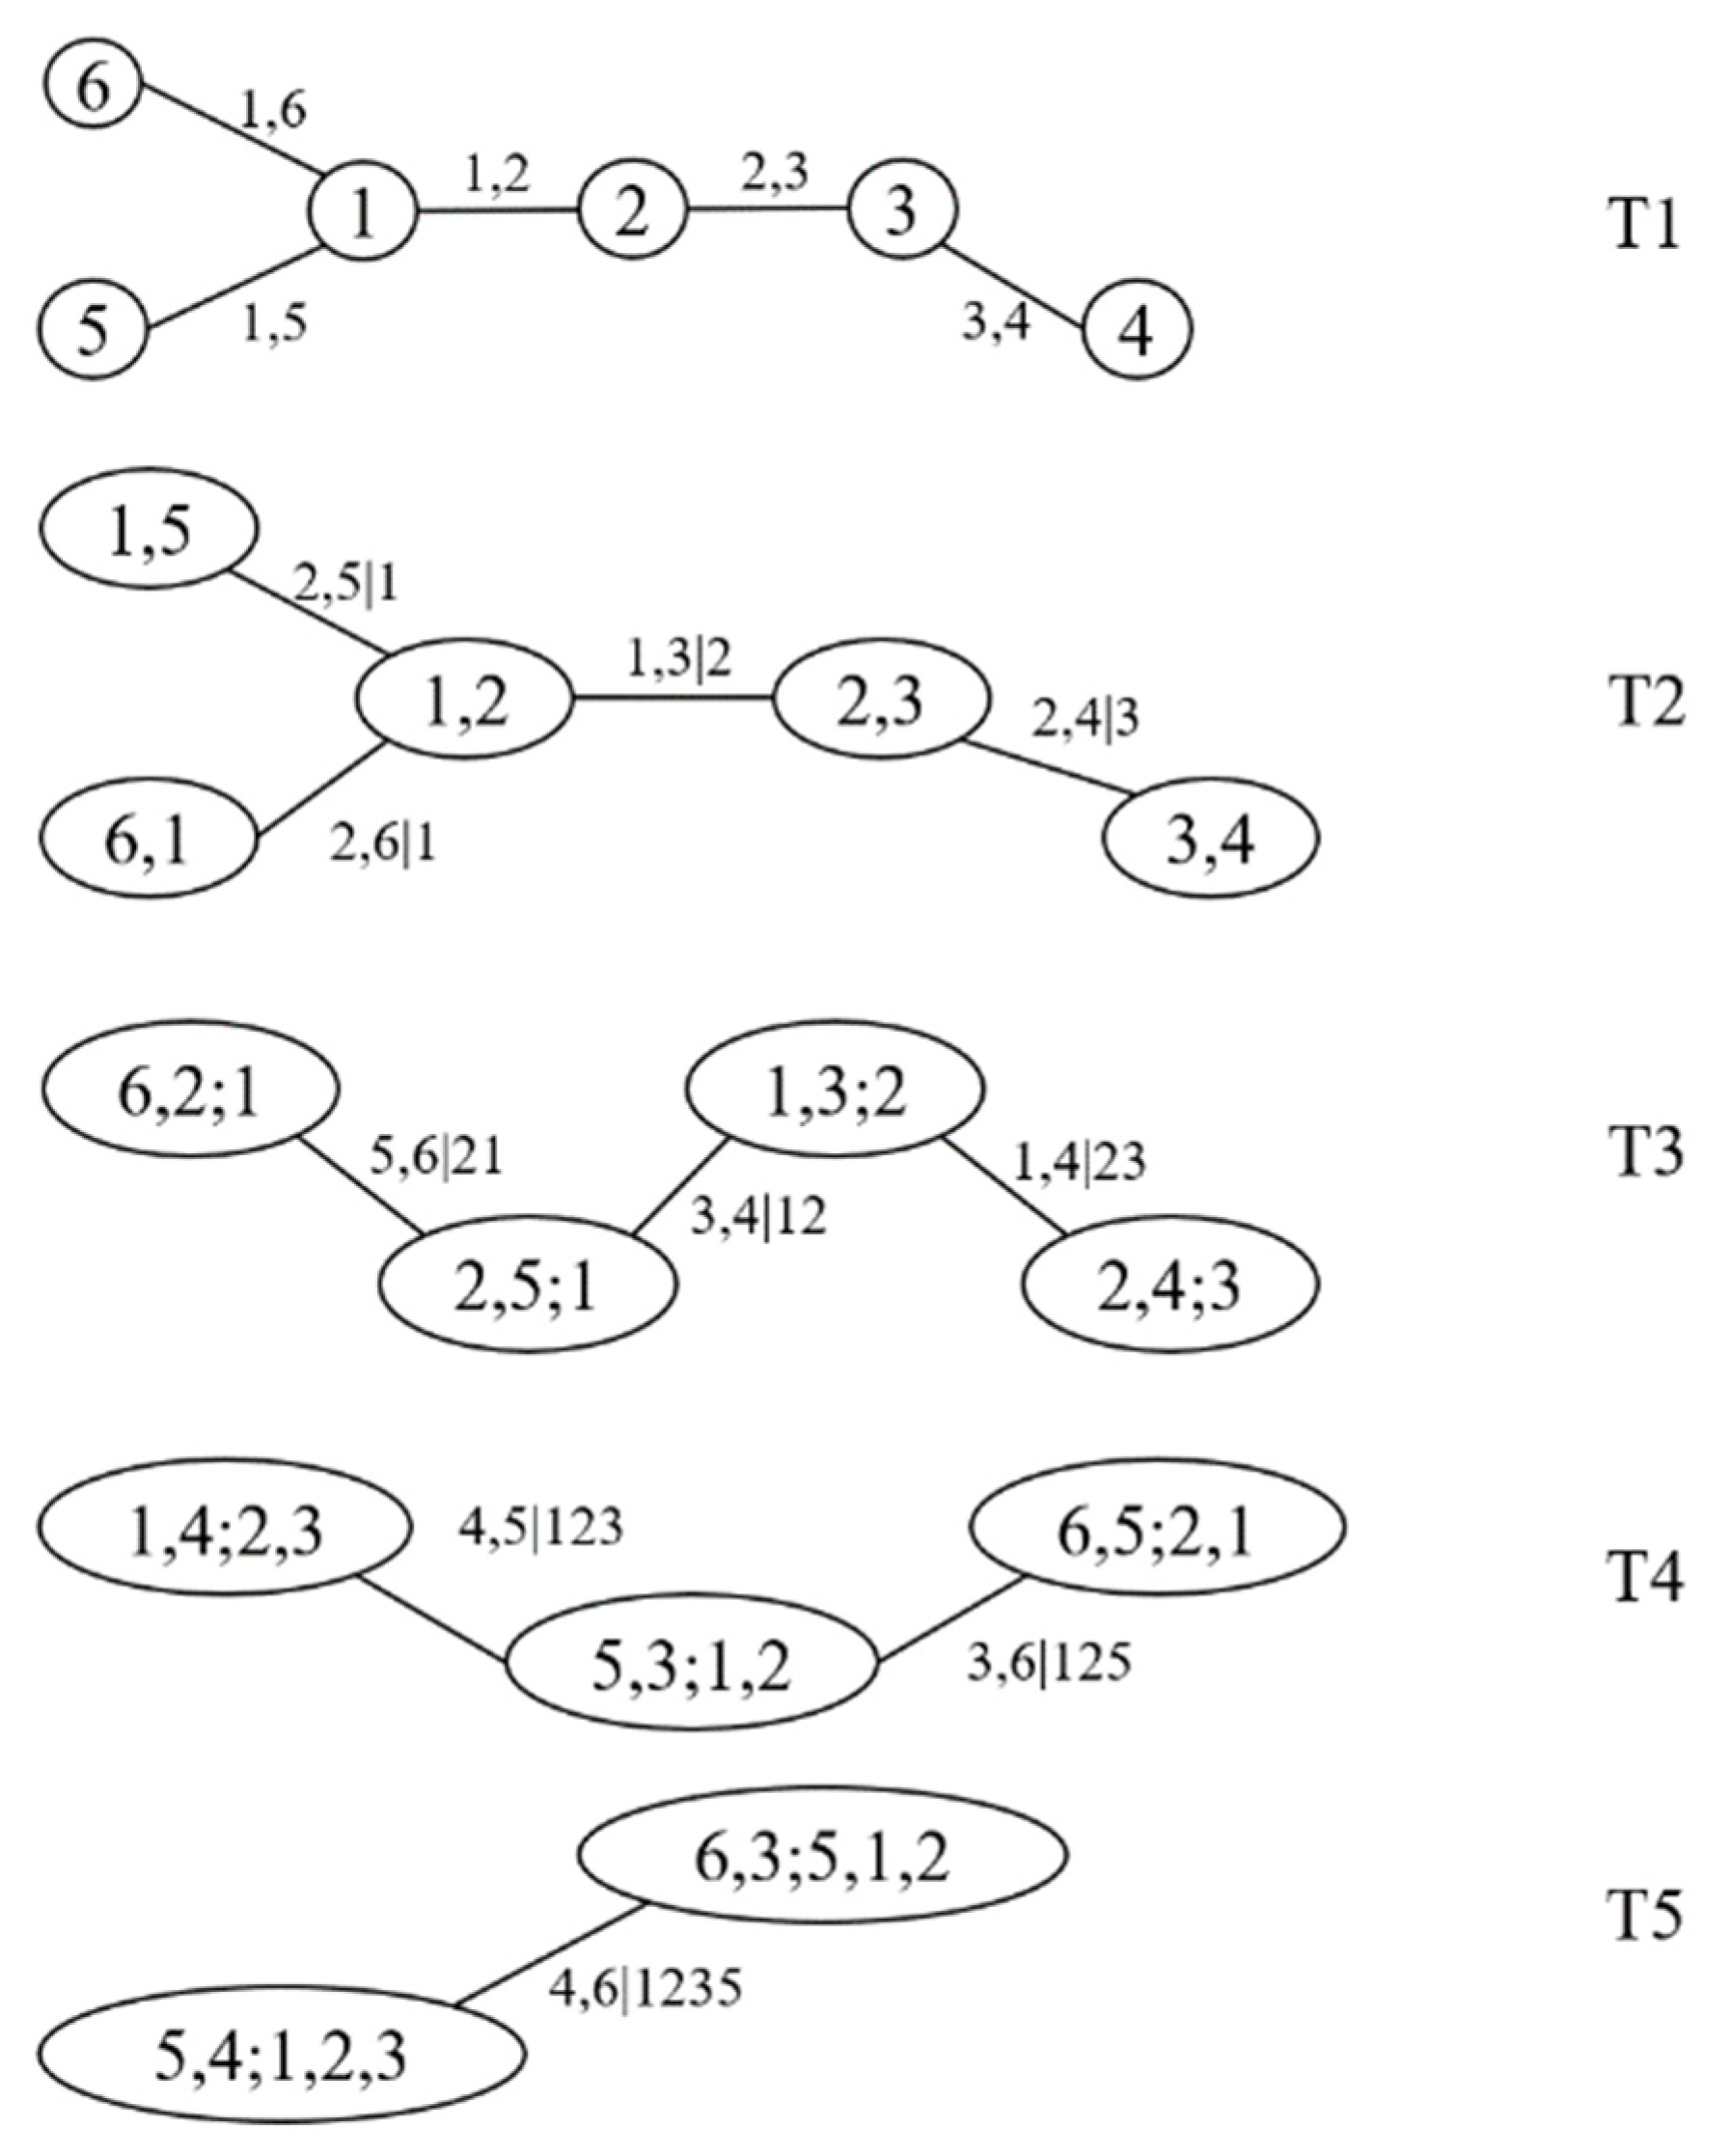
3.1. Six-Dimensional Joint Distribution Model for Vehicle Weight Based on R-Vine Copula
- (1)
- A tree T1 containing n vertices and n − 1 edges.
- (2)
- The tree Ti contains n − i + 1 vertices and n − i edges.
- (3)
- If an edge of the tree Ti connects two nodes, the two edges in the Ti − 1 tree corresponding to these two nodes share the same node.
3.2. Optimization of the Joint Distribution Model of R-Vine Copula
4. Application of Improved Latin Hypercube Sampling
Fundamentals of Improved Latin Hypercube Sampling
5. Simulation of Random Traffic Flow of Heavy Vehicles and Analysis of Load Effect
6. Conclusions
Author Contributions
Funding
Institutional Review Board Statement
Informed Consent Statement
Data Availability Statement
Acknowledgments
Conflicts of Interest
References
- Keogh, D.L.; O’Brien, E. Bridge Deck Analysis; E & FN Spon; CRC Press: London, UK, 1999; pp. 1–34. [Google Scholar]
- Caprani, C.C. Probabilistic Analysis of Highway Bridge Loading Events. Ph.D. Thesis, Dublin Institute of Technology, Dublin, Ireland, 2005; pp. 29–45. [Google Scholar]
- Zhang, G.; Liu, Y.; Liu, J.; Lan, S.; Yang, J. Causes and statistical characteristics of bridge failures: A review. Sci. Direct. 2022, 9, 288–406. [Google Scholar] [CrossRef]
- Zhou, Z.; Xue, C.; Yang, Z.; Yuan, W.; Xia, Z. Vehicle Load Model for Highway Bridges in Jiangsu Province Based on WIM. J. Southeast Univ. 2020, 50, 143–152. [Google Scholar]
- Yang, D.-H.; Guan, Z.-X.; Yi, T.-H.; Li, H.-N.; Ni, Y.-S. Fatigue Evaluation of Bridges Based on Strain Influence Line Loaded by Elaborate Stochastic Traffic Flow. J. Bridge Eng. 2022, 27, 04022082. [Google Scholar] [CrossRef]
- Liang, Y.; Xiong, F. Measurement-based bearing capacity evaluation for small and medium span bridges. Measurement 2020, 149, 106938. [Google Scholar] [CrossRef]
- Li, M.; Liu, Y.; Yang, X. Random Vehicle Flow Load Effect Considering Axle Load. J. Zhejiang Univ. 2019, 53, 78–88. [Google Scholar]
- Liu, Y.; Zhang, H.; Deng, Y.; Li, D. Fatigue Reliability Assessment for Orthotropic Steel Deck Details Using Copulas: Application to Nan-Xi YangtzeRiver Bridge. J. Bridge Eng. (ASCE) 2017, 23, 04017123. [Google Scholar] [CrossRef]
- Torres-Alves, G.A.; Morales-Nápoles, O.; Jonkman, S.N. Structural reliability analysis of a submerged floating tunnel under copula-based traffic load simulations. Eng. Struct. 2022, 269, 114752. [Google Scholar] [CrossRef]
- Soriano, M.; Casas, J.R.; Ghosn, M. Simplified probabilistic model for maximum traffic load from weigh-in-motion data. Struct. Infrastruct. Eng. 2017, 13, 454–467. [Google Scholar] [CrossRef]
- Bedford, T.; Cooke, R.M. Probability Density Decomposition for Conditionally Dependent Random Variables Modeled by Vines. Ann. Math. Artif. Intell. 2001, 32, 245–268. [Google Scholar] [CrossRef]
- Bedford, T.; Cooke, R. Vines—A new graphical model for dependent random variables. Ann. Stat. 2002, 30, 1031–1068. [Google Scholar] [CrossRef]
- Morales Napoles, O. About the Number of Vines and Regular Vines on N Nodes; TU Delft Library: Delft, The Netherlands, 2016. [Google Scholar]
- McKay, M.D.; Beckman, R.J.; Conover, W.J. Comparison of Three Methods for Selecting Values of Input Variables in the Analysis of Output from a Computer Code. Technometrics 1979, 21, 239–245. [Google Scholar]
- Iman, R.; Conover, W. A Distribution-Free Approach to Inducing Rank Correlation among Input Variates. Commun. Stat.-Simul. Comput. 1982, 11, 311–334. [Google Scholar] [CrossRef]
- Hallenbeck, M.E.; Selezneva, O.I.; Quinley, R. Verification, Refinement, and Applicability of Long-Term Pavement Performance Vehicle Classification Rules; FHWA: Washington, DC, USA, 2014. [Google Scholar]
- Sklar, A. Fonctions de Repartition an Dimensions et Leurs Marges. Publ. De L’institut De Stat. De L’université De Paris 1959, 8, 229–231. [Google Scholar]
- Zhao, Y.; Guo, X.; Su, B.; Sun, Y.; Zhu, Y. Multi-Lane Traffic Load Clustering Model for Long-Span Bridge Based on Parameter Correlation. Mathematics 2023, 11, 274. [Google Scholar] [CrossRef]
- Mu, H.; Liu, H.; Shen, J. Copula-Based Uncertainty Quantification (Copula-UQ) for Multi-Sensor Data in Structural Health Monitoring. Sensors 2020, 20, 5692. [Google Scholar] [CrossRef] [PubMed]
- Scheuer, E.M.; Stoller, D.S. On the Generation of Normal Random Vectors. Technometrics 1962, 4, 278–281. [Google Scholar] [CrossRef]
- Federal Highway Administration. Highway Safety and Truck Crash Comparative Analysis Technical Report; FHWA: Washington, DC, USA, 2015; pp. 56–57. [Google Scholar]


| Vehicle Type | Lane 0/‱ | Lane 1/‱ | Lane 2/‱ | Lane 3/‱ | Total/‱ |
|---|---|---|---|---|---|
| 2 Axle, 4T SU | 1790.3000 | 1788.9550 | 2333.1040 | 965.8129 | 2985.4270 |
| Bus | 108.3499 | 107.5772 | 56.7047 | 104.5149 | 169.5703 |
| 2 Axle, 6T SU | 3311.0860 | 3310.1770 | 3487.1130 | 2365.9790 | 5127.4970 |
| 3 Axle SU | 302.7385 | 302.6917 | 418.3685 | 334.2686 | 119.7357 |
| 4+ Axle SU | 33.4853 | 32.5274 | 91.9235 | 18.3512 | 7.454761 |
| <4 Axle ST | 422.6222 | 421.4048 | 370.9372 | 582.9789 | 140.6703 |
| 5 Axle ST | 3178.3480 | 3178.6290 | 2240.7240 | 4686.4910 | 941.3933 |
| 6+ Axle ST | 19.2045 | 18.9485 | 12.2632 | 29.1005 | 6.1783 |
| <5 Axle MT | 185.4344 | 185.2683 | 174.9283 | 257.5469 | 44.1158 |
| 6 Axle MT | 86.8883 | 86.2973 | 36.8910 | 139.6438 | 27.8277 |
| 7+ Axle MT | 3.1873 | 3.1622 | 3.0405 | 4.4789 | 0.6127 |
| <4 Axle ST | 5 Axle ST | 6+ Axle ST | <5 Axle MT | 6 Axle MT | 7+ Axle MT | |
| <4 Axle ST | 1 | 0.3799 | 0.1725 | 0.4082 | 0.4032 | 0.0886 |
| 5 Axle ST | 0.3799 | 1 | 0.2246 | 0.3463 | 0.3101 | 0.1076 |
| 6+ Axle ST | 0.1725 | 0.2246 | 1 | 0.27 | 0.1613 | 0.194 |
| <5 Axle MT | 0.4082 | 0.3463 | 0.2700 | 1 | 0.4011 | 0.1313 |
| 6 Axle MT | 0.4032 | 0.3101 | 0.1613 | 0.4011 | 1 | 0.0874 |
| 7+ Axle MT | 0.0886 | 0.1076 | 0.1940 | 0.1313 | 0.0874 | 1 |
| Vehicle Type | Parameters | ||
|---|---|---|---|
| <4 Axle ST | a = 230.2 | b = 58.78 | c = 4.506 |
| 5 Axle ST | a1 = 1588 | b1 = 60.68 | c = 2.288 |
| a2 = 432 | b2 = 62.06 | c = 5.881 | |
| 6+ Axle ST | a = 838.8 | b = 61.44 | c = 3.828 |
| <5 Axle MT | a = 1046 | b = 61.2 | c = 3.003 |
| 6 Axle MT | a1 = 306.4 | b1 = 61.44 | c1 = 1.296 |
| a2 = 273.2 | b2 = 60.57 | c2 = 4.082 | |
| 7+ Axle MT | a = 188.9 | b = 60.58 | c = 5.524 |
| Tree | Edge | Copula | Par1 | Par2 | AIC | BIC |
|---|---|---|---|---|---|---|
| 1 | 1,6 | Frank | −0.7304 | 0.0157 | 2.9716 | |
| 1,5 | Frank | 2.1041 | −13.9431 | −10.9872 | ||
| 1,2 | Clayton | 0.3003 | −4.8657 | −1.9099 | ||
| 2,3 | Rotated Clayton | 1.3532 | −25.6906 | −22.7348 | ||
| 3,4 | Gumbel | 1.7000 | −900.3170 | −897.3612 | ||
| 2 | 2,5|1 | Frank | −0.5347 | 1.2936 | 4.2492 | |
| 2,6|1 | Student | −0.0234 | −39.9868 | −34.0751 | ||
| 1,3|2 | Frank | −0.0837 | 1.9577 | 4.9134 | ||
| 2,4|3 | Rotated Joe | 1.0329 | 1.9902 | 4.9460 | ||
| 3 | 5,6|21 | Gaussian | 0.0137 | 1.9094 | 4.8652 | |
| 3,4|12 | Gumbel | 1.0623 | 2.0451 | 5.0009 | ||
| 1,4|23 | Frank | 0.2530 | 2.0387 | 4.9946 | ||
| 4 | 4,5|123 | Frank | −0.6243 | 0.4744 | 3.4302 | |
| 3,6|125 | Frank | −0.2696 | 5.5349 | 2.0123 | 4.9682 | |
| 5 | 4,6|1235 | Clayton | 0.0544 | 1.8483 | 4.8041 |
| <4 Axle ST | 5 Axle ST | 6+ Axle ST | <5 Axle MT | 6 Axle MT | 7+ Axle MT | |
|---|---|---|---|---|---|---|
| Monitoring data | 0.0881 | 0.1329 | 0.1463 | 0.1637 | 0.1614 | 0.3075 |
| Working condition 1 | 0.0883 | 0.1330 | 0.1463 | 0.1637 | 0.1614 | 0.3074 |
| Working condition 2 | 0.0905 | 0.1343 | 0.1427 | 0.1682 | 0.1592 | 0.3055 |
| Working condition 3 | 0.0891 | 0.1348 | 0.1460 | 0.1645 | 0.1609 | 0.3047 |
| Working Condition 1/kN·m | Working Condition 2/kN·m | Working Condition 3/kN·m | |
|---|---|---|---|
| 10 m | 3725 | 3348 | 3288 |
| 20 m | 7511 | 7062 | 6491 |
| 30 m | 12,255 | 11,253 | 10,776 |
Disclaimer/Publisher’s Note: The statements, opinions and data contained in all publications are solely those of the individual author(s) and contributor(s) and not of MDPI and/or the editor(s). MDPI and/or the editor(s) disclaim responsibility for any injury to people or property resulting from any ideas, methods, instructions or products referred to in the content. |
© 2023 by the authors. Licensee MDPI, Basel, Switzerland. This article is an open access article distributed under the terms and conditions of the Creative Commons Attribution (CC BY) license (https://creativecommons.org/licenses/by/4.0/).
Share and Cite
Lu, H.; Sun, D.; Hao, J. Random Traffic Flow Simulation of Heavy Vehicles Based on R-Vine Copula Model and Improved Latin Hypercube Sampling Method. Sensors 2023, 23, 2795. https://doi.org/10.3390/s23052795
Lu H, Sun D, Hao J. Random Traffic Flow Simulation of Heavy Vehicles Based on R-Vine Copula Model and Improved Latin Hypercube Sampling Method. Sensors. 2023; 23(5):2795. https://doi.org/10.3390/s23052795
Chicago/Turabian StyleLu, Hailin, Dongchen Sun, and Jing Hao. 2023. "Random Traffic Flow Simulation of Heavy Vehicles Based on R-Vine Copula Model and Improved Latin Hypercube Sampling Method" Sensors 23, no. 5: 2795. https://doi.org/10.3390/s23052795
APA StyleLu, H., Sun, D., & Hao, J. (2023). Random Traffic Flow Simulation of Heavy Vehicles Based on R-Vine Copula Model and Improved Latin Hypercube Sampling Method. Sensors, 23(5), 2795. https://doi.org/10.3390/s23052795