Article

Sol-Gel Dipping Devices for H2S Visualization

Dipartimento di Chimica e Biologia “Adolfo Zambelli”, Università degli Studi di Salerno, Via Giovanni Paolo II, 132, 84084 Fisciano, Italy
*
Author to whom correspondence should be addressed.
Sensors 2023, 23(4), 2023; https://doi.org/10.3390/s23042023
Submission received: 2 February 2023 / Revised: 8 February 2023 / Accepted: 8 February 2023 / Published: 10 February 2023
(This article belongs to the Special Issue Editorial Board Members' Collection Series: Fluorescent Sensors)

Abstract

:
In this contribution we report the synthesis and full characterization, via a combination of different spectroscopies (e.g., 1H NMR, UV-vis, fluorescence, MALDI), of a new family of fluorescent zinc complexes with extended π-conjugated systems, with the final aim of setting up higher performance H2S sensing devices. Immobilization of the systems into a polymeric matrix for use in a solid-state portable device was also explored. The results provided proof-of-principle that the title complexes could be successfully implemented in a fast, simple and cost-effective H2S sensing device.

1. Introduction

The discovery that in addition to its traditional toxic role, hydrogen sulfide (H2S) [1] is an endogenously produced molecule which is involved in a variety of key biological processes within the human body [2,3], induced several research groups to try to address hydrogen sulfide’s (bio) reactivity in more detail. The complex biological chemistry of H2S involves numerous cellular targets in both physiological and pathological conditions and the transition metals constitute logical targets of reactivity given their affinity for the Lewis-basic sulfur atom of hydrogen sulfide. The role of H2S as a gaseous signaling molecule, together with nitric oxide (NO) and carbon monoxide (CO), is by now commonly acknowledged [4,5,6] and akin to NO and CO, H2S and its conjugate base, the hydrosulfide ion (HS), are willing to coordinate to transition metals, however, the coordination chemistry of H2S/HS has been much less studied. The relative scarcity of studies concerning the metal complexes of H2S/HS is mainly due to the difficulties associated with the reactivity of the molecule, including its redox reactivity, and the different chemistry associated with the specific protonation state. Notwithstanding this, the study of the bioinorganic chemistry of hydrogen sulfide has been ongoing for some time [7,8,9,10,11,12,13,14,15] and still represents an active area of study [16]. Studies demonstrating the signaling pathways involving the metalloproteins together with the evidence implicating H2S/HS in an increasing number of biological processes inspired most of the recent studies on the metal-based chemistry of H2S. Both natural and synthetic systems have been proposed as new examples of metal complexes capable of coordinating H2S/HS [17,18,19,20,21,22,23,24,25,26,27,28,29,30,31,32]. Considering the very flexible and attractive optical properties of salen-based zinc complexes [33,34,35,36,37,38], and motivated by our interest in the coordination of H2S to the transition metals, we focused on salen-based zinc systems and studied their reactivity with H2S/HS [39,40,41,42,43]. Our studies provide evidence that the zinc-salen systems constitute a suitable platform of systems that are able to stabilize hydrosulfide coordination at the zinc center and can act as very efficient HS sensing constructs via a ‘coordinative-based’ mechanism [44].
In the present study, we explored whether enhancing the size of the π-conjugated system of the bridge between the zinc-chelating nitrogens and/or of the phenolate moieties would affect the zinc hydrosulfide stabilization and additionally if the different ligand structures would improve the fluorescence and colorimetric properties of the related complexes as HS sensors. We also wanted to investigate whether increasing the rigidity of the bridge between the two nitrogen donor atoms, by introducing a more conjugated spacer (e.g., passing from a diaminomalonitrile (DAMN) [41] to a phthalonitrile bridge), would tune the fluorescence responses in the presence of HS and the overall photophysical properties of the resulting complexes. To address this aim, we synthesized a new family of salen-based zinc complexes, as shown in Scheme 1.
In our long-term research concerning the implementation of higher performance sensors for H2S determination, we explored the possibility of immobilizing the title complexes into silica matrices aimed at setting-up more stable and portable sensors.

2. Experimental Section

2.1. Materials

Chemicals used for the synthetic work were obtained from Sigma-Aldrich or Strem Chemicals and were of reagent grade. They were used without further purification. NaSH (Alfa Aesar) in aqueous solution was used as HS source to the end concentration specified in the figure captions. Syntheses of complexes 14 were achieved by following literature procedures [37,38].

2.2. General

HR MALDI and ESI mass spectra were registered by using a Bruker solariX XR Fourier transform ion cyclotron resonance (FT-ICR) mass spectrometer (Bruker Daltonik GmbH, Bremen, Germany) equipped with a 7 T refrigerated actively-shielded superconducting magnet (Bruker Biospin, Wissembourg, France). The samples were ionized in positive ion mode using either the MALDI ion or the ESI ion source. The mass range was set to m/z 150–2000. The laser power was 15% and 15 laser shots were used for each scan. Mass spectra were calibrated externally using a mix of peptide clusters in MALDI ionization positive (or negative) ion mode. A linear calibration was applied.
NMR spectra were registered on a Bruker AVANCE 400 NMR instrument (1H NMR, 400.13 MHz; 13C NMR, 100.62 MHz) or on a 600 MHz spectrometer [600 (1H NMR) and 150 MHz (13C NMR)] using 5 mm o.d. NMR tubes. The chemical shifts were reported in δ (ppm) referenced to SiMe4. Typically, 5 mg of the complex in 0.5 mL of the solvent were used for each experiment.
Synthesis of complexes 1 and 2. A mixture of the appropriate aldehyde (2 mmol) and 4,5-diaminophthtalonitrile (0.158 g, 1 mmol) in 50 mL of absolute ethanol was left under stirring for 1 h at room temperature. Then 1 eq of Zn(CH3COO)2*2H2O (0.219 g, 1 mmol) in 150 mL of absolute ethanol was added and the reaction vessel was left under stirring and at reflux overnight.
Synthesis of complexes 3 and 4. A mixture of 2 eq of 2-hydroxy-1-naphthaldehyde (0.344 g, 2 mmol) and 1 eq of Zn(CH3COO)2*2H2O (0.219 g, 1 mmol) in N,N-dimethylformamide (DMF) was left under stirring for 30 min at room temperature. Then diamine (1 mmol) was added and the mixture was left under stirring overnight at room temperature.
Characterization of complex 1. A golden-sheet-like solid was recovered by filtration on common filter paper and dried under vacuum (0.345 g, yield 75 %). 1H NMR [400 MHz, DMSO-d6]: δ = 10.11 (s, 2H, OH), 8.93 (s, 2H, H phthalonitrile), 8.48 (s, 2H, CH=N), 7.20 (d, J = 8.7 Hz, 4H, H aromatic), 6.11 (d, 2H, J = 8.6 Hz, H aromatic), 6.04 (s, 2H, H aromatic). MS (MALDI CH3CN with 1% DMSO): m/z (%) 461.02 (100) [complex 1 H]+.
Characterization of complex 2. A dark-orange precipitate was recovered by filtration washed with cold methanol and dried under vacuum (0.285 g, yield 50%). 1H NMR [300 MHz, DMSO-d6]: δ = 8.78 (s, 2H, H phthalonitrile), 8.36 (s, 2H, CH=N), 7.14 (d, 2H, J = 9.2 Hz, H aromatic), 6.19 (d, 2H, J = 9.2 Hz, H aromatic), 5.81 (s, 2H, H aromatic), 3.38 (m, 8H, N(CH2CH3)2; 1.15 (m, 12H, N(CH2CH3)2). MS (MALDI CH3OH): m/z (%) 471.17 (100) [complex 2 H]+.
Characterization of complex 3. An orange-brown solid was recovered by filtration on common filter paper, this was then washed with cold methanol and dried under vacuum (0.396g, yield 75 %). 1H NMR [300 MHz, DMSO-d6]: δ = 9.83 (s, 2H, CH=N), 8.95 (s, 2H, H phthalonitrile), 8.59 (d, 2H, J = 8.2 Hz, H naphthaldehyde), 7.87 (d, J = 8.7 Hz, 2H, H naphthaldehyde), 7.72 (d, 2H, J = 7.6 Hz, H naphthaldehyde), 7.52 (t, 2H, J = 8.1 Hz, H naphthaldehyde), 7.29 (t, 2H, J = 7.6 Hz, H naphthaldehyde), 6.99 (d, 2H, J = 9.3 Hz, H naphthaldehyde). MS (MALDI THF): m/z (%) 567.01 [complex 3 K]+; 551.04 [complex 3 Na]+; 529.06 [complex 3 H]+.
Characterization of complex 4. A purple solid was recovered by filtration on common filter paper, this was then washed with cold methanol and dried under vacuum (0.359 g, yield 75 %). 1H NMR [300 MHz, DMSO-d6]: δ = 9.30 (s, 2H, CH=N), 8.09 (d, 2H, J = 8.4 Hz, H naphthaldehyde), 7.93 (d, 2H, J = 9.4 Hz H naphthaldehyde),7.75 (d, 2H, J = 7.8 Hz, H naphthaldehyde), 7.56 (t, 2H, J = 7.6 Hz, H naphthaldehyde), 7.32 (t, 2H, J = 7.3 Hz, H naphthaldehyde), 7.00 (d, 2H, J = 9.4 Hz, H naphthaldehyde). MS (MALDI THF): m/z (%) 478.04 (100) [complex 4]+; 501.03 [complex 4 Na]+.
Complexes encapsulation in tetramethoxysilicate (TMOS) sol gel. The preparation of silica gels and the encapsulation of complexes were undertaken with pure TMOS [45]. TMOS (15.22 g) was mixed with milliQ water (3.38 g) in a 1:2 molar ratio followed by the addition of 20 µL of 10 mM HCl. The reaction mixture was sonicated for 20 min. Then roughly 1 mL of complex solution in DMSO (end conc. of complex: 5–10 µM) was added to the mixture. Before gelation 150 µL of the sol solution was quickly poured onto a home-made device (8 × 30 mm2 quartz slide Heraeus 3 quality with a 1 mm thickness) yielding a roughly 0.6 mm thick sol–gel layer on top of the quartz slide. Activation of quartz slides with “Piranha solution” (30% H2O2 and concentrated H2SO4 in a 1:3 volume ratio) was performed before pouring the sol solution on top. [Caution: “Piranha solution” is highly corrosive and should be handled with extreme care]. After drying, the sol-gels were analyzed under an ultraviolet lamp (Spectroline ENF-240C/FE) working at 365 nm wavelength irradiation.
Absorbance and fluorescence measurements. A Cary-50 Spectrophotometer with a 1 cm quartz cuvette (Hellma Benelux bv, Rijswijk, The Netherlands) and a slit-width equivalent to a bandwidth of 5 nm was used for the absorption spectra. Fluorescence spectra were measured on a Cary Eclipse Spectrophotometer in a 10 × 10mm2 airtight quartz fluorescence cuvette (Hellma Benelux bv, Rijswijk, The Netherlands) with an emission band-pass of 10 nm and an excitation band-pass of 5 nm. Both absorption and fluorescence measurements were performed in DMSO solutions at 25 °C. Fluorescence emission spectra were registered by exciting the samples at a specific wavelength (as stated in the figure captions).
Fluorescence quantum yield (ΦF) values were determined in optically diluted solutions of the samples by using as standards the commercial dye Cy3 NHS (ΦF = 0.15 in MilliQ water) for complex 1 and Cy5 NHS (ΦF = 0.28 in MilliQ water) in the case of complex 4, according to the equation [46]:
ΦFs = ΦFr (Is/Ir)(Ar/As)(ηs/ηr)2
where indexes s and r denote the sample and reference, respectively. I stands for the integrated emission intensity, A is the absorbance at the excitation wavelength, and η is the refractive index of the solvent. The optical density of complexes 1 and 4 and standards was kept below 0.1. The uncertainty in the determination of ΦF is ±15%.
NMR characterization of the complexes 1–4 upon addition of HS. NMR samples were prepared by charging the tubes with the free complexes solutions in DMSO-d6 then NaSH solid or in solution (to the end concentrations specified in the figure captions) was added and the spectra registered.
Computational details. All electronic computations were carried out at the density functional level of theory using the range separated hybrid functional CAM-B3LYP with TZVP basis set as implemented in the Gaussian package (G16) [47]. This combination of functional and basis set was chosen because it results in accurate predictions, as discussed in previous works [48]. Time dependent DFT (TD-DFT) was employed for treating all excited states. Spin-orbit coupling elements were computed by PySOC code [49,50]. Effects due to solvent polarization [51] were included by the polarizable continuum model (PCM) [52].
Cell culture and cell-conditioned media preparation. HepG2 cells (Human hepatocellular liver carcinoma cell line) were grown in Minimum Essential Medium (MEM) supplemented with 10% fetal bovine serum (FBS), 2 mM Glutamine, 1 mM non-essential amino acids, and 1% antibiotics (penicillin/streptomycin, 100 U/mL). Cells were maintained in a humidified incubator at 37 °C in 5% CO2/95% air. To prepare cell-conditioned HBSS media, approximately 5 × 10⁵ cells were seeded in each well of a 6-well plate and cultured with 1 mL of HBSS for 24 h. To induce endogenous production of HS, cells were treated with 800 µM of H2O2 for 1 h. After the incubation, conditioned media were collected and used for testing sol-gel devices as described above.

3. Results and Discussion

Complexes 14 were easily prepared in a one-step procedure by reacting the appropriate salicylaldehyde and the corresponding diamine in a 2:1 ratio with one equivalent of zinc acetate dihydrate, by following the literature procedures [37,38,53]. The 1H NMR and high-resolution MALDI Fourier transform ion cyclotron resonance mass (HR MALDI-FT-ICR) experiments assessed the purity of the complexes under investigation (see Figures S1–S8). The protonic spectra exhibited sharp and narrow signals with a highly symmetric pattern, confirming the proposed structures (Figures S1–S4). In the MALDI spectra (Figures S5–S8) the major peaks at 461.021 m/z units for complex 1, at 571.176 m/z units for complex 2, at 529.063 m/z units for complex 3 and at 478.040 m/z units for complex 4 corresponded to the monomeric species: no peaks ascribable to the dimeric species were found.
After characterization of complexes 14 we commenced screening of the optical properties, to assess their potential use in the colorimetric and fluorometric recognition of HS. Figure 1 displays the UV-vis spectra of the title complexes before and after the treatment with an excess of HS.
As clearly visible from Figure 1, all the complexes under investigation absorbed in the blue-green section of the electromagnetic spectrum and exhibited a change of the initial UV-visible spectrum upon interaction with HS which suggests the formation of a new species.
In the case of complex 4 a significant naked-eye color variation was also observed (see Figure S9).
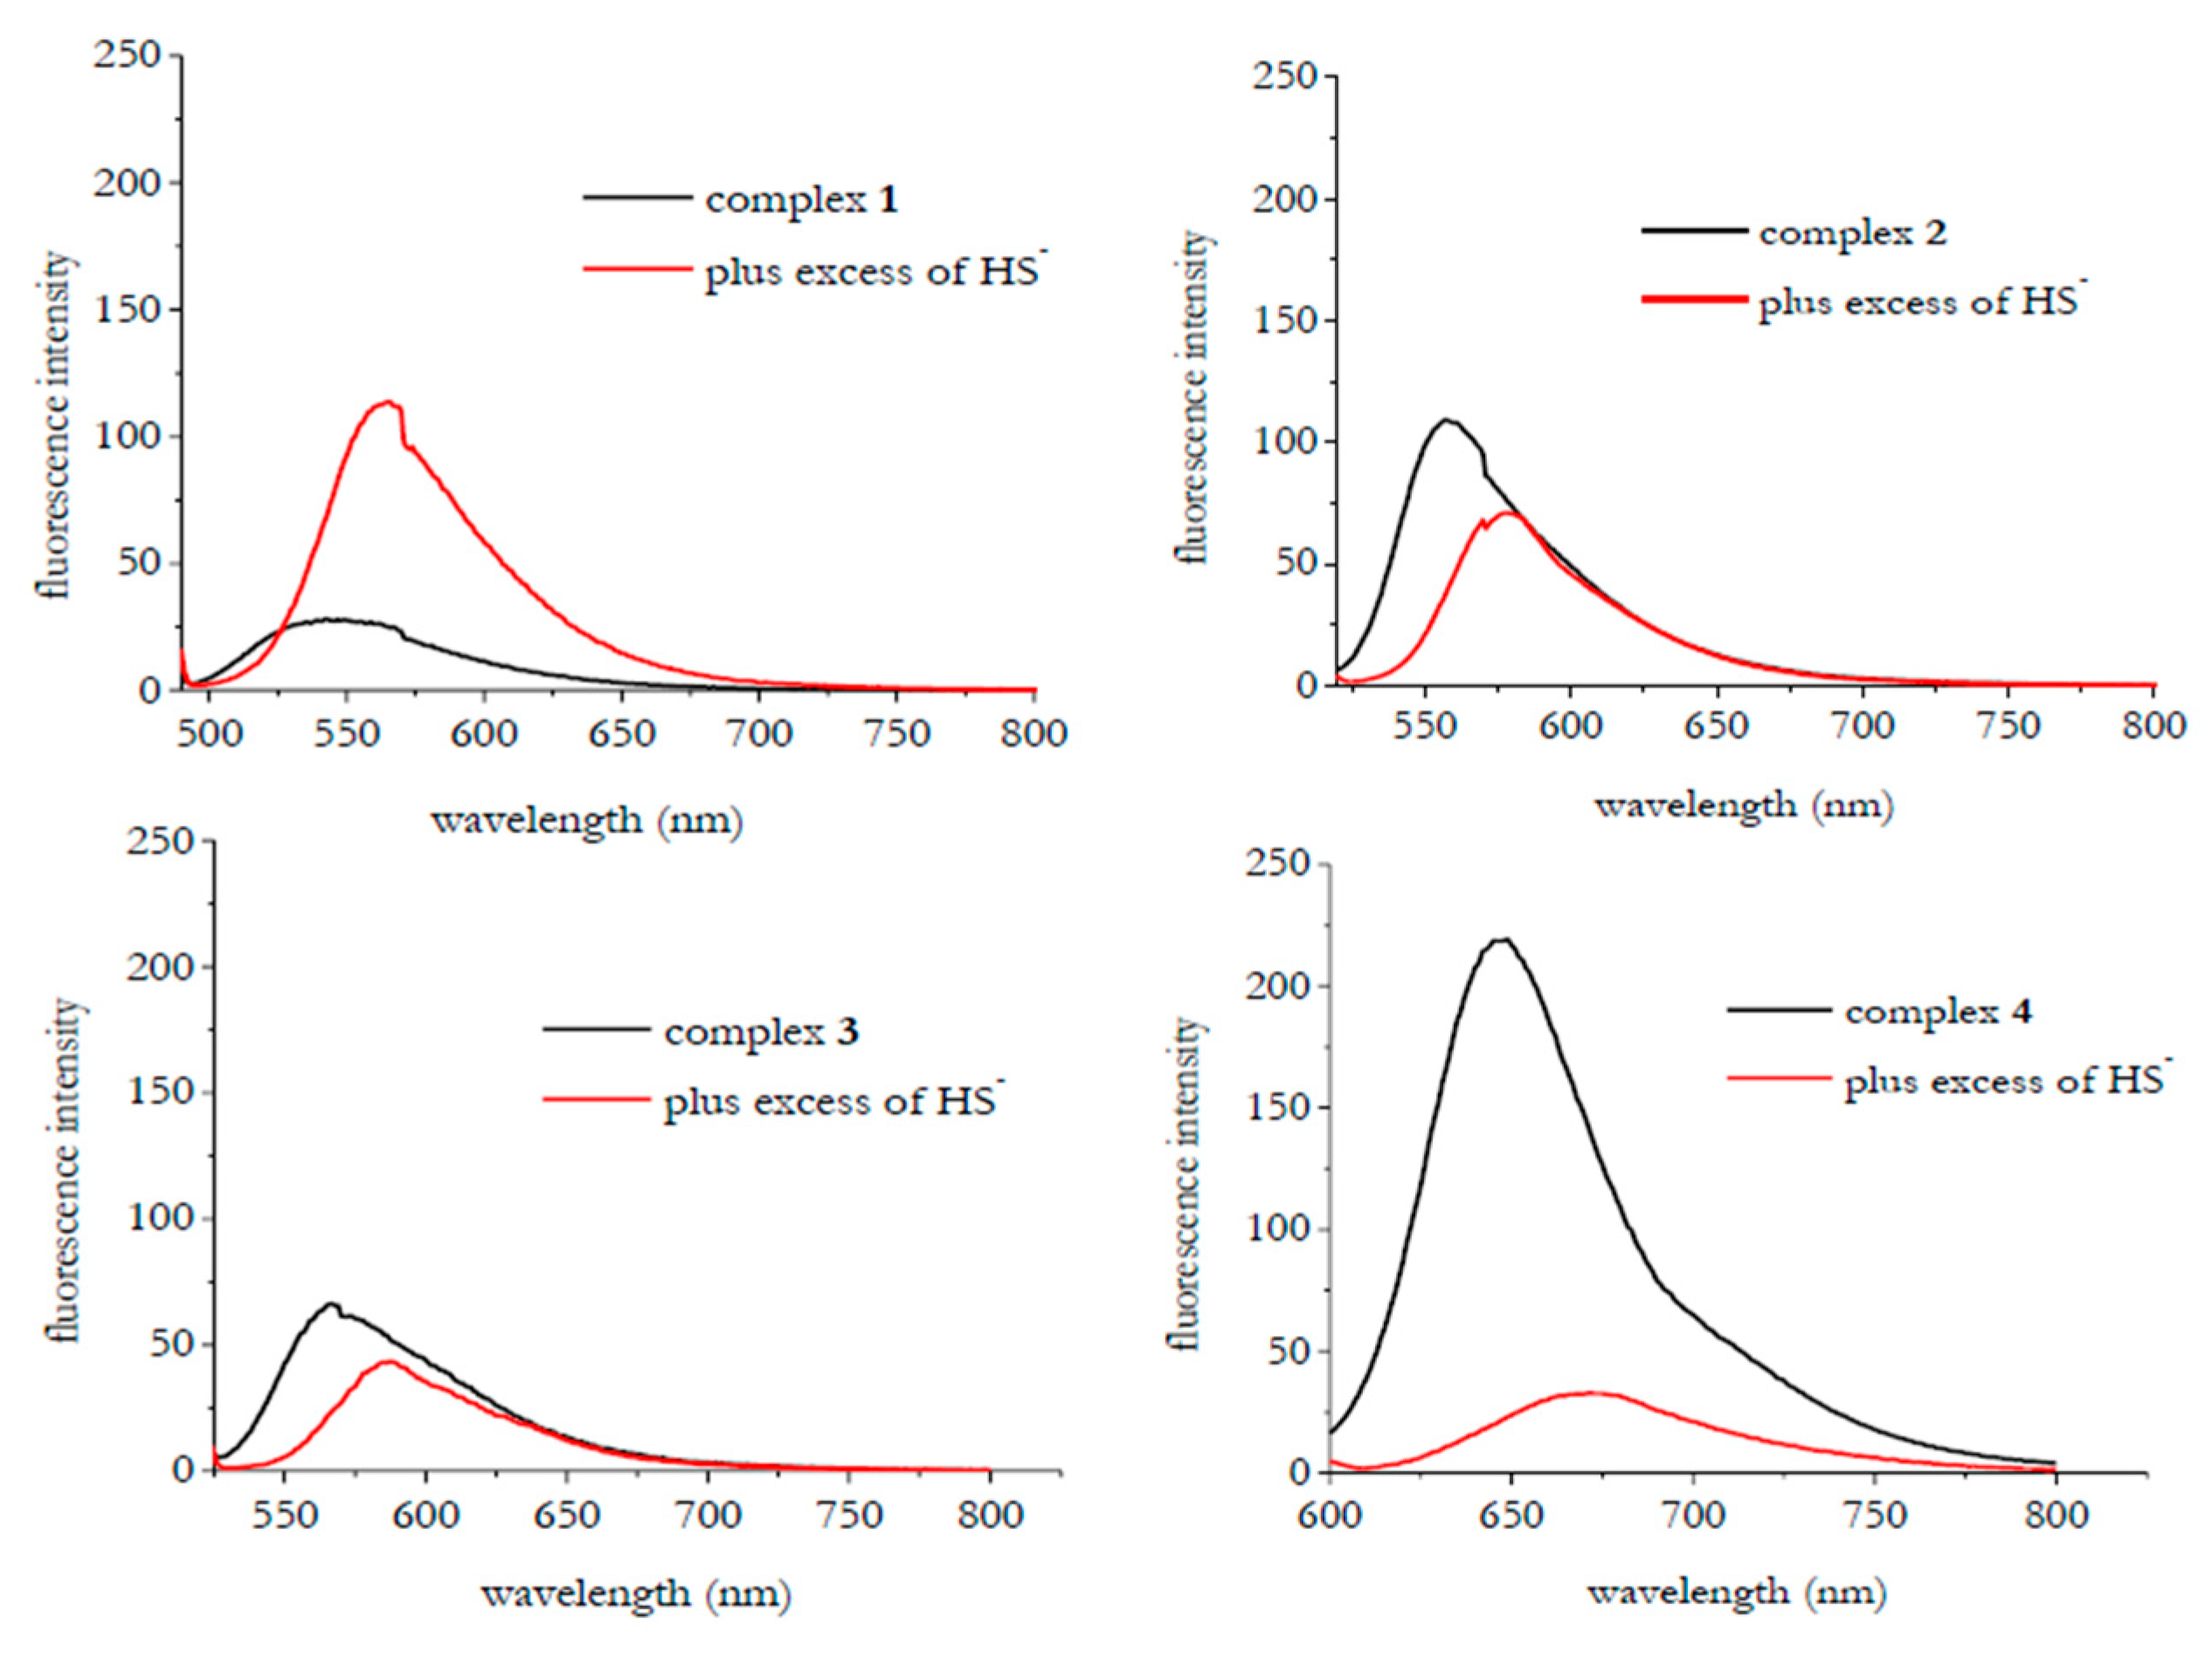
Subsequently, we tested the fluorescence responses in the presence of HS. The outcome of these experiments is shown in Figure 2. The most emissive complex of the series was complex 4 which was also the complex exhibiting a more red-shifted emission with respect to the others under investigation.
The addition of HS resulted in a significant fluorescence switching for all of the complexes under investigation. In particular, complex 1 experienced a turn-on of the initial fluorescence intensity whereas complexes 2–4 harnessed a fluorescent quenching.
To further test the sensing abilities of the complexes under investigation for H2S visualization/detection, we checked whether the binding of HS was reversible, as observed with probes which we and others had proposed in the past [22,25,28]: reversibility is a key property for application in real measurements.
More precisely, to assess the reversibility of HS binding, we first prepared the complex/HS species in situ by adding 5 equivalents of NaSH to the complex and subsequently added an excess of acetic acid. The best response (in terms of number of cycles possible) was observed for complex 1: the initial fluorescence intensity, which enhanced upon the addition of HS and was quenched when acetic acid was added, thus suggesting reversibility of the sensing construct. Figure 3 shows a typical time trace of a solution containing 10 µM of complex 1 when excited at 481 nm.
From the first screening experiments, complex 1 appeared as the most promising in the determination of HS, thus for the next experiments we focused on this complex.
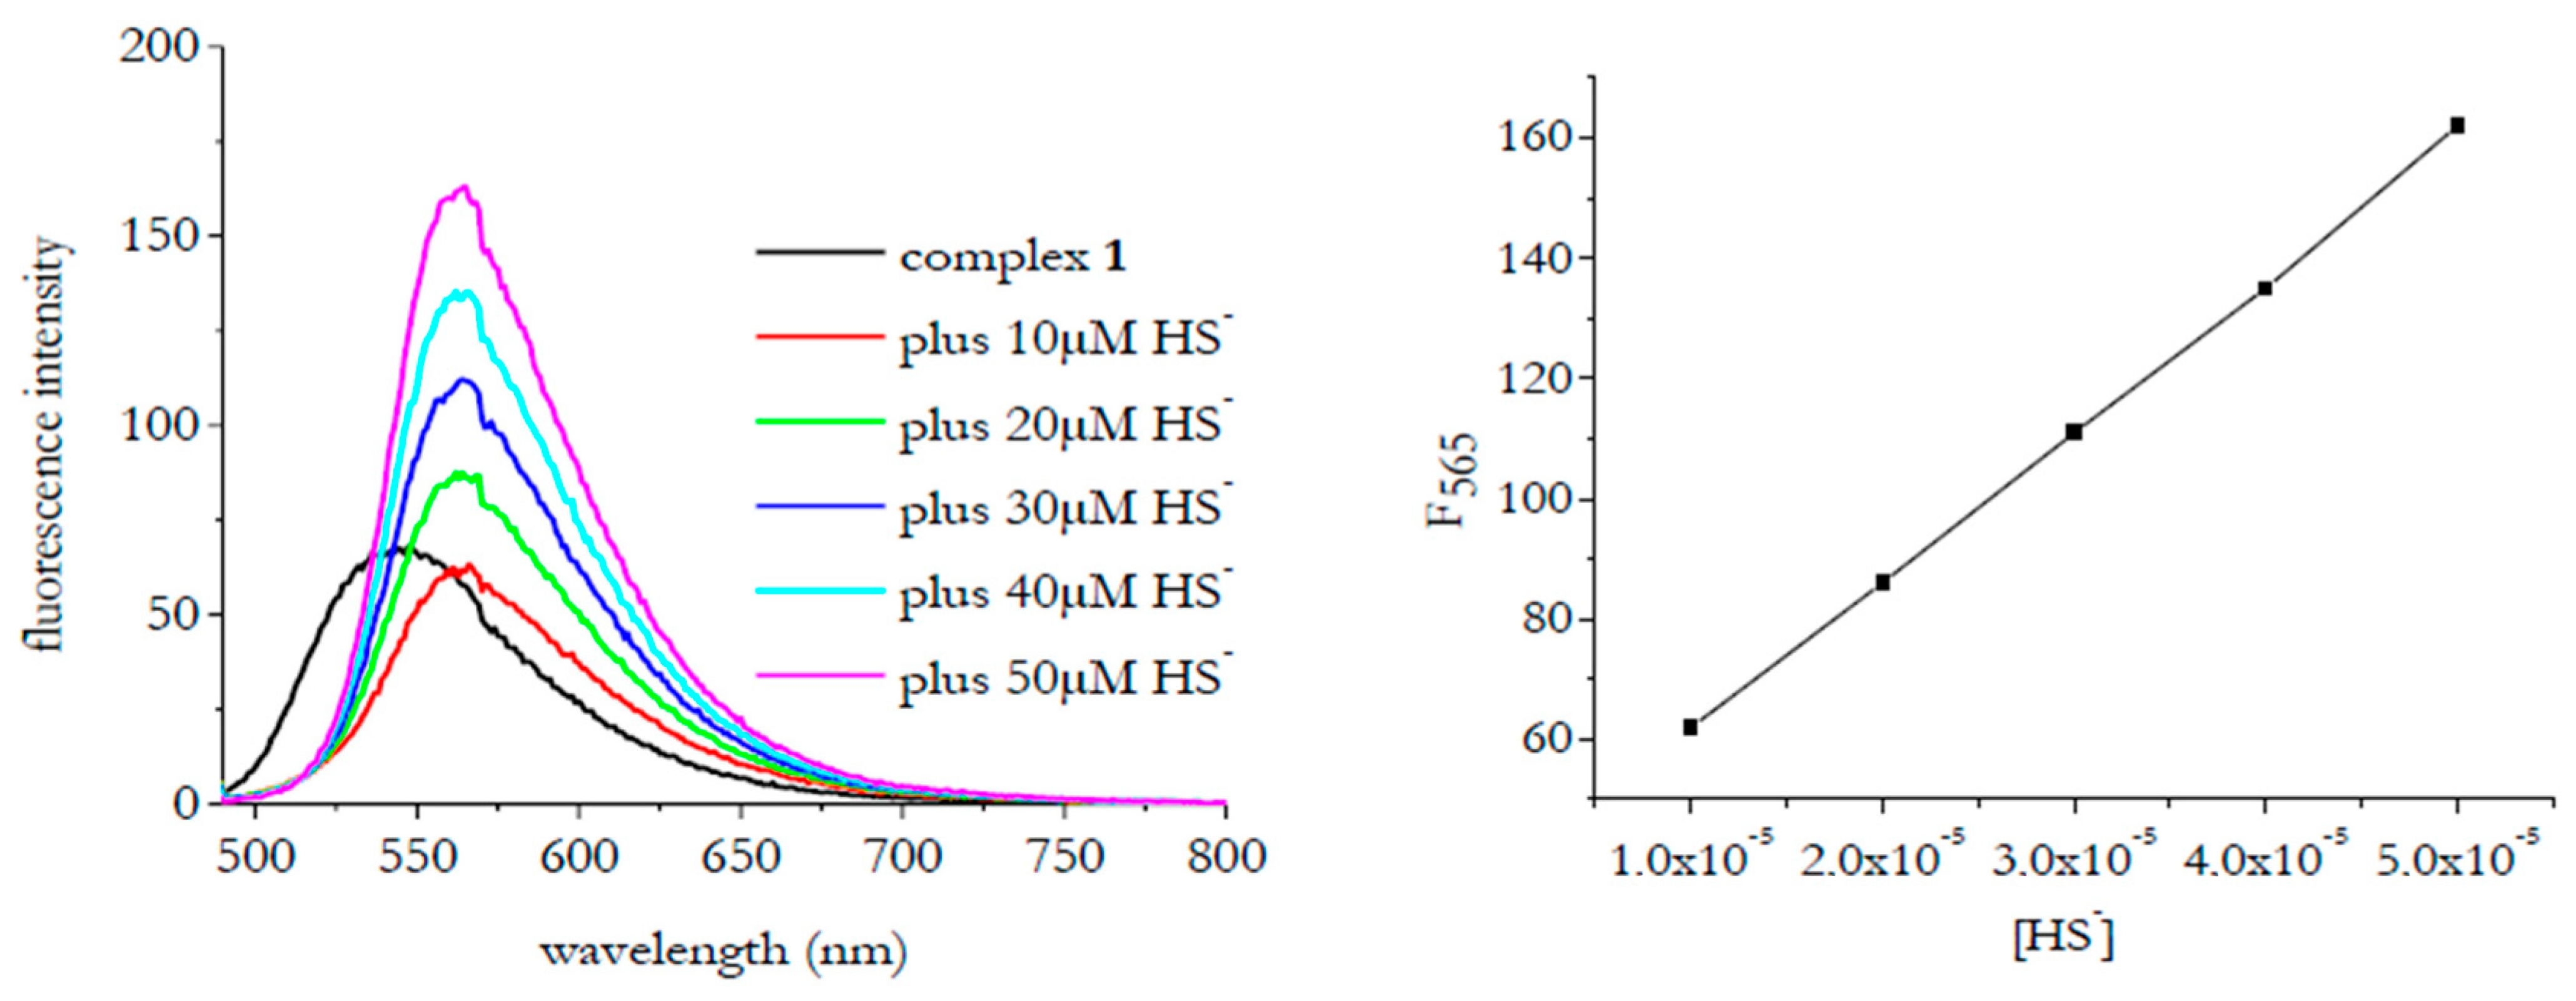
To assess whether there was a dependence between the fluorescence intensity of complex 1 and the HS concentration we performed an experiment where we added increasing amounts of HS (in the range 10–50 µM) to the complex in DMSO. Figure 4 displays the outcome of this experiment: as visible, a linear correlation was found when plotting the maximum of the fluorescence emission against the HS concentration, which functioned as calibration of the system.
With the aim of implementing a more stable and above all easily portable device, we immobilized complex 1 on a sol-gel based matrix and checked its fluorescence response to HS upon immobilization. The fluorescence enhancement observed in solution in the presence of HS was also retained in the solid state (Figure S10).
Following on from these results, to assess the detection capability of complex 1 in more physiological conditions and to explore the possibility of implementing sol-gel dipping devices for H2S visualization, we used ddH2O (doubly distilled water) and HBSS buffer where we dissolved HS at different concentrations, namely 17.8, 178, and 1780 µM, falling into a physiological range [2,54]. Moreover, we tested the sol-gel devices to reveal endogenous HS produced by the human hepatic HepG2 cell line after 24 h incubation with HBSS media.
To optimize the experimental conditions and also for comparative purposes we ran several trial experiments with the complex in Figure 5, which we had reported in the past [41].
As observed by experiments reported in Figure 6, preliminary tests indicated that both the complexes loaded in the sol-gel matrices were able to detect different HS concentrations in ddH2O. In fact, an evident color change was visible upon UV irradiation for the model complex (Figure 6a) and complex 1 (Figure 6b).
Of greater interest, the sol-gel matrices detected lower and physiological HS concentrations in the HBSS buffer as well, with a chemical composition closer to the biological fluids (Figure 7a,b).
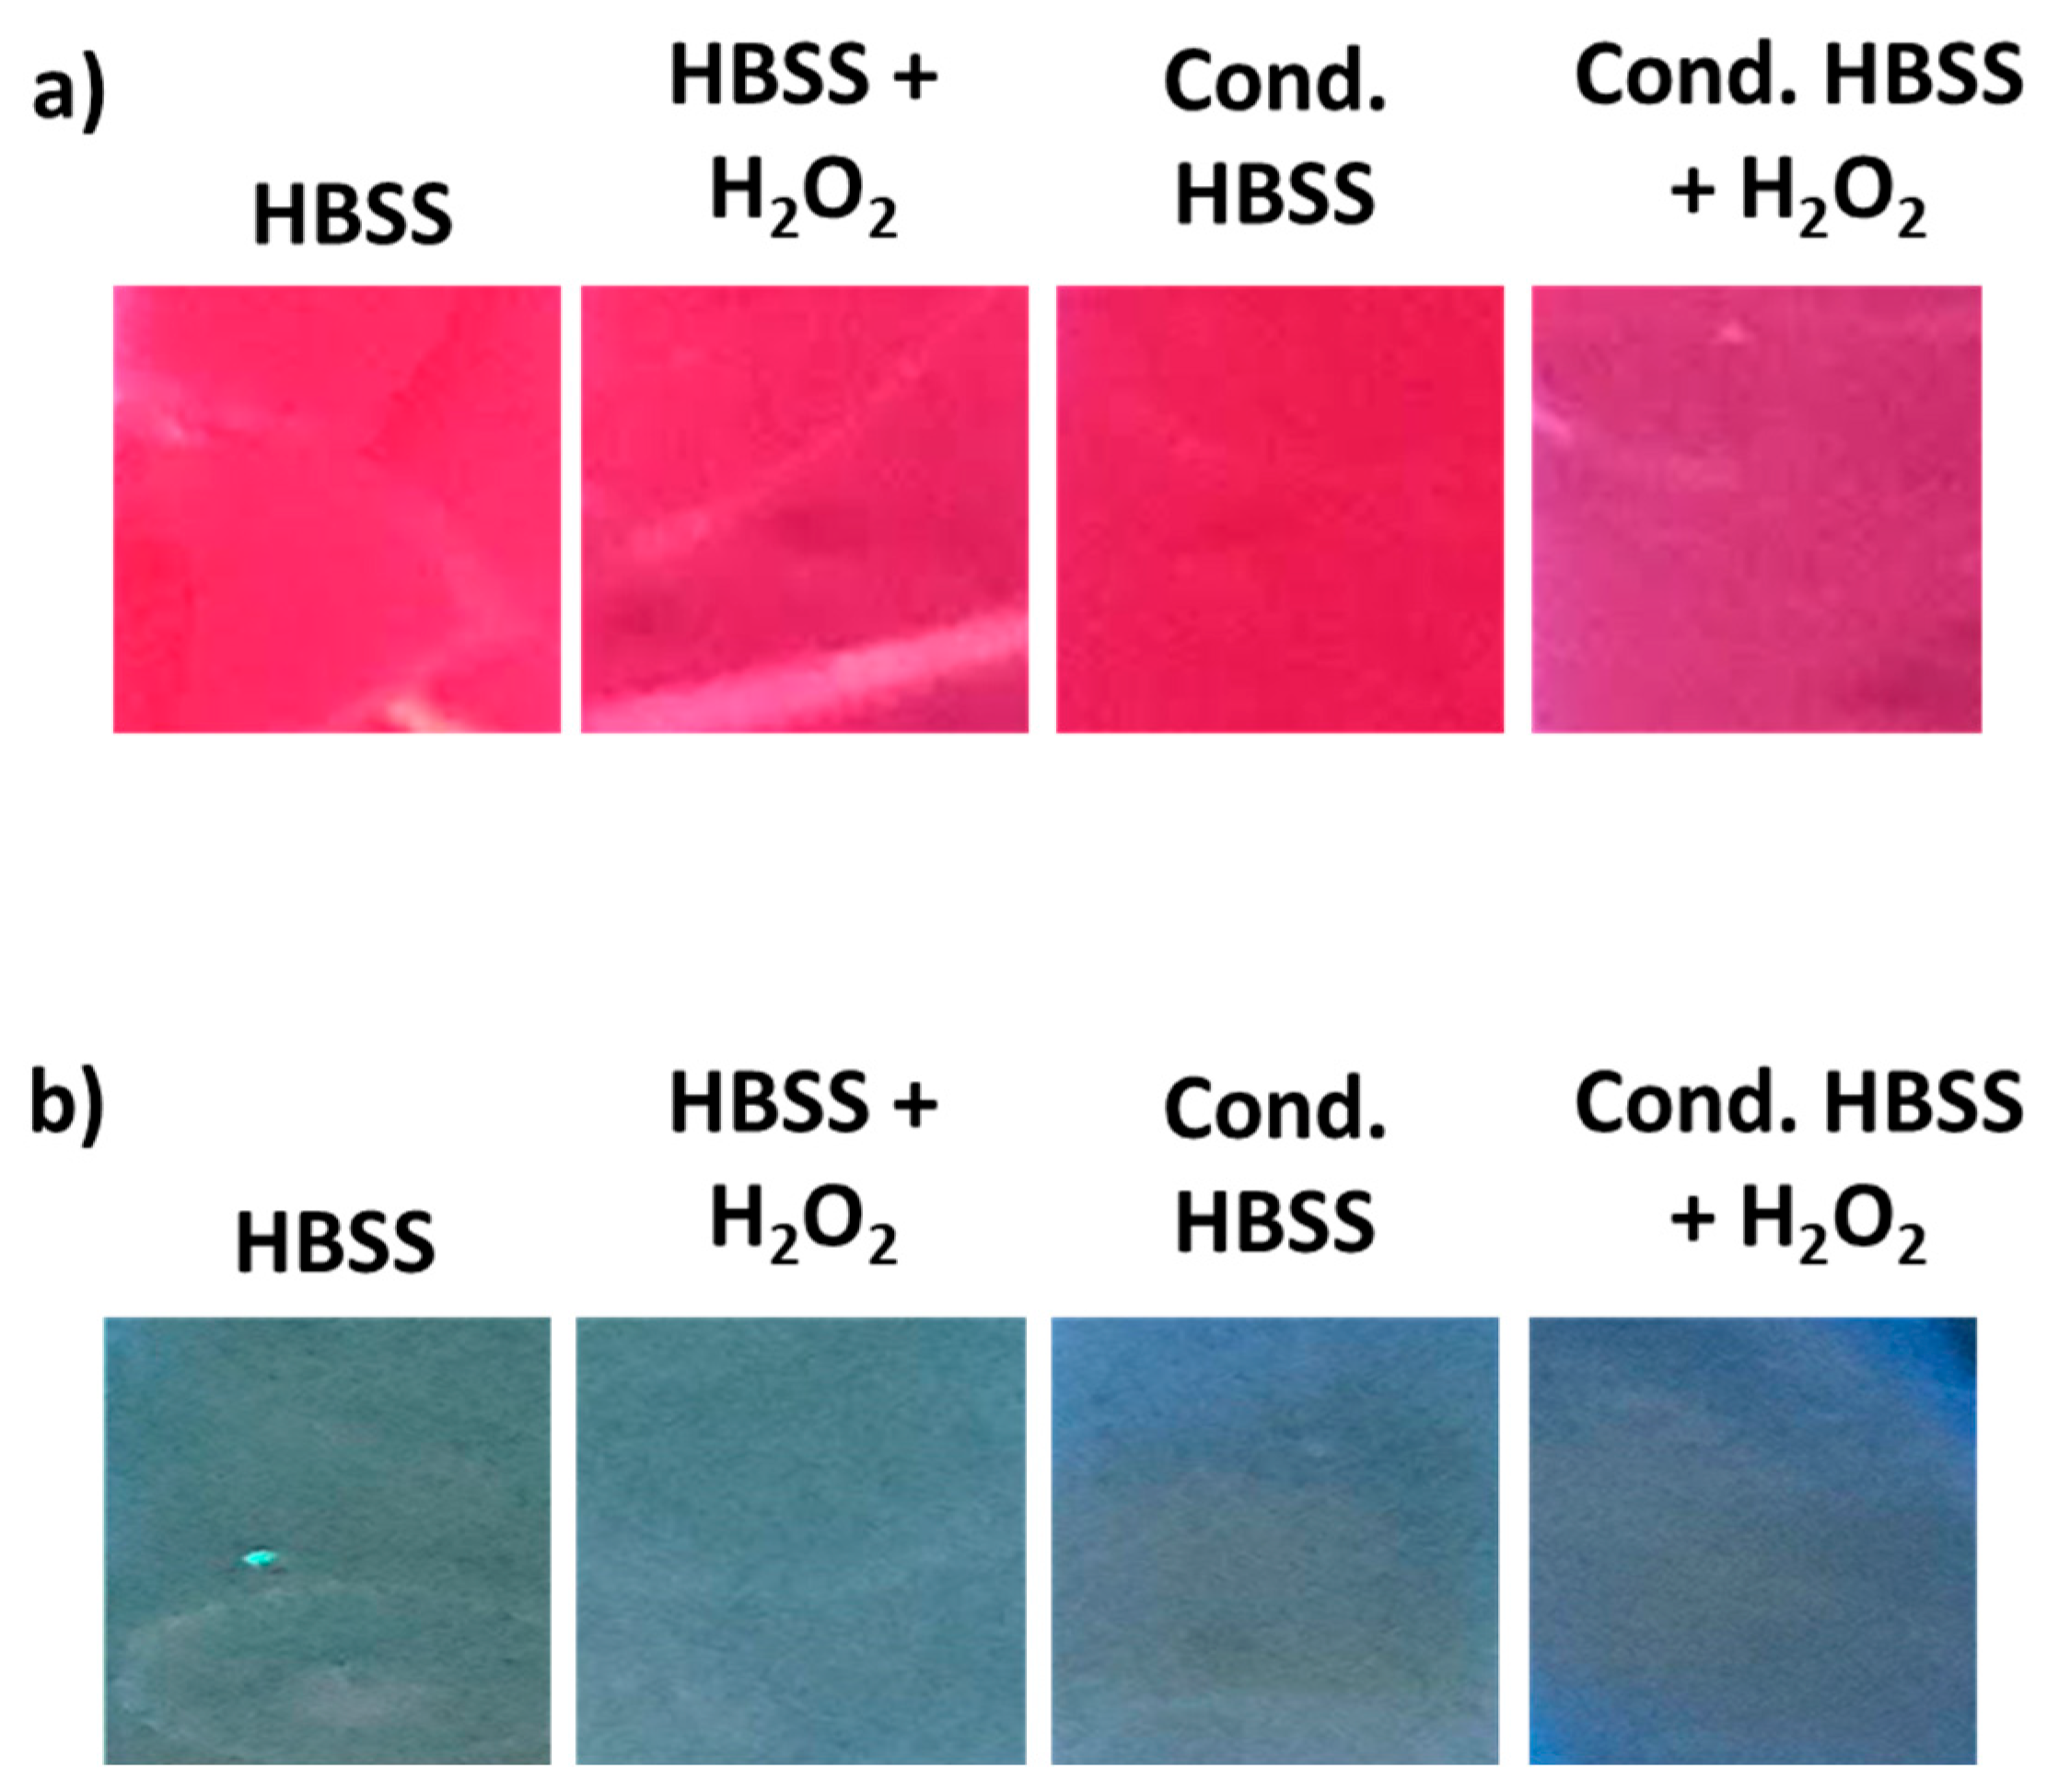
In order to assess the capability of the sol-gel devices to reveal levels of endogenous HS, we used the HBSS media previously incubated with the HepG2 cells for 24 h in the absence and the presence of H2O2 (as a stimulus to increase HS production by the cells) [55]. The different chromatic variations of matrices loaded with both complexes were observed (Figure 8a,b). In particular, the matrices in contact with the media conditioned by the cells assumed a color more similar to the samples treated with concentrations of HS comprised between 178 and 1780 µM (Figure 7). Conversely, the matrices treated with the non-conditioned media showed a less significant color change (Figure 8a,b). Furthermore, one hour treatment of the cells with 800 µM H2O2 induced a well-evidenced variation of color for both the complexes (Figure 8a,b) which is most likely attributable to an increment in HS production. As a control, samples treated with non-conditioned medium +800 µM H2O2 showed a slight color change suggesting no interference by H2O2 itself. Taken altogether these results demonstrate the great potential of complex 1 and the model complex-loaded sol-gel devices to detect HS in a biological fluid.
Investigations into the recognition mechanism of HS by complexes 1–4. The proton NMR experiments pointed to the binding of HS to the zinc centres for all of the complexes under investigation; this was evidenced by the appearance of the high-field SH resonance (visible in all the registered spectra) together with the shift of the signals pattern (see Figures S11–S14) [22,25,39,41,42,43,56]. Similar results, corroborating the binding of HS to the zinc ions in complexes 1–4, could be drawn by high-resolution MALDI experiments (Figures S15–S18). In addition, MS spectrometry clearly indicated the formation of 1:1 HS adducts for complexes 1–4. The reversibility of HS binding in the presence of acetic acid with the concomitant modulation of the fluorescence response (see Figure 3) represented a further confirmation that ‘a coordinative mechanism’ of recognition was operative.
Computational study. As we were willing to rationalize the photophysical properties of this new family of complexes, we focused on complexes 1 and 4 and performed a computational analysis at the time dependent density functional theory (TD-DFT) level. The minimum energy geometries of complex 1, complex 4 and of their HS adducts (and also considering the possibility of multiple adducts) were computed both for the ground state and for the first excited singlet states. The computed ground state optimum geometries of complex 1 and its HS complexes are shown in Figure 9 (a similar geometry has been also found for complex 4 and its HS complex, Figure S19).
Complexes 1 and 4 deviate from the square planar nuclear configuration observed for salen-analogues [41,42], with the metal atom in the plane of the ligand (see Figure 9). The formation of the single adduct is predicted to be exergonic (ΔE = −0.86 eV for complex 1, ΔE = −0.92 eV for complex 4), whereas the double adduct is not predicted to be a stable species, as confirmed by the DFT computation where the second HS was moved away from the metal centre during the geometry optimization.
The emission from S1 was predicted to be electric dipole allowed for both complex 1 and complex 4 and for their HS adducts. The computed vertical and adiabatic excitation energies are reported in Table 1, together with the oscillator strengths for the S1 ← S0 transitions.
For complex 1, three electric dipole transitions were predicted at approximately 307, 349 and 384 nm; in fair agreement with the experimental absorption spectra (see Figure 1). However, a meaningful comparison between the predicted and the observed absorption spectra would require a band-shape simulation, with the computations of Franck-Condon integrals [57] which was far beyond the qualitative purposes of the present computational analysis.
Since emission from S1 are electric dipole allowed transitionsfor all the species under study, the different behaviour observed for complex 1 and complex 4 and for their HS complexes had to be related with the possible existence of non-radiative decay paths. We have thus investigated the energy location of the lowest triplet states, which could be responsible for the different fluorescence quantum yields of complex 1 and complex 4 and their HS adducts (Table S1).
The energies of the four lowest triplet states are reported in Figure 10; T5 lies always above in energy than S1 and therefore it should not be involved in non-radiative decay paths. T1 is significantly lower in energy than S1 for all the species and therefore, based on the energy gap rule, the direct transition S1  T1 and should not be an efficient decay path. The triplet states closer in energy to S1 are T3 and T4 for complex 1 and T2 for complex 4.
As concerns complex 1, the S1  T4 transition was slightly exergonic (10 meV), but it became endergonic (160meV) when the HS was coordinated (Figure 10). This suggests that quenching of fluorescence via S1  T4 is possible in the isolated complex, whereas fluorescence is recovered in the presence of HS in solution, which is in line with the experimental observations (see Figure 2).
On the contrary for complex 4, the S1  T2 transition was exoergonic both before and after coordination, however being more favoured after HS coordination, as demonstrated by the lower energy difference between the electronic states (Figure 10) and by the significantly higher spin-orbit coupling for S1  T2 (see Table 2). Thus, a strong quenching of fluorescence is to be expected in the presence of HS, as was indeed observed (see Figure 2).

4. Conclusions

A new family of salen-based zinc complexes with π-extended structures were prepared, which can be used for direct fluorescence-based and colorimetric detection of HS. The fluorescence modulation observed during the reaction of these complexes with HS was the result of the binding of the target molecule to the zinc centers as demonstrated by the NMR and the MALDI experiments. This study further demonstrates the value of the coordinative-based approach as a valid strategy for the development of HS sensors. A computational analysis at the time dependent density functional theory (TD-DFT) level indicated that the different fluorescence responses observed for complex 1 and complex 4 in the presence of HS had to be related with the possible existence of non-radiative decay paths.
The successful immobilization of the title complexes in the sol-gel matrices paves the way for the development of more stable and easy-portable dipping devices for H2S visualization. In addition, our experiments demonstrated the great potential of complex 1 and the model complex-loaded sol-gel devices to detect HS in a biological fluid.
To our knowledge this is the first study in which the sol gel methodology was used in combination with the metal-based complexes to implement smart devices to be used in the fast growing applications of the H2S sensing field.

Supplementary Materials

The following are available online at: https://www.mdpi.com/article/10.3390/s23042023/s1, Figure S1: 1H NMR spectrum of complex 1 in DMSO-d6, Figure S2: 1H NMR spectrum of complex 2 in DMSO-d6, Figure S3: 1H NMR spectrum of complex 3 in DMSO-d6, Figure S4: 1H NMR spectrum of complex 4 in DMSO-d6, Figure S5: Enlargement of the MALDI of complex 1, Figure S6: Enlargement of the MALDI of complex 2, Figure S7: Enlargement of the MALDI of complex 3, Figure S8: Enlargement of the MALDI of complex 4, Figure S9: Real color images of DMSO solutions of complexes 4, Figure S10: Fluorescence intensity time trace of complex 4 in SOL-GEL matrix, Figure S11: 1H NMR spectra of complex 1 in the presence of NaHS, Figure S12: 1H NMR spectrum of complex 2 in the presence of NaHS, Figure S13: 1H NMR spectrum of complex 3 in the presence of NaHS, Figure S14: 1H NMR spectrum of complex 4 in the presence of NaHS, Figure S15: MALDI spectrum of complex 1 in the presence of NaHS, Figure S16: MALDI spectrum of complex 2 in the presence of NaHS, Figure S17: MALDI spectrum of complex 3 in the presence of NaHS, Figure S18: MALDI spectrum of complex 4 in the presence of NaHS, Figure S19: Optimized geometries for complex 1 and its adduct with HS−, Table S1: Photophysical features of complexes 1 and 4.

Author Contributions

Conceptualization, M.S. methodology, M.S. and M.L.; validation, D.G., N.B.; formal analysis, M.S.; investigation, M.S., G.F., V.V. and A.L.; resources, C.P.; data curation, A.P.; writing—original draft preparation, M.S.; writing—review and editing, M.S., A.L. and D.G.; supervision, M.S.; project administration, M.S.; funding acquisition, C.P. All authors have read and agreed to the published version of the manuscript.

Funding

This research received the grant FARB19 (codice 300389FRB19PELLE) as financial support.

Institutional Review Board Statement

Not applicable.

Informed Consent Statement

Not applicable.

Acknowledgments

Authors wish to thank Patrizia Oliva and Patrizia Iannece for their technical support.

Conflicts of Interest

The authors declare no conflict of interest.

References

  1. Reiffenstein, R.J.; Hulbert, W.C.; Roth, S.H. Toxicology of hydrogen sulfide. Annu. Rev. Pharmacol. Toxicol. 1992, 32, 109–134. [Google Scholar] [CrossRef] [PubMed]
  2. Kimura, H. Signaling Molecules: Hydrogen Sulfide and Polysulfide. Antioxid. Redox Signal 2014, 22, 362–376. [Google Scholar] [CrossRef] [PubMed]
  3. Li, L.; Moore, P.K. An overview of the biological significance of endogenous gases: New roles for old molecules. Biochem. Soc. Trans. 2007, 35 Pt 5, 1138–1141. [Google Scholar] [CrossRef]
  4. Li, L.; Moore, P.K. Putative biological roles of hydrogen sulfide in health and disease: A breath of not so fresh air? Trends Pharmacol. Sci. 2008, 29, 84–90. [Google Scholar] [CrossRef] [PubMed]
  5. Yang, G.; Wu, L.; Jiang, B.; Yang, W.; Qi, J.; Cao, K.; Meng, Q.; Mustafa, A.K.; Mu, W.; Zhang, S.; et al. H2S as a physiologic vasorelaxant: Hypertension in mice with deletion of cystathionine gamma-lyase. Science 2008, 322, 587–590. [Google Scholar] [CrossRef]
  6. Chen, C.Q.; Xin, H.; Zhu, Y.Z. Hydrogen sulfide: Third gaseous transmitter, but with great pharmacological potential. Acta Pharmacol. Sin. 2007, 28, 1709–1716. [Google Scholar] [CrossRef]
  7. Chandrika, D.; Ma, E.S.; Rettig, S.J.; James, B.R.; Cullen, W.R. Synthesis and X-ray Structure of an H2S Complex, RuCl2(P-N)(P(p-tolyl)3)(SH2) (P-N=o-(Diphenylphosphino)-N,N-dimethylaniline). Inorg. Chem. 1997, 36, 5426–5427. [Google Scholar] [CrossRef]
  8. Pleus, J.; Waden, H.; Saak, W.; Haase, D.; Pohl, S. Preparation of the first sulfur-containing cobalt and nickel complexes stabilised by the macrocyclic cyclam ligand; observation of S-H bond activation. J. Chem. Soc. Dalton Trans. 1999, 2601–2610. [Google Scholar] [CrossRef]
  9. Galardon, E.; Tomas, A.; Roussel, P.; Artaud, I. New fluorescent zinc complexes: Towards specific sensors for hydrogen sulfide in solution. Dalton Trans. 2009, 42, 9126–9130. [Google Scholar] [CrossRef]
  10. Galardon, E.; Tomas, A.; Selkti, M.; Roussel, P.; Artaud, I. Synthesis, Characterization, and Reactivity of Alkyldisulfanido Zinc Complexes. Inorg. Chem. 2009, 48, 5921–5927. [Google Scholar] [CrossRef]
  11. Pavlik, J.W.; Noll, B.C.; Oliver, A.G.; Schulz, C.E.; Scheidt, W.R. Hydrosulfide (HS-) Coordination in Iron Porphyrinates. Inorg. Chem. 2010, 49, 1017–1026. [Google Scholar] [CrossRef]
  12. Galardon, E.; Roger, T.; Deschamps, P.; Pascal, R.; Tomas, A.; Artaud, I. Synthesis of a FeIISH complex stabilized by an intramolecular N-H⋯S hydrogen bond, which acts as a H2S donor. Inorg. Chem. 2012, 51, 10068–10070. [Google Scholar] [CrossRef]
  13. Meininger, D.J.; Arman, H.D.; Tonzetich, Z.J. Synthesis, characterization, and binding affinity of hydrosulfide complexes of synthetic iron(II) porphyrinates. J. Inorg. Biochem. 2017, 167, 142–149. [Google Scholar] [CrossRef]
  14. Meininger, D.J.; Chee-Garza, M.; Arman, H.D.; Tonzetich, Z.J. Gallium(III) Tetraphenylporphyrinates Containing Hydrosulfide and Thiolate Ligands: Structural Models for Sulfur-Bound Iron(III) Hemes. Inorg. Chem. 2016, 55, 2421–2426. [Google Scholar] [CrossRef]
  15. Hartle, M.D.; Prell, J.S.; Pluth, M.D. Spectroscopic investigations into the binding of hydrogen sulfide to synthetic picket-fence porphyrins. Dalton Trans. 2016, 45, 4843–4853. [Google Scholar] [CrossRef]
  16. Tonzetich, Z.J. H2S and Bioinorganic Metal Complexes. In Hydrogen Sulfide; Wiley: Hoboken, NJ, USA, 2022; pp. 103–141. [Google Scholar]
  17. Strianese, M.; Varriale, A.; Staiano, M.; Pellecchia, C.; D’Auria, S. Absorption into fluorescence. A method to sense biologically relevant gas molecules. Nanoscale 2011, 3, 298–302. [Google Scholar] [CrossRef]
  18. Strianese, M.; Milione, S.; Bertolasi, V.; Pellecchia, C.; Grassi, A. Heteroscorpionate-Based Co2+, Zn2+, and Cu2+ Complexes: Coordination Behavior, Aerobic Oxidation, and Hydrogen Sulfide Detection. Inorg. Chem. 2011, 50, 900–910. [Google Scholar] [CrossRef]
  19. Strianese, M.; De Martino, F.; Pellecchia, C.; Ruggiero, G.; D’Auria, S. Myoglobin as a new fluorescence probe to sense H2S. Protein Pept. Lett. 2011, 18, 282–286. [Google Scholar] [CrossRef]
  20. Strianese, M.; Palm, G.J.; Milione, S.; Kuhl, O.; Hinrichs, W.; Pellecchia, C. A FRET enzyme-based probe for monitoring hydrogen sulfide. Inorg. Chem 2012, 51, 11220–11222. [Google Scholar] [CrossRef]
  21. Strianese, M.; Mirra, S.; Bertolasi, V.; Milione, S.; Pellecchia, C. Organometallic sulfur complexes: Reactivity of the hydrogen sulfide anion with cobaloximes. New J. Chem. 2015, 39, 4093–4099. [Google Scholar] [CrossRef]
  22. Strianese, M.; Lamberti, M.; Pellecchia, C. Chemically reversible binding of H2S to a zinc porphyrin complex: Towards implementation of a reversible sensor via a “coordinative-based approach”. Dalton Trans. 2017, 46, 1872–1877. [Google Scholar] [CrossRef] [PubMed]
  23. Strianese, M.; Mirra, S.; Lamberti, M.; Pellecchia, C. Zinc (II) porphyrins as viable scaffolds to stabilize hydrogen sulfide binding at the metal center. Inorg. Chim. Acta 2017, 466, 426–431. [Google Scholar] [CrossRef]
  24. Strianese, M.; Palm, G.J.; Kohlhause, D.; Ndamba, L.A.; Tabares, L.C.; Pellecchia, C. Azurin and HS-: Towards Implementation of a Sensor for HS- Detection. Eur. J. Inorg. Chem. 2019, 2019, 885–891. [Google Scholar] [CrossRef]
  25. Strianese, M.; Brenna, S.; Ardizzoia, G.; Guarnieri, D.; Lamberti, M.; D’Auria, I.; Pellecchia, C. Imidazo-pyridine-based zinc(II) complexes as fluorescent hydrogen sulfide probes. Dalton Trans. 2021, 50, 17075–17085. [Google Scholar] [CrossRef]
  26. Pluth, M.D.; Tonzetich, Z.J. Hydrosulfide complexes of the transition elements: Diverse roles in bioinorganic, cluster, coordination, and organometallic chemistry. Chem. Soc. Rev. 2020, 49, 4070–4134. [Google Scholar] [CrossRef]
  27. Hartle, M.D.; Tillotson, M.R.; Prell, J.S.; Pluth, M.D. Spectroscopic investigation of the reaction of metallo-protoporphyrins with hydrogen sulfide. J. Inorg. Biochem. 2017, 173, 152–157. [Google Scholar] [CrossRef]
  28. Hartle, M.D.; Sommer, S.K.; Dietrich, S.R.; Pluth, M.D. Chemically Reversible Reactions of Hydrogen Sulfide with Metal Phthalocyanines. Inorg. Chem. 2014, 53, 7800–7802. [Google Scholar] [CrossRef]
  29. Hartle, M.D.; Delgado, M.; Gilbertson, J.D.; Pluth, M.D. Stabilization of a Zn(II) hydrosulfido complex utilizing a hydrogen-bond accepting ligand. Chem. Commun. 2016, 52, 7680–7682. [Google Scholar] [CrossRef]
  30. Strianese, M.; Zauner, G.; Tepper, A.W.; Bubacco, L.; Breukink, E.; Aartsma, T.J.; Canters, G.W.; Tabares, L.C. A protein-based oxygen biosensor for high-throughput monitoring of cell growth and cell viability. Anal. Biochem. 2009, 385, 242–248. [Google Scholar] [CrossRef]
  31. Dulac, M.; Melet, A.; Galardon, E. Reversible Detection and Quantification of Hydrogen Sulfide by Fluorescence Using the Hemoglobin I from Lucina pectinata. ACS Sens. 2018, 3, 2138–2144. [Google Scholar] [CrossRef]
  32. Watanabe, K.; Suzuki, T.; Kitagishi, H.; Kano, K. Reaction between a haemoglobin model compound and hydrosulphide in aqueous solution. Chem. Commun. 2015, 51, 4059–4061. [Google Scholar] [CrossRef]
  33. Consiglio, G.; Failla, S.; Finocchiaro, P.; Oliveri, I.P.; Purrello, R.; Di Bella, S. Supramolecular Aggregation/Deaggregation in Amphiphilic Dipolar Schiff-Base Zinc(II) Complexes. Inorg. Chem. 2010, 49, 5134–5142. [Google Scholar] [CrossRef]
  34. Consiglio, G.; Failla, S.; Oliveri, I.P.; Purrello, R.; Di Bella, S. Controlling the molecular aggregation. An amphiphilic Schiff-base zinc(II) complex as supramolecular fluorescent probe. Dalton Trans. 2009, 47, 10426–10428. [Google Scholar] [CrossRef]
  35. Consiglio, G.; Failla, S.; Finocchiaro, P.; Oliveri, I.P.; Bella, S.D. Aggregation properties of bis(salicylaldiminato)zinc(II) Schiff-base complexes and their Lewis acidic character. Dalton Trans. 2012, 41, 387–395. [Google Scholar] [CrossRef]
  36. Consiglio, G.; Oliveri, I.P.; Failla, S.; Di Bella, S. On the Aggregation and Sensing Properties of Zinc(II) Schiff-Base Complexes of Salen-Type Ligands. Molecules 2019, 24, 2514. [Google Scholar] [CrossRef]
  37. Dumur, F.; Contal, E.; Wantz, G.; Gigmes, D. Photoluminescence of Zinc Complexes: Easily Tunable Optical Properties by Variation of the Bridge Between the Imido Groups of Schiff Base Ligands. Eur. J. Inorg. Chem. 2014, 2014, 4186–4198. [Google Scholar] [CrossRef]
  38. Xie, D.; Jing, J.; Cai, Y.B.; Tang, J.; Chen, J.J.; Zhang, J.L. Construction of an orthogonal ZnSalen/Salophen library as a colour palette for one- and two-photon live cell imaging. Chem. Sci. 2014, 5, 2318–2327. [Google Scholar] [CrossRef]
  39. Strianese, M.; Lamberti, M.; Pellecchia, C. Interaction of monohydrogensulfide with a family of fluorescent pyridoxal-based Zn(ii) receptors. Dalton Trans. 2018, 47, 17392–17400. [Google Scholar] [CrossRef]
  40. Strianese, M.; Lamberti, M.; Persico, A.; Pellecchia, C. Reactivity of monohydrogensulfide with a suite of pyridoxal-based complexes: A combined NMR, ESI-MS, UV-visible and fluorescence study. Inorg. Chim. Acta 2019, 501, 119235. [Google Scholar] [CrossRef]
  41. Strianese, M.; Guarnieri, D.; Lamberti, M.; Landi, A.; Peluso, A.; Pellecchia, C. Fluorescent salen-type Zn(II) Complexes As Probes for Detecting Hydrogen Sulfide and Its Anion: Bioimaging Applications. Inorg. Chem. 2020, 59, 15977–15986. [Google Scholar] [CrossRef]
  42. Strianese, M.; Vykhovanets, V.; Blal, N.; Guarnieri, D.; Landi, A.; Lamberti, M.; Peluso, A.; Pellecchia, C. Paper-Strip-Based Sensors for H2S Detection: A Proof-of-Principle Study. Sensors 2022, 22, 3173. [Google Scholar] [CrossRef] [PubMed]
  43. Strianese, M.; D’Auria, G.J.; Lamberti, M.; Landi, A.; Peluso, A.; Varriale, A.; D’Auria, S.; Pellecchia, C. Salen, salan and salalen zinc(ii) complexes in the interaction with HS-: Time-resolved fluorescence applications. Dalton Trans. 2023, 52, 1357–1365. [Google Scholar] [CrossRef]
  44. Strianese, M.; Pellecchia, C. Fluorescent Probes for H2S Detection: Metal-Based Approaches. In Hydrogen Sulfide; Wiley: Hoboken, NJ, USA, 2022; pp. 203–233. [Google Scholar]
  45. Ellerby, L.M.; Nishida, C.R.; Nishida, F.; Yamanaka, S.A.; Dunn, B.; Valentine, J.S.; Zink, J.I. Encapsulation of proteins in transparent porous silicate glasses prepared by the sol-gel method. Science 1992, 255, 1113–1115. [Google Scholar] [CrossRef] [PubMed]
  46. Lakowicz, J.R. Principles of Fluorescence Spectroscopy; Springer: New York, NY, USA, 2006. [Google Scholar]
  47. Frisch, M.J.; Trucks, G.W.; Schlegel, H.B.; Scuseria, G.E.; Robb, M.A.; Cheeseman, J.R.; Scalmani, G.; Barone, V.; Petersson, G.A.; Nakatsuji, H.; et al. Gaussian 09, Revision A.03; Gaussian Inc.: Wallingford, CT, USA, 2016. [Google Scholar]
  48. Cramer, C.J.; Truhlar, D.G. Density functional theory for transition metals and transition metal chemistry. Phys. Chem. Chem. Phys. 2009, 11, 10757–10816. [Google Scholar] [CrossRef] [PubMed]
  49. Gao, X.; Bai, S.; Fazzi, D.; Niehaus, T.; Barbatti, M.; Thiel, W. Evaluation of Spin-Orbit Couplings with Linear-Response Time-Dependent Density Functional Methods. J. Chem. Theory Comput. 2017, 13, 515–524. [Google Scholar] [CrossRef] [PubMed]
  50. Velardo, A.; Borrelli, R.; Capobianco, A.; Landi, A.; Peluso, A. Disentangling Electronic and Vibrational Effects in the Prediction of Band Shapes for Singlet-Triplet Transitions. J. Phys. Chem. C 2019, 123, 14173–14179. [Google Scholar] [CrossRef]
  51. Landi, A.; Capobianco, A.; Peluso, A. Coherent Effects in Charge Transport in Molecular Wires: Toward a Unifying Picture of Long-Range Hole Transfer in DNA. J. Phys. Chem. Lett. 2020, 11, 7769–7775. [Google Scholar] [CrossRef]
  52. Miertus, S.; Scrocco, E.; Tomasi, J. Electrostatic interaction of a solute with a continuum. A direct utilizaion of AB initio molecular potentials for the prevision of solvent effects. Chem. Phys 1981, 55, 117–129. [Google Scholar] [CrossRef]
  53. La Cort, A.; Mandolini, L.; Pasquini, C.; Rissanen, K.; Russo, L.; Schiaffino, L. Zinc-salophen complexes as selective receptors for tertiary amines. New J. Chem. 2007, 31, 1633–1638. [Google Scholar] [CrossRef]
  54. Furne, J.; Saeed, A.; Levitt, M.D. Whole tissue hydrogen sulfide concentrations are orders of magnitude lower than presently accepted values. Am. J. Physiol. Regul. Integr. Comp. Physiol. 2008, 295, R1479–R1485. [Google Scholar] [CrossRef]
  55. Sanokawa-Akakura, R.; Ostrakhovitch, E.A.; Akakura, S.; Goodwin, S.; Tabibzadeh, S. A H2S-Nampt Dependent Energetic Circuit Is Critical to Survival and Cytoprotection from Damage in Cancer Cells. PLoS ONE 2014, 9, e108537. [Google Scholar] [CrossRef]
  56. Rombach, M.; Vahrenkamp, H. Pyrazolylborate-Zinc-Hydrosulfide Complexes and Their Reactions. Inorg. Chem. 2001, 40, 6144–6150. [Google Scholar] [CrossRef]
  57. Capobianco, A.; Borrelli, R.; Landi, A.; Velardo, A.; Peluso, A. Absorption Band Shapes of a Push-Pull Dye Approaching the Cyanine Limit: A Challenging Case for First Principle Calculations. J. Phys. Chem. A 2016, 120, 5581–5589. [Google Scholar] [CrossRef]
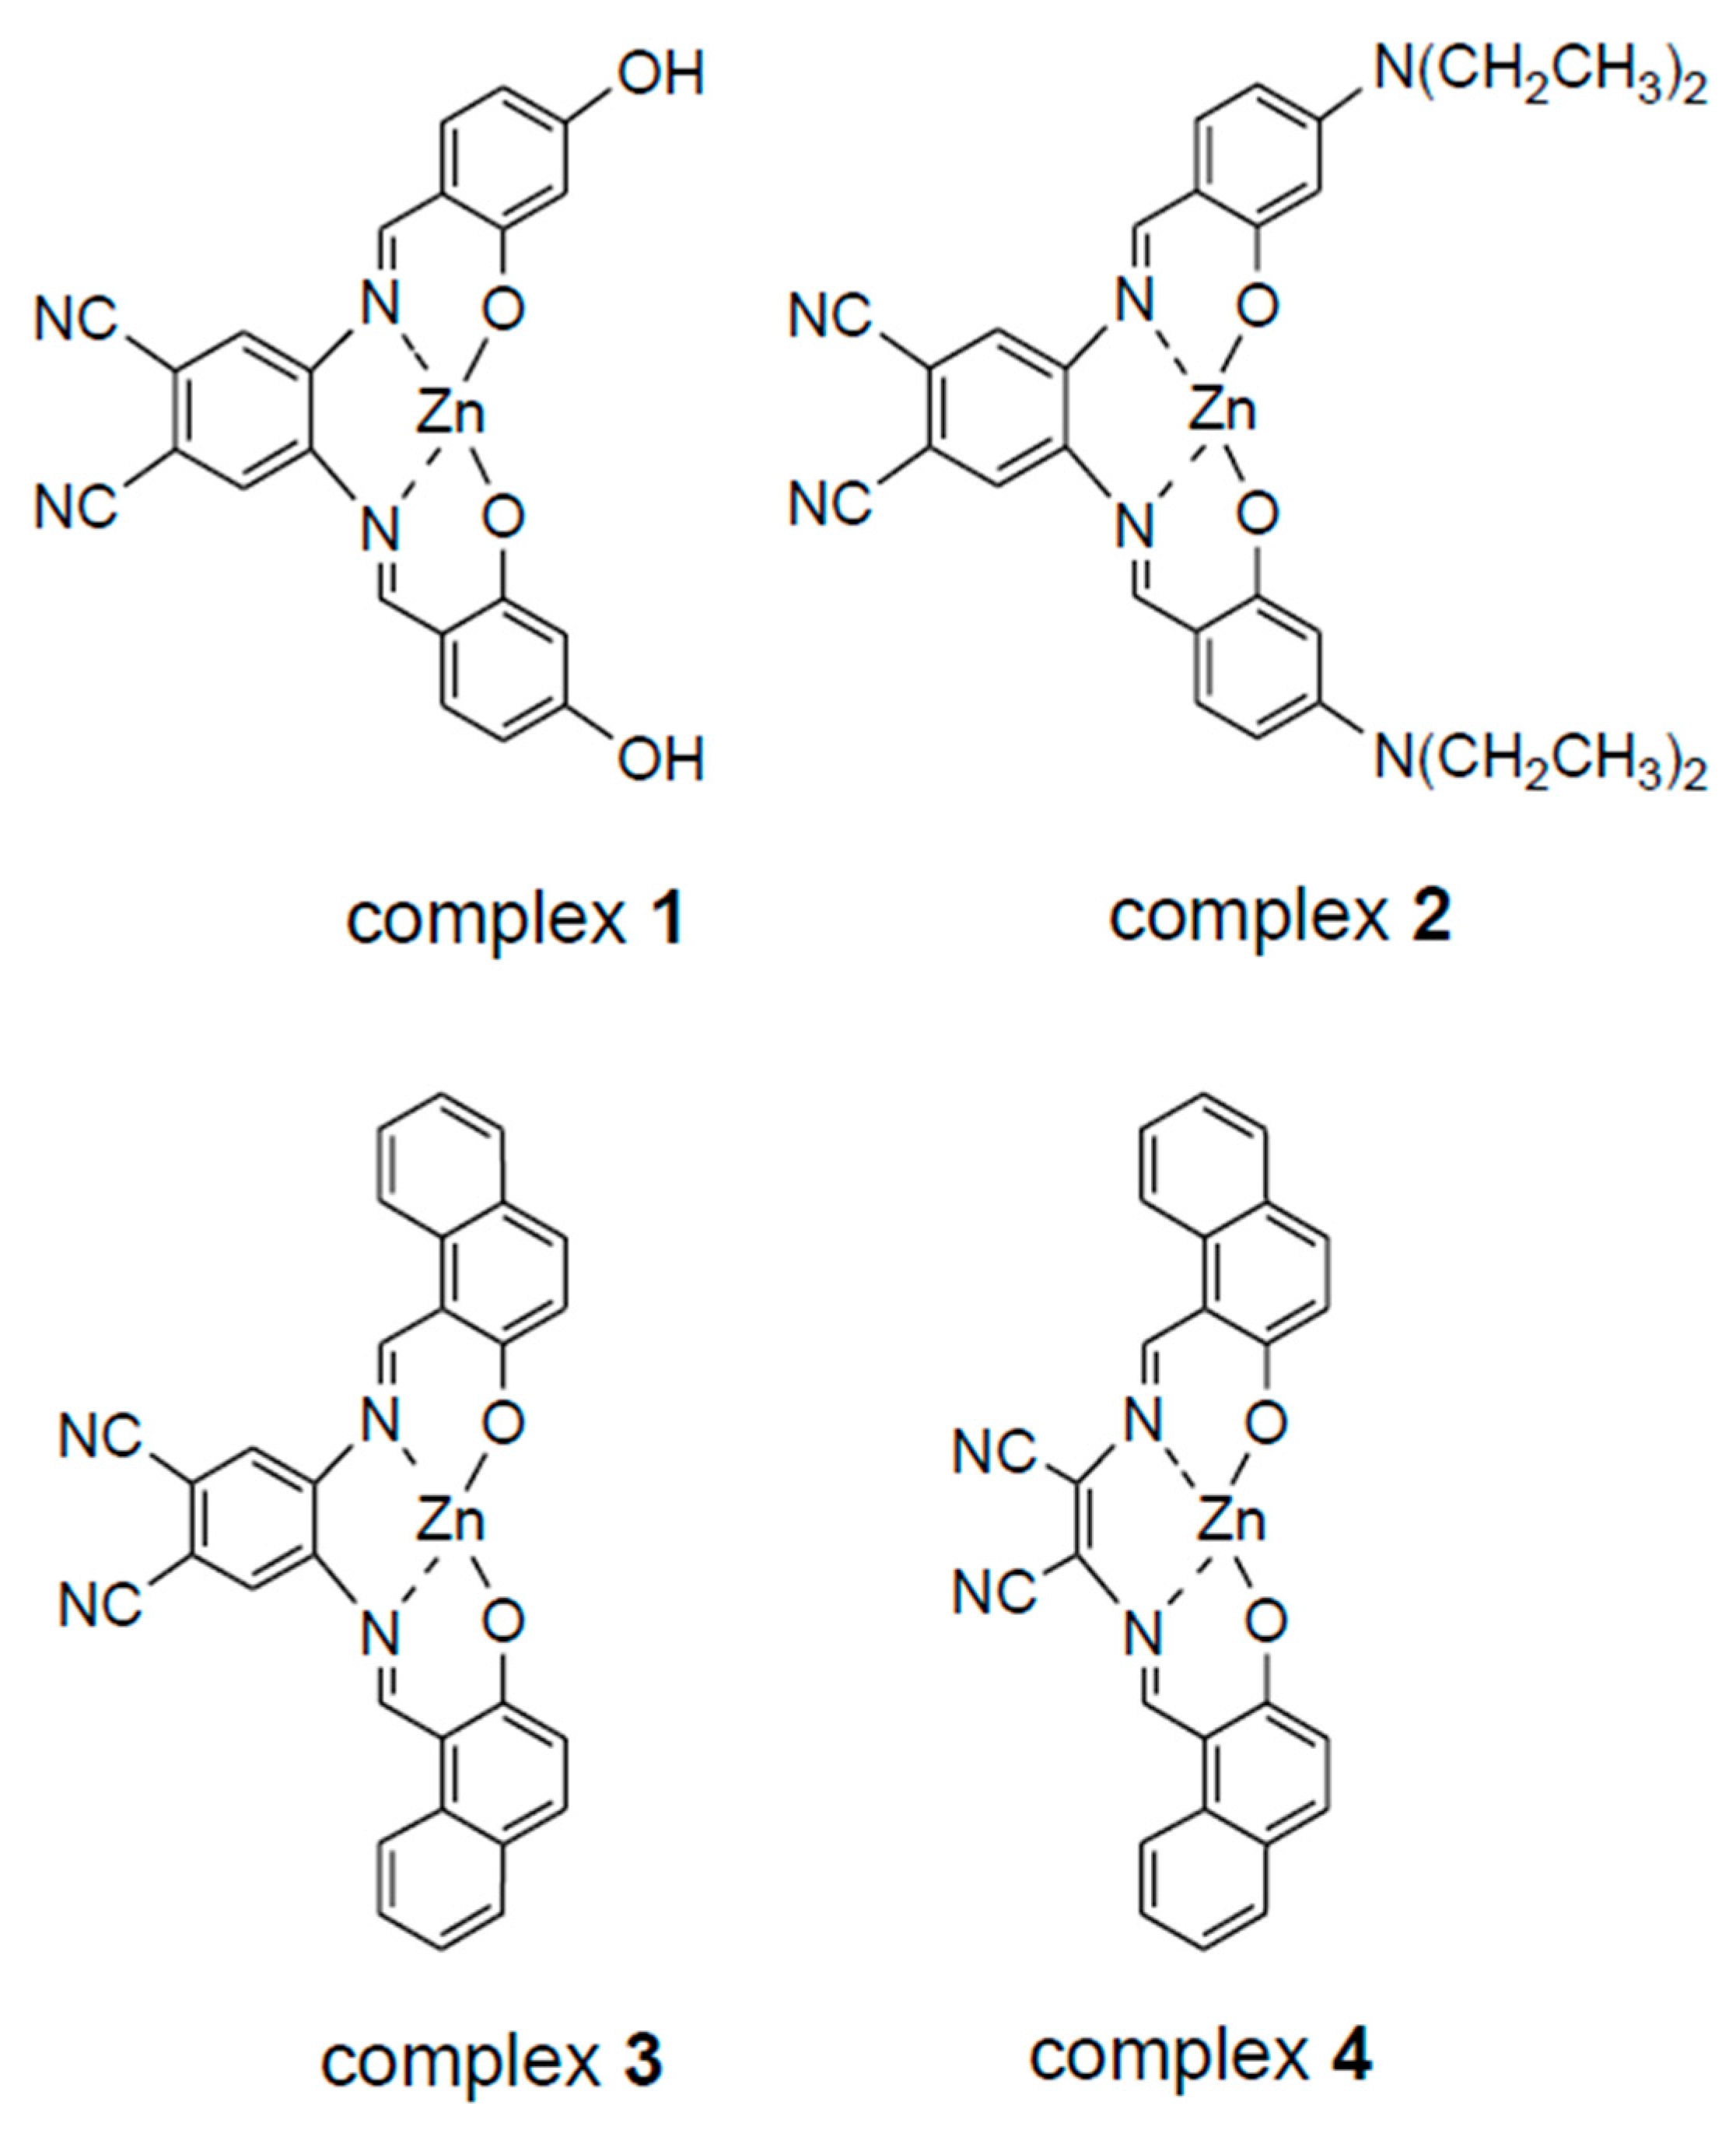
Scheme 1. Structures of the complexes studied in this work.
Sensors 23 02023 sch001
Figure 1. Electronic absorption spectra of complexes 14 with and without the addition of 50 µM of NaSH. Spectra were recorded in DMSO at room temperature. [complexes] = 10 µM.
Sensors 23 02023 g001
Figure 2. Emission spectra of complexes 14 before and after the addition of 5 equiv of NaSH. [Complexes 14] = 1 × 10⁻⁵ M; [NaSH] = 5 × 10⁻⁵ M. All spectra were measured in DMSO with λexc = 481 nm for complex 1; λexc = 513 nm for complex 2; λexc = 516 nm for complex 3; λexc = 598 nm for complex 4.
Sensors 23 02023 g002
Figure 3. Emission spectrum of complex 1ex = 481 nm; λem = 550 nm), upon addition of 5 equiv of NaSH and upon addition of 10 equiv of acetic acid. [Complex 1] = 1 × 10⁻⁵ M; [NaSH] = 5 × 10⁻⁵ M. Spectrum was measured in DMSO.
Sensors 23 02023 g003
Figure 4. (Left) Emission spectra of complex 1exc = 481 nm) when titrated with NaSH. [Complex 1] = 1 × 10⁻⁵ M; end concentration of NaSH varied in the range (1−5) × 10−5 M. (Right) The fluorescence intensity values of complex 1 at 565 nm have been plotted as a function of the HS concentration.
Sensors 23 02023 g004
Figure 5. Structure of a model complex.
Sensors 23 02023 g005
Figure 6. Real color images of a cropped area of the model complex—reported in Figure 5—(a) and complex 1 (b) loaded in sol-gel matrices after adding increasing amounts of HS dissolved in H2O (0, 1.78, and 10 mM). Non-treated matrices are indicated as FREE.
Sensors 23 02023 g006
Figure 7. Real color images of a cropped area of the model complex—reported in Figure 5—(a) and complex 1 (b) loaded in sol-gel matrices after adding increasing amounts of HS dissolved in HBSS (0, 17.8 µM, 178 µM, and 1.78 mM). Non-treated matrices are indicated as FREE.
Sensors 23 02023 g007
Figure 8. Real color images of a cropped area of the model complex—reported in Figure 5—(a) and complex 1 (b) loaded in sol-gel matrices after adding cell-conditioned HBSS media. Matrices treated with non-conditioned HBSS (HBSS); non-conditioned medium +800 µM H2O2 (HBSS+ H2O2); cell-conditioned HBSS (Cond. HBSS); and cell-conditioned HBSS after 1 h treatment of the HepG2 cells with 800 µM H2O2 (Cond. HBSS+ H2O2).
Sensors 23 02023 g008
Figure 9. Optimized geometries for complex 1 (left) and its adduct with HS (right).
Sensors 23 02023 g009
Figure 10. Computed energies (E, eV) of the ground state (S0) first excited singlet (S1), and four lowest energy triplet states, evaluated at the S0 geometry for complex 1 and complex 4, and their HS adducts.
Sensors 23 02023 g010
Table 1. Computed vertical and adiabatic excitation energies (eV) and oscillator strength for the S1 ← S0 transitions.
VerticalAdiabaticOscillator Strength
13.222.640.57
1 + HS3.132.670.42
42.612.210.96
4 + HS2.422.110.80
Table 2. Spin-Orbit coupling elements (cm−1) for complex 1, complex 4 and their adducts.
SOC T2-S1SOC T3-S1SOC T4-S1
11.2310.014.1
1 + HS45.029.210.5
416.598455.069332.80429
4 + HS95.824071.5
Disclaimer/Publisher’s Note: The statements, opinions and data contained in all publications are solely those of the individual author(s) and contributor(s) and not of MDPI and/or the editor(s). MDPI and/or the editor(s) disclaim responsibility for any injury to people or property resulting from any ideas, methods, instructions or products referred to in the content.