
Infrared Small Target Detection Based on Multiscale Kurtosis Map Fusion and Optical Flow Method


Abstract
:1. Introduction
1.1. Single-Frame Infrared Small Target Detection
1.1.1. Filter-Based Detection Method
1.1.2. Morphology-Based Detection Methods
1.1.3. Human Visual System (HVS) Methods
1.1.4. Low-Rank Sparse Detection Method
1.1.5. Gray Distribution-Based Methods
1.2. Multiframe Infrared Small Target Detection
1.3. The Detection Method of Deep Learning
1.4. Motivation
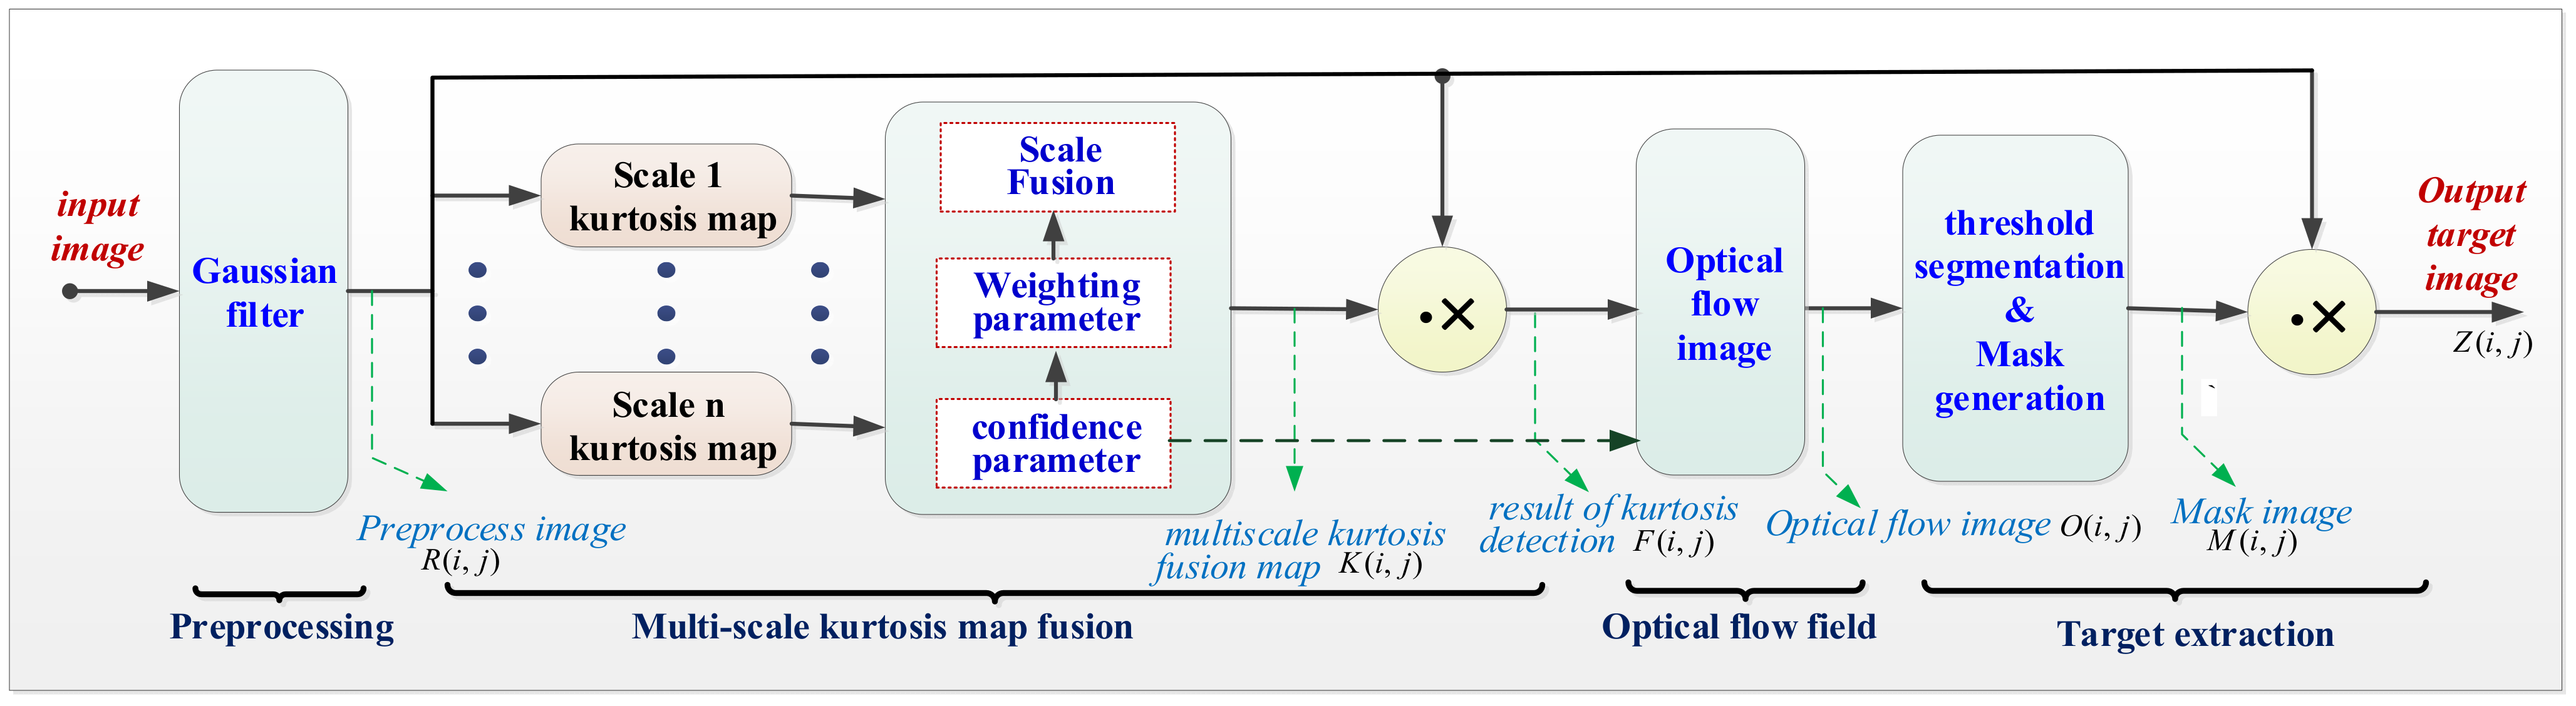
2. Proposed Method
2.1. Preprocessing
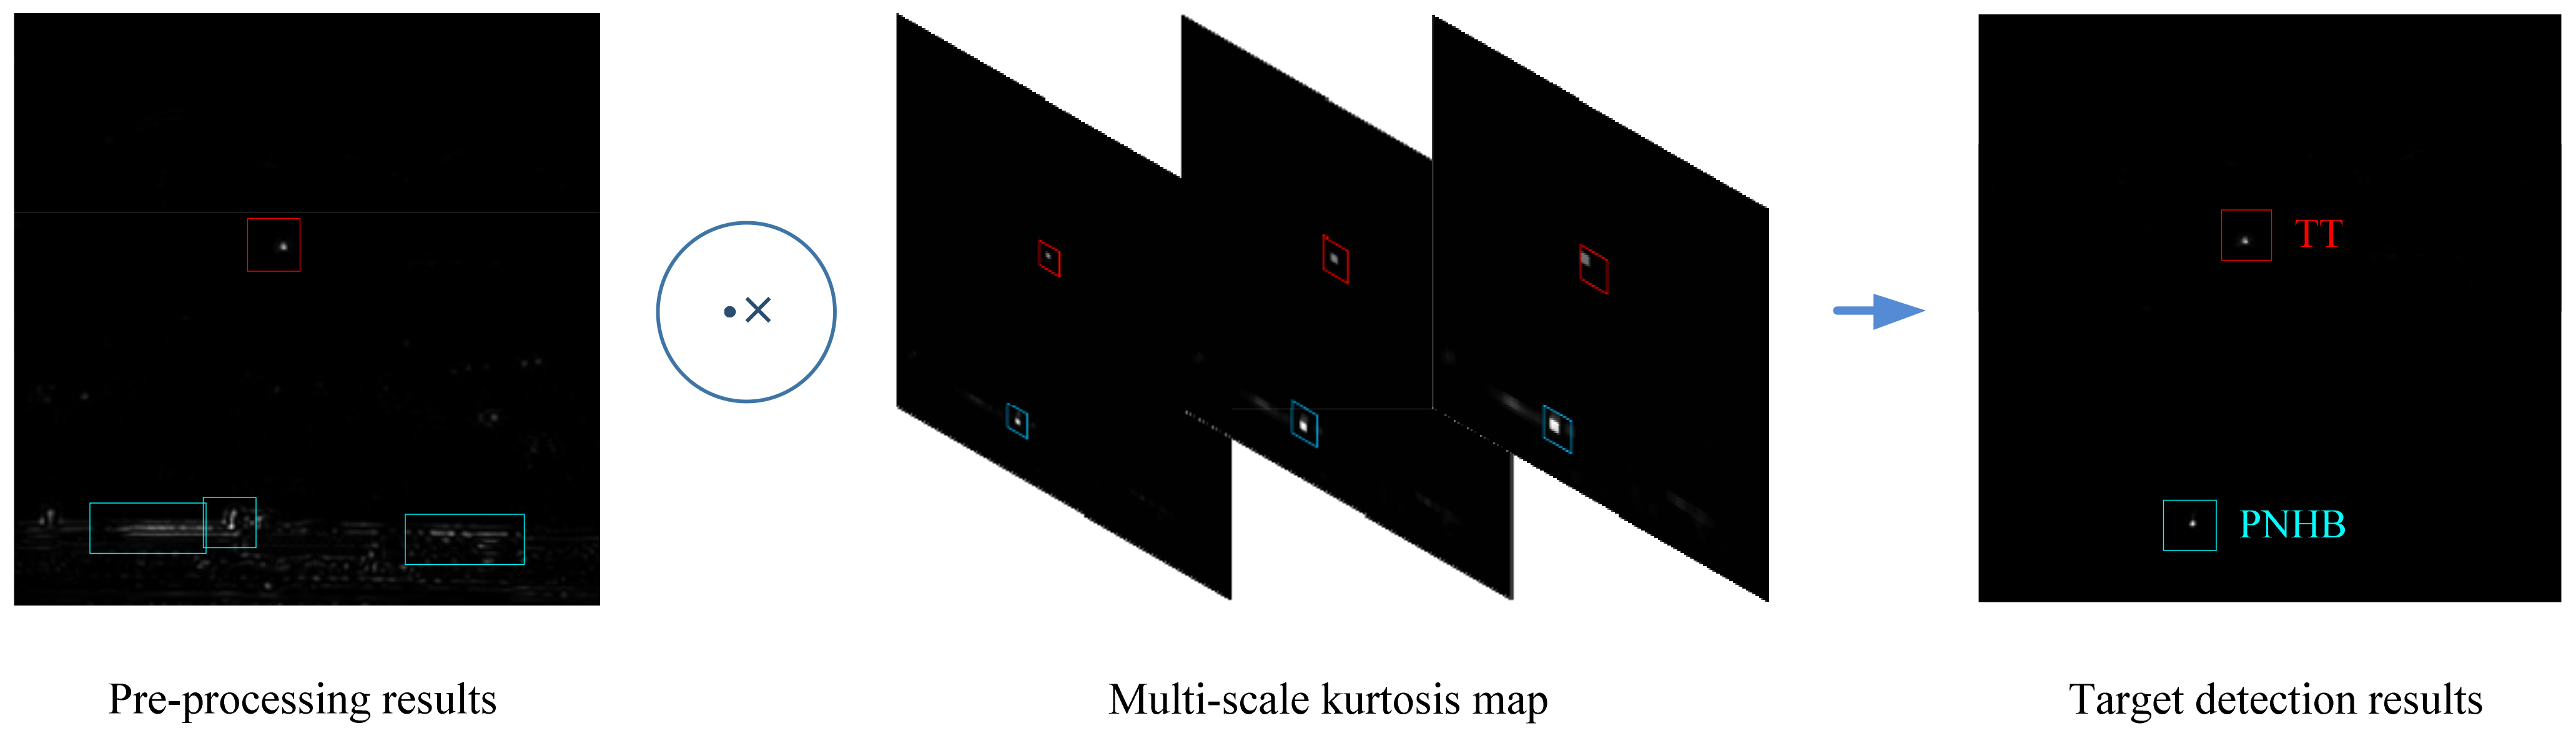
2.2. Multiscale Kurtosis Map Fusion
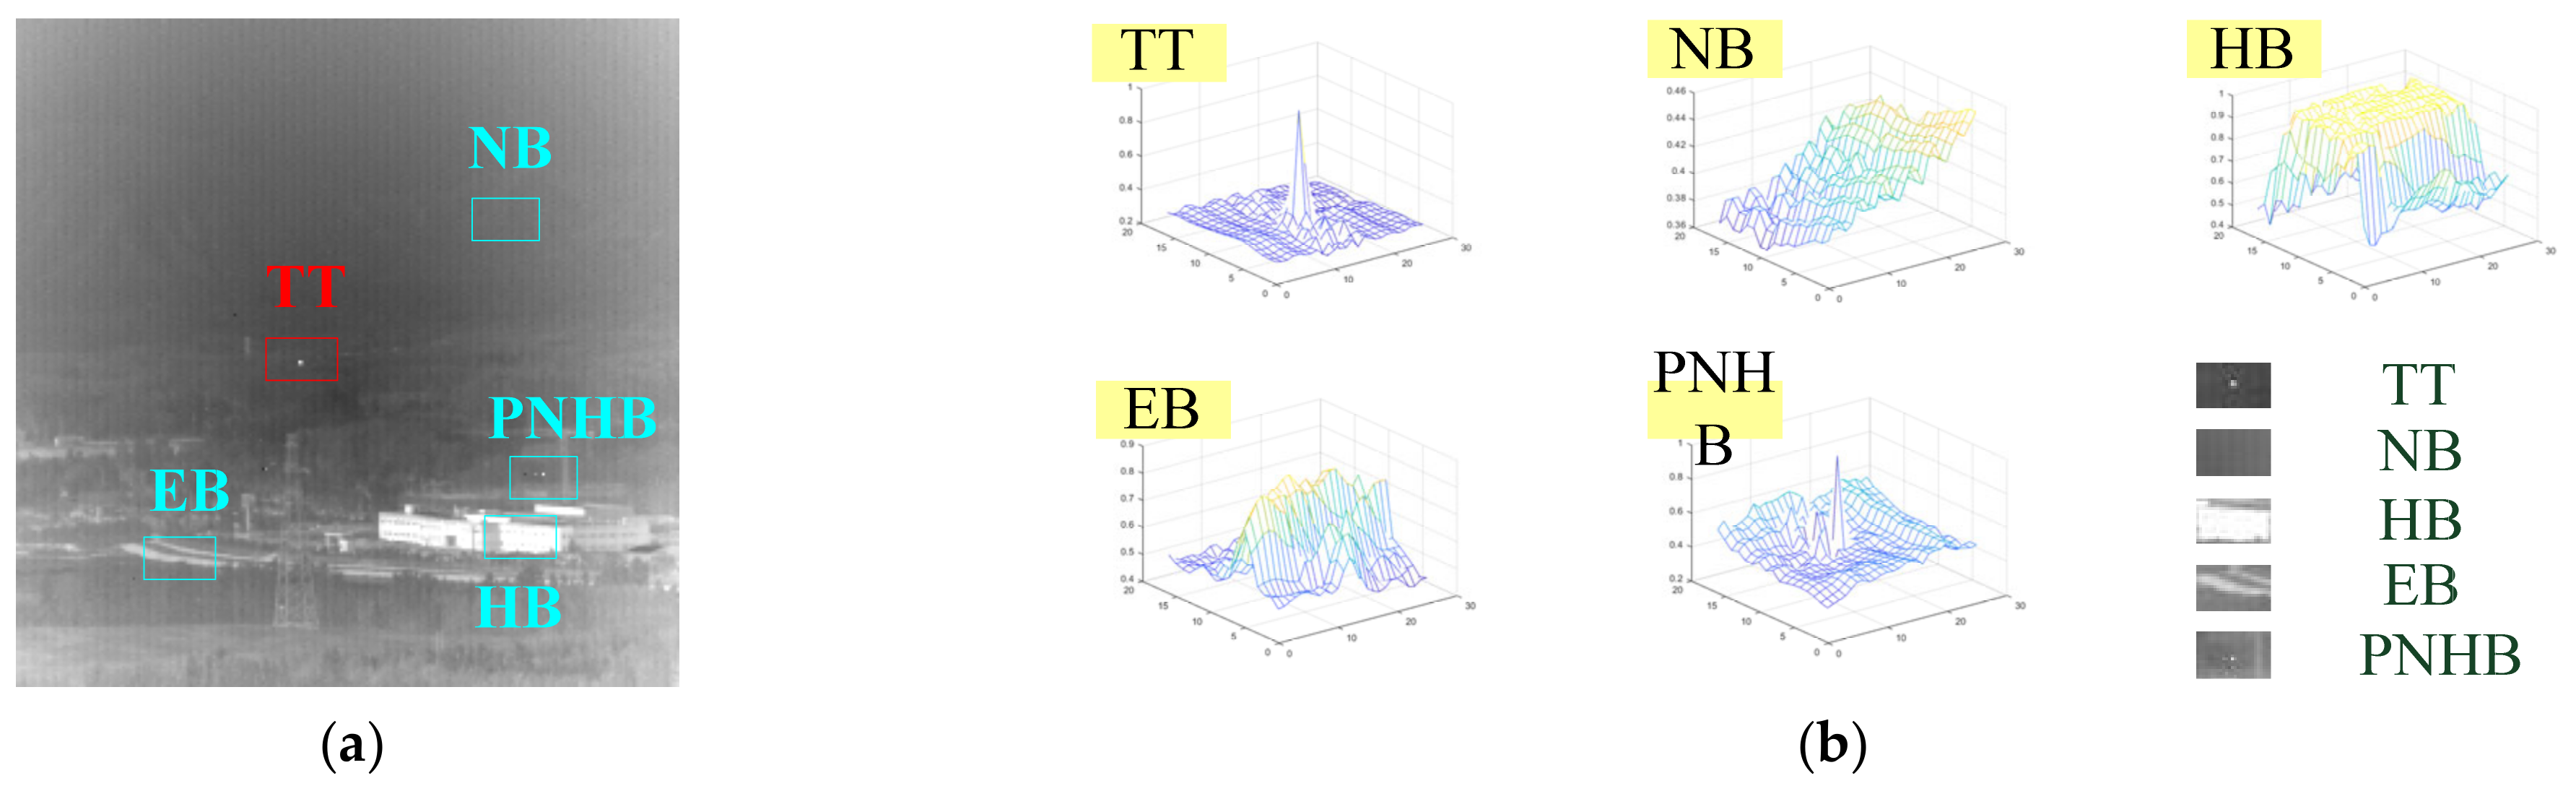
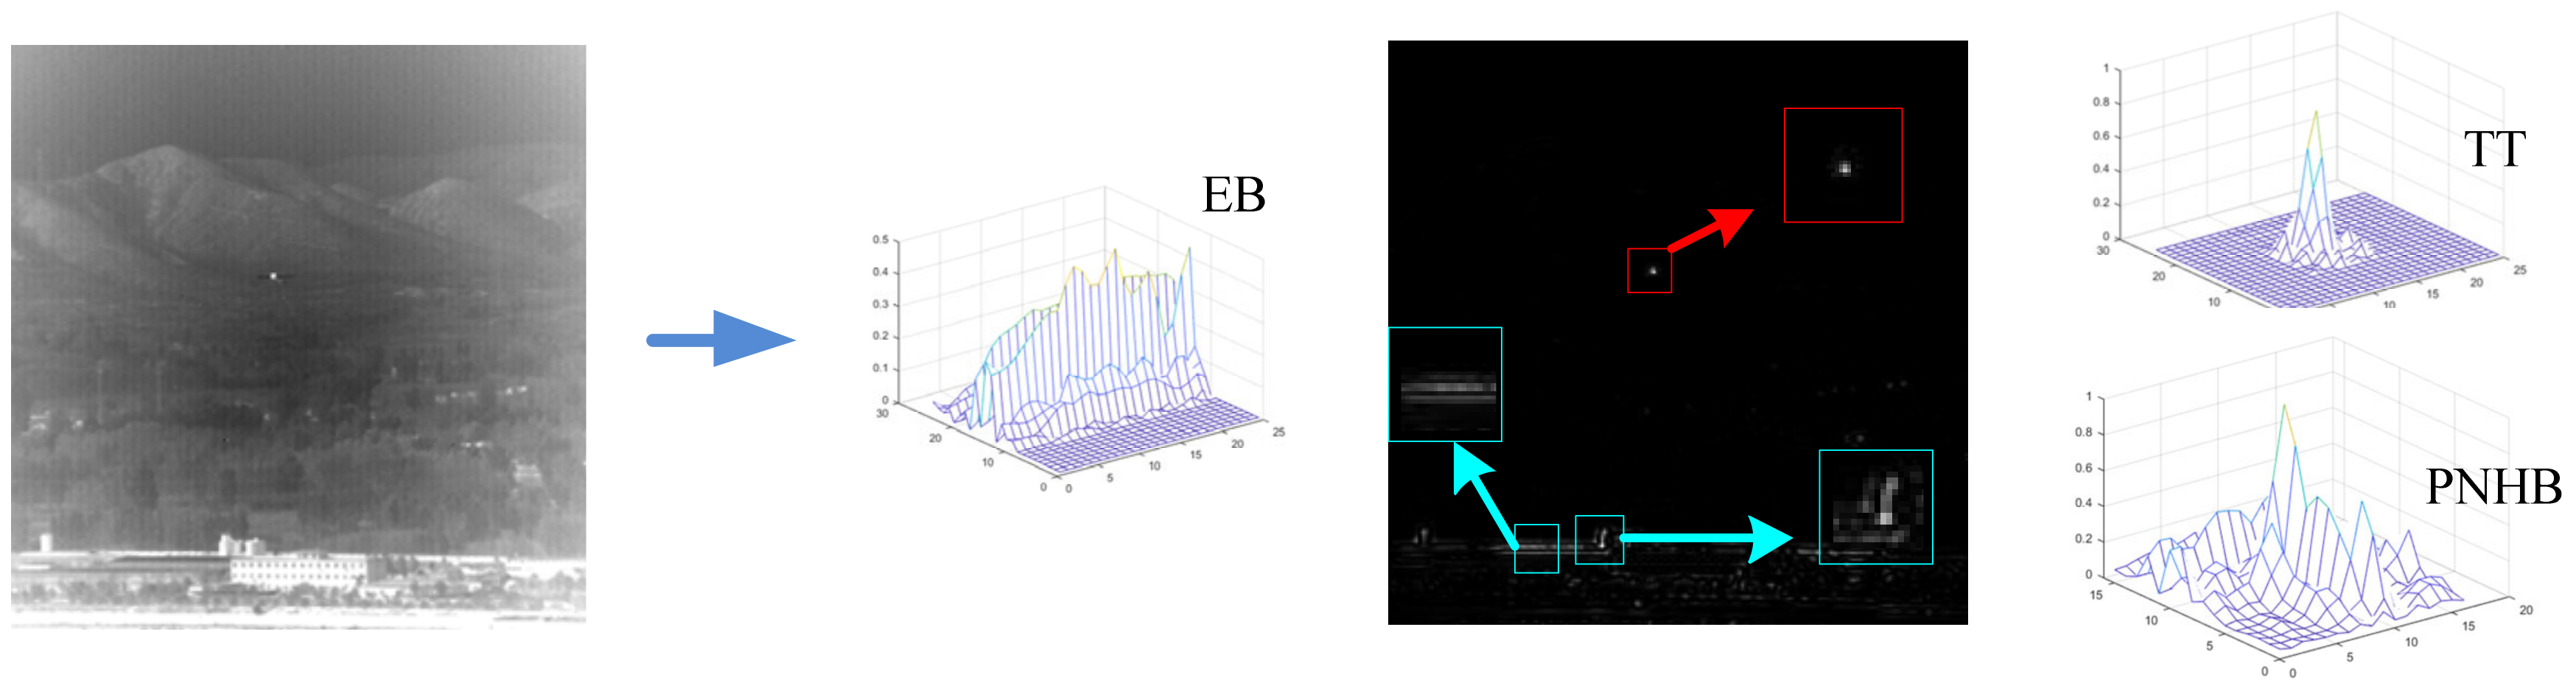
2.2.1. Kurtosis and Kurtosis Map
| Algorithm 1 The Computational Steps of the Kurtosis Map |
Input: initial infrared image
size ; window , size
|
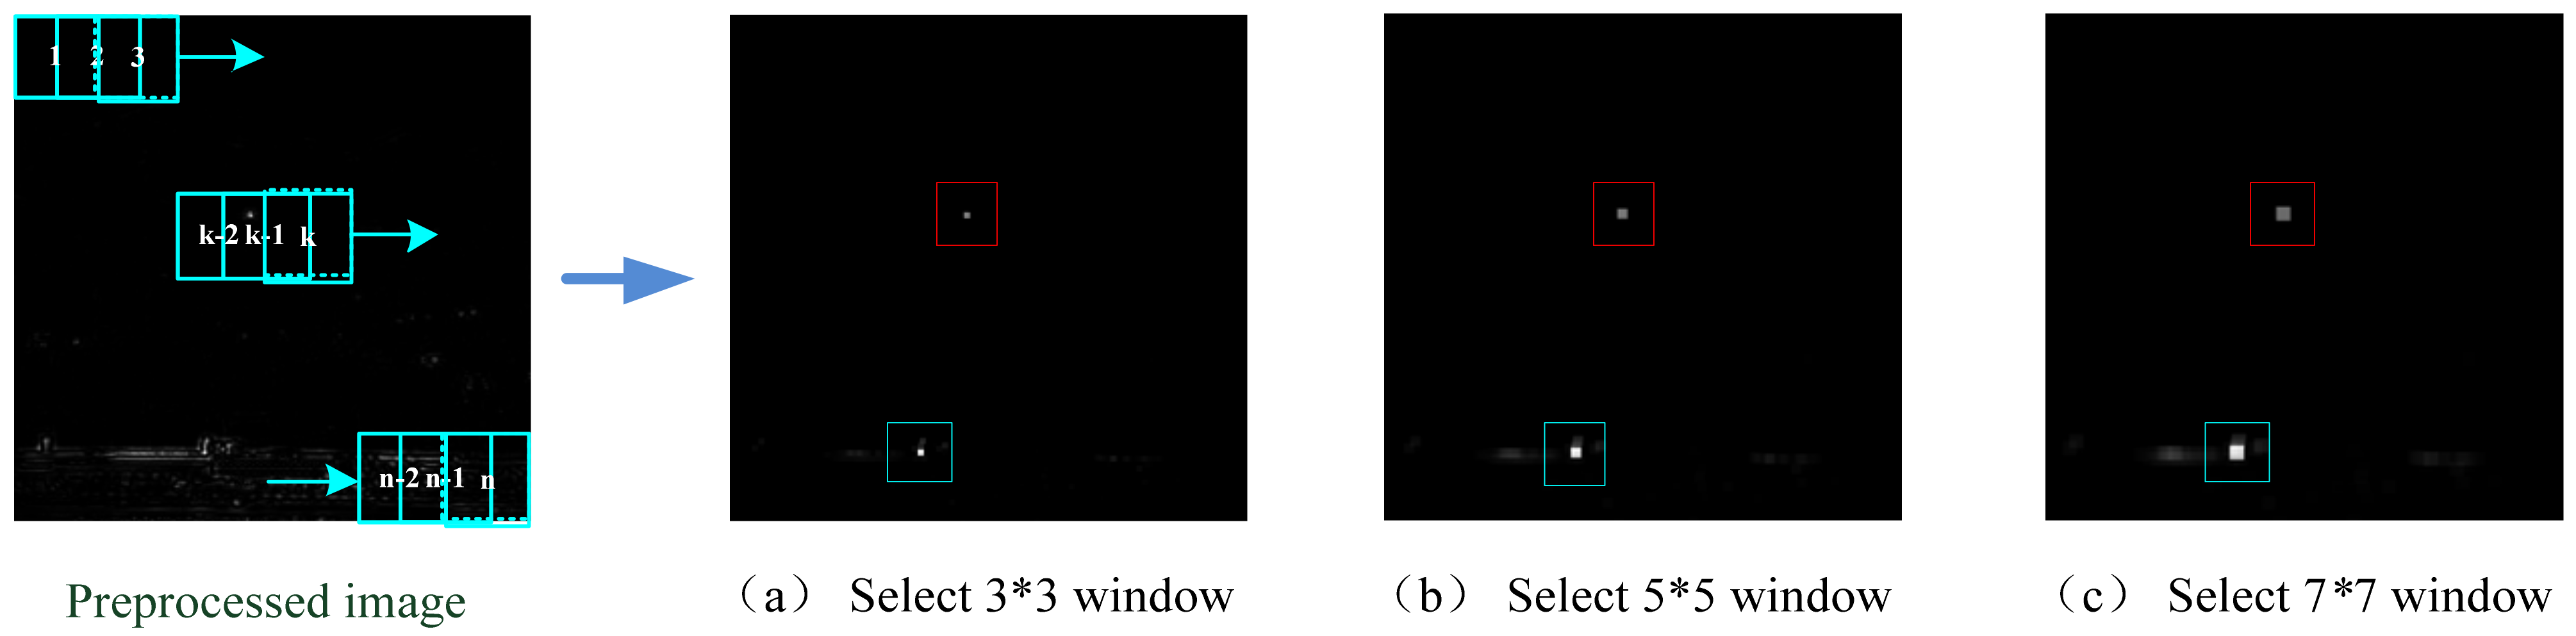
2.2.2. Multiscale Kurtosis Map Fusion
| Algorithm 2 Multiscale Kurtosis Map Fusion |
| Input: infrared image I, size ; Multi-scale kurtosis map ; For i = 1:M do;For j = 1: N do; Calculate confidence parameter , Formula (4); Fusion multiscale kurtosis maps , Formula (5); Dot multiply to obtain output image End for; End for; Output: coarse target image of multiscale kurtosis fusion . |
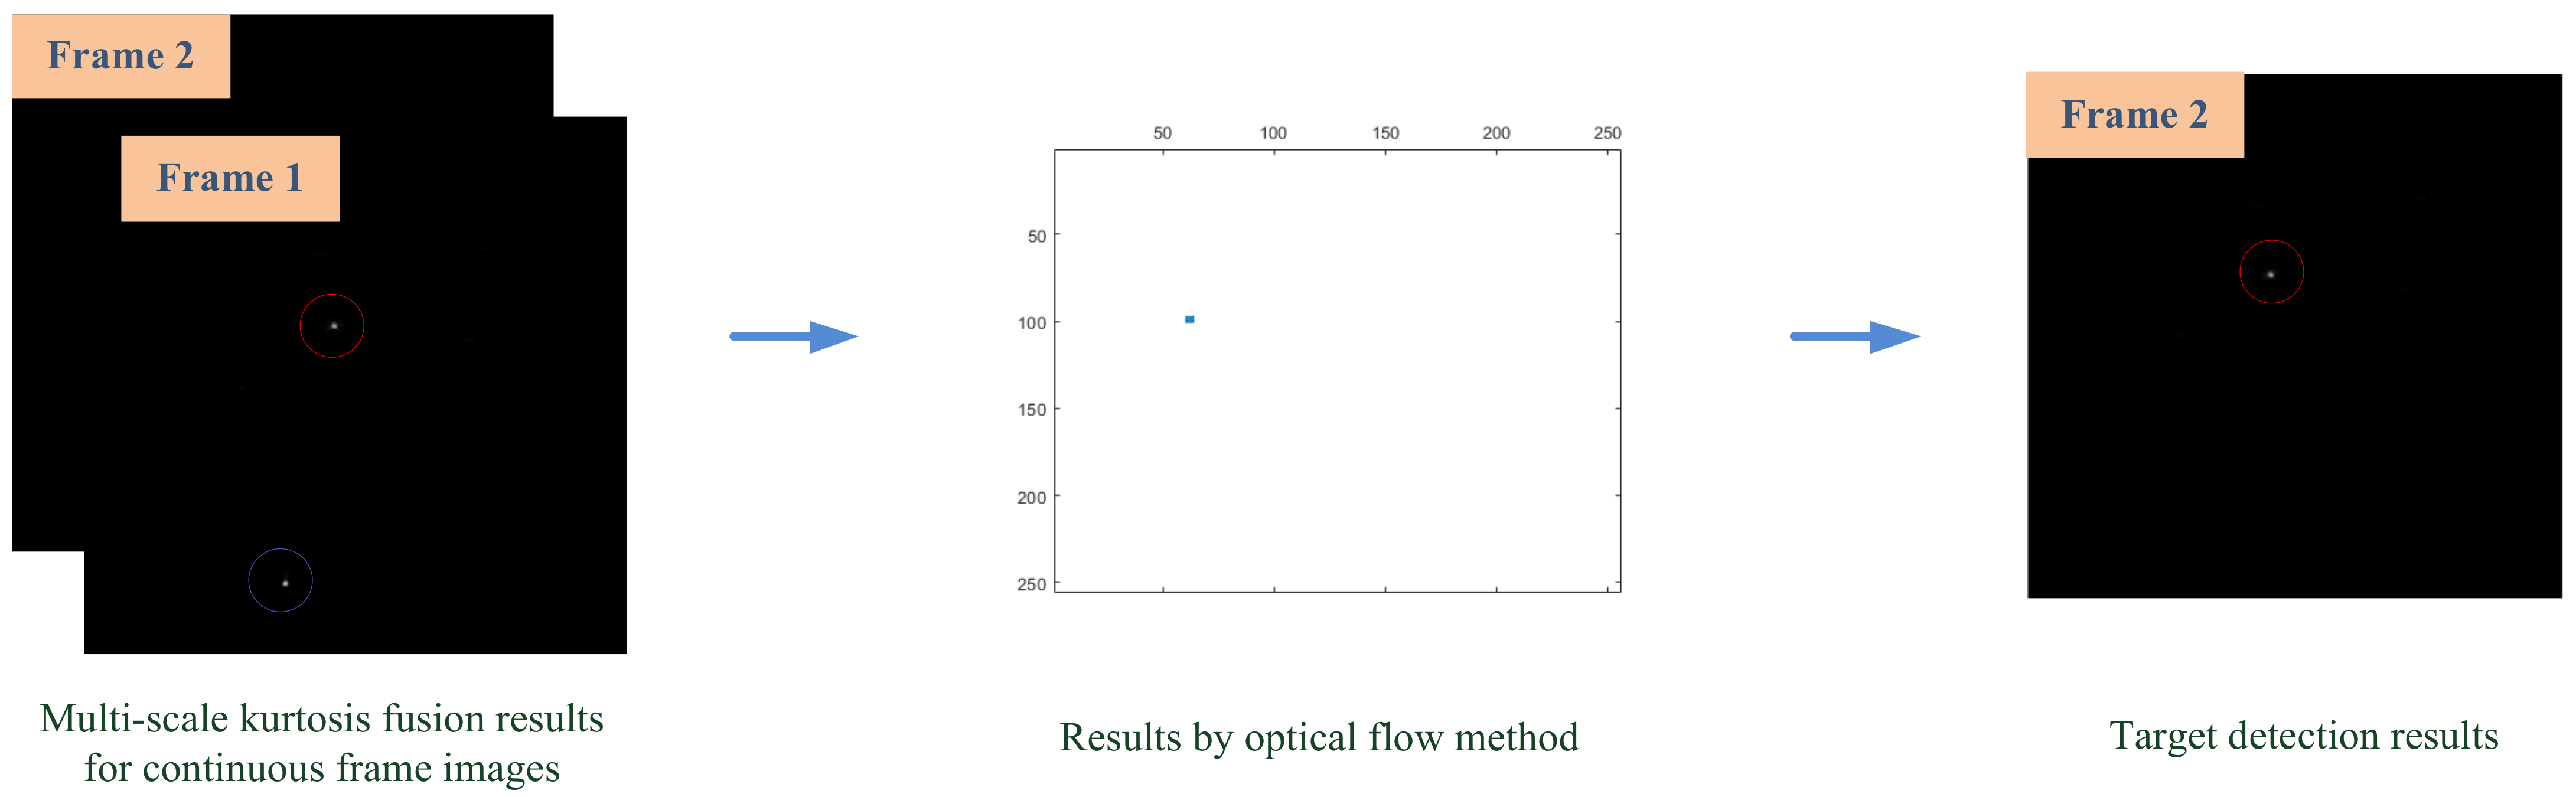
2.3. Optical Flow Method
- Assumption 1: the pixel intensities do not change between consecutive frames.
- Assumption 2: neighboring pixels have a motion similar to that of the central pixel.
- Assumption 3: the pixels have subpixel motion, which means they move less than 1 pixel between two consecutive frames.
2.4. Target Extraction
3. Experiments and Analysis
3.1. Datasets
3.2. Evaluation Indicators
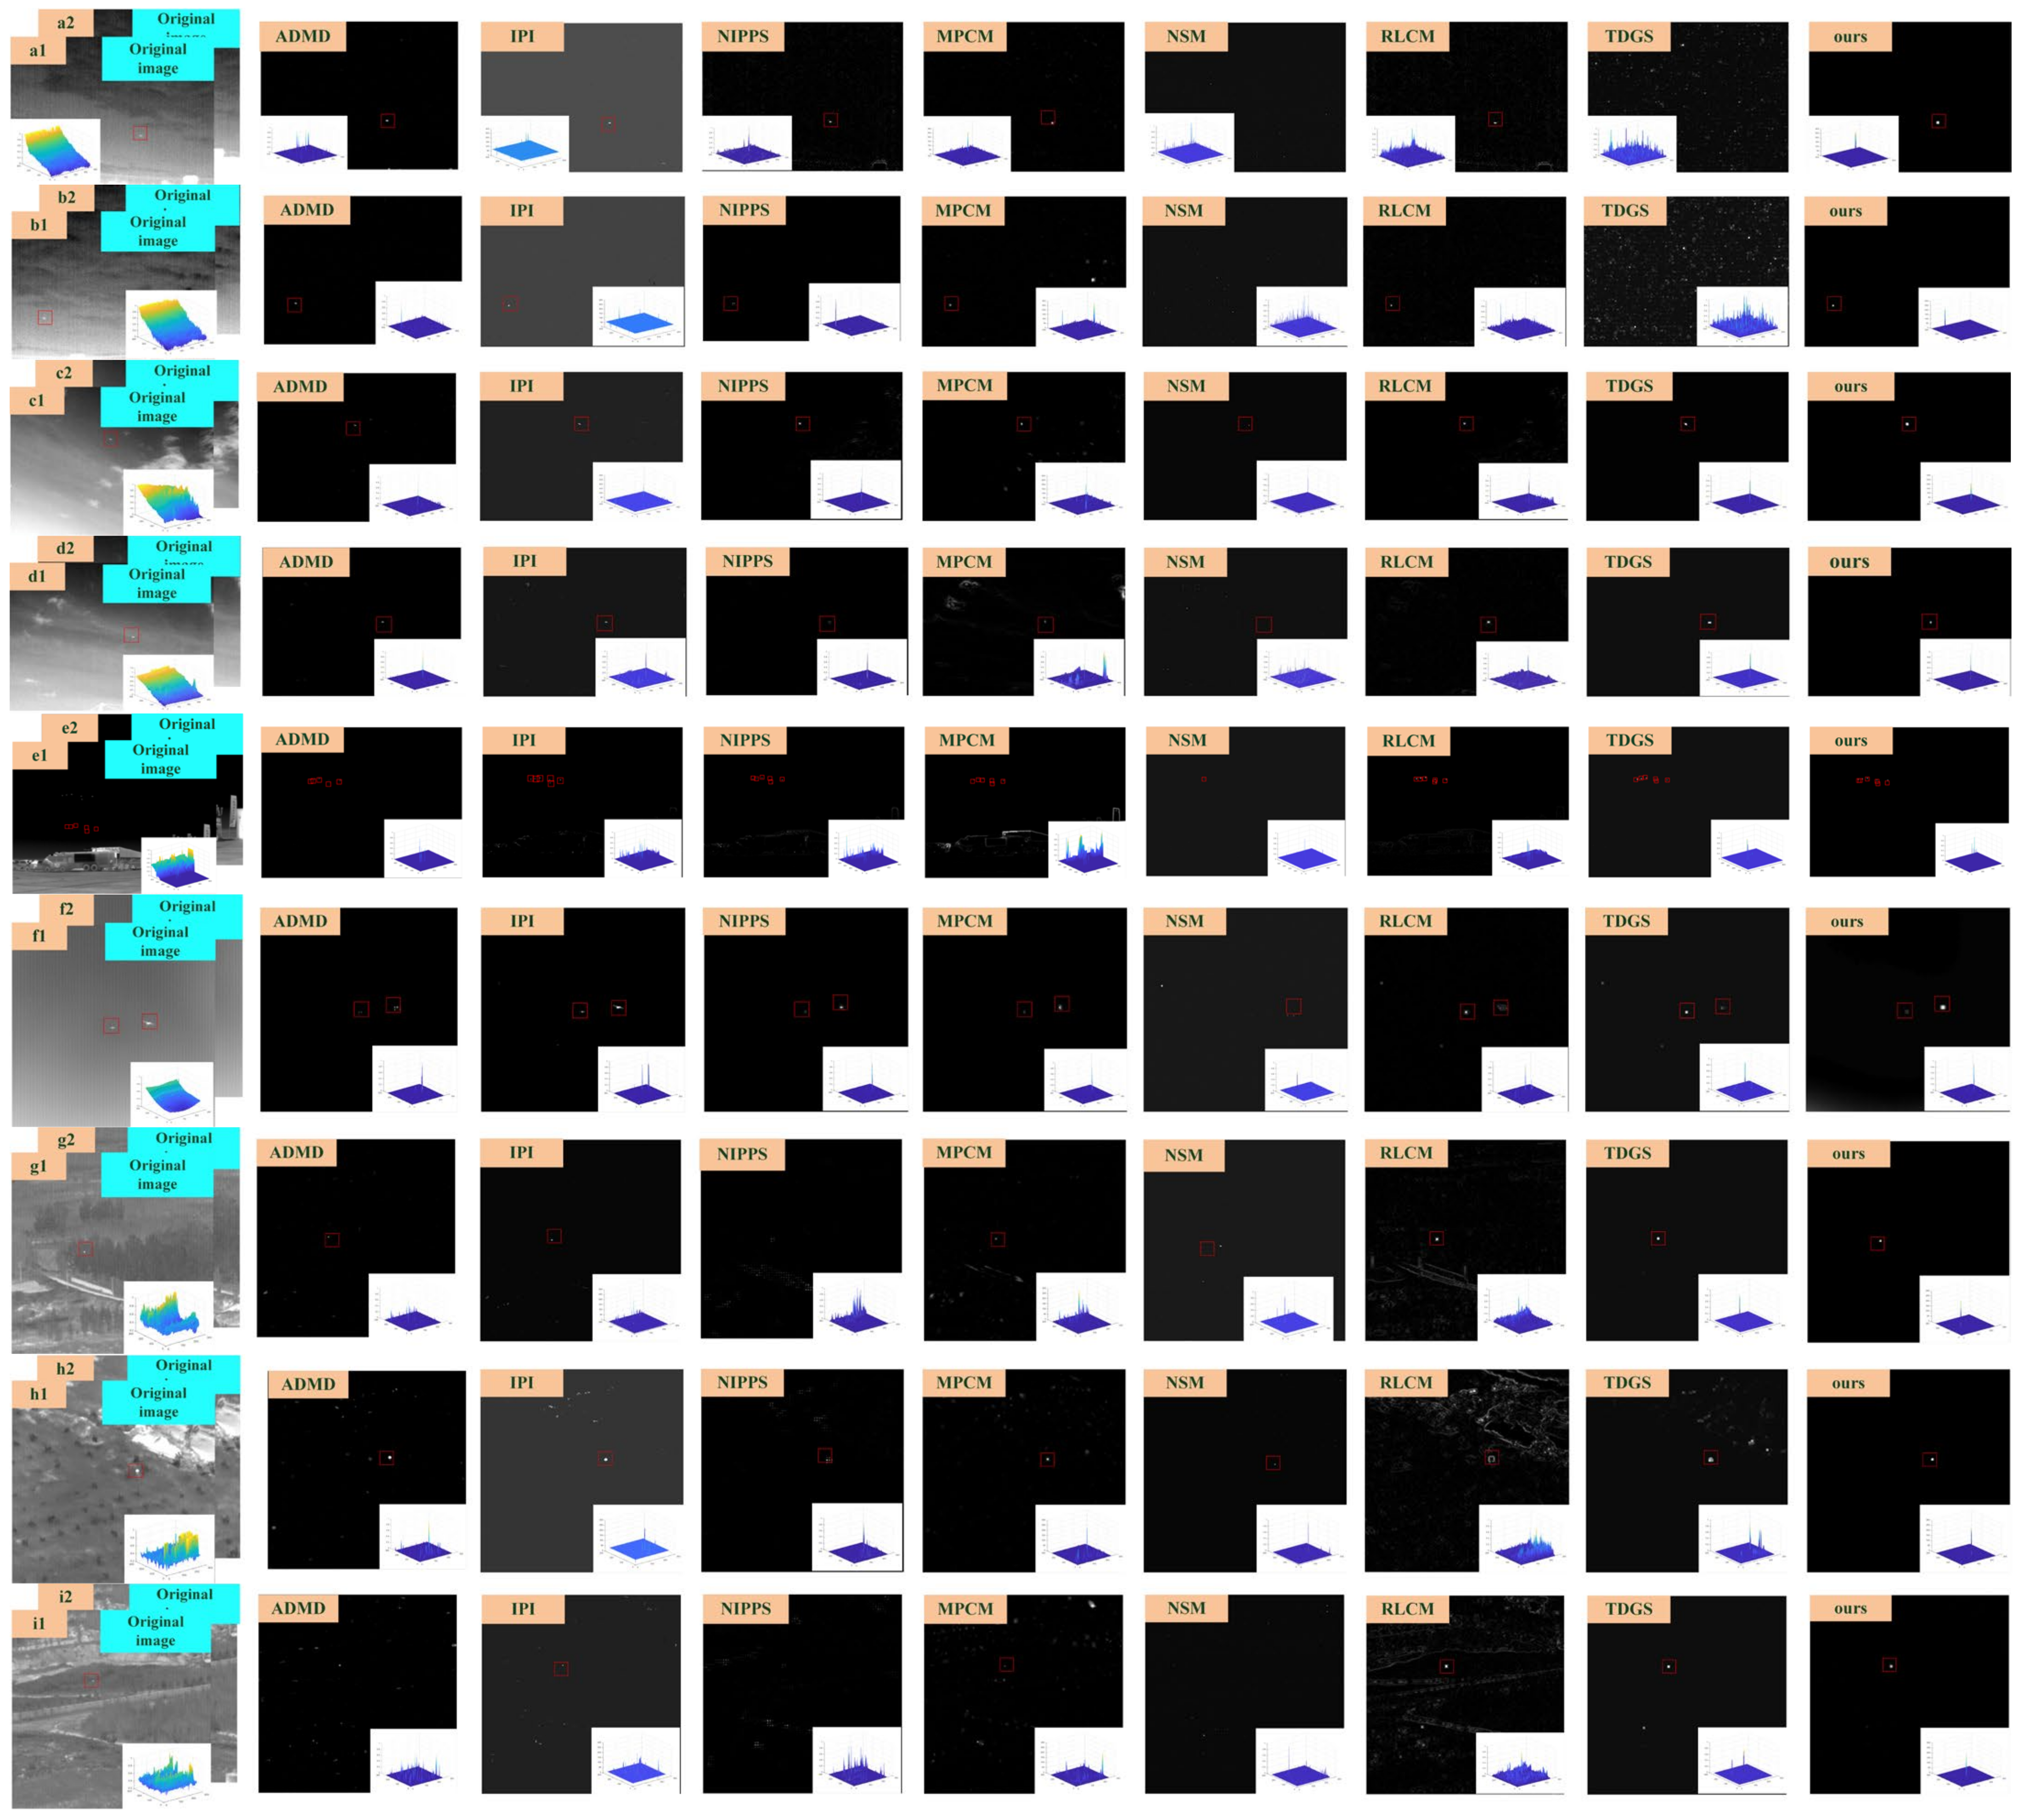
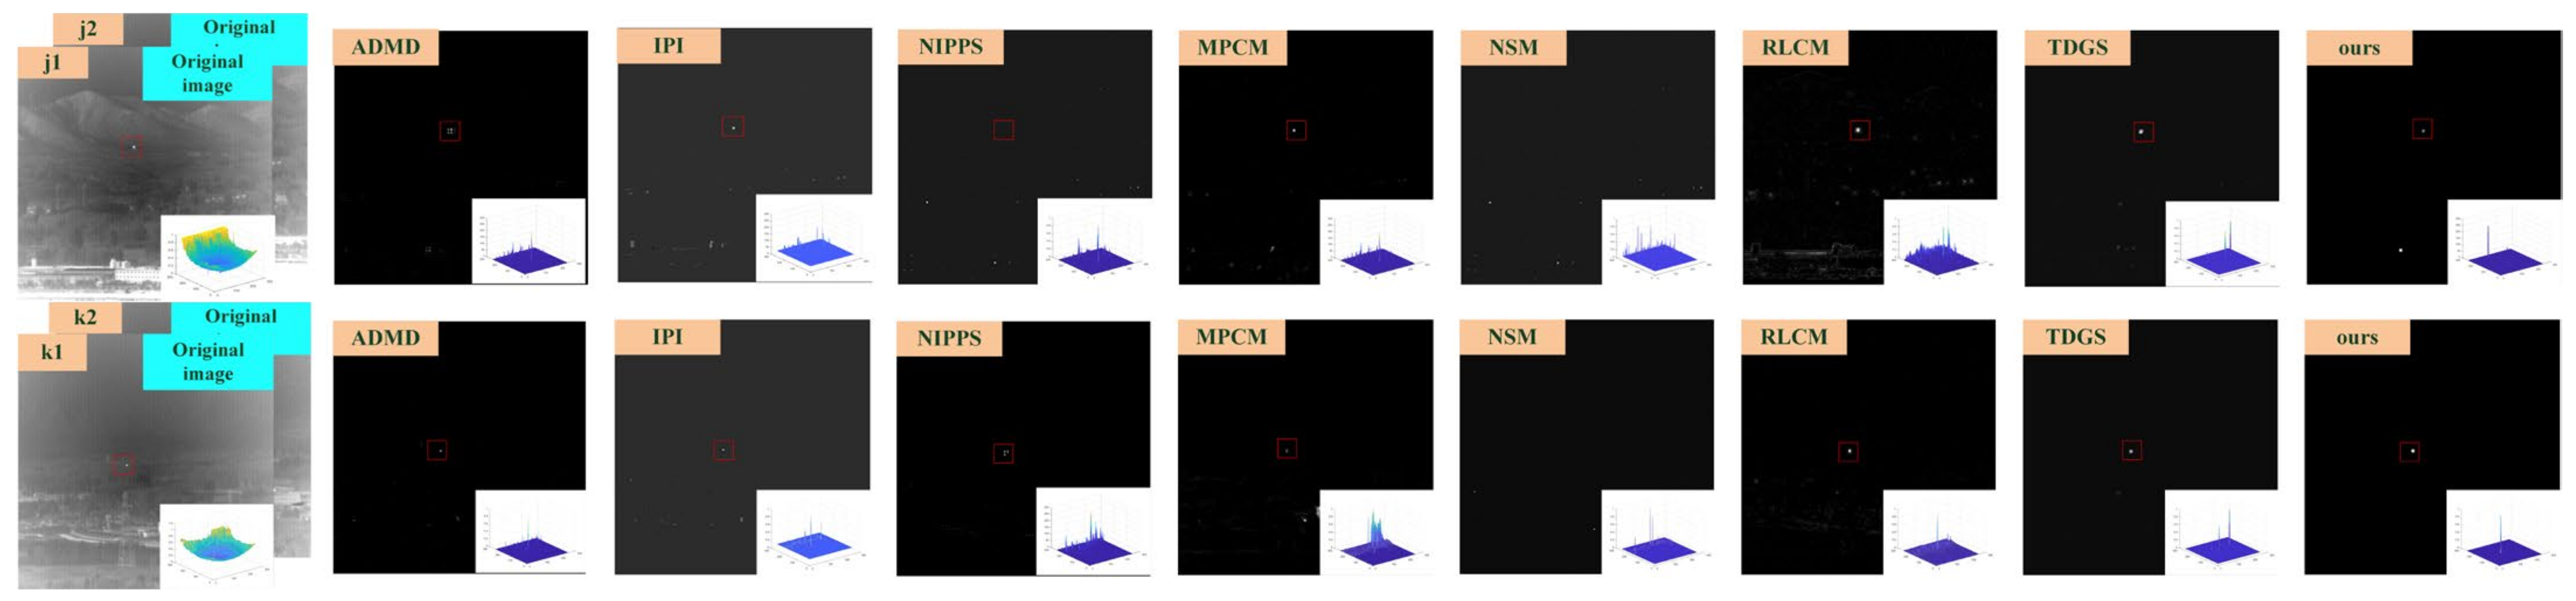
3.3. Experimental Results and Analysis
4. Conclusions
Author Contributions
Funding
Institutional Review Board Statement
Informed Consent Statement
Data Availability Statement
Conflicts of Interest
References
- Zhou, F.; Wu, Y.; Dai, Y.; Wang, P.; Ni, K. Graph-Regularized Laplace Approximation for Detecting Small Infrared Target Against Complex Backgrounds. IEEE Access 2019, 7, 85354–85371. [Google Scholar] [CrossRef]
- Zhang, K.; Yang, K.; Li, S.; Chen, H.-B. A Difference-Based Local Contrast Method for Infrared Small Target Detection Under Complex Background. IEEE Access 2019, 7, 105503–105513. [Google Scholar] [CrossRef]
- Han, J.; Liang, K.; Zhou, B.; Zhu, X.; Zhao, J.; Zhao, L. Infrared Small Target Detection Utilizing the Multiscale Relative Local Contrast Measure. IEEE Geosci. Remote Sens. Lett. 2018, 15, 612–616. [Google Scholar] [CrossRef]
- Gao, J.; Lin, Z.; An, W. Infrared Small Target Detection Using a Temporal Variance and Spatial Patch Contrast Filter. IEEE Access. 2019, 7, 32217–32226. [Google Scholar] [CrossRef]
- Agarwal, A.; Gupta, S.; Singh, D.K. Review of Optical Flow Technique for Moving Object Detection. In Proceedings of the 2016 2nd International Conference on Contemporary Computing and Informatics (IC3I), Greater Noida, India, 14–17 December 2016; pp. 409–413. [Google Scholar]
- Li, X.L.; Hamdulla, A. Research on Infrared Small Target Tracking Method. In Proceedings of the 2020 12th International Conference on Measuring Technology and Mechatronics Automation (ICMTMA), Phuket, Thailand, 28–29 February 2020; pp. 610–614. [Google Scholar]
- Deng, H.; Sun, X.; Liu, M.; Ye, C.; Zhou, X. Small Infrared Target Detection Based on Weighted Local Difference Measure. IEEE Trans. Geosci. Remote Sens. 2016, 54, 4204–4214. [Google Scholar] [CrossRef]
- Zhang, K.; Ni, S.; Yan, D.; Zhang, A. Review of Dim Small Target Detection Algorithms in Single-frame Infrared Images. In Proceedings of the 2021 IEEE 4th Advanced Information Management, Communicates, Electronic and Automation Control Conference (IMCEC), Chongqing, China, 18–20 June 2021; pp. 2115–2120. [Google Scholar]
- Song, I.; Kim, S. AVILNet: A New Pliable Network with a Novel Metric for Small-Object Segmentation and Detection in Infrared Images. Remote Sens. 2021, 13, 555. [Google Scholar] [CrossRef]
- Deshpande, S.D.; Er, M.H.; Venkateswarlu, R.; Chan, P. Max-Mean and Max-Median Filters for Detection of Small Targets. Int. Soc. Opt. Photonics 1999, 3809, 74–83. [Google Scholar]
- Yang, L.; Yang, J.; Yang, K. Adaptive Detection for Infrared Small Target Under Sea-Sky Complex Background. Electron. Lett. 2004, 40, 1083–1085. [Google Scholar] [CrossRef]
- Bae, T.W. Small Target Detection Using Bilateral Filter and Temporal Cross Product in Infrared Images. Infrared Phys. Technol. 2011, 54, 403–411. [Google Scholar] [CrossRef]
- Cao, Y.; Liu, R.M.; Yang, J. Small Target Detection Using Two-Dimensional Least Mean Square (TDLMS) Filter Based on Neighborhood Analysis. Int. J. Infrared Millim. Waves 2008, 29, 188–200. [Google Scholar] [CrossRef]
- Zhang, Y.X.; Li, L.; Xin, Y.H. Infrared Small Target Detection Based on Adaptive Double-Layer TDLMS Filter. Acta Photonica Sin. 2019, 48, 0910001. [Google Scholar] [CrossRef]
- Bai, X.Z.; Zhou, F.G. Analysis of New Top-Hat Transformation and the Application for Infrared Dim Small Target Detection. Pattern Recognit. 2010, 43, 2145–2156. [Google Scholar] [CrossRef]
- Kim, S.; Lee, J. Scale Invariant Small Target Detection by Optimizing Signal to Clutter Ratio in Heterogeneous Background for Infrared Search and Track. Pattern Recognit. 2012, 45, 393–406. [Google Scholar] [CrossRef]
- Bai, X.; Zhou, F.; Xie, Y.; Jin, T. New Top-Hat Transformation and Application on Infrared Small Target Detection. J. Data Acquis. Process. 2009, 24, 643–649. [Google Scholar] [CrossRef]
- Liu, Y.; Tang, X.Y.; Li, Z. A New Top Hat Local Contrast Based Algorithm for Infrared Small Target Detection. Infrared Technol. 2015, 37, 544–552. [Google Scholar]
- Yu, N.; Wu, C.Y.; Tang, X.Y.; Li, F.M. Adaptive Background Perception Algorithm for Infrared Target Detection. Acta Electron. Sin. 2005, 33, 200–204. [Google Scholar]
- Deng, L.; Zhang, J.; Xu, G.; Zhu, H. Infrared Small Target Detection via Adaptive M-estimator ring top-hat transformation. Pattern Recognit. 2021, 112, 107729. [Google Scholar] [CrossRef]
- Shao, X.; Fan, H.; Lu, G.; Xu, J. An Improved Infrared Dim and Small Target Detection Algorithm Based on the Contrast Mechanism of Human Visual System. Infrared Phys. Technol. 2012, 55, 403–408. [Google Scholar] [CrossRef]
- Wang, X.; Lv, G.F.; Xu, L.Z. Infrared Dim Target Detection Based on Visual Attention. Infrared Phys. Technol. 2012, 55, 513–521. [Google Scholar] [CrossRef]
- Dong, X.; Huang, X.; Zheng, Y.; Shen, L.; Bai, S. Infrared Dim and Small Target Detecting and Tracking Method Inspired by Human Visual System. Infrared Phys. Technol. 2014, 62, 100–109. [Google Scholar] [CrossRef]
- Qi, S.; Ma, J.; Tao, C.; Yang, C.; Tian, J. A Robust Directional Saliency-Based Method for Infrared Small-Target Detection Under Various Complex Backgrounds. IEEE Geosci. Remote Sens. Lett. 2013, 10, 495–499. [Google Scholar]
- Han, J.; Ma, Y.; Huang, J.; Mei, X.; Ma, J. An Infrared Small Target Detecting Algorithm Based on Human Visual System. IEEE Geosci. Remote Sens. Lett. 2016, 13, 452–456. [Google Scholar]
- Chen, C.L.P.; Li, H.; Wei, Y.; Xia, T.; Tang, Y.Y. A Local Contrast Method for Small Infrared Target Detection. IEEE Trans. Geosci. Remote Sens. 2014, 52, 574–581. [Google Scholar] [CrossRef]
- Pan, S.D.; Zhang, S.; Zhao, M.; An, B. W Infrared Small Target Detection Based on Double-Layer Local Contrast Measure. Acta Photonica Sin. 2020, 49, 0110003. [Google Scholar]
- Han, J.H.; Ma, Y.; Zhou, B.; Fan, F.; Liang, K.; Fang, Y. A Robust Infrared Small Target Detection Algorithm Based on Human Visual System. IEEE Geosci. Remote Sens. Lett. 2014, 11, 2168–2172. [Google Scholar]
- Qin, Y.; Li, B. Effective Infrared Small Target Detection Utilizing a Novel Local Contrast Method. IEEE Geosci. Remote Sens. Lett. 2016, 13, 1890–1894. [Google Scholar] [CrossRef]
- Wei, Y.T.; You, X.G.; Li, H. Multiscale Patch-Based Contrast Measure for Small Infrared Target Detection. Pattern Recognit. 2016, 58, 216–226. [Google Scholar] [CrossRef]
- Deng, H.; Sun, X.; Liu, M.; Ye, C.; Zhou, X. Entropy-Based Window Selection for Detecting Dim and Small Infrared Targets. Pattern Recognit. 2017, 61, 66–77. [Google Scholar] [CrossRef]
- Gao, C.; Meng, D.; Yang, Y.; Wang, Y.; Zhou, X.; Hauptmann, A.G. Infrared Patch-Image Model for Small Target Detection in a Single Image. IEEE Trans. Image Process. 2013, 22, 4996–5009. [Google Scholar] [CrossRef]
- Dai, Y.M.; Wu, Y.Q.; Song, Y.; Guo, J. Non-negative infrared patch-image model: Robust target-background separation via partial sum minimization of singular values. Infrared Phys. Technol. 2017, 81, 182–194. [Google Scholar] [CrossRef]
- Zhang, P.; Wang, X.; Wang, X.; Fei, C.; Guo, Z. Infrared Small Target Detection Based on Spatial-Temporal Enhancement Using Quaternion Discrete Cosine Transform. IEEE Access 2019, 7, 54712–54723. [Google Scholar] [CrossRef]
- Wang, H.; Xin, Y.H. Small Infrared Target Detection via Multiscale Kurtosis Maps Fusion. Electron. Lett. 2020, 56, 926–928. [Google Scholar] [CrossRef]
- Chen, L.; Zou, B.J. New Algorithm for Detecting Moving Object Based on Adaptive Background Subtraction and Symmetrical Differencing. Appl. Res. Comput. 2008, 25, 494. [Google Scholar]
- Ma, T.L.; Shi, Z.L.; Yin, J.; Liu, Y.P.; Xu, B.S.; Zhang, C.S. Rectilinear-Motion Space Inversion-Based Detection Approach for Infrared Dim Air Targets with Variable Velocities. Opt. Eng. 2016, 55, 033102. [Google Scholar] [CrossRef]
- Ma, T.L.; Shi, Z.L.; Yin, J.; Xu, B.S.; Liu, Y.P. Dim Air Target Detection Based on Radiation Accumulation and Space Inversion. Infrared Laser Eng. 2015, 44, 3500–3506. [Google Scholar]
- Bar-Shalom, Y. Recursive Tracking Algorithms: From the Kalman Filter to Intelligent Trackers for Cluttered Environment. In Proceedings of the ICCON IEEE International Conference on Control and Applications, Jerusalem, Israel, 3–6 April 1989; pp. 675–680. [Google Scholar]
- Zhang, X.M.; Ren, K.; Wan, M.J.; Gu, G.H.; Chen, Q. Infrared Small Target Tracking Based on Sample Constrained Particle Filtering and Sparse Representation. Infrared Phys. Technol. 2017, 87, 72–82. [Google Scholar] [CrossRef]
- Wang, B.; Xu, W.H.; Zhao, M.; Wu, H.D. Antivibration Pipeline-Filtering Algorithm for Maritime Small Target Detection. Opt. Eng. 2014, 53, 113109. [Google Scholar] [CrossRef]
- Reed, I.S.; Gagliardi, R.M.; Shao, H.M. Application of Three-Dimensional Filtering to Moving Target Detection. IEEE Trans. Aerosp. Electron. Syst. 1983, AES-19, 898–905. [Google Scholar] [CrossRef]
- Wang, X.; Ning, C.; Xu, L. Spatiotemporal Difference-of-Gaussians Filters for Robust Infrared Small Target Tracking in Various Complex Scenes. Appl. Opt. 2015, 54, 1573–1586. [Google Scholar] [CrossRef]
- Kim, S.; Sun, S.G.; Kim, K.T. Highly Efficient Supersonic Small Infrared Target Detection Using Temporal Contrast Filter. Electron. Lett. 2014, 50, 81–83. [Google Scholar] [CrossRef]
- Qu, J.J.; Xin, Y.H. Combined Continuous Frame Difference with Background Difference Method for Moving Object Detection. Acta Photonica Sin. 2014, 43, 219–226. [Google Scholar]
- Lin, L.; Xu, Y.; Liang, X.; Lai, J. Complex Background Subtraction by Pursuing Dynamic Spatio-Temporal Models. IEEE Trans. Image Process. 2014, 23, 3191–3202. [Google Scholar] [PubMed]
- Lin, G.-C.; Yang, S.-C.; Wang, C.-M.; Lin, C.-F. Background Subtraction Based on Codebook Model and Texture Feature. In Proceedings of the 2016 International Symposium on Computer, Consumer and Control (IS3C), Xi’an, China, 4–6 July 2016; pp. 498–501. [Google Scholar]
- Phorn, B.K.; Schunck, B.G. Determining Optical Flow. Artif. Intell. 1981, 17, 185–203. [Google Scholar]
- Lucas, B.D.; Kanade, T. An Iterative Image Registration Technique with an Application to Stereo Vision (DARPA). Nutr. Cycl. Agroecosystems 1981, 83, 13–26. [Google Scholar]
- Dai, J.; Li, Y.; He, K.; Sun, J. R-FCN: Object Detection via region-based fully convolutional networks. In Proceedings of the Neural Information Processing Systems, Barcelona, Spain, 5–10 December 2016; pp. 379–387. [Google Scholar]
- Redmon, J.; Divvala, S.; Girshick, R.; Farhadi, A. You only look once: Unified, real-time object detection. In Proceedings of the IEEE Conference on Computer Vision and Pattern Recognition (CVPR), Las Vegas, NV, USA, 27–30 June 2016; pp. 779–788. [Google Scholar]
- Fourure, D.; Emonet, R.; Fromont, E.; Muselet, D.; Tremeau, A.; Wolf, C. Residual Conv-Deconv Grid Network for Semantic Segmentation. In Proceedings of the British Machine Vision Conference (BMVC), London, UK, 4–7 September 2017; Kim, T.-K., Stefanos Zafeiriou, G.B., Mikolajczyk, K., Eds.; BMVA Press: Norwich, UK, 2017; pp. 181.1–181.13. [Google Scholar]
- Wang, C.Y.; Mark Liao, H.Y.; Wu, Y.H.; Chen, P.Y.; Hsieh, J.W.; Yeh, I.H. CSPNet: A new backbone that can enhance learning capability of cnn. In Proceedings of the IEEE/CVF Conference on Computer Vision and Pattern Recognition Workshops, Seattle, WA, USA, 16–18 June 2020; pp. 390–391. [Google Scholar]
- Chen, L.C.; Papandreou, G.; Schroff, F.; Adam, H. Rethinking atrous convolution for semantic image segmentation. arXiv 2017, arXiv:1706.05587. [Google Scholar]
- Moradi, S.; Moallem, P.; Sabahi, M.F. Fast and robust small infrared target detection using absolute directional mean difference algorithm. Signal Process. 2020, 177, 107727. [Google Scholar] [CrossRef]
- Lv, P.; Sun, S.; Lin, C.; Liu, G. A Method for Weak Target Detection Based on Human Visual Contrast Mechanism. IEEE Geosci. Remote Sens. Lett. 2019, 16, 261–265. [Google Scholar] [CrossRef]
- Yi, X.; Wang, B.; Zhou, H.; Qin, H. Dim and small infrared target fast detection guided by visual saliency. Infrared Phys. Technol. 2019, 97, 614. [Google Scholar] [CrossRef]


| Sequence | Image Size | Target Description | Background Description |
|---|---|---|---|
| a | 288 × 384 | Low brightness, irregular shape | Sky background, highlight building edges, heavy noise, strong edges |
| b | 288 × 384 | Low brightness, irregular shape | Sky background, highlight building edges, heavy noise |
| c | 288 × 384 | High contrast compared with the background | Sky background, more cloud interference |
| d | 288 × 384 | High contrast compared with the background | Sky background, more cloud interference, strong edges |
| e | 288 × 384 | Multiple targets, target salient | Vehicle and building interference, bright background |
| f | 256 × 256 | Multiple targets, target salient | Overall background smoothing, heavy background noise |
| g | 256 × 256 | Dotted distribution, target dim | Highlighted background edge, trees interfere |
| h | 256 × 256 | Small circular target, target salient | Messy background, irregular bright background |
| i | 256 × 256 | Dotted distribution, target dim | Strong edges, too much noise |
| j | 256 × 256 | Dotted distribution, target dim | Irregular building shape, strong edges, heavy noise |
| k | 256 × 256 | Dotted distribution, target salient | Irregular building shape, strong edges, bright background |
| SCRG | ADMD | IPI | NIPPS | MPCM | NSM | RLCM | TGDS | Ours |
|---|---|---|---|---|---|---|---|---|
| a | 27.36 | 33.86 | 26.78 | 19.70 | 22.71 | 18.55 | 4.27 | 39.11 |
| b | 32.91 | 33.35 | 31.73 | 17.89 | 25.07 | 10.27 | 13.73 | 34.73 |
| c | 36.24 | 38.35 | 39.60 | 26.53 | 17.15 | 19.22 | 38.21 | 42.82 |
| d | 29.72 | 35.80 | 26.71 | 15.26 | 27.66 | 27.18 | 32.21 | 34.80 |
| e | 36.97 | 27.52 | 40.32 | 35.29 | 10.04 | 53.35 | 52.96 | 53.83 |
| f | 34.29 | 36.56 | 37.21 | 37.90 | 24.40 | 27.14 | 29.83 | 40.09 |
| g | 39.21 | 33.91 | 23.71 | 5.14 | 27.77 | 30.16 | 37.04 | 42.34 |
| h | 21.67 | 24.17 | 27.52 | 12.64 | 23.87 | 6.10 | 23.29 | 32.53 |
| i | 29.53 | 32.24 | 23.07 | 21.90 | 12.74 | 14.85 | 27.76 | 32.37 |
| j | 32.19 | 33.46 | 36.54 | 27.07 | 21.50 | 28.33 | 35.17 | 41.81 |
| k | 42.32 | 43.28 | 47.39 | 29.14 | 13.21 | 45.98 | 47.86 | 52.63 |
| BSF | ADMD | IPI | NIPPS | MPCM | NSM | RLCM | TGDS | Ours |
|---|---|---|---|---|---|---|---|---|
| a | 42.50 | 45.73 | 40.61 | 47.63 | 26.71 | 16.74 | 20.42 | 48.05 |
| b | 34.89 | 41.38 | 38.93 | 37.25 | 26.02 | 15.70 | 23.62 | 42.24 |
| c | 34.52 | 34.30 | 36.80 | 36.98 | 31.03 | 19.22 | 14.33 | 38.37 |
| d | 26.45 | 27.22 | 26.64 | 27.57 | 30.14 | 22.60 | 12.51 | 28.73 |
| e | 32.50 | 27.69 | 33.10 | 31.93 | 31.26 | 23.81 | 24.65 | 38.83 |
| f | 27.53 | 19.37 | 33.22 | 36.30 | 30.70 | 18.25 | 21.32 | 39.54 |
| g | 32.11 | 25.44 | 25.61 | 32.13 | 27.60 | 17.42 | 22.48 | 35.38 |
| h | 21.54 | 24.94 | 23.26 | 27.03 | 27.94 | 26.86 | 14.42 | 28.04 |
| i | 19.23 | 12.95 | 27.14 | 36.47 | 29.53 | 35.87 | 25.87 | 39.76 |
| j | 27.11 | 25.57 | 31.21 | 34.98 | 28.47 | 24.94 | 14.94 | 33.25 |
| k | 23.69 | 26.24 | 24.33 | 21.56 | 16.18 | 17.77 | 2.89 | 26.12 |
Disclaimer/Publisher’s Note: The statements, opinions and data contained in all publications are solely those of the individual author(s) and contributor(s) and not of MDPI and/or the editor(s). MDPI and/or the editor(s) disclaim responsibility for any injury to people or property resulting from any ideas, methods, instructions or products referred to in the content. |
© 2023 by the authors. Licensee MDPI, Basel, Switzerland. This article is an open access article distributed under the terms and conditions of the Creative Commons Attribution (CC BY) license (https://creativecommons.org/licenses/by/4.0/).
Share and Cite
Xin, J.; Cao, X.; Xiao, H.; Liu, T.; Liu, R.; Xin, Y. Infrared Small Target Detection Based on Multiscale Kurtosis Map Fusion and Optical Flow Method. Sensors 2023, 23, 1660. https://doi.org/10.3390/s23031660
Xin J, Cao X, Xiao H, Liu T, Liu R, Xin Y. Infrared Small Target Detection Based on Multiscale Kurtosis Map Fusion and Optical Flow Method. Sensors. 2023; 23(3):1660. https://doi.org/10.3390/s23031660
Chicago/Turabian StyleXin, Jinglin, Xinxin Cao, Hu Xiao, Teng Liu, Rong Liu, and Yunhong Xin. 2023. "Infrared Small Target Detection Based on Multiscale Kurtosis Map Fusion and Optical Flow Method" Sensors 23, no. 3: 1660. https://doi.org/10.3390/s23031660
APA StyleXin, J., Cao, X., Xiao, H., Liu, T., Liu, R., & Xin, Y. (2023). Infrared Small Target Detection Based on Multiscale Kurtosis Map Fusion and Optical Flow Method. Sensors, 23(3), 1660. https://doi.org/10.3390/s23031660