

Security Analysis of Cyber-Physical Systems Using Reinforcement Learning


Abstract
:1. Introduction
1.1. Related Work
2. Preliminaries
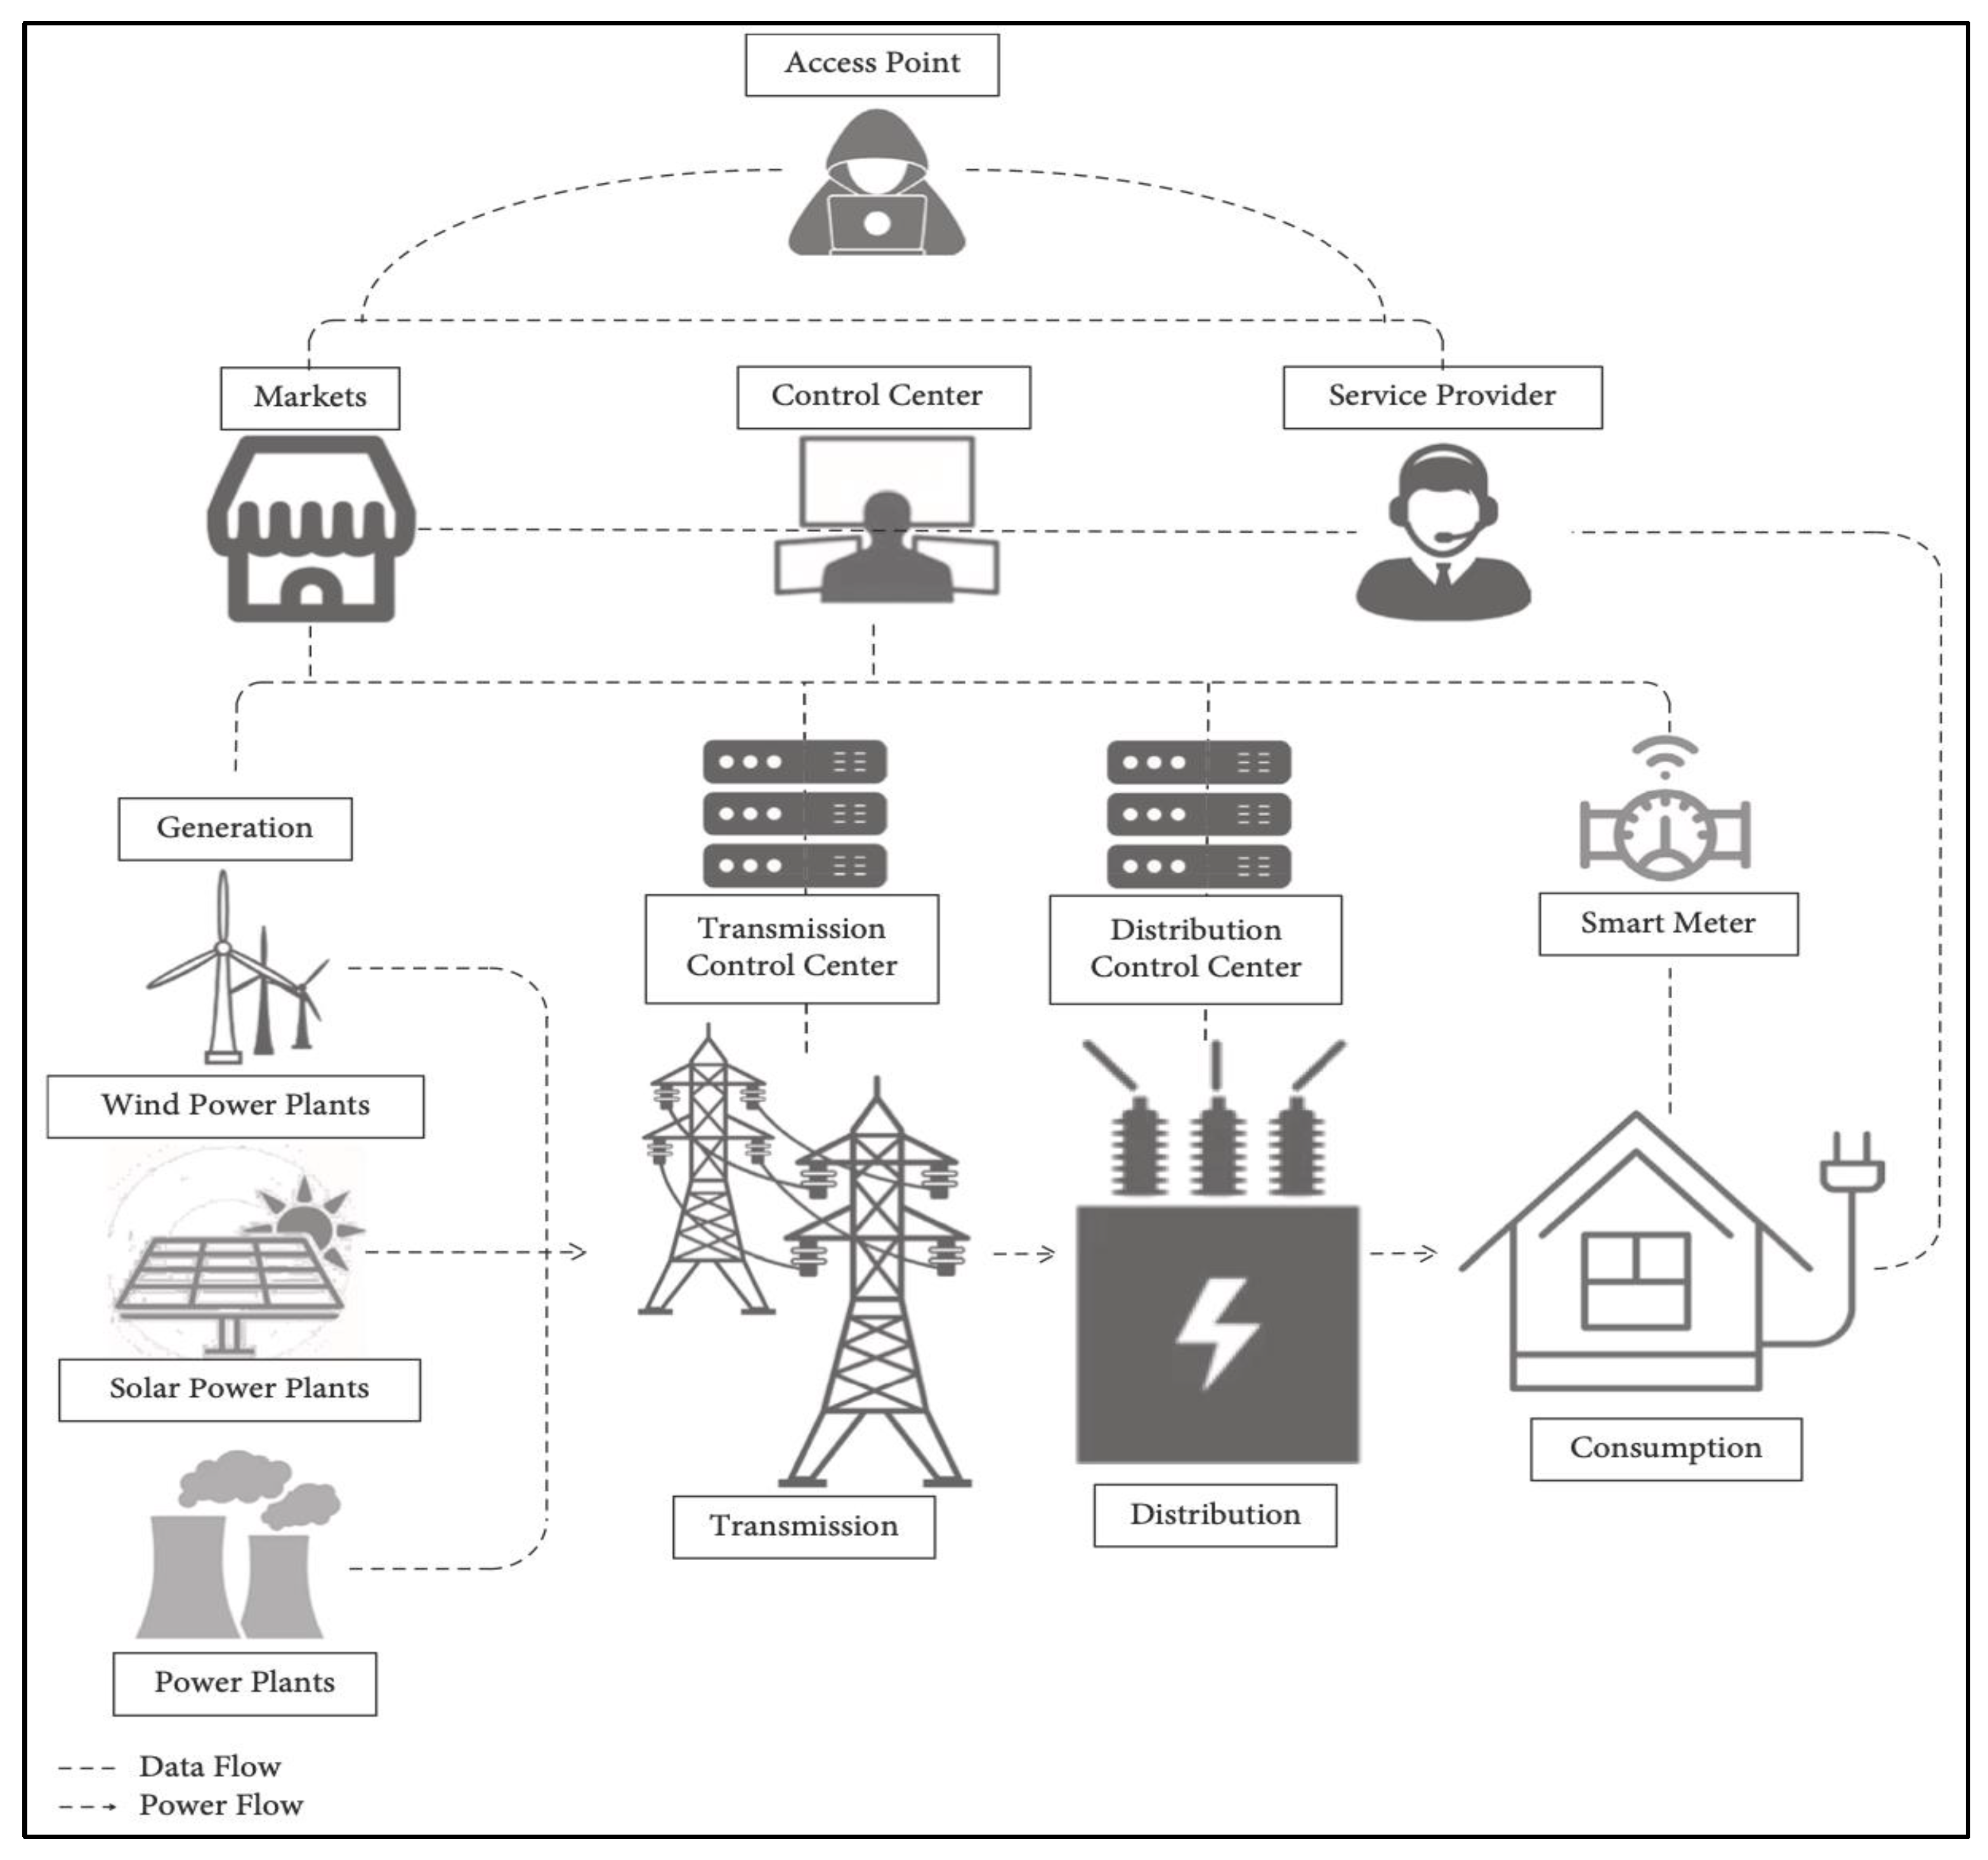
2.1. Case Study
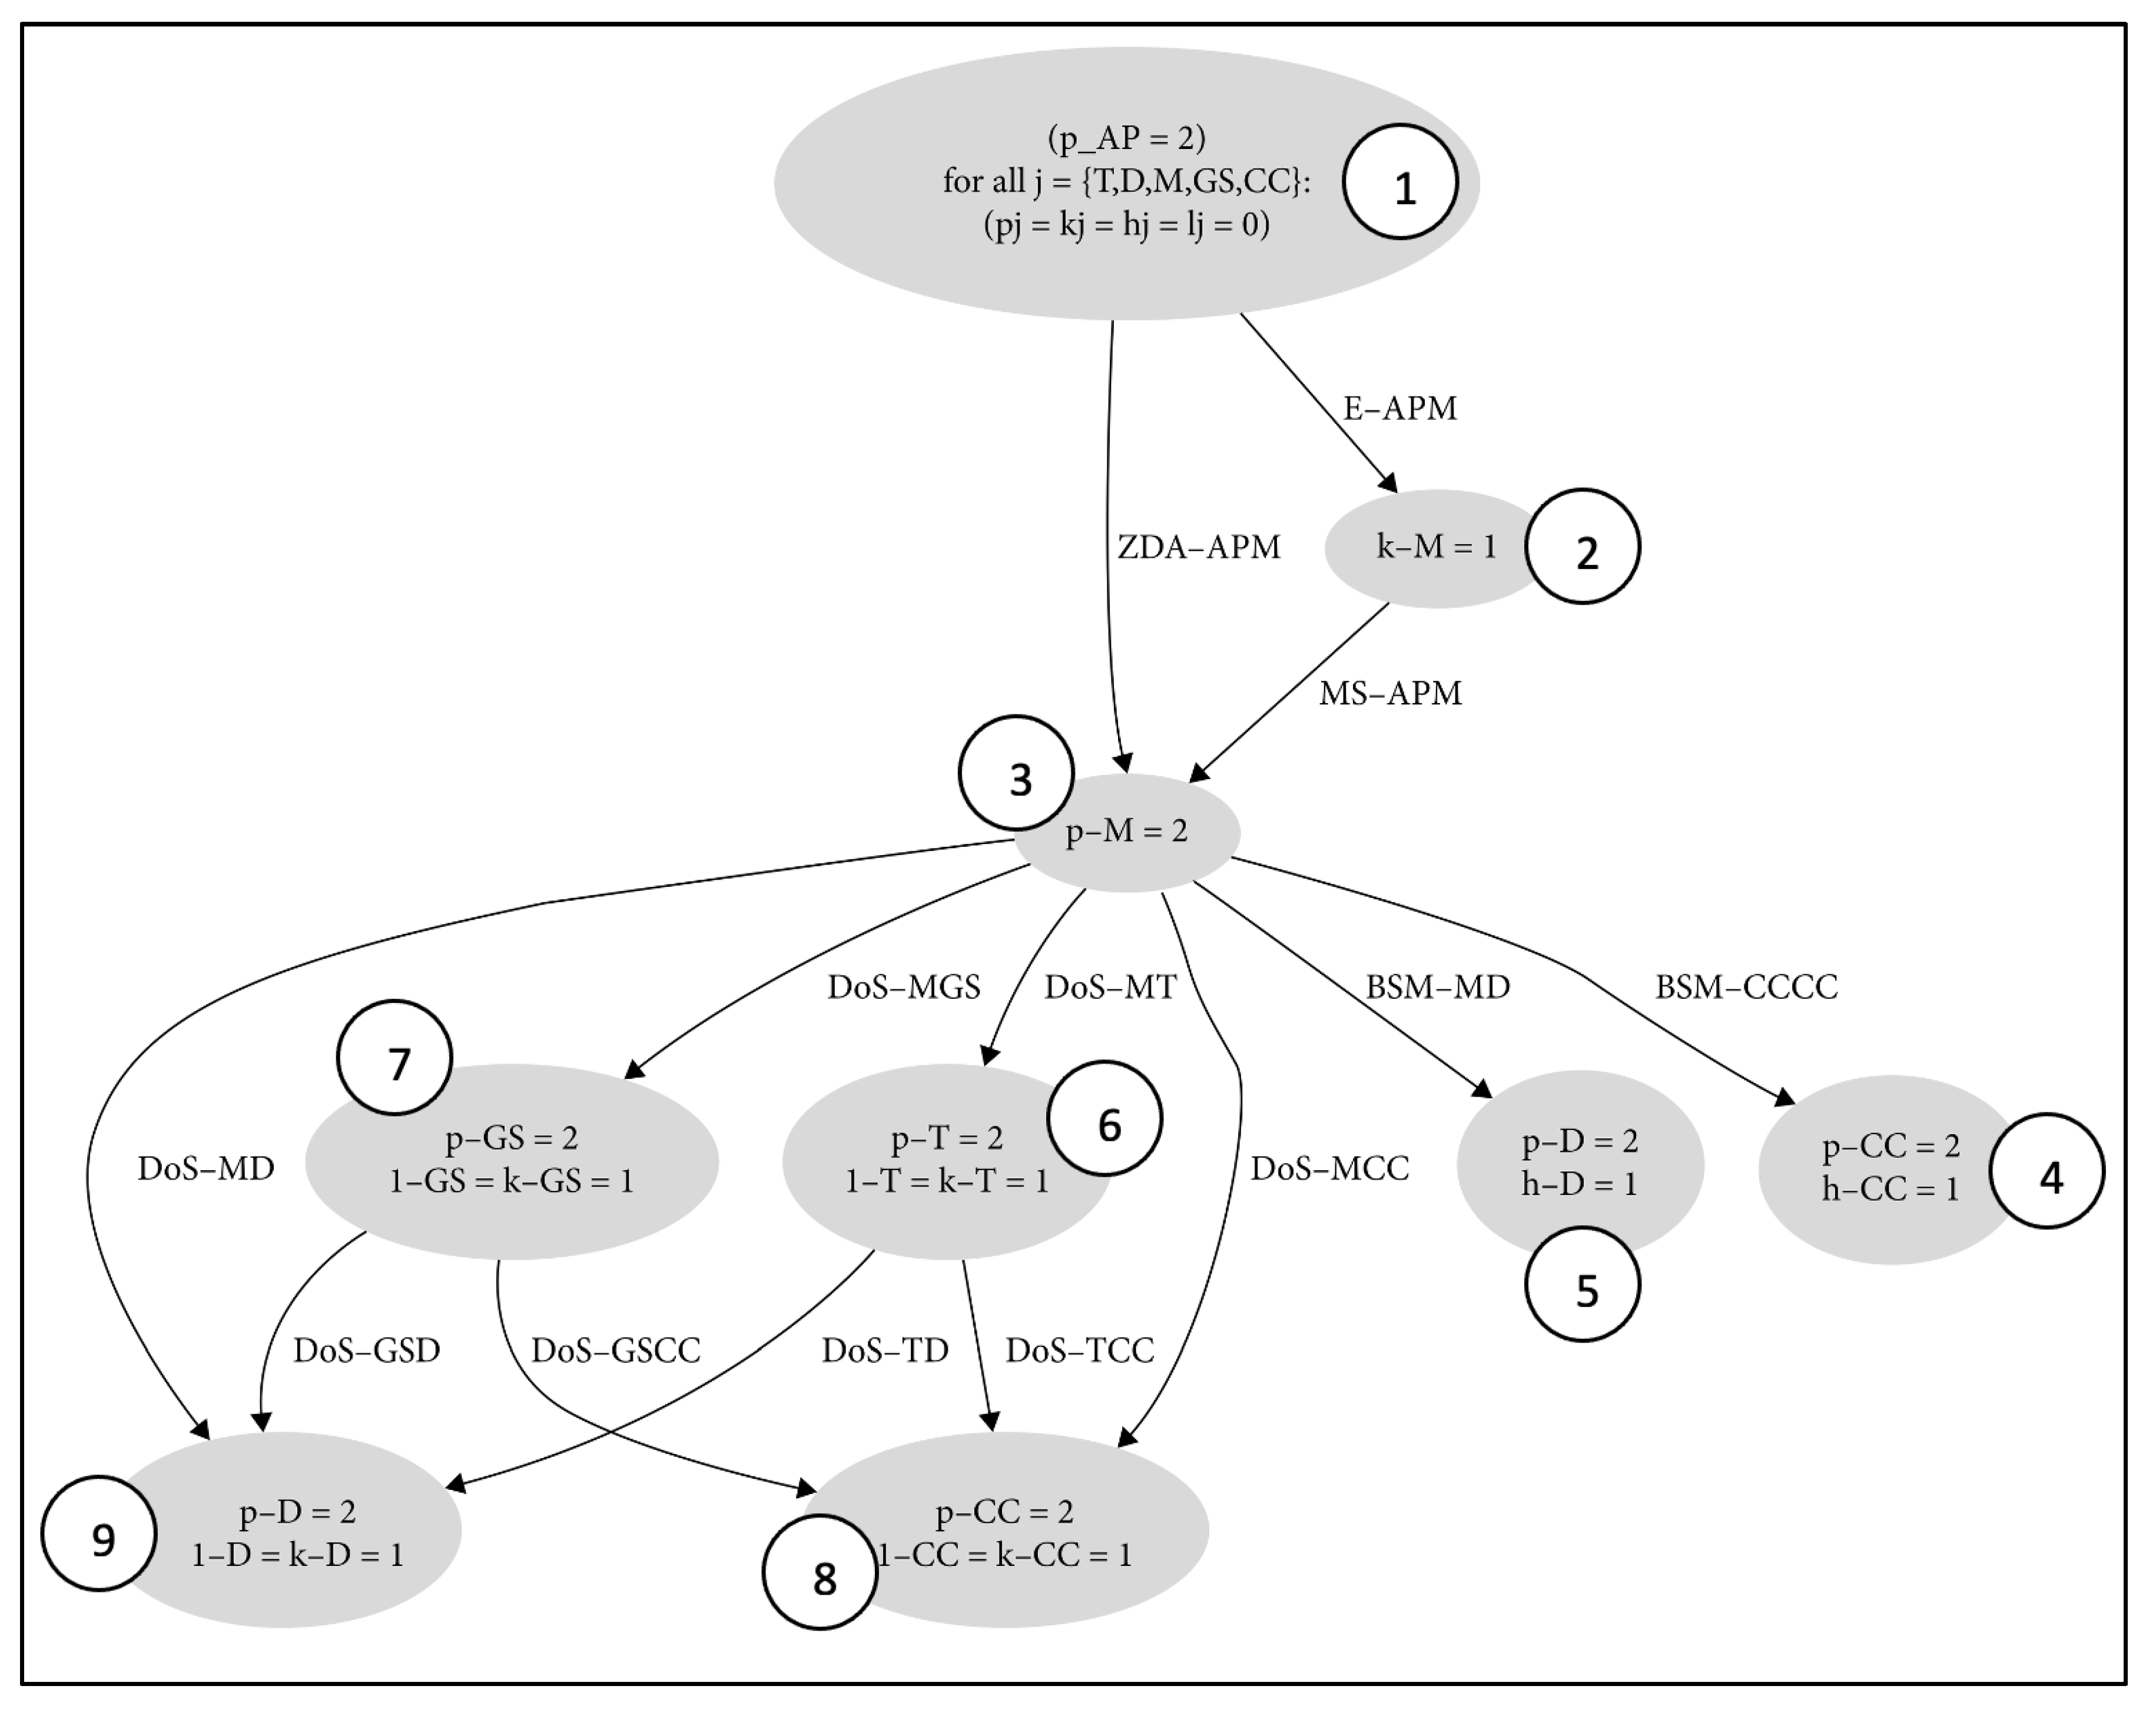
2.2. Attack Graph
2.3. SARSA
2.4. Common Vulnerability Scoring System (CVSS)
- Our input for the Attack Vector was local, meaning that the attack is being conducted via read/write/execute capabilities and that the vulnerable component is not connected to the network stack.
- The Low input for the Attack Complexity was entered into the calculator, signifying that no special access requirements or mitigating factors exist.
- The value entered for the Privileges Required field is None, indicating that the attacker was not authorized before beginning the attack and does not require access to the settings or data on the susceptible system to carry it out.
- None was entered in the User Interaction field, indicating that no user interaction was required to abuse the system.
- The Scope field’s response of Unchanged indicates that only resources under the control of the same security authority can be harmed by an exploited vulnerability.
- The attacker has access to some protected information, but he or she has no control over what information is gained or how much of it is obtained. This is shown by the Low response that was entered into the Confidentiality field.
- The None response was entered for the two fields Integrity and Availability, signifying that the affected component has not lost its integrity or availability.
- The input for Exploit Code Maturity is Functional, indicating that there is functional exploit code available.
- Unavailable was the response for Remediation Level and Reasonable for report Confidence.
- Security Requirements: Low
- Modified Attack Vector (MAV): Local
- Modified Attack Complexity (MAC): Low
- Modified Privileges Required (MPR): High
- Modified User Interaction (MUI): None
- Modified Scope (MS): Unchanged
- Modified Confidentiality (MC): Low
- Modified Integrity (MI): Low
- Modified Availability (MA): High
- These inputs resulted in an overall score of 3.4.

| Attack Name | Base Score | Temporal Score | Environmental Score | Overall Score |
|---|---|---|---|---|
| E-APM | 4.0 | 3.8 | 3.4 | 3.4 |
| ZDA-APM | 5.2 | 4.8 | 4.7 | 4.7 |
| MS-APM | 5.0 | 5.2 | 4.8 | 4.8 |
| BSM-CCCC | 8.0 | 8.1 | 8.1 | 8.1 |
| BSM-MD | 8.0 | 8.1 | 8.1 | 8.1 |
| DoS-MCC | 7.5 | 7.5 | 10 | 10 |
| DoS-MT | 9.2 | 9.0 | 8.7 | 8.7 |
| DoS-MGS | 9.2 | 9.0 | 8.7 | 8.7 |
| DoS-TCC | 7.5 | 7.5 | 10 | 10 |
| DoS-TD | 7.5 | 7.5 | 10 | 10 |
| DoS-GSCC | 7.5 | 7.5 | 10 | 10 |
| DoS-GSD | 7.5 | 7.5 | 10 | 10 |
| DoS-MD | 7.5 | 7.5 | 10 | 10 |
3. Methodology
| Algorithm 1: Predict the optimal route |
| Input: Start state; Result: Optimal route; initialization; Initialize Q(s,a); Initialize state ’s’; Choose an action ’a’ using epsilon-greedy approach; for each time step do Take a; Observe the reward r(t+1) and the state s(t+1); Update Q(s(t),a(t)); s(t) ← s(t+1); a(t) ← a(t+1) end |
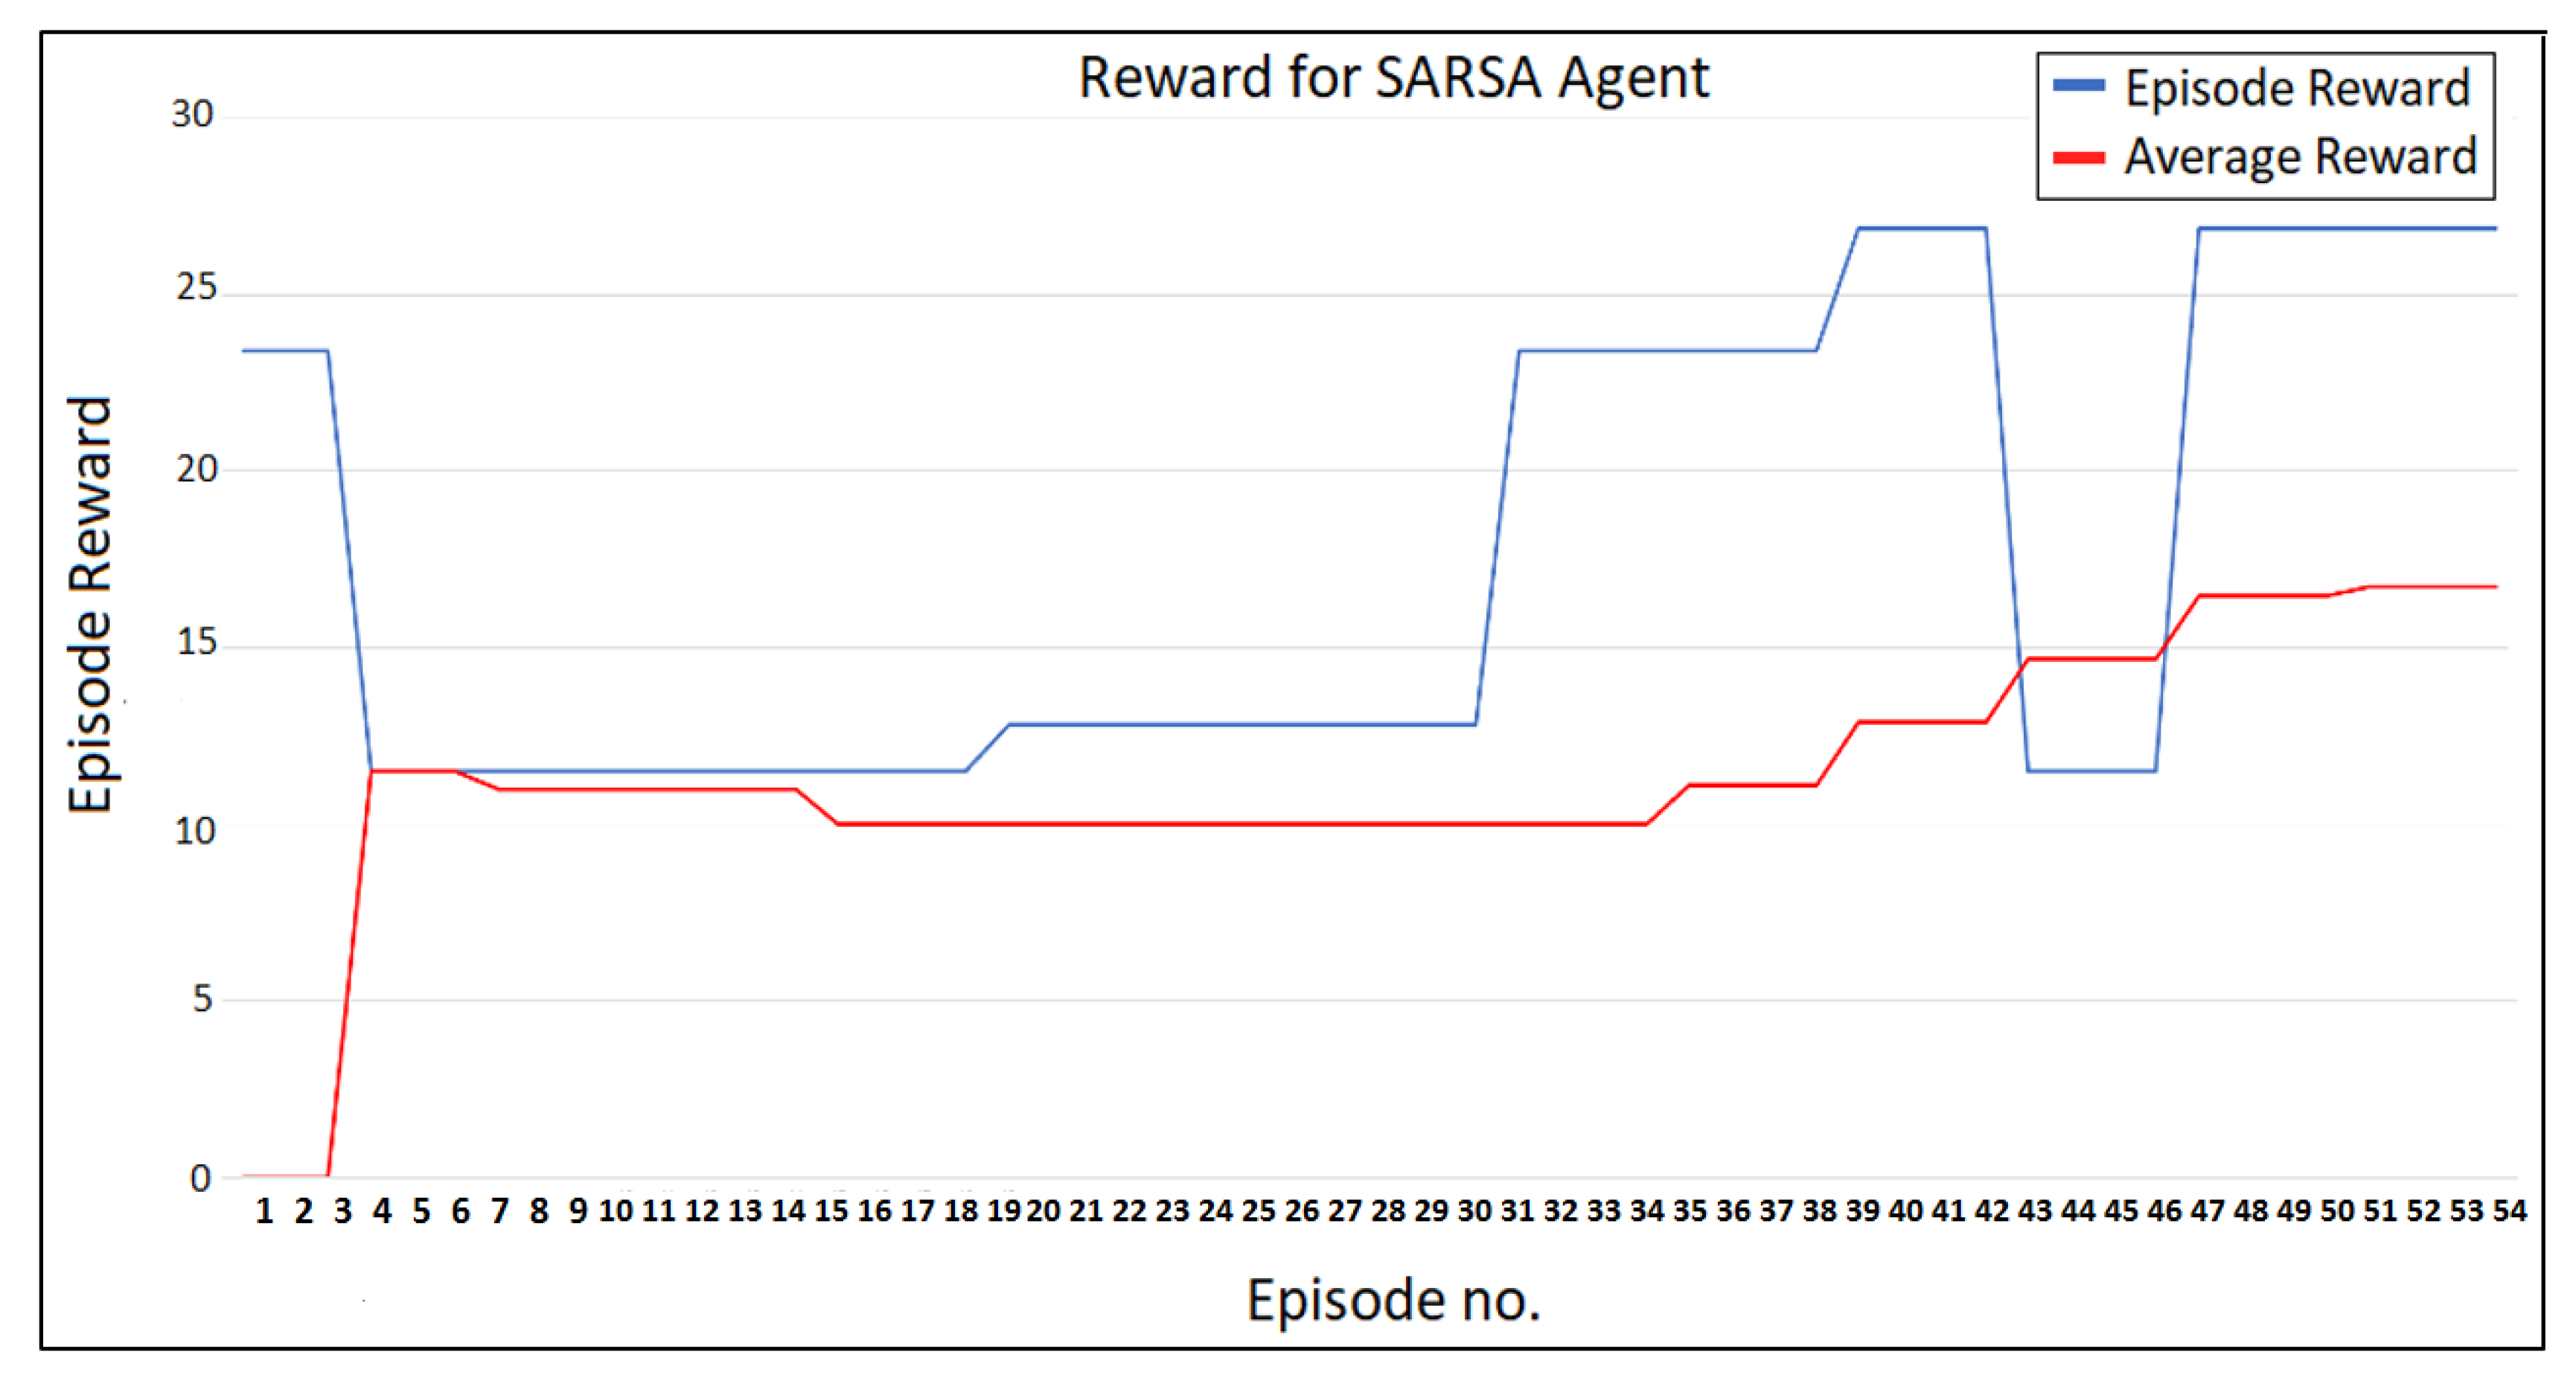
4. Experimental Results and Discussion
5. Conclusions
Author Contributions
Funding
Institutional Review Board Statement
Informed Consent Statement
Data Availability Statement
Acknowledgments
Conflicts of Interest
References
- Dafflon, B.; Moalla, N.; Ouzrout, Y. The challenges, approaches, and used techniques of CPS for manufacturing in Industry 4.0: A literature review. Int. J. Adv. Manuf. Technol. 2021, 113, 2395–2412. [Google Scholar] [CrossRef]
- Keerthi, C.K.; Jabbar, M.A.; Seetharamulu, B. Cyber physical systems (CPS): Security issues, challenges and solutions. In Proceedings of the 2017 IEEE International Conference on Computational Intelligence and Computing Research (ICCIC), Coimbatore, India, 14–16 December 2017; pp. 1–4. [Google Scholar]
- Ibrahim, M.; Al-Hindawi, Q.; Elhafiz, R.; Alsheikh, A.; Alquq, O. Attack graph implementation and visualization for cyber physical systems. Processes 2019, 8, 12. [Google Scholar] [CrossRef]
- Ibrahim, M.; Elhafiz, R. Security Analysis of Smart Grids. Secur. Commun. Netw. 2022, 2022, 7199301. [Google Scholar] [CrossRef]
- Ibrahim, M.; Elhafiz, R. Integrated Clinical Environment Security Analysis Using Reinforcement Learning. Bioengineering 2022, 9, 253. [Google Scholar] [CrossRef] [PubMed]
- Rigas, E.S.; Ramchurn, S.D.; Bassiliades, N. Managing electric vehicles in the smart grid using artificial intelligence: A survey. IEEE Trans. Intell. Transp. Syst. 2014, 16, 1619–1635. [Google Scholar] [CrossRef]
- Orseau, L.; Armstrong, M.S. Safely interruptible agents. In Proceedings of the Thirty-Second Conference on Uncertainty in Artificial Intelligence (UAI), Jersey City, NJ, USA, 25–29 June 2016; pp. 557–566. [Google Scholar]
- Okada, H. Evolutionary Reinforcement Learning of Neural Network Controller for Pendulum Task by Evolution Strategy. Int. J. Sci. Res. Comput. Sci. Eng. 2022, 10, 13–18. [Google Scholar]
- Kataria, V. Extending Specialized Systems to a Generic Approach of Game Playing. Int. J. Sci. Res. Comput. Sci. Eng. 2018, 6, 31–34. [Google Scholar]
- Chaudhary, S.; Datta, P. Survival Model of Prostate Cancer Patients Using Machine Learning Neural Networks Techniques. Int. J. Sci. Res. Comput. Sci. Eng. 2021, 9, 48–54. [Google Scholar]
- Mohan, P.; Sharma, L.; Narayan, P. Optimal Path Finding using Iterative SARSA. In Proceedings of the 2021 5th International Conference on Intelligent Computing and Control Systems (ICICCS), Madurai, India, 6–8 May 2021; pp. 811–817. [Google Scholar]
- Wen, S.; Jiang, Y.; Cui, B.; Gao, K.; Wang, F. A Hierarchical Path Planning Approach with Multi-SARSA Based on Topological Map. Sensors 2022, 22, 2367. [Google Scholar] [CrossRef] [PubMed]
- Jin, Z.; Ma, M.; Zhang, S.; Hu, Y.; Zhang, Y.; Sun, C. Secure State Estimation of Cyber-Physical System under Cyber Attacks: Q-Learning vs. SARSA. Electronics 2022, 11, 3161. [Google Scholar] [CrossRef]
- Yan, X.; Yan, K.; Rehman, M.U.; Ullah, S. Impersonation Attack Detection in Mobile Edge Computing by Levering SARSA Technique in Physical Layer Security. Appl. Sci. 2022, 12, 10225. [Google Scholar] [CrossRef]
- Ghiasi, M.; Niknam, T.; Wang, Z.; Mehrandezh, M.; Dehghani, M.; Ghadimi, N. A comprehensive review of cyber-attacks and defense mechanisms for improving security in smart grid energy systems: Past, present and future. Electr. Power Syst. Res. 2023, 215, 108975. [Google Scholar] [CrossRef]
- Immaniar, D.; Aryani, A.A.; Ula, S.Z. Challenges Smart Grid in Blockchain Applications. Blockchain Front. Technol. 2023, 2, 1–9. [Google Scholar] [CrossRef]
- Rouzbahani, H.M.; Karimipour, H.; Lei, L. Multi-layer defense algorithm against deep reinforcement learning-based intruders in smart grids. Int. J. Electr. Power Energy Syst. 2023, 146, 108798. [Google Scholar] [CrossRef]
- European Regulators Group for Electricity and Gas, Position Paper on Smart Grids-an ERGEG Public Consultation No. e09-eqs-30-04, Berlin, 2010. Available online: https://www.ceer.eu/documents/104400/-/-/c2479e88-a1fc-1751-bfa3-a37a710aa6f6 (accessed on 29 January 2023).
- Ammann, P.; Wijesekera, D.; Kaushik, S. Scalable, graph-based network vulnerability analysis. In Proceedings of the 9th ACM Conference on Computer and Communications Security, Washington, DC, USA, 18–22 November 2002; pp. 217–224. [Google Scholar]
- Wang, L.; Islam, T.; Long, T.; Singhal, A.; Jajodia, S. An attack graph-based probabilistic security metric. In Proceedings of the IFIP Annual Conference on Data and Applications Security and Privacy, London, UK, 13–16 July 2008; pp. 283–296. [Google Scholar]
- Ingols, K.; Lippmann, R.; Piwowarski, K. Practical attack graph generation for network defense. In Proceedings of the 22nd Annual Computer Security Applications Conference (ACSAC’06), Washington, DC, USA, 11–15 December 2006; pp. 121–130. [Google Scholar]
- Homer, J.; Varikuti, A.; Ou, X.; McQueen, M.A. Improving attack graph visualization through data reduction and attack grouping. In Proceedings of the International Workshop on Visualization for Computer Security, Cambridge, MA, USA, 15 September 2008; pp. 68–79. [Google Scholar]
- Bhatt, T.; Kotwal, C.; Chaubey, N. Survey on smart grid: Threats, vulnerabilities and security protocol. Int. J. Electr. Electron. Comput. Syst. 2017, 6, 340. [Google Scholar]
- Al-Turjman, F.; Abujubbeh, M. IoT-enabled smart grid via SM: An overview. Future Gener. Comput. Syst. 2019, 96, 579–590. [Google Scholar] [CrossRef]
- Aloul, F.; Al-Ali, A.R.; Al-Dalky, R.; Al-Mardini, M.; El-Hajj, W. Smart grid security: Threats, vulnerabilities and solutions. Int. J. Smart Grid Clean Energy 2012, 1, 1–6. [Google Scholar] [CrossRef]
- Ablon, L.; Bogart, A. Zero Days, Thousands of Nights: The Life and Times of Zero-Day Vulnerabilities and Their Exploits; Rand Corporation: Santa Monica, CA, USA, 2017. [Google Scholar]
- Shoshitaishvili, Y.; Wang, R.; Hauser, C.; Kruegel, C.; Vigna, G. Firmalice-Automatic Detection of Authentication Bypass Vulnerabilities in Binary Firmware; NDSS: San Diego, CA, USA, 2015; Volume 1, p. 1. [Google Scholar]
- Jha, A.V.; Appasani, B.; Ghazali, A.N.; Pattanayak, P.; Gurjar, D.S.; Kabalci, E.; Mohanta, D.K. Smart grid cyber-physical systems: Communication technologies, standards and challenges. Wirel. Netw. 2021, 27, 2595–2613. [Google Scholar] [CrossRef]
- Rummery, G.A.; Niranjan, M. On-Line Q-Learning Using Connectionist Systems; Department of Engineering, University of Cambridge: Cambridge, UK, 1994; Volume 37, p. 14. [Google Scholar]
- Sutton, R.S.; Barto, A.G. Reinforcement Learning: An Introduction; MIT Press: Cambridge, MA, USA, 2018. [Google Scholar]
- Knox, W.B.; Stone, P. Combining Manual Feedback with Subsequent MDP Reward Signals for Reinforcement Learning; AAMAS: London, UK, 2010; pp. 5–12. [Google Scholar]
- Aljohani, T.M.; Mohammed, O. A Real-Time Energy Consumption Minimization Framework for Electric Vehicles Routing Optimization Based on SARSA Reinforcement Learning. Vehicles 2022, 4, 1176–1194. [Google Scholar] [CrossRef]
- Mell, P.; Scarfone, K.; Romanosky, S. A Complete Guide to the Common Vulnerability Scoring System Version 2.0; FIRST-Forum of Incident Response and Security Teams: Cary, NC, USA, 2007; Volume 1, p. 23. [Google Scholar]
- Singh, U.K.; Joshi, C. Quantitative security risk evaluation using CVSS metrics by estimation of frequency and maturity of exploit. In Proceedings of the World Congress on Engineering and Computer Science, San Francisco, CA, USA, 19–21 October 2016; Volume 1, pp. 19–21. [Google Scholar]
- Mell, P.; Scarfone, K.; Romanosky, S. Common vulnerability scoring system. IEEE Secur. Priv. 2006, 4, 85–89. [Google Scholar] [CrossRef]
- Cheng, Y.; Deng, J.; Li, J.; DeLoach, S.A.; Singhal, A.; Ou, X. Metrics of security. In Cyber Defense and Situational Awareness; Springer: Cham, Switzerland, 2014; pp. 263–295. [Google Scholar]
- National Vulnerability Database. Common Vulnerability Scoring System Calculator. Available online: https://nvd.nist.gov/vuln-metrics/cvss/v3-calculator (accessed on 25 November 2022).

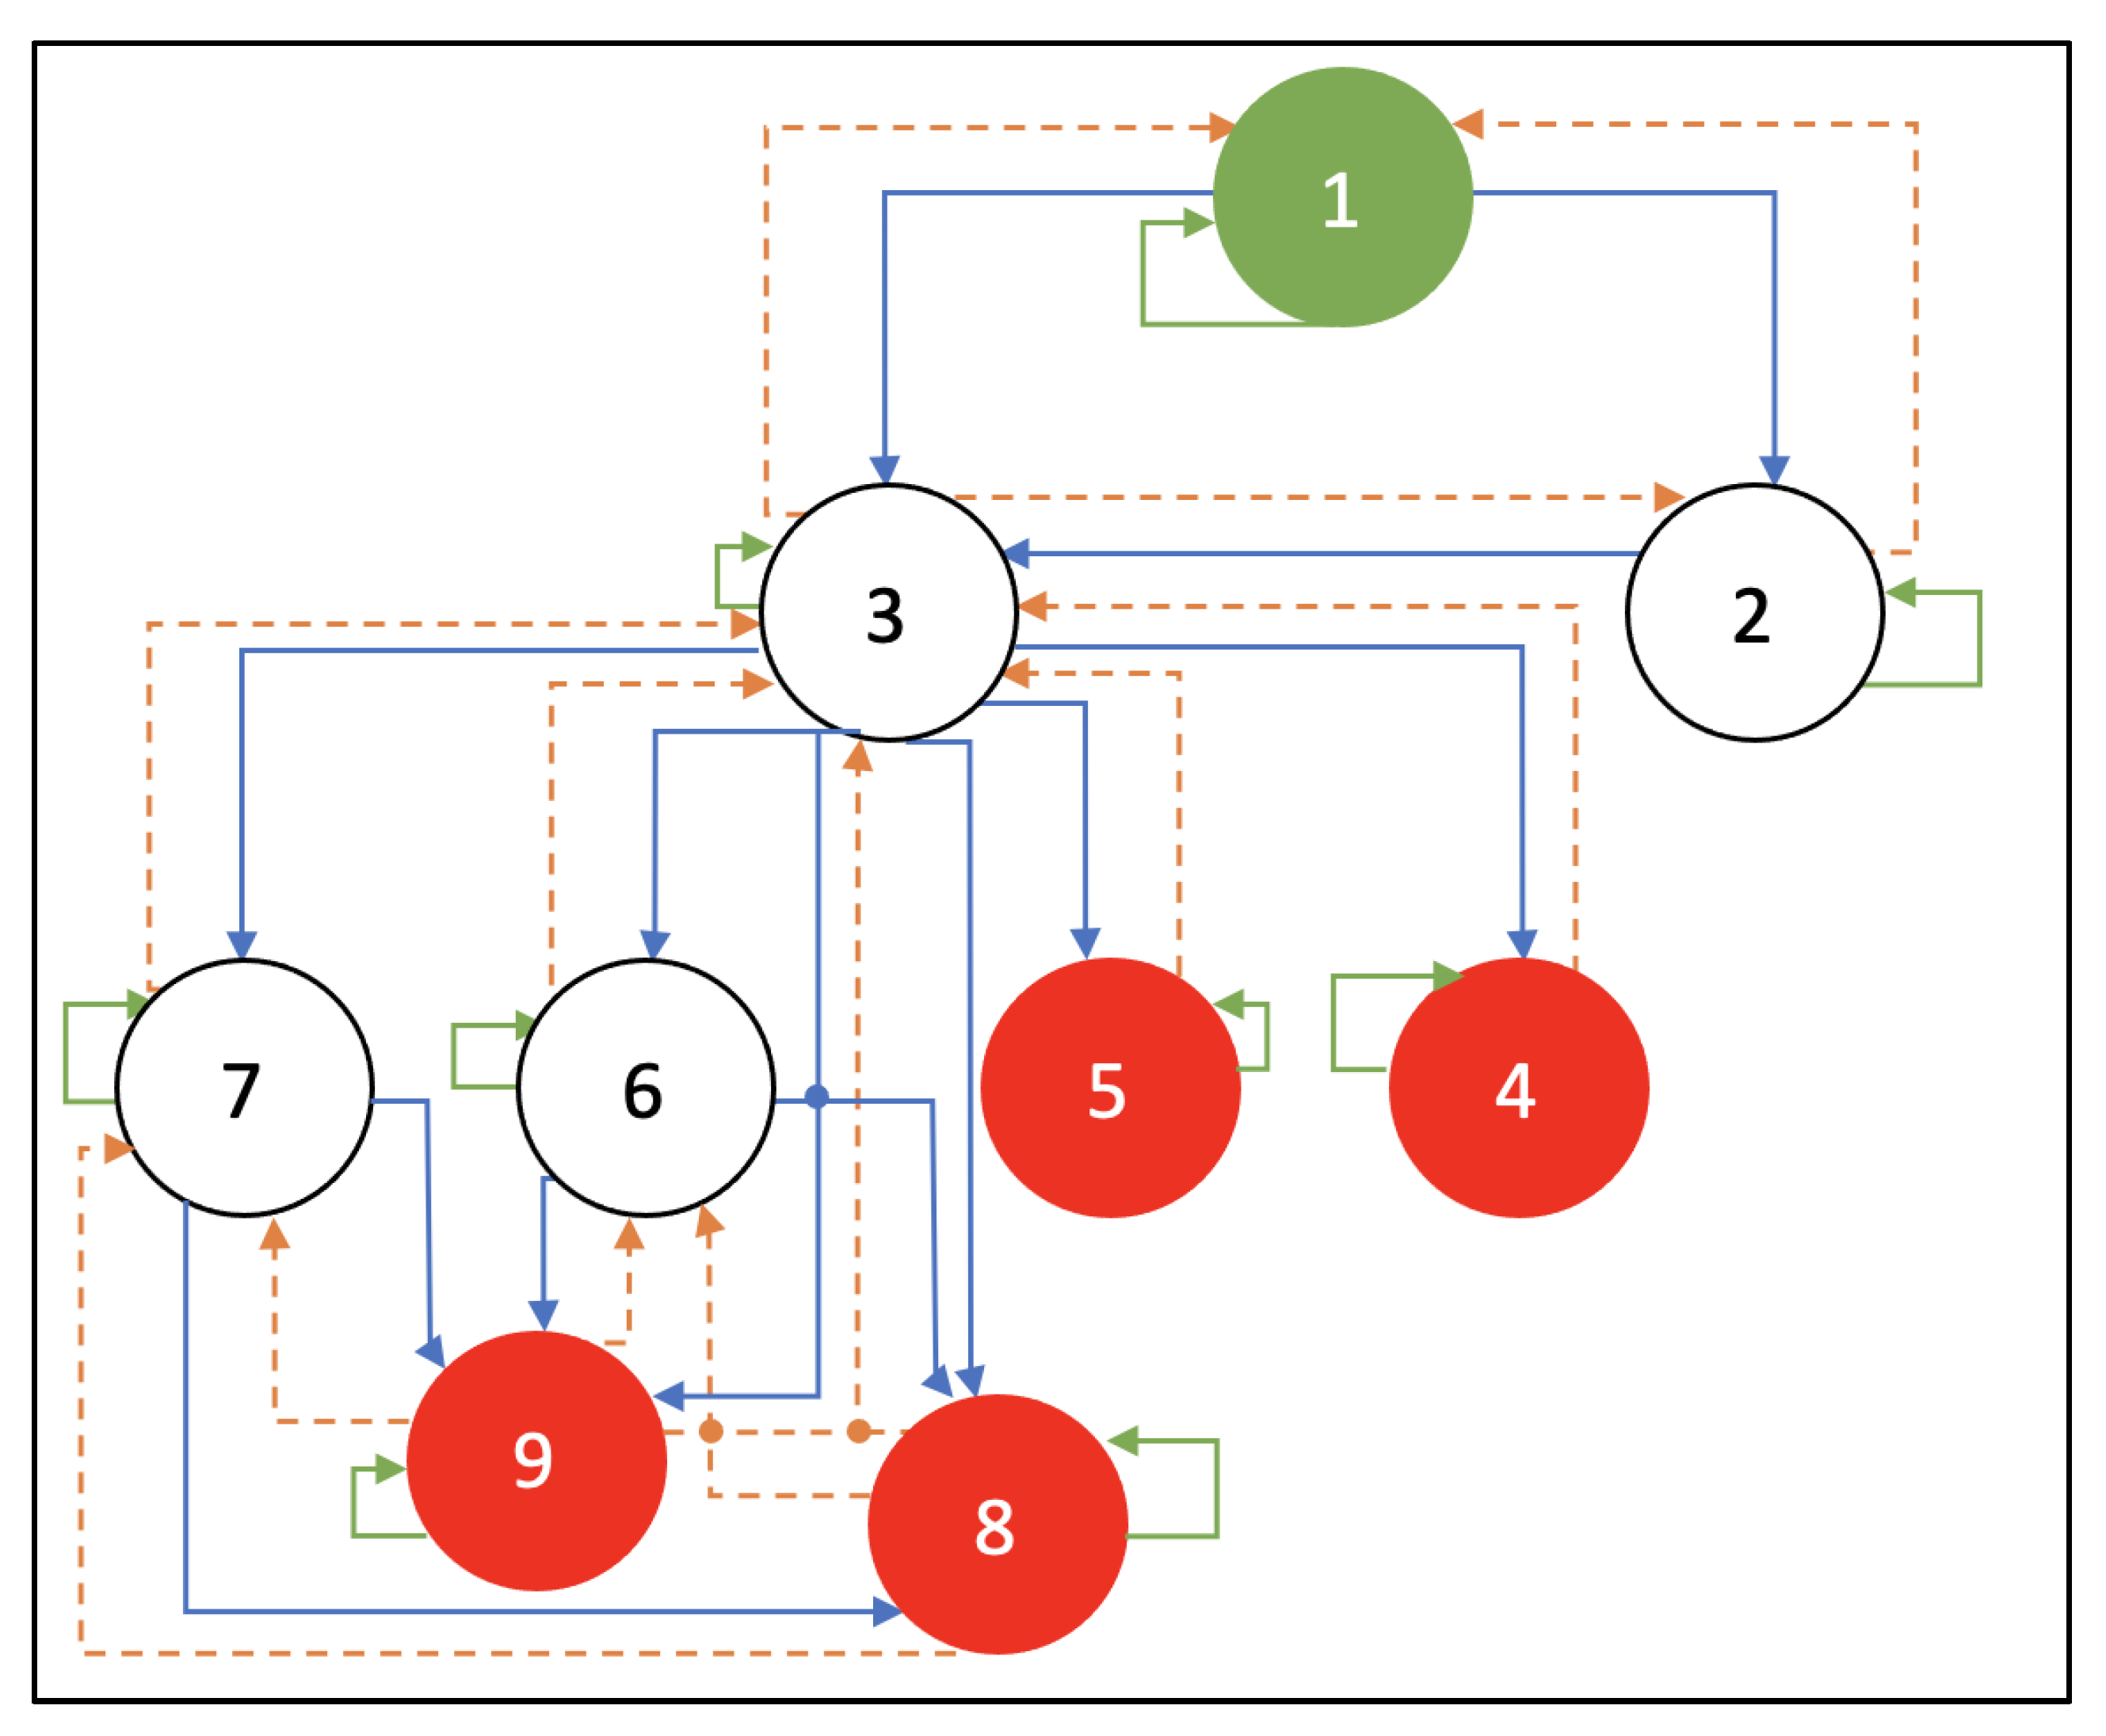

| R | 1 | 2 | 3 | 4 | 5 | 6 | 7 | 8 | 9 |
|---|---|---|---|---|---|---|---|---|---|
| 1 | −1 | 3.4 | 4.7 | −1 | −1 | −1 | −1 | −1 | −1 |
| 2 | 0 | −1 | 4.8 | −1 | −1 | −1 | −1 | −1 | −1 |
| 3 | 0 | 0 | −1 | 8.1 | 8.1 | 8.7 | 8.7 | 10 | 10 |
| 4 | −1 | −1 | 0 | −1 | −1 | −1 | −1 | −1 | −1 |
| 5 | −1 | −1 | 0 | −1 | −1 | −1 | −1 | −1 | −1 |
| 6 | −1 | −1 | 0 | −1 | −1 | −1 | −1 | 10 | 10 |
| 7 | −1 | −1 | 0 | −1 | −1 | −1 | −1 | 10 | 10 |
| 8 | −1 | −1 | 0 | −1 | −1 | 0 | 0 | −1 | −1 |
| 9 | −1 | −1 | 0 | −1 | −1 | 0 | 0 | −1 | −1 |
Disclaimer/Publisher’s Note: The statements, opinions and data contained in all publications are solely those of the individual author(s) and contributor(s) and not of MDPI and/or the editor(s). MDPI and/or the editor(s) disclaim responsibility for any injury to people or property resulting from any ideas, methods, instructions or products referred to in the content. |
© 2023 by the authors. Licensee MDPI, Basel, Switzerland. This article is an open access article distributed under the terms and conditions of the Creative Commons Attribution (CC BY) license (https://creativecommons.org/licenses/by/4.0/).
Share and Cite
Ibrahim, M.; Elhafiz, R. Security Analysis of Cyber-Physical Systems Using Reinforcement Learning. Sensors 2023, 23, 1634. https://doi.org/10.3390/s23031634
Ibrahim M, Elhafiz R. Security Analysis of Cyber-Physical Systems Using Reinforcement Learning. Sensors. 2023; 23(3):1634. https://doi.org/10.3390/s23031634
Chicago/Turabian StyleIbrahim, Mariam, and Ruba Elhafiz. 2023. "Security Analysis of Cyber-Physical Systems Using Reinforcement Learning" Sensors 23, no. 3: 1634. https://doi.org/10.3390/s23031634
APA StyleIbrahim, M., & Elhafiz, R. (2023). Security Analysis of Cyber-Physical Systems Using Reinforcement Learning. Sensors, 23(3), 1634. https://doi.org/10.3390/s23031634