Abstract
The slow dynamic response of a proton exchange membrane fuel cell (PEMFC) to high load change during deficit periods must be considered. Therefore, integrating the hybrid system with energy storage devices like battery storage and/or a supercapacitor is necessary. To reduce the consumed hydrogen, an energy management strategy (EMS) based on the white shark optimizer (WSO) for photovoltaic/PEMFC/lithium-ion batteries/supercapacitors microgrid has been developed. The EMSs distribute the load demand among the photovoltaic, PEMFC, lithium-ion batteries, and supercapacitors. The design of EMSs must be such that it minimizes the use of hydrogen while simultaneously ensuring that each energy source performs inside its own parameters. The recommended EMS-based-WSO was evaluated in regard to other EMSs regarding hydrogen fuel consumption and effectiveness. The considered EMSs are state machine control strategy (SMCS), classical external energy maximization strategy (EEMS), and optimized EEMS-based particle swarm optimization (PSO). Thanks to the proposed EEMS-based WSO, hydrogen utilization has been reduced by 34.17%, 29.47%, and 2.1%, respectively, compared with SMCS, EEMS, and PSO. In addition, the efficiency increased by 6.05%, 9.5%, and 0.33%, respectively, compared with SMCS, EEMS, and PSO.
1. Introduction
Microgrids offer a potential solution for integrating small-scale renewable energy sources and loads along with energy storage systems and other non-renewable sources [1]. Many issues, including finance and cost concerns, are debated in multiple international seminars and meetings. The main topics of these seminars are innovative efforts and funding feasibility. The development of several wireless and IoT technologies improved the performance of microgrids [2,3]. Manufacturers today are also using microgrids’ capabilities, mainly to lessen their dependency on long-distance distribution lines and, consequently, to cut down on transmission losses [4]. The main benefits and challenges of the microgrid are reported in Table 1.

Table 1.
Microgrid benefits and challenges.
A microgrid can be customized to meet each customer’s individual needs by mixing various components, offering the best technical and financial options [5]. These systems meet energy demands for electrical and/or thermal energy typically supplied by the natural gas or electric utility company. Microgrid components can sometimes be found in the following list [6]:
- ○
- Distributed energy resources (DERs): include traditional generators like Gensets or natural gas generators that mechanically transform fuel into electricity and heat, as well as renewable energy technologies, including solar and wind power, which operate on natural renewable resources.
- ○
- Energy storage systems (ESSs): electrochemical (batteries), mechanical (flywheels), and thermal (hot water) systems are examples of systems. This energy can originate from renewable overproduction or be charged when energy is cheaper for peak periods.
- ○
- Loads: the user loads can be classified as industrial, residential, commercial, and electric vehicles (EVs). In addition, the loads can be classified according to their nature as crucial and non-crucial loads or controllable and non-controllable loads.
- ○
- Monitoring and Control systems: monitoring systems are required in data acquisition and transmission, whereas intelligent controls are implemented to improve electrical efficiency and cost performance by automatically directing supply to the most efficient available source.
Modularity, scalability, energy management, and resource balancing are essential characteristics of a successful microgrid. The DERs can deliver high performance regardless of the site’s conditions using a proper energy management strategy, whether off-grid or on-grid [7].
PEMFC transforms chemical reactions to DC power. It earned great consideration thanks to its simple size, quietness, and fewer effects on the atmosphere. Several applications, such as trains, aircraft, and electric vehicles, have used PEMFC in recent years [8]. However, the PEMFC has restrictions on insufficient power density and postponed dynamic response. Therefore, the installation of either battery storage (BSs) or supercapacitors (SCs) to build a hybrid system may improve system performance [9,10]. It is critical to have an energy-management plan into a hybrid-based system that combines storage systems as well as photovoltaic (PV) and wind turbines are examples of sources of clean energy (WT) and PEMFCs (EMSs) [10]. The remaining energy here between diverse sources is controlled by the EMSs. Plus, they facilitate proper production and lengthen the authentication system.
In the literature, the EMS can be classified into three major categories: rule-based, artificial intelligence, and optimization-based strategies [11,12]. Rule-based strategies can be classified into two subcategories: deterministic and Boolean logic strategies. Furthermore, artificial intelligence can be classified into three subcategories: fuzzy logic, neural network, and Machin learning strategies. Finally, optimization-based strategies, which aim to minimize/maximize the objective function. The objective function might include emissions, costs, energy savings, device deterioration, and global efficiency [13]. There are two subcategories for optimization-based strategies: online and offline. The offline optimization, including dynamic programming (DP) [14,15], nonlinear programming (NLD) [16], stochastic dynamic control strategy (SDP) [17], and genetic algorithm (GA) [18], are the most widely utilized to manage the power flow in the DCMG. The existence of all load profiles is required. Hence, a large amount of data is involved. This makes their implementation extremely difficult. Whereas in the online optimization, the objective function depends only on the actual states of the system [19]. They have more restricted processing and higher real-time performance. The SoC of the storage devices is taken into account, but global optimization is not possible. The equivalent consumption minimization strategy (ECMS), model predictive control (MPC) [20], and the external energy maximization strategy (EEMS) are examples of these techniques.
The main contribution of this work is proposing, for the first time, an efficient EMS based on white shark optimizer (WSO) for photovoltaic/PEMFC/lithium-ion batteries/supercapacitors (PV/PEMFC/BSs/SCs) microgrid. The two critical aspects are minimizing hydrogen consumption and improving the hybrids’ system performance. To prove the superiority of the proposed strategy, three EMSs are considered: state machine control strategy (SMCS), classical methodology for maximizing external power supply (EEMS), and optimized EEMS-based particle swarm optimization (PSO).
2. Modeling of the PV/PEMFC/BSs/SCs Hybrid System
This part deals with the description and modeling of the hybrid renewable energy system component from a photovoltaic array, fuel cell, battery storage, and supercapacitor. The photovoltaic array generates and injects variable energy into the load under different meteorological conditions. Due to its low electricity production, SCs are employed to maintain and absorb oscillating power struggles as well as transient/fluctuating system changes. In addition to having a very large number of cycles with excellent results and no deterioration, SCs are efficient in extremely quick charging and discharges [21]. The battery is used to store the electricity produced by the solar generator so that it may be accessed at a later point in time, if necessary. However, because of its high energy density, it seems to sustain continual power adjustments and only provide temporary power in urgent situations.
2.1. Modeling of PV Array
A single-diode electrical model is shown in Figure 1. The electrical model consists of a photocurrent parallel to a diode, a shunt resistance, and a series resistance. Based on KVL, the equations that control this circuit is presented as [22]:
Rsh and Rs represent shunt and series resistances, respectively. n is the ideality factor, I0 is the saturation current, and Vth is the thermal voltage given by the following relation:
where q seems to be the electron’s charge, Tc is the temperature of the cell, and k is the Boltzmann constant.

Figure 1.
Equivalent circuit of the solar cell model.
The photocurrent is represented as:
where Tc and Tr are the experimental and benchmark temperatures, α is the temperature coefficient, and G is the solar radiation. ISC is the short circuit current in A. In sum, considering series and parallel panels, the current produced by the PV array can be estimated as follows:
where Vout is the voltage and Iout is the current of the photovoltaic array, respectively. NS and NP are the number of series and parallel cells connected in photovoltaic arrays.
2.2. Battery Storage Model
In industry, there are different types of batteries. The model adopted in the current case analysis is a lithium-ion relying on the Thevenin representation [23], which is demonstrated in Figure 2. Since lithium-ion batteries have a large storage capacity, a high proportion of operating voltage, and a prolonged cycle life, they are frequently employed due to their benefits over other energy storage technologies. The presented electrical model is among the most popular energy storage technologies. It contains an internal resistance with a parallel RC network. The open-circuit voltage Uoc, intrinsic resistances, and analogous capacitor values are the three basic elements that make up the model [24]. The intrinsic impedances are made up of the polarization resistance RTh and the conductive resistance R0. The battery’s charging and discharging dynamics are represented by the roughly comparable capacitance CTh. UTh denotes the voltage above CTh.
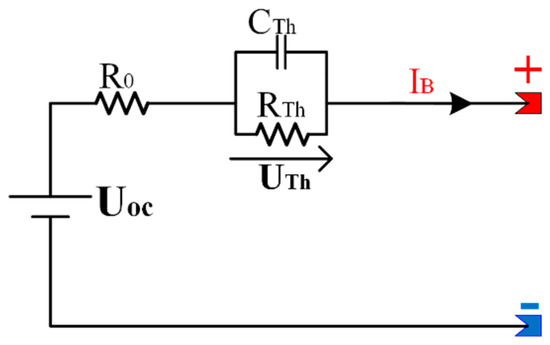
Figure 2.
Equivalent circuit of Li-ion battery Model.
The following equation is a characterization of the supply voltage:
2.3. PEMFC Mathematical Model
As shown in Figure 3 [25], a fuel cell includes an anode and a cathode, as well as an electrolyte. At the anode, a platinum catalyst splits the hydrogen atom into protons and electrons. While the electrons receive current from an externally applied to produce the FC output voltage, the protons reach the cathode. At the cathode, the protons and electrons are once again coupled with oxygen to produce heat and water.
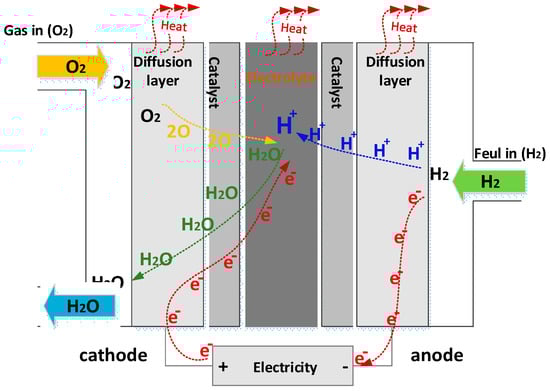
Figure 3.
Structure of PEMFC.
The following is a presentation of the FC chemical reactions [25]:
Inside the PEMFC, there are three different types of losses: activation, ohmic, and concentration losses. Figure 4 depicts the fluctuation of PEMFC voltage with cell current density [26].
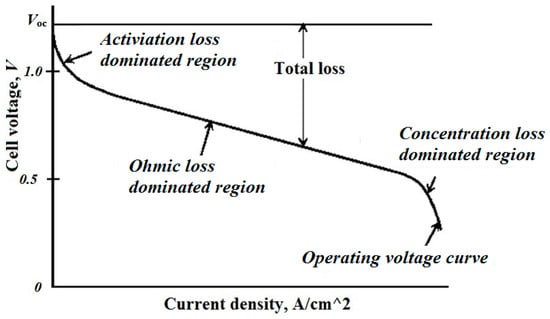
Figure 4.
Voltage against current density characteristics.
As a result, the output voltage of the PEMFC is the sum of four voltage provided by thermodynamic effect as ENernst, the activation voltage losses zone creating the Vact, the ohmic voltage losses Vohm come from the ohmic loss dominated region due to the ionic and electronic resistance, the last region generated the concentration voltage losses, Vcon, due to the mass transport, and ncell percent is the number of connected cells in PEMFC. In principle, the true voltage output of a fuel cell may be calculated by initiating with both the thermally anticipated voltage and removing the different voltage fluctuation inefficiencies, as shown below:
Each element in Equation (1) is recognized and analyzed separately as follows:
where T represents the cell temperature, and E0 = 1.229 is the thermodynamic voltage of a conventional bidirectional FC. PH2 and PO2 are the partial pressures of hydrogen and oxygen, respectively.
The reactant concentration variations at the electrode surface cause a voltage decrease in accumulation, which is characterized as:
where b represents the concentrations degradation constant and Imax represents the rated current destiny.
The activation voltage loss is determined as follows [27]:
where ξi (i = 1, 2, 3, 4) symbolizes the semi-empirical parameters of the FC derived from the fluid mechanic, thermodynamic, and electrochemistry, and CO2 illustrates the oxygen concentration,
RM stands for identical membrane resistance to proton conduction, and ρM and l are both the thickness of the membrane, and λ presents membrane water content.
The equivalent resistance of the FC causes the ohmic voltage loss, and it can be expressed as:
where Rc is the equivalent resistance representing the concentration processes.
The stack terminal voltage of the FC is given by the number of fuel cells interconnected in series:
2.4. Supercapacitor
The capacitance used in the SC model represents how the SC performs when being charged and discharged. A series resistance is analogous to those same resistances for both charging and discharging [28]. Figure 5 depicts the related system model of SC. The behavior of the SC is represented by the Stern model, which is available in the MATLAB/Simulink [29].
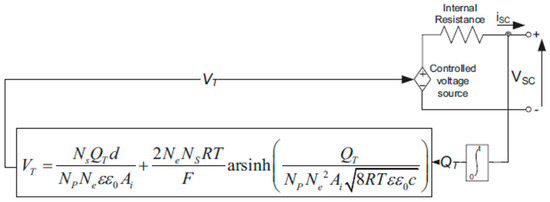
Figure 5.
Supercapacitor equivalent circuit model.
Once resistive losses are taken into account, the SC output voltage may be represented as:
with,
where CT denotes the sum of the capacitances (F), QT represents the entire amount of electricity charged, RSC denotes intrinsic resistance (ohm), iSC is the SC current (A), NS is the number in series, NP denotes the number in parallel, CH is the Helmholtz capacitance (F), CGC represents the capacitance of Gouy-Chapman (F), Ne is the total number of layers of the electrodes, ε and ε0 are the permittivity values of the electrolyte material and empty area, Ai is the space between both the electrodes and the electrolyte (m2), d is the length of the Helmholtz layer (m), Qc would be the electric charge of the cell, C is just the molar concentration (mol m−3).
2.5. Specifications of the Hybrid System
The considered hybrid power system is shown in Figure 6. It includes a PV system, PEMFC, BSs, and an SC to supply the load demand regarding high fluctuations. The perturb and observed maximum power point tracking maximizes the PV power. The specifications of the hybrid system are presented in Table 2.
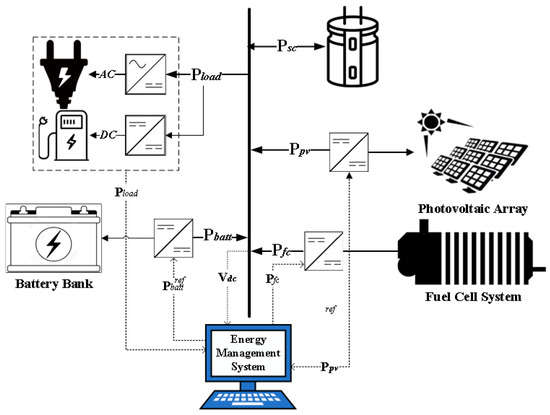
Figure 6.
Configuration of hybrid PV/PEMFC/BSs/SCs system.
Table 2.
The elements of a hybrid system’s electrical characteristics.
3. Proposed Energy Management Strategies
The system’s efficiency depends greatly on the development of MG energy management, which is essential [30,31]. The necessary power by the load in a hybrid system not supplied by the PV array is known as net power (). To provide conversion efficiency, the EMS instructions might control the PEMFC, BSs, and SCs.
To prevent reactive depletion, however, the FC dynamics must be controlled. In the case study, numerous EMSs are considered, including external energy optimization methodologies, state engine control, standard EEMS, and improved EMMS-based WSO.
3.1. Equivalent Consumption Minimization Methodology
The ECMS aims to minimize fuel consumption while maintaining a battery SOC within acceptable bounds. The accuracy of the empirical assessment of the associated fuel economy determines how successfully the ECMS performs, as stated in [32]. The related objective function is presented as follows:
wherein CBat denotes the battery energy usage in relation to the given energy and μ is a constant (0.6). This equation can be defined as follows:
wherein μ is indeed a constant (0.6), and CBat reflects the battery fuel efficiency in terms of the energy supplied.
The following equation is used to compute the FC output:
Figure 7 presents an illustration of the ECMS system.
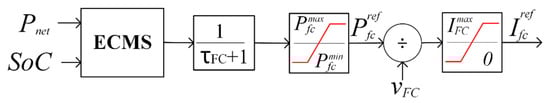
Figure 7.
Layout of ECMS.
3.2. State Machine Control Management
An EMS depending on switching rules is designated SMC [33]. In SMC, the operational state is chosen in proportion to the inputs: ΔP and battery SOC. The battery is charged or discharged depending on the status of its inputs, as shown in Figure 8.
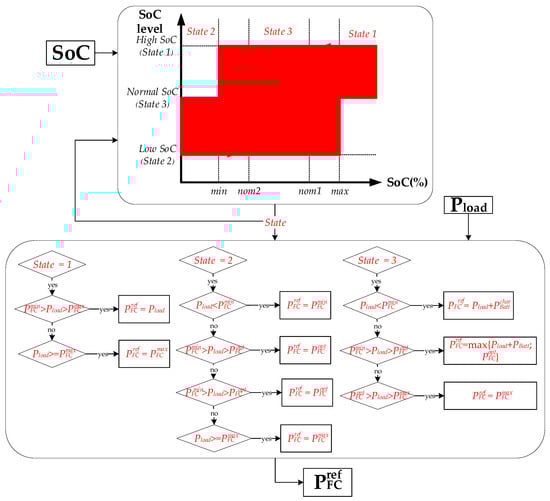
Figure 8.
The scheme of SMC control.
The numerical values of parameters addressed in SMCS are:
- min = 30%; nom2 = 40%; nom1 = 85%; max = 90%;
- Pfcmin = 850; Pfcmax = 8800; Pfcopt = 1500; PBattmax = 3400 W;
3.3. Conventional EEMS
The basic purpose of EEMS is to supply the minimum fuel consumption possible while respecting battery and DC bus capacitor power constraints [24]. The fitness function’s objective is to increase the energy supplied by the BS and SC:
where T represents the sample period, and V indicates the charge/discharge voltage. This equation is confirmed by the following optimization:
where Vbatt and Qbatt are the standard voltage and capacitance of the battery, respectively.
3.4. Optimized EMMS-Based WSO
The “fmin” function is a component of the standard EEMS’s programming code [34]. Consequently, a new white shark optimizer is used in place of the function “fmin” to improve the efficiency of EEMS (WSO). The decision factors throughout the optimization procedure are FC power, PFC, battery power, Pbatt, and battery SOC.
The lower and upper limits of the decision variables are chosen as indicated in Table 3.
Table 3.
lower and upper limits.
Figure 9 shows the layout of optimized EMMS-based WSO.
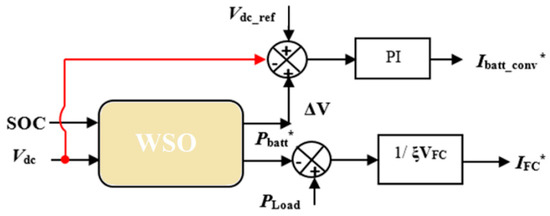
Figure 9.
Optimized EEMS-based WSO.
WSO is now a revolutionary meta-heuristic optimization tool influenced by great white shark attributes, such as their exceptional hearing and sense of smell when navigating and foraging. The important steps of this algorithm are listed below [35]:
Movement speed towards prey. When a white shark recognizes the location of prey reliant on the waves created by the prey’s activity, it approaches in the following way:
where the index i (i = 1, 2, …, n) expresses the white shark order in a population of size n, s represents the speed, Pgbest reflects the highest strategic standing vector, p is the ith white shark’s present position vector, Pbest is the current best-achieved position, c1 and c2 are two numbers at random from the range [0, 1], p1, p2, and u are calculated according to the following equations:
Movement towards optimal prey. After they presumably detect the waves caused by the target’s movement or when they see the target’s movements or smell the fragrance of the prey, white sharks continually travel toward their prey. The prey either escapes or leaves its location to search for food. However, its scent in that position is still there. Accordingly, the white shark updates its position as follows:
where “-” is not a sign, a and b represent one-dimensional binary vectors, f is the frequency of the wavy motion, high and low are the upper and lower random search boundaries, and mv is described as:
where a0 and a1 are constants.
Movement towards the white shark: this phase can be modeled as:
where a0 and a1 are constants.
Movement towards the white shark: this phase can be modeled as:
wherein r1, r2, and r3 represent the random values ranging in [0, 1], and D expresses the distance between the target and the shark.
Fish school behavior: The formula for this phase is provided as follows:
The main procedure of WSO is provided in Figure 10.
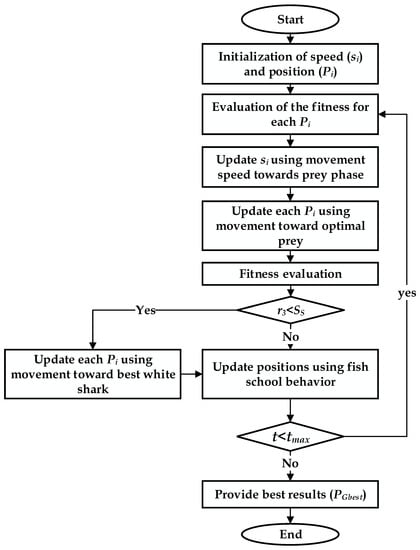
Figure 10.
Flowchart for WSO.
4. Results and Discussion
The suggested optimized EEMS-based WSO is used to minimize the consumed hydrogen of a hybrid power system shown in Figure 6. The simulation software model’s S-function incorporates the optimized EMMS-based WSO, which is constructed and provided with the following two input variables: the battery SOC and the load profile, whereas the output, the FC and battery banks, are regulated currents. The optimized EMMS-based WSO is compared with conventional EEMS, SMCS, and PSO. Figure 10 demonstrates the load demand that was used (red curve). As presented in Figure 11, at a time of 5 s no load demand is required, and the PEMS starts recharging the BSs with its optimal power (about 1 kW). At 40 s, with no PV power, the extra load demand required is instantly given by the SCs due to its fast dynamics, while the PEMFC power increases gradually. At 45 s, the SCs are discharged below the reference DC link voltage of 270 V, as presented in Figure 12, and the BSs begin delivering power to adjust the DC link voltage back to 270 V. At 48.5 s, the SCs voltage reaches 270 V, and the BSs decreases its power gradually to zero. The PEMFC provides the total demand and continues to recharge the SCs. At 60 s, a fast change in load occurs, and the SCs provide the extra transient demand while the PEMFC power increases gradually. The PV has not yet delivered any power; this changes at t = 100 s. Throughout this time, the energy generated by the PV increases to contribute to load-shaving while the excess electricity is used to charge the battery and SC. Likewise, when the PV power has a value, the PEMFC power is zero. At t = 250 s, when the battery and SC are simultaneously in the charging mode, the PV is shut off, and the PEMFC returns to share a large amount of load power.
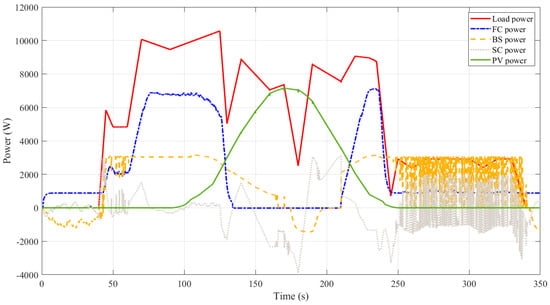
Figure 11.
Dynamic produced power by different hybrid system components using WSO.
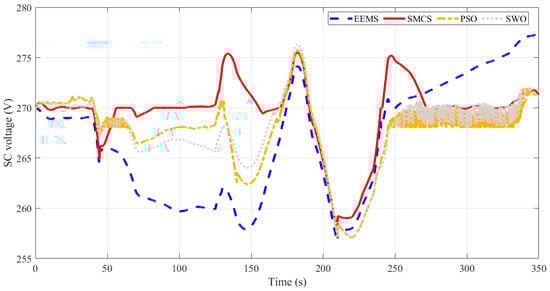
Figure 12.
Time response of SC voltage obtained using different EMSs.
Table 2 and Figure 13 present the consumed hydrogen using different EMSs. The results demonstrated the superiority of optimized EEMS-based WSO compared to EEMS, SMCS, and PSO. The EEMS-based WSO reduces hydrogen consumption to a best-obtained value of 14.74 gm, followed by the PSO with 15.05 gm, and the traditional SMCS with a worst-obtained value of 22.39 gm. It is crucial to determine each approach’s efficiency for further research; you may do this by dividing the total power consumed by a PV array, PEMFC, BS, or SC by the total power generated by all of these devices together. The accuracy of each optimization method is shown in Table 4, with the optimized EEMS-based WSO achieving the highest efficiency of 79.24% and the EEMS achieving the lowest efficiency of 72.41%.
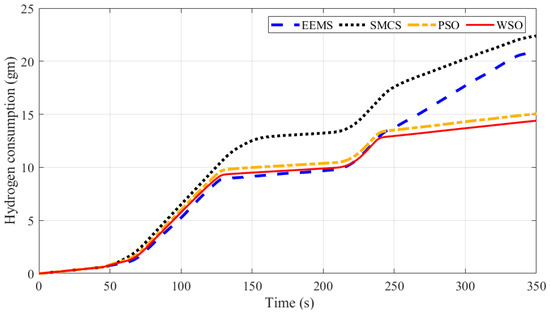
Figure 13.
Time response of hydrogen consumption in gm obtained via each optimizer.
Table 4.
Performance of the planned EMS-PPA in comparison to alternative methods.
A comparison between different EMSs is presented in Figure 14. Thanks to the proposed EEMS-based WSO, hydrogen consumption has been reduced by 34.17%, 29.47%, and 2.1%, respectively, compared with SMCS, EEMS, and PSO. In addition, the efficiency has been increased by 6.05%, 9.5%, and 0.33%, respectively, compared with SMCS, EEMS, and PSO.
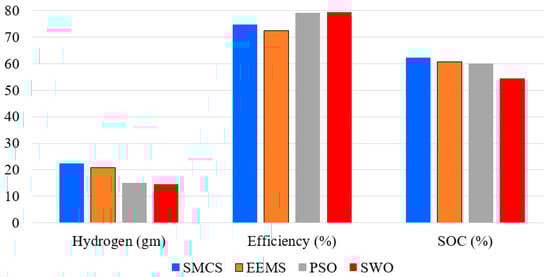
Figure 14.
Comparison between different EMSs.
5. Conclusions
A new energy management strategy (EMS) using the white shark optimizer technique (WSO) has been proposed to optimally distribute the load demand between the sources in a hybrid PV/PEMFC/BSs/SCs microgrid. The optimized EMS aims to minimize the consumed hydrogen consumption of PEMFC. The optimized EMS avoids the defects of the conventional approach for maximizing external energy (EEMS). The improved EEMS-based WSO is evaluated to EEMS, state machine control (SMCS), and particle swarm optimization (PSO). Two main factors are considered, hydrogen fuel consumption and efficiency. The results reveal that the improved EEMS-based WSO was preferable. Hydrogen consumption has been reduced by 34.17%, 29.47%, and 2.1%, respectively, compared with SMCS, EEMS, and PSO. In addition, the efficiency has been increased by 6.05%, 9.5%, and 0.33%, respectively, compared with SMCS, EEMS, and PSO.6.
Author Contributions
Conceptualization, H.R.; methodology, H.R. and H.A.; software, H.R. and M.L.; formal analysis, H.R. and H.A.; writing—original draft preparation, H.A., H.R., M.L., I.A.M. and S.A.-S.; writing—review and editing, H.A., H.R., M.L., I.A.M. and S.A.-S.; supervision, H.A.; project administration H.A.; funding acquisition, H.A. All authors have read and agreed to the published version of the manuscript.
Funding
The authors extend their appreciation to the Deputyship for Research & Innovation, Ministry of Education, Saudi Arabia, for funding this research work through project number (IFPRC-78-135-2020) and King Abdulaziz University, DSR, Jeddah, Saudi Arabia.
Institutional Review Board Statement
Not applicable.
Informed Consent Statement
Not applicable.
Data Availability Statement
Not applicable.
Conflicts of Interest
The authors declare no conflict of interest.
References
- Srinivas, N.P.; Modi, S. A Comprehensive Review of Microgrids, Control Strategies, and Microgrid Protection Schemes. ECS Trans. 2022, 107, 13345–13370. [Google Scholar] [CrossRef]
- Giraldo, J.; Parvania, M. IoT-Enabled Decentralized Moving Target Defense for Enhancing Privacy in Microgrid Control. In Proceedings of the 2022 IEEE Power & Energy Society Innovative Smart Grid Technologies Conference (ISGT), New Orleans, LA, USA, 24–28 April 2022; pp. 1–5. [Google Scholar] [CrossRef]
- Karabanov, S.M.; Bezrukikh, P.P.; Belykh, S.S.; Suvorov, D.V.; Loban, O.V.; Slivkin, E.V. Study of the Possibility of IoT Use in a Microgrid on the Basis of Renewable Energy Sources. In Proceedings of the 2022 ELEKTRO, Krakow, Poland, 23–26 May 2022; pp. 1–5. [Google Scholar] [CrossRef]
- Hirsch, A.; Parag, Y.; Guerrero, J. Microgrids: A review of technologies, key drivers, and outstanding issues. Renew. Sustain. Energy Rev. 2018, 90, 402–411. [Google Scholar] [CrossRef]
- Villanueva-Rosario, J.A.; Santos-García, F.; Aybar-Mejía, M.E.; Mendoza-Araya, P.; Molina-García, A. Coordinated ancillary services, market participation and communication of multi-microgrids: A review. Appl. Energy 2022, 308, 118332. [Google Scholar] [CrossRef]
- Wu, Y.; Wu, Y.; Cimen, H.; Vasquez, J.C.; Guerrero, J.M. Towards collective energy Community: Potential roles of microgrid and blockchain to go beyond P2P energy trading. Appl. Energy 2022, 314, 119003. [Google Scholar] [CrossRef]
- Gayo-Abeleira, M.; Santos, C.; Sánchez, F.J.R.; Martín, P.; Jiménez, J.A.; Santiso, E. Aperiodic two-layer energy management system for community microgrids based on blockchain strategy. Appl. Energy 2022, 324, 119847. [Google Scholar] [CrossRef]
- Nassef, A.M.; Abdelkareem, M.A.; Alami, A.H.; Fathy, A. Comparison among various energy management strategies for reducing hydrogen consumption in a hybrid fuel cell/supercapacitor/battery system. Int. J. Hydrogen Energy 2021, 46, 6110–6126. [Google Scholar]
- Cao, Y.; Li, Y.; Zhang, G.; Jermsittiparsert, K.; Nasseri, M. An efficient terminal voltage control for PEMFC based on an improved version of whale optimization algorithm. Energy Rep. 2020, 6, 530–542. [Google Scholar] [CrossRef]
- Fathy, A.; Yousri, D.; Alanazi, T.; Rezk, H. Minimum hydrogen consumption based control strategy of fuel cell/PV/battery/supercapacitor hybrid system using recent approach based parasitism-predation algorithm. Energy 2021, 225, 120316. [Google Scholar] [CrossRef]
- Chowdhury, S.; Chowdhury, S.P.; Crossley, P. Microgrids and Active Distribution Networks; Institution of Engineering and Technology: London, UK, 2009. [Google Scholar] [CrossRef]
- Ferahtia, S.; Djeroui, A.; Mesbahi, T.; Houari, A.; Zeghlache, S.; Rezk, H.; Paul, T. Optimal Adaptive Gain LQR-Based Energy Management Strategy for Battery–Supercapacitor Hybrid Power System. Energies 2021, 14, 1660. [Google Scholar] [CrossRef]
- Wang, X.; Huang, Y.; Guo, F.; Zhao, W. Energy Management Strategy based on Dynamic Programming Considering Engine Dynamic Operating Conditions Optimization. In Proceedings of the 2020 39th Chinese Control Conference, Shenyang, China, 27–29 July 2020; IEEE: New York, NY, USA, 2020; pp. 5485–5492. [Google Scholar] [CrossRef]
- Zhang, X.; Ren, X.; Zheng, C.; Yuan, Y.; Diao, L. Dynamic Programming in Energy Management Strategy for Optimizing Multi-energy Drive System. Lect. Notes Electr. Eng. 2020, 638, 471–480. [Google Scholar] [CrossRef]
- Panwar, L.K.; Konda, S.R.; Verma, A.; Panigrahi, B.K.; Kumar, R. Operation window constrained strategic energy management of microgrid with electric vehicle and distributed resources. IET Gener. Transm. Distrib. 2017, 11, 615–626. [Google Scholar] [CrossRef]
- Leroy, T.; Vidal-Naquet, F.; Tona, P. Stochastic Dynamic Programming based Energy Management of HEV’s: An Experimental Validation. IFAC Proc. Vol. 2014, 47, 4813–4818. [Google Scholar] [CrossRef]
- Lü, X.; Wu, Y.; Lian, J.; Zhang, Y.; Chen, C.; Wang, P.; Meng, L. Energy management of hybrid electric vehicles: A review of energy optimization of fuel cell hybrid power system based on genetic algorithm. Energy Convers. Manag. 2020, 205, 112474. [Google Scholar] [CrossRef]
- Shi, W.; Li, N.; Chu, C.-C.; Gadh, R. Real-Time Energy Management in Microgrids. IEEE Trans. Smart. Grid. 2017, 8, 228–238. [Google Scholar] [CrossRef]
- Lei, Z.; Qin, D.; Hou, L.; Peng, J.; Liu, Y.; Chen, Z. An adaptive equivalent consumption minimization strategy for plug-in hybrid electric vehicles based on traffic information. Energy 2020, 190, 116409. [Google Scholar] [CrossRef]
- Huang, Y.; Wang, H.; Khajepour, A.; He, H.; Ji, J. Model predictive control power management strategies for HEVs: A review. J. Power Sources 2017, 341, 91–106. [Google Scholar] [CrossRef]
- Rana, M.; Uddin, M.; Sarkar, R.; Shafiullah, G.; Mo, H.; Atef, M. A review on hybrid photovoltaic—Battery energy storage system: Current status, challenges, and future directions. J. Energy Storage 2022, 51, 104597. [Google Scholar] [CrossRef]
- Nguyen, X.H.; Nguyen, M.P. Mathematical modeling of photovoltaic cell/module/arrays with tags in Matlab/Simulink. Environ. Syst. Res. 2015, 4, 24. [Google Scholar] [CrossRef]
- He, H.; Xiong, R.; Fan, J. Evaluation of Lithium-Ion Battery Equivalent Circuit Models for State of Charge Estimation by an Experimental Approach. Energies 2011, 4, 582–598. [Google Scholar] [CrossRef]
- Laadjal, K.; Cardoso, A.J.M. Estimation of Lithium-Ion Batteries State-Condition in Electric Vehicle Applications: Issues and State of the Art. Electronics 2021, 10, 1588. [Google Scholar] [CrossRef]
- Omran, A.; Lucchesi, A.; Smith, D.; Alaswad, A.; Amiri, A.; Wilberforce, T.; Sodré, J.R.; Olabi, A. Mathematical model of a proton-exchange membrane (PEM) fuel cell. Int. J. Thermofluids 2021, 11, 100110. [Google Scholar] [CrossRef]
- Nicotera, I.; Simari, C.; Enotiadis, A. Nafion-based cation-exchange membranes for direct methanol fuel cells. Direct Methanol Fuel Cell Technol. 2020, 2020, 13–36. [Google Scholar] [CrossRef]
- Saleh, I.M.M.; Ali, R.; Zhang, H. Simplified mathematical model of proton exchange membrane fuel cell based on horizon fuel cell stack. J. Mod. Power Syst. Clean Energy 2016, 4, 668–679. [Google Scholar] [CrossRef]
- Zhang, L.; Hu, X.; Wang, Z.; Sun, F.; Dorrell, D.G. A review of supercapacitor modeling, estimation, and applications: A control/management perspective. Renew. Sustain. Energy Rev. 2018, 81, 1868–1878. [Google Scholar] [CrossRef]
- Implement Generic Supercapacitor Model—Simulink-MathWorks France. Available online: https://fr.mathworks.com/help/sps/powersys/ref/supercapacitor.html (accessed on 4 January 2023).
- Jiang, Q.; Xue, M.; Geng, G. Energy management of microgrid in grid-connected and stand-alone modes. IEEE Trans. Power Syst. 2013, 28, 3380–3389. [Google Scholar] [CrossRef]
- Vásquez, L.O.P.; Ramírez, V.M.; Thanapalan, K. A Comparison of Energy Management System for a DC Microgrid. Appl. Sci. 2020, 10, 1071. [Google Scholar] [CrossRef]
- Motapon, S.N.; Dessaint, L.-A.; Al-Haddad, K. A robust H2-consumption-minimization-based energy management strategy for a fuel cell hybrid emergency power system of more electric aircraft. IEEE Trans. Ind. Electron. 2014, 61, 6148–6156. [Google Scholar] [CrossRef]
- Ahmadi, S.; Bathaee, S.; Hosseinpour, A.H. Improving fuel economy and performance of a fuel-cell hybrid electric vehicle (fuel-cell, battery, and ultra-capacitor) using optimized energy management strategy. Energy Convers. Manag. 2018, 160, 74–84. [Google Scholar] [CrossRef]
- Motapon, S.N.; Dessaint, L.-A.; Al-Haddad, K. A comparative study of energy management schemes for a fuel-cell hybrid emergency power system of more-electric aircraft. IEEE Trans. Ind. Electron. 2013, 61, 1320–1334. [Google Scholar] [CrossRef]
- Braik, M.; Hammouri, A.; Atwan, J.; Al-Betar, M.A.; Awadallah, M.A. White Shark Optimizer: A novel bio-inspired meta-heuristic algorithm for global optimization problems. Knowl. Based Syst. 2022, 243, 108457. [Google Scholar] [CrossRef]
Disclaimer/Publisher’s Note: The statements, opinions and data contained in all publications are solely those of the individual author(s) and contributor(s) and not of MDPI and/or the editor(s). MDPI and/or the editor(s) disclaim responsibility for any injury to people or property resulting from any ideas, methods, instructions or products referred to in the content. |
© 2023 by the authors. Licensee MDPI, Basel, Switzerland. This article is an open access article distributed under the terms and conditions of the Creative Commons Attribution (CC BY) license (https://creativecommons.org/licenses/by/4.0/).