

Investigation of Phase Shifts Using AUC Diagrams: Application to Differential Diagnosis of Parkinson’s Disease and Essential Tremor

 ,
,  , ,
, ,
Abstract
1. Introduction
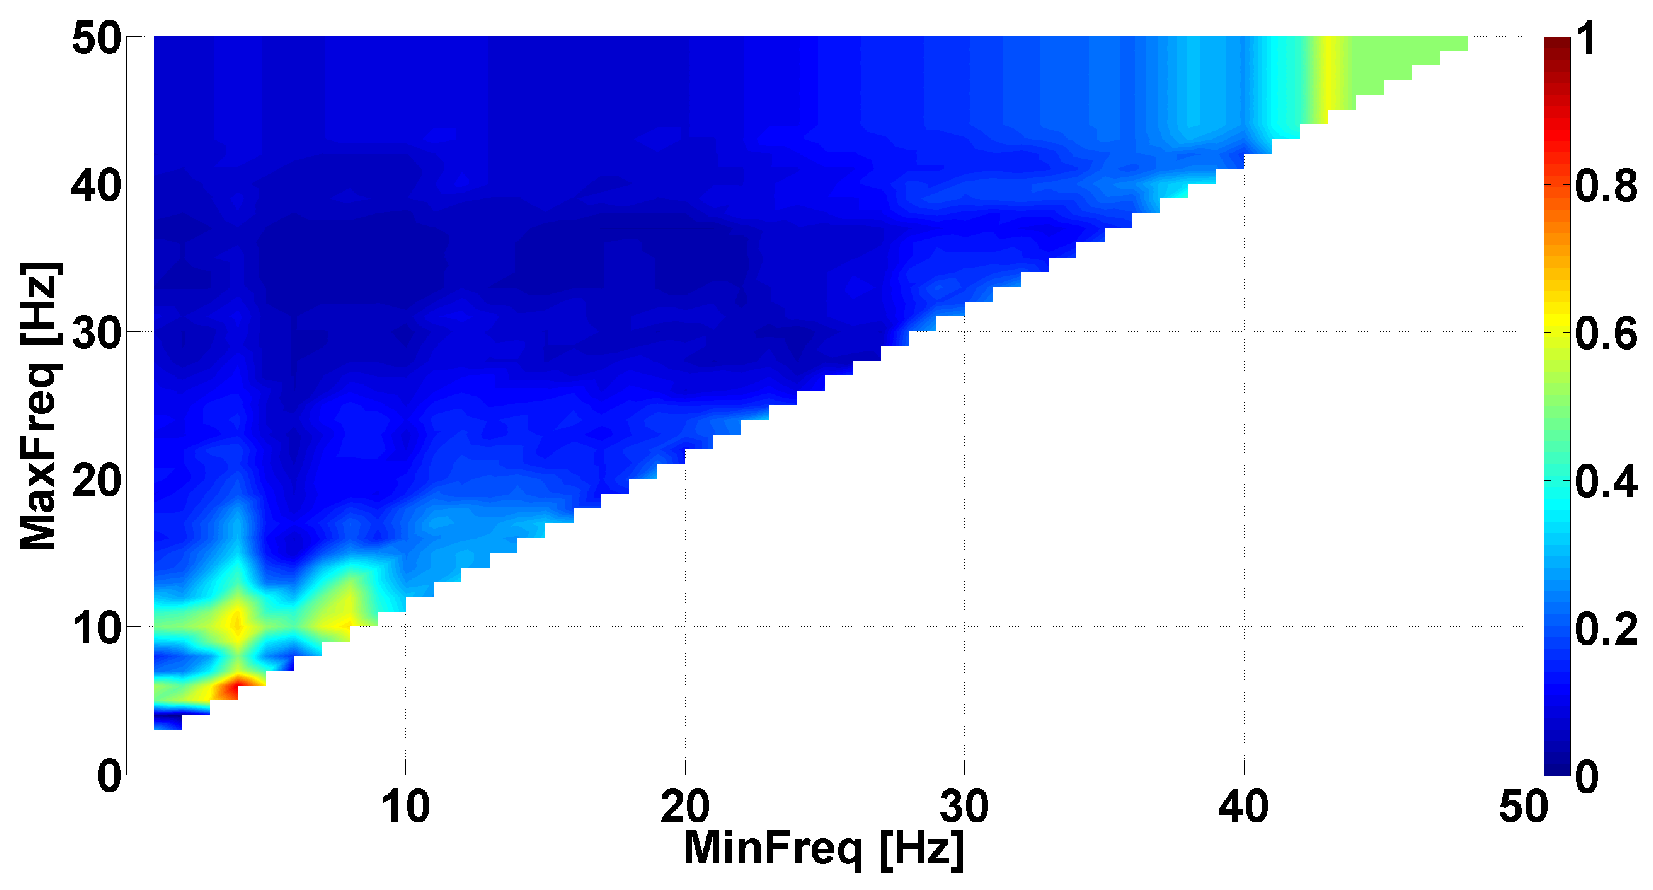
- The problem of searching frequency ranges. The instantaneous phase primarily depends on the selected frequency band in the spectrum of the signal. Usually, the frequency band is chosen by a neurophysiologist based on existing ideas about the spectral properties of the biomedical signal. However, the phase characteristics of the signal can demonstrate regularities that are unknown in advance. Thus, one of the main tasks that arises when studying the phase of the signals is identifying the frequency ranges where the instantaneous phase exhibits notable neurophysiologic regularities.
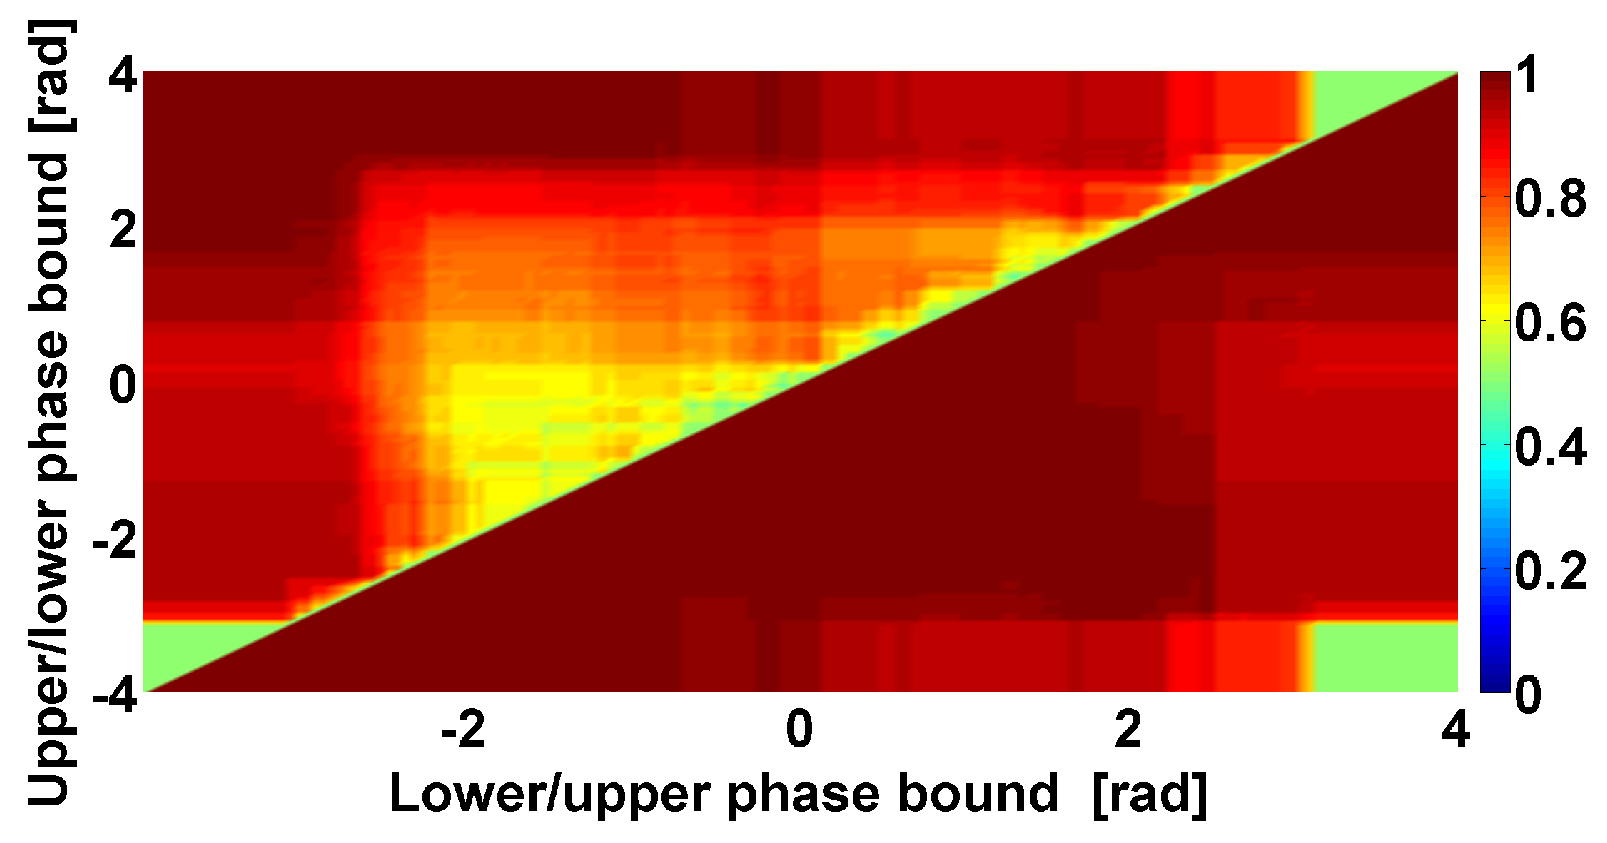
- The problem of searching for a compromise between the phase and amplitude analysis. One of the main advantages of the phase methods is the ability to identify regularities that do not depend on the amplitude of the signal. However, this property of the phase methods can become a disadvantage if the signal contains noise, which is typical for biomedical signals such as EMG. Thus, a compromise must be found between the influence of the phase and the amplitude of the signal on the target neurophysiologic regularities.
2. Experimental Setting and Data Acquisition
- We applied 50, 100, 150, and 200 Hz notch filters to remove the network interference and its harmonics.
- We applied an 8th-order Butterworth bandpass filter with a bandwidth from 60 to 240 Hz in the forward and reverse directions to isolate the frequency band of the electrical activity of the muscles.
- We decimated the signal to speed up the computation. The decimation coefficient was 4.
3. A Naïve Approach to Phase Difference Analysis
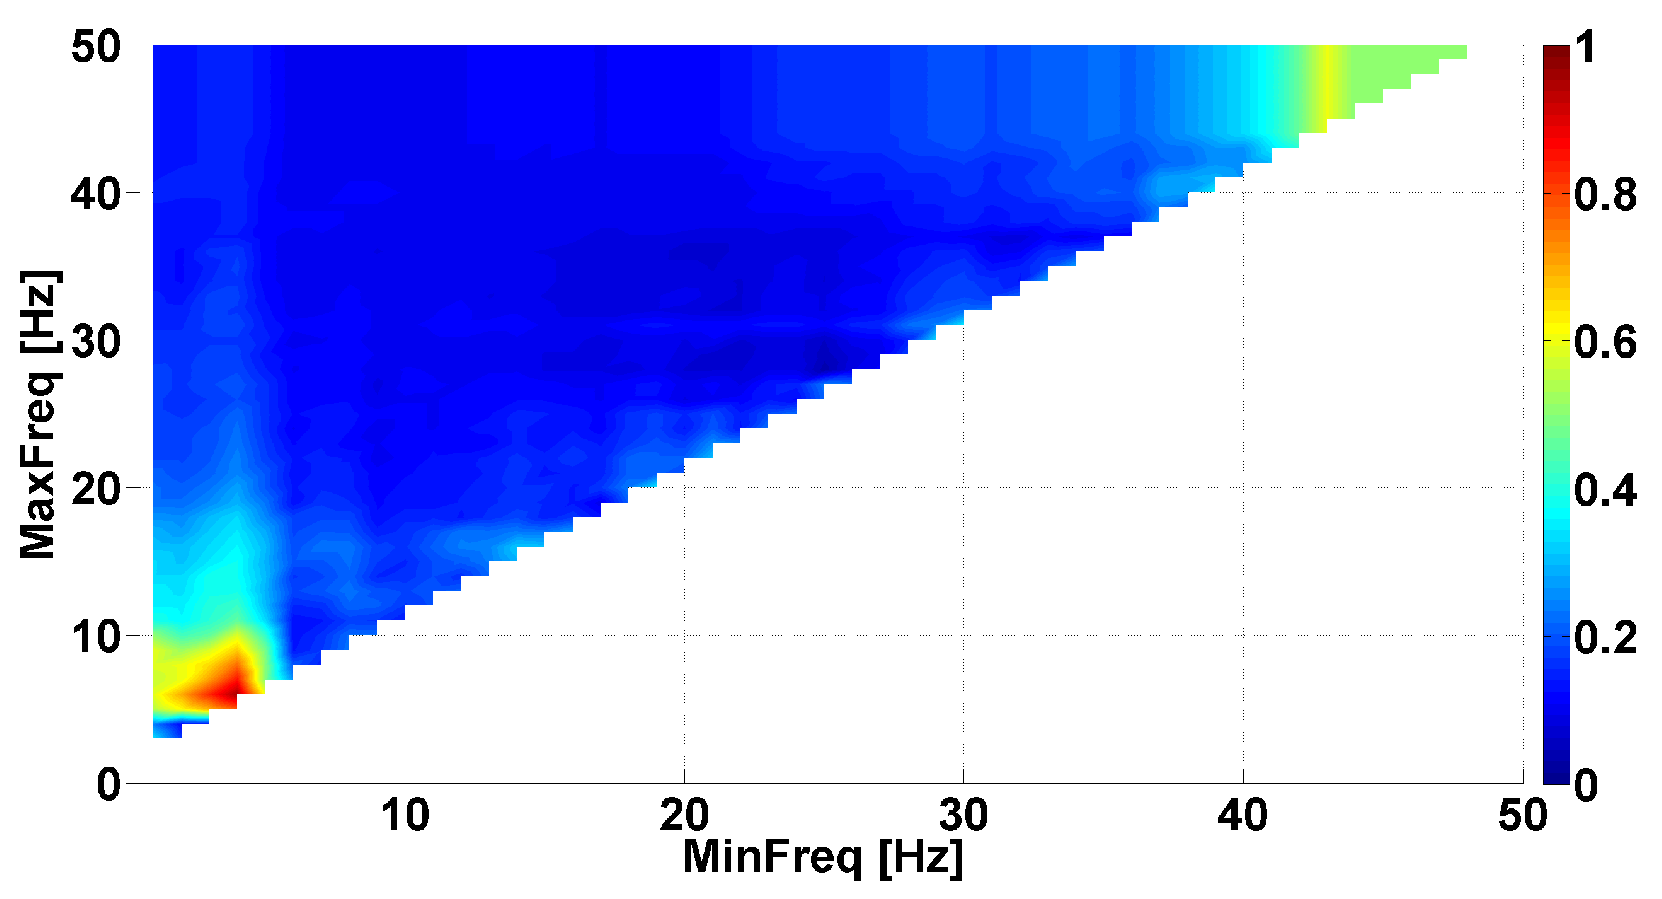
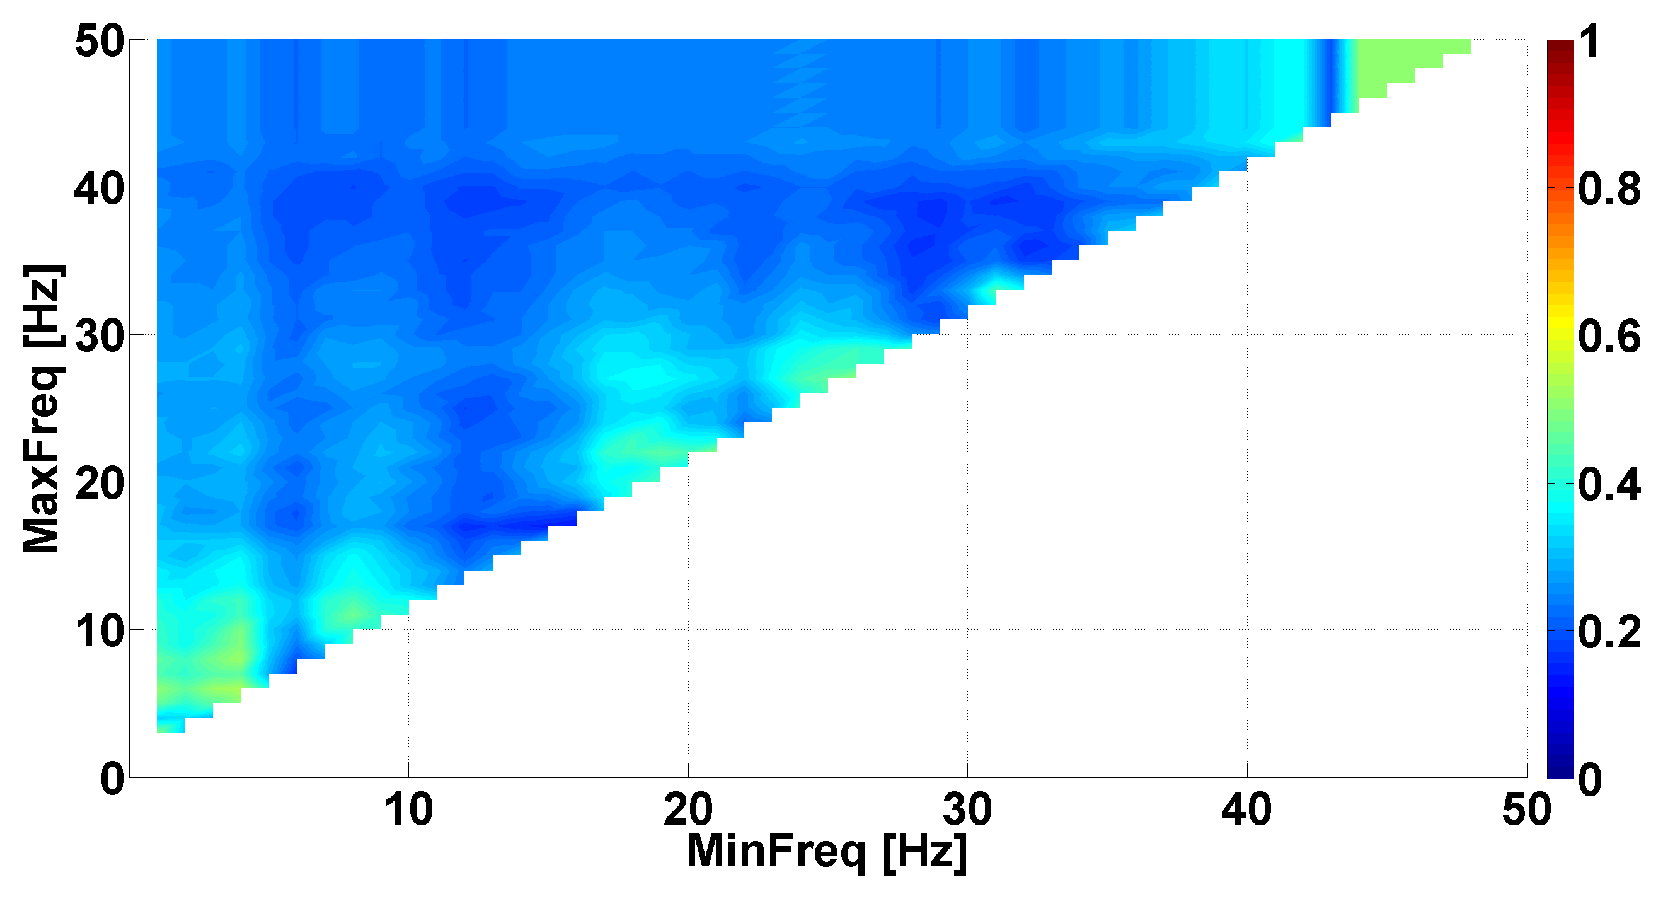
4. AUC Diagrams Based on Cross-Wavelet Spectra
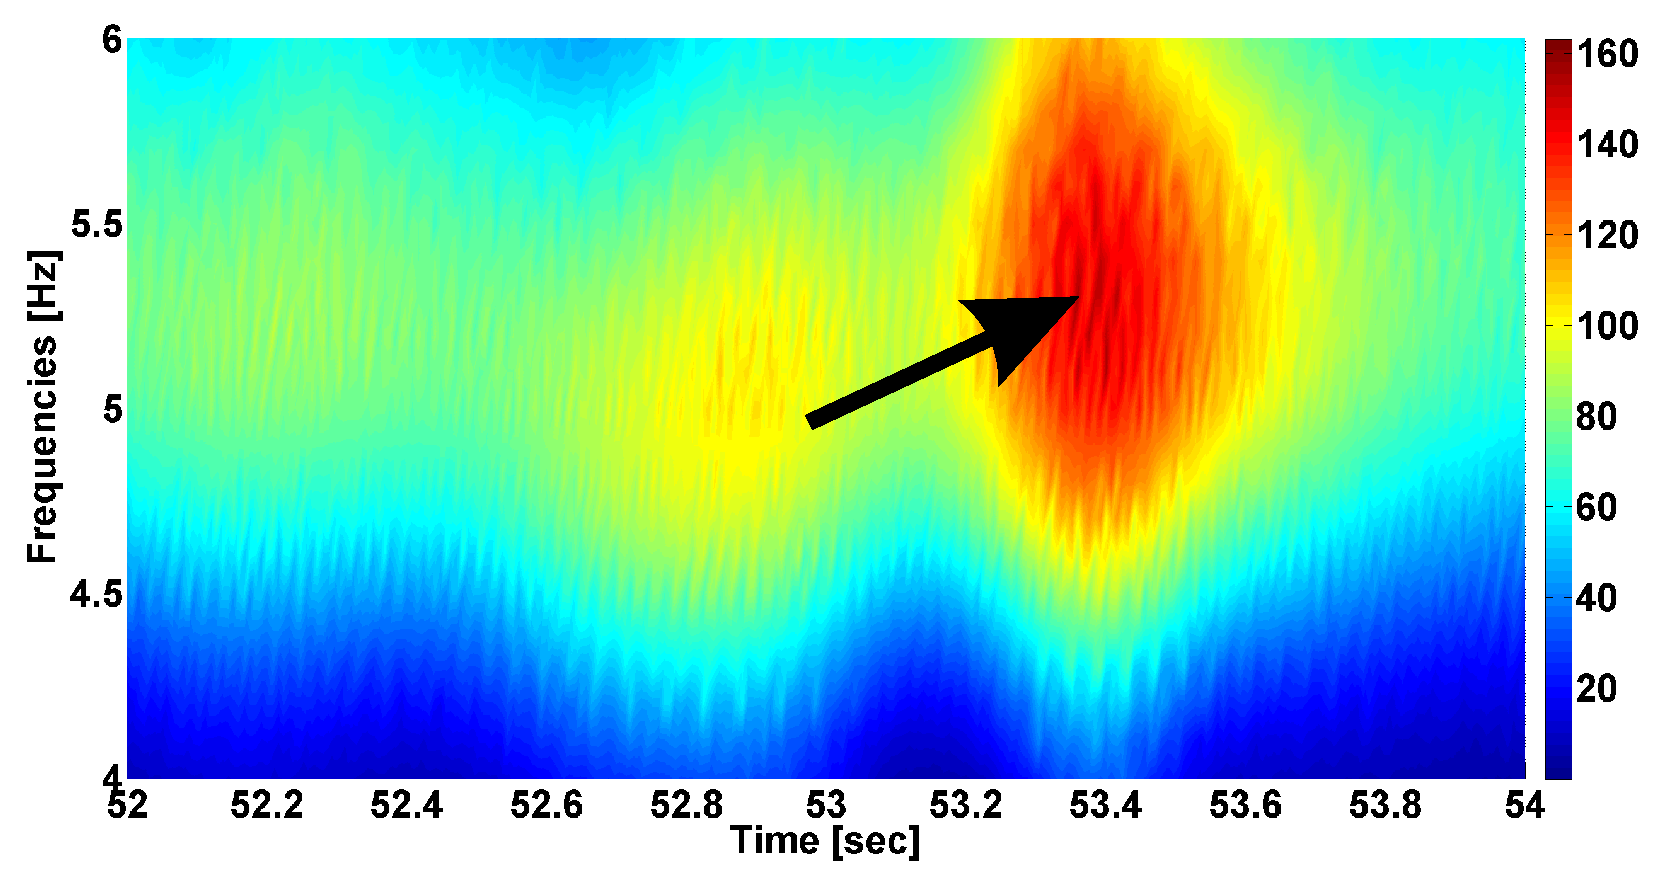
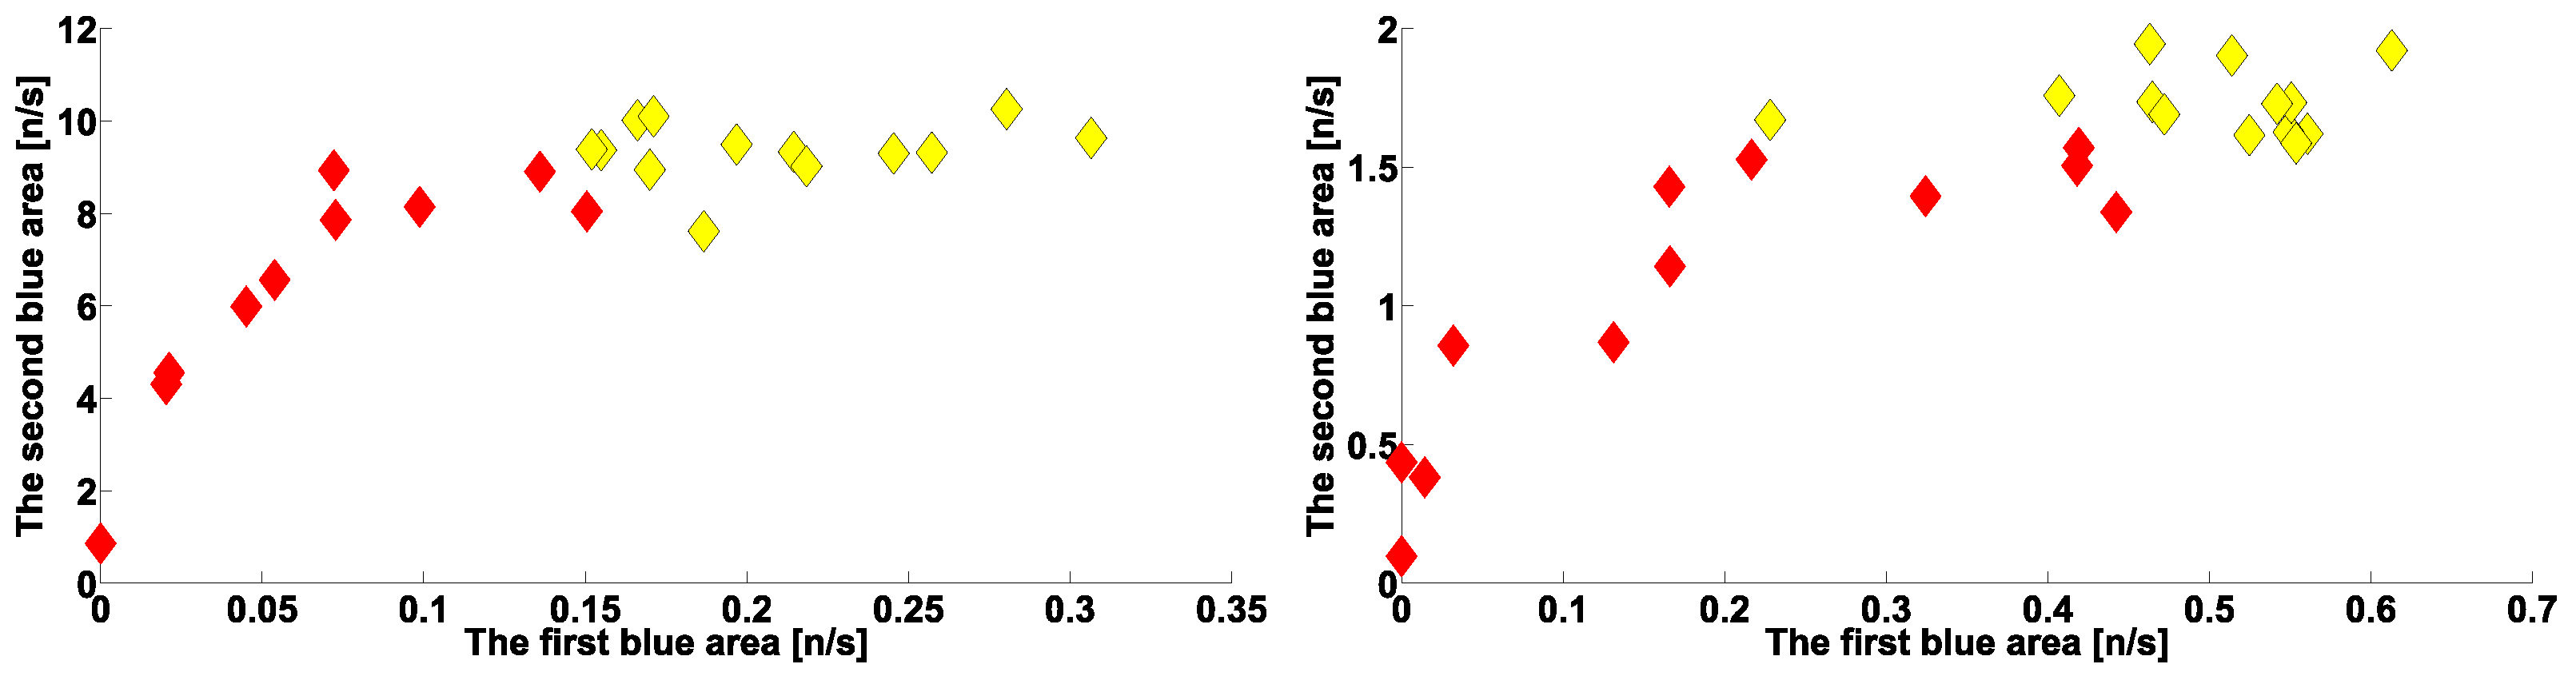
- The power of the cross-wavelet spectrum indicates a degree of similarity of the PSD of signals x and y.
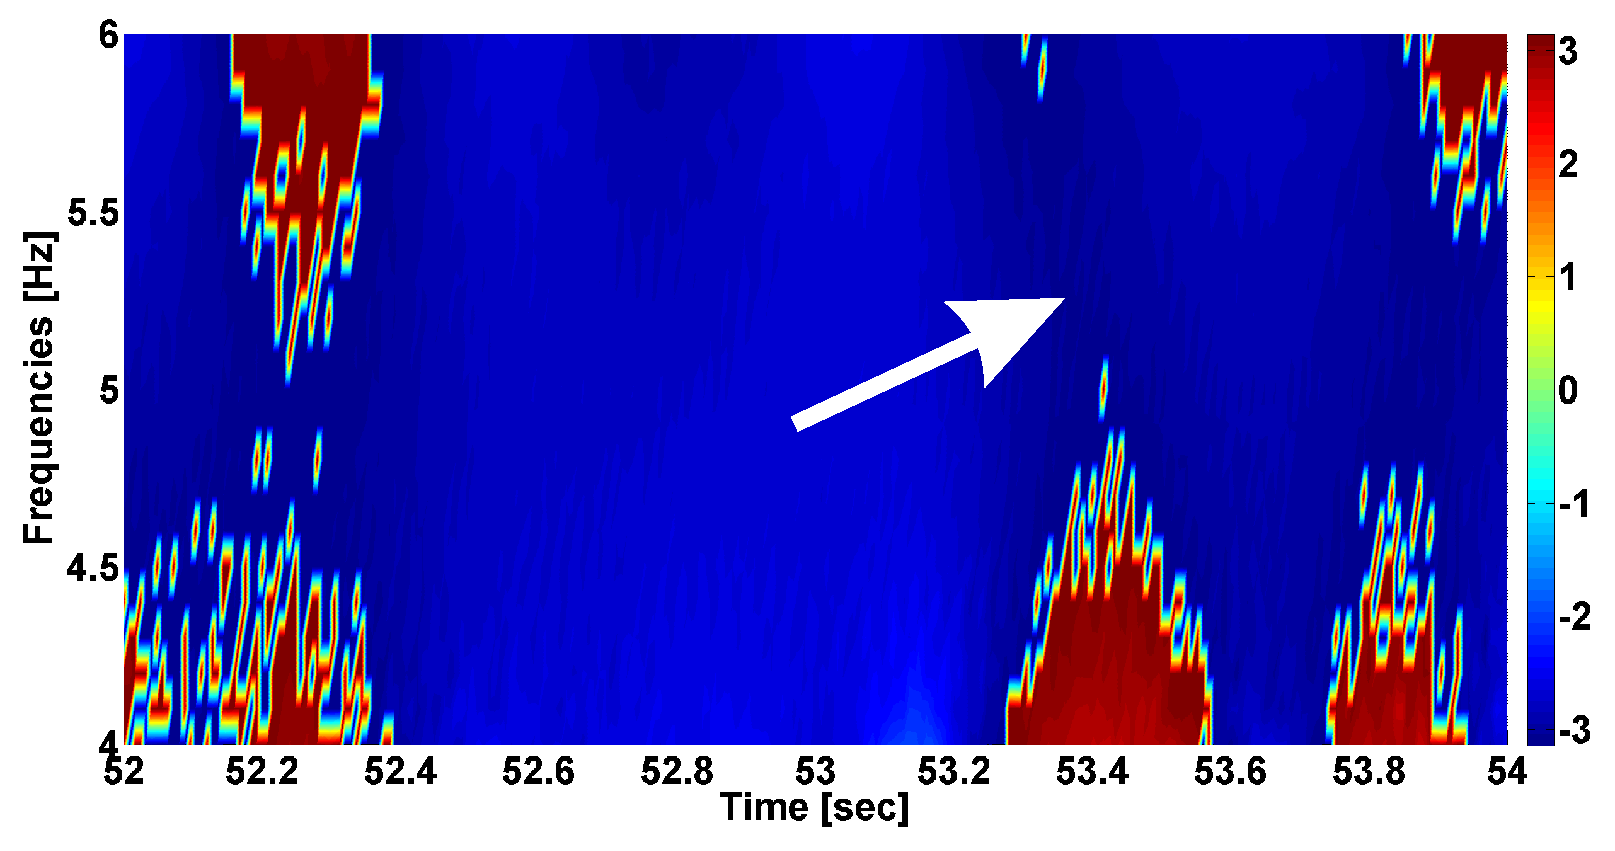
- The angle of the complex value of the cross-wavelet spectrum indicates a phase shift between the signals x and y.

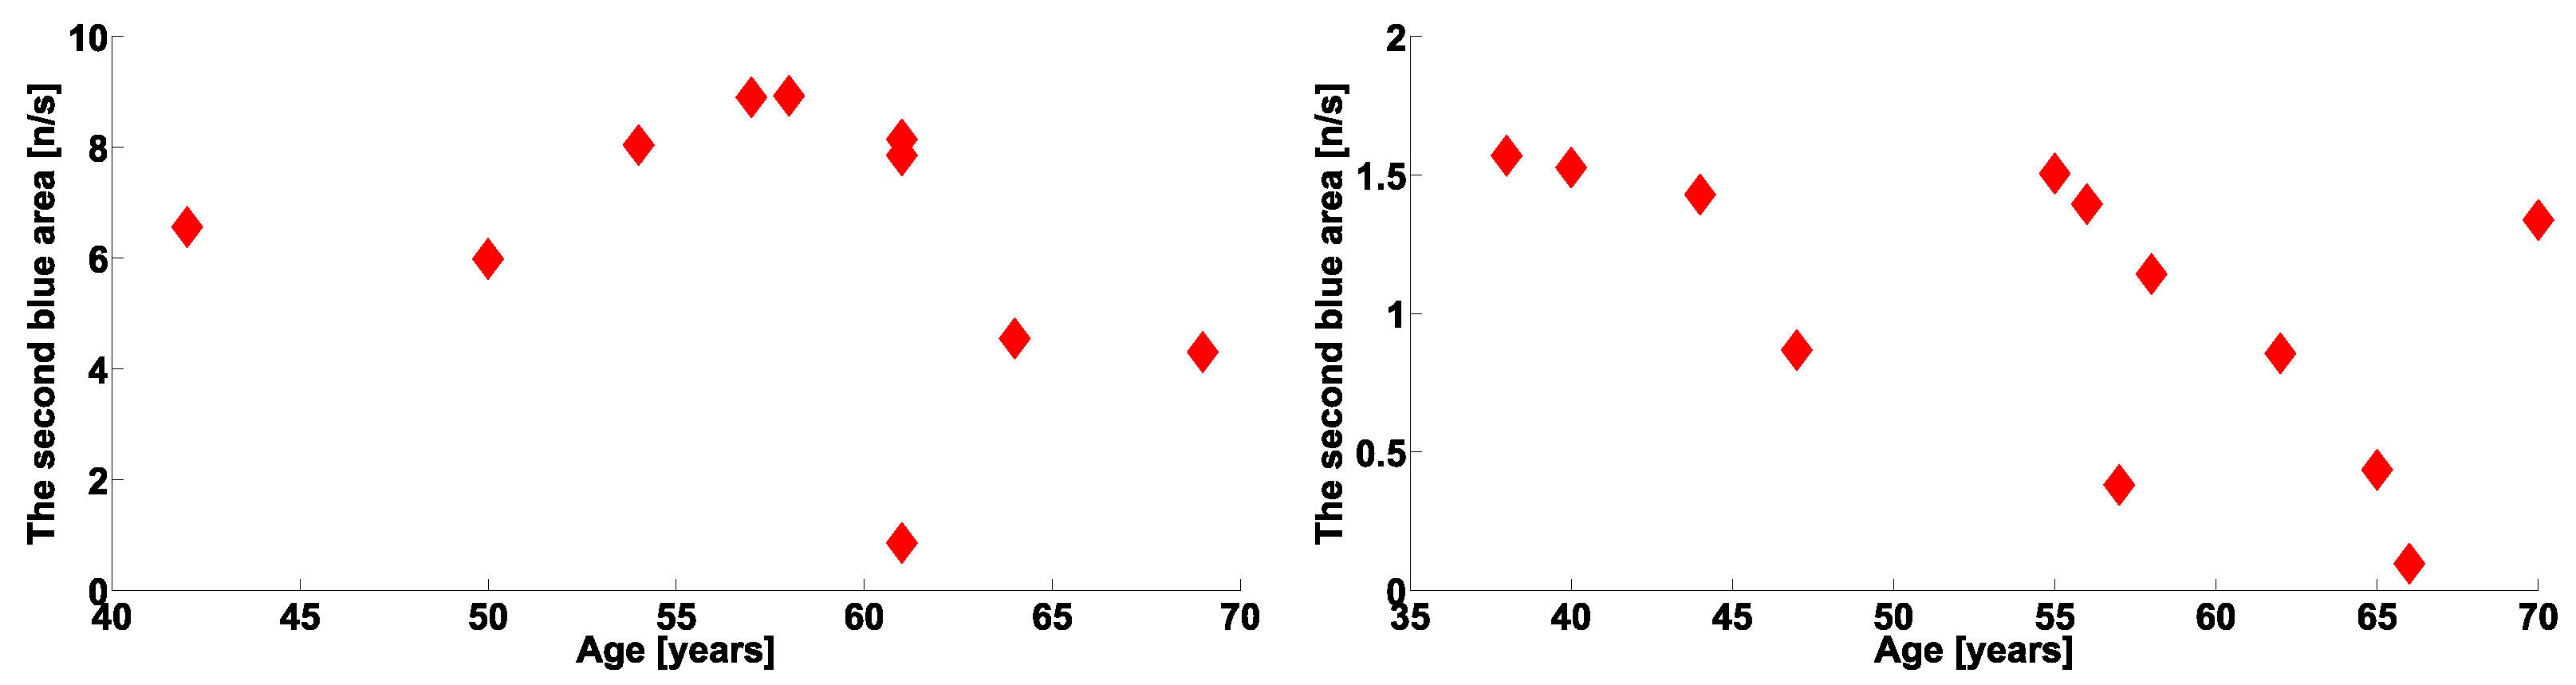
| Investigated Regularity | Frequency, Hz | PSD, V Hz | Duration, Periods | Bandwidth, Hz | Phase, Rad | AUC | p-Value |
|---|---|---|---|---|---|---|---|
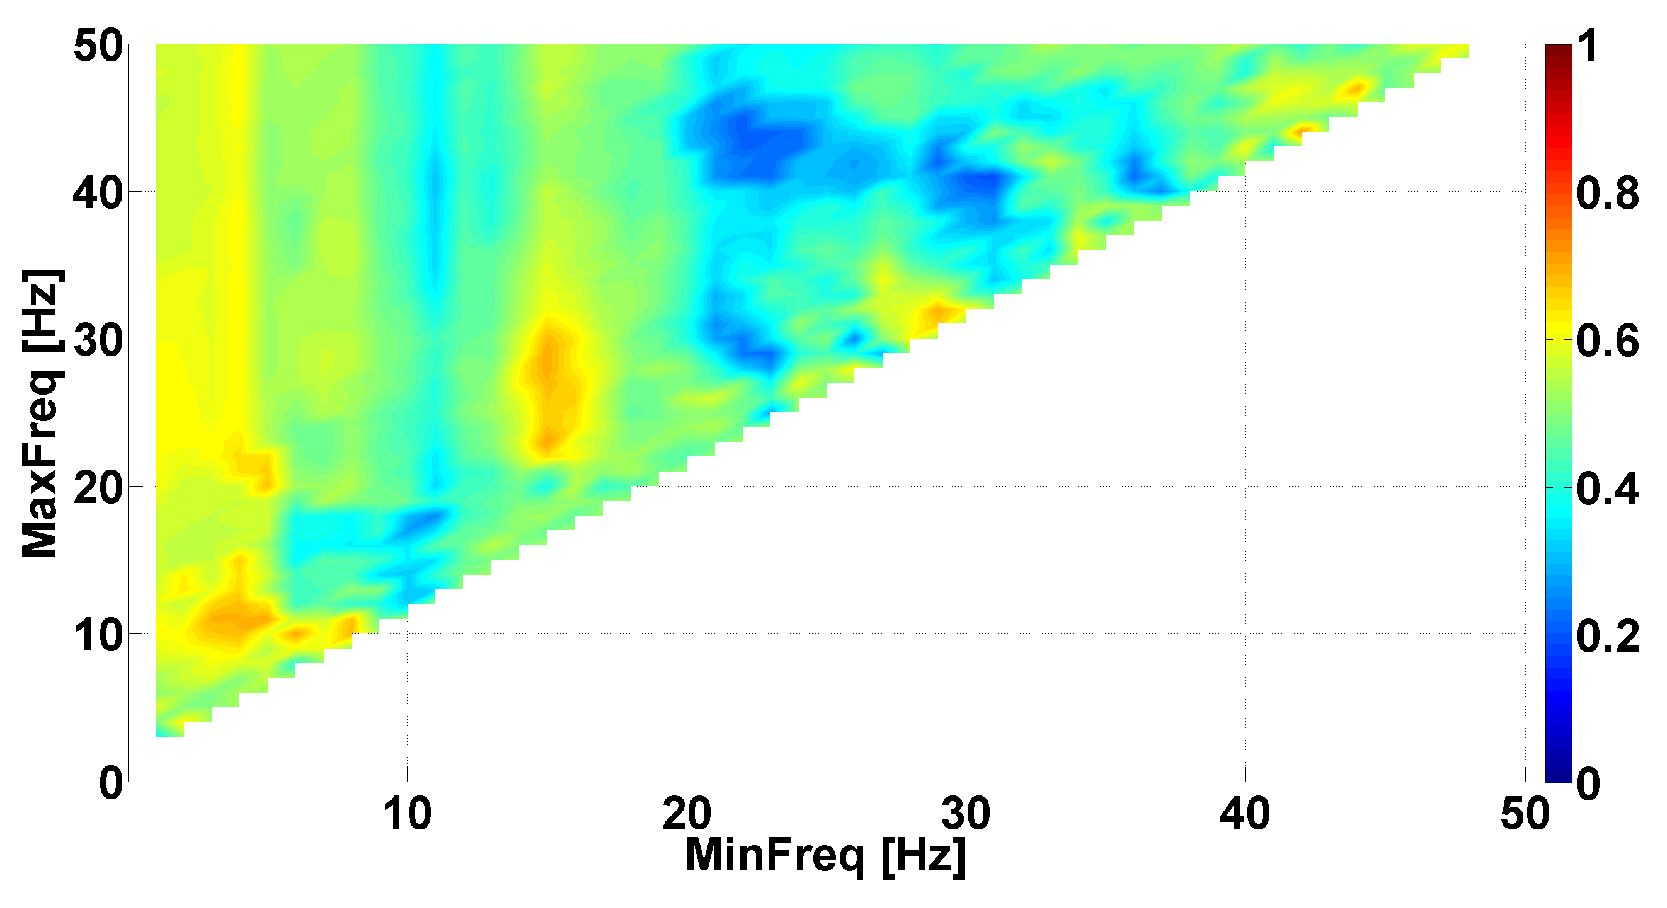
| The first blue area | 2.2–3.9 | 0.01–8 | 0.6–1.2 | 0.4–1.9 | … | 0.04 | 0.0002 |
| The first red area | 2.5–6 | 0.2–970 | 1.6–3 | 0.5–1 | … | 1 | 0.00002 |
| The second red area | 8–12 | 1.3–860 | 0.5–1.5 | 1.5–5 | … | 0.93 | 0.0003 |
| The second blue area | 12–37 | 0.02–24 | 0.6–0.9 | 2.6–5.2 | … | 0 | 0.00003 |
5. Statistical Data Analysis
6. Discussion
7. Conclusions
8. Patents
Author Contributions
Funding
Institutional Review Board Statement
Informed Consent Statement
Data Availability Statement
Acknowledgments
Conflicts of Interest
References
- Shahani, B.T.; Young, R.R. Physiological and pharmacological aids in the differential diagnosis of tremor. J. Neurol. Neurosurg. Psychiatry 1976, 39, 772–783. [Google Scholar] [CrossRef] [PubMed]
- Boose, A.; Spieker, S.; Jentgens, C.; Dichgans, J. Wrist tremor: Investigation of agonist-antagonist interaction by means of long-term EMG recording and cross-spectral analysis. Electroencephalogr. Clin. Neurophysiol. Mot. Control 1996, 101, 355–363. [Google Scholar] [CrossRef] [PubMed]
- Milanov, I. Electromyographic differentiation of tremors. Clin. Neurophysiol. 2001, 112, 1626–1632. [Google Scholar] [CrossRef]
- Breit, S.; Spieker, S.; Schulz, J.; Gasser, T. Long-term EMG recordings differentiate between parkinsonian and essential tremor. J. Neurol. 2008, 255, 103–111. [Google Scholar] [CrossRef] [PubMed]
- Nisticò, R.; Pirritano, D.; Salsone, M.; Novellino, F.; Del Giudice, F.; Morelli, M.; Trotta, M.; Bilotti, G.; Condino, F.; Cherubini, A.; et al. Synchronous pattern distinguishes resting tremor associated with essential tremor from rest tremor of Parkinson’s disease. Park. Relat. Disord. 2011, 17, 30–33. [Google Scholar] [CrossRef] [PubMed]
- Ivanova, E.; Fedin, P.; Brutyan, A.; Ivanova-Smolenskaya, I.; Illarioshkin, S. Analysis of tremor activity of antagonist muscles in essential tremor and Parkinson’s diseases. Neurol. J. 2014, 19, 11–18. [Google Scholar] [CrossRef]
- van der Stouwe, A.; Conway, B.A.; Elting, J.; Tijssen, M.; Maurits, N.M. Usefulness of intermuscular coherence and cumulant analysis in the diagnosis of postural tremor. Clin. Neurophysiol. 2015, 126, 1564–1569. [Google Scholar] [CrossRef]
- Nisticò, R.; Fratto, A.; Vescio, B.; Arabia, G.; Sciacca, G.; Morelli, M.; Labate, A.; Salsone, M.; Novellino, F.; Nicoletti, A.; et al. Tremor pattern differentiates drug-induced resting tremor from Parkinson disease. Park. Relat. Disord. 2016, 25, 100–103. [Google Scholar] [CrossRef]
- Kwon, K.Y.; Lee, H.M.; Lee, S.M.; Kang, S.H.; Koh, S.B. Comparison of motor and non-motor features between essential tremor and tremor dominant Parkinson’s disease. J. Neurol. Sci. 2016, 361, 34–38. [Google Scholar] [CrossRef]
- Zhang, J.; Xing, Y.; Ma, X.; Feng, L. Differential diagnosis of Parkinson disease, essential tremor, and enhanced physiological tremor with the tremor analysis of EMG. Park. Dis. 2017, 2017, 1597907. [Google Scholar] [CrossRef]
- Bartl, M.; Kewitsch, R.; Hallett, M.; Tegenthoff, M.; Paulus, W. Diagnosis and therapy of functional tremor a systematic review illustrated by a case report. Neurol. Res. Pract. 2020, 2, 1–9. [Google Scholar] [CrossRef]
- van der Veen, S.; Klamer, M.; Elting, J.; Koelman, J.; van der Stouwe, A.; Tijssen, M. The diagnostic value of clinical neurophysiology in hyperkinetic movement disorders: A systematic review. Park. Relat. Disord. 2021, 89, 176–185. [Google Scholar] [CrossRef] [PubMed]
- Calne, D.; Lader, M. Electromyographic studies of tremor using an averaging computer. Electroencephalogr. Clin. Neurophysiol. 1969, 26, 86–92. [Google Scholar] [CrossRef]
- Elble, R.J. Physiologic and essential tremor. Neurology 1986, 36, 225. [Google Scholar] [CrossRef]
- Bain, P. A combined clinical and neurophysiological approach to the study of patients with tremor. J. Neurol. Neurosurgery, Psychiatry 1993, 56, 839. [Google Scholar] [CrossRef] [PubMed]
- Deuschl, G.; Raethjen, J.; Baron, R.; Lindemann, M.; Wilms, H.; Krack, P. The pathophysiology of parkinsonian tremor: A review. J. Neurol. 2000, 247, V33–V48. [Google Scholar] [CrossRef] [PubMed]
- Burne, J.; Hayes, M.; Fung, V.; Yiannikas, C.; Boljevac, D. The contribution of tremor studies to diagnosis of parkinsonian and essential tremor: A statistical evaluation. J. Clin. Neurosci. 2002, 9, 237–242. [Google Scholar] [CrossRef]
- Thenganatt, M.A.; Louis, E.D. Distinguishing essential tremor from Parkinson’s disease: Bedside tests and laboratory evaluations. Expert Rev. Neurother. 2012, 12, 687–696. [Google Scholar] [CrossRef]
- Pal, P.K. Electrophysiologic evaluation of psychogenic movement disorders. J. Mov. Disord. 2011, 4, 21. [Google Scholar] [CrossRef]
- Airaksinen, K.; Mäkelä, J.P.; Nurminen, J.; Luoma, J.; Taulu, S.; Ahonen, A.; Pekkonen, E. Cortico-muscular coherence in advanced Parkinson’s disease with deep brain stimulation. Clin. Neurophysiol. 2015, 126, 748–755. [Google Scholar] [CrossRef]
- Flood, M.W.; Lowery, M.M. Analysis of Parkinsonian Surface Electomyography Through Advanced Signal Processing and Nonlinear Methods. In Proceedings of the Bioengineering in Ireland Annual Conference, NUI Galway, Galway, Ireland, 22–23 January 2016. [Google Scholar]
- Kramer, G.; Van der Stouwe, A.; Maurits, N.; Tijssen, M.; Elting, J. Wavelet coherence analysis: A new approach to distinguish organic and functional tremor types. Clin. Neurophysiol. 2018, 129, 13–20. [Google Scholar] [CrossRef] [PubMed]
- Zanini, R.A.; Colombini, E.L. Parkinson’s disease EMG data augmentation and simulation with DCGANs and style transfer. Sensors 2020, 20, 2605. [Google Scholar] [CrossRef] [PubMed]
- Deb, R.; An, S.; Bhat, G.; Shill, H.; Ogras, U.Y. A systematic survey of research trends in technology usage for Parkinson’s disease. Sensors 2022, 22, 5491. [Google Scholar] [CrossRef] [PubMed]
- Deuschl, G.; Becktepe, J.S.; Dirkx, M.; Haubenberger, D.; Hassan, A.; Helmich, R.; Muthuraman, M.; Panyakaew, P.; Schwingenschuh, P.; Zeuner, K.E.; et al. The clinical and electrophysiological investigation of tremor. Clin. Neurophysiol. 2022, 136, 93–129. [Google Scholar] [CrossRef]
- Erro, R.; Fasano, A.; Barone, P.; Bhatia, K.P. Milestones in tremor research: 10 years later. Mov. Disord. Clin. Pract. 2022, 26, 429–435. [Google Scholar] [CrossRef]
- Maitin, A.M.; Romero Muñoz, J.P.; García-Tejedor, Á.J. Survey of machine learning techniques in the analysis of EEG signals for Parkinson’s disease: A systematic review. Appl. Sci. 2022, 12, 6967. [Google Scholar] [CrossRef]
- Ruonala, V. Surface Electromyography and Kinematic Measurements in Parkinson’s Disease: Analysis Methods for Differential Diagnosis and Quantification of Treatment. Ph.D. Thesis, Itä-Suomen Yliopisto, Kuopio, Finland, 2022. [Google Scholar]
- Krokidis, M.G.; Dimitrakopoulos, G.N.; Vrahatis, A.G.; Tzouvelekis, C.; Drakoulis, D.; Papavassileiou, F.; Exarchos, T.P.; Vlamos, P. A Sensor-Based Perspective in Early-Stage Parkinson’s Disease: Current State and the Need for Machine Learning Processes. Sensors 2022, 22, 409. [Google Scholar] [CrossRef]
- Tass, P.; Rosenblum, M.; Weule, J.; Kurths, J.; Pikovsky, A.; Volkmann, J.; Schnitzler, A.; Freund, H.J. Detection of n:m Phase Locking from Noisy Data: Application to Magnetoencephalography. Phys. Rev. Lett. 1998, 81, 3291–3294. [Google Scholar] [CrossRef]
- Mormann, F.; Lehnertz, K.; David, P.; Elger, C.E. Mean phase coherence as a measure for phase synchronization and its application to the EEG of epilepsy patients. Phys. D Nonlinear Phenom. 2000, 144, 358–369. [Google Scholar] [CrossRef]
- Rosenblum, M.; Pikovsky, A.; Kurths, J.; Schäfer, C.; Tass, P.A. Phase synchronization: From theory to data analysis. In Handbook of Biological Physics; Elsevier: Amsterdam, The Netherlands, 2001; Volume 4, pp. 279–321. [Google Scholar]
- Herrmann, C.S.; Grigutsch, M.; Busch, N.A. EEG oscillations and wavelet analysis. Event-Relat. Potentials A Methods Handb. 2005, 11, 229–259. [Google Scholar]
- Ito, J.; Nikolaev, A.R.; van Leeuwen, C. Spatial and temporal structure of phase synchronization of spontaneous alpha EEG activity. Biol. Cybern. 2005, 92, 54–60. [Google Scholar] [CrossRef] [PubMed]
- Dauwels, J.; Vialatte, F.; Musha, T.; Cichocki, A. A comparative study of synchrony measures for the early diagnosis of Alzheimer’s disease based on EEG. NeuroImage 2010, 49, 668–693. [Google Scholar] [CrossRef] [PubMed]
- Sheppard, L.; Stefanovska, A.; McClintock, P. Testing for time-localized coherence in bivariate data. Phys. Rev. E 2012, 85, 046205. [Google Scholar] [CrossRef] [PubMed]
- Jeong, D.H.; Kim, Y.D.; Song, I.U.; Chung, Y.A.; Jeong, J. Wavelet energy and wavelet coherence as EEG biomarkers for the diagnosis of Parkinson’s disease-related dementia and Alzheimer’s disease. Entropy 2015, 18, 8. [Google Scholar] [CrossRef]
- Khoshnevis, S.A.; Sankar, R. Applications of higher order statistics in electroencephalography signal processing: A comprehensive survey. IEEE Rev. Biomed. Eng. 2019, 13, 169–183. [Google Scholar] [CrossRef]
- Ural, G.; Kaçar, F.; Canan, S. Wavelet phase coherence estimation of EEG signals for neuromarketing studies. NeuroQuantology 2019, 17, 112–120. [Google Scholar] [CrossRef]
- Alam, R.-u.; Zhao, H.; Goodwin, A.; Kavehei, O.; McEwan, A. Differences in power spectral densities and phase quantities due to processing of EEG signals. Sensors 2020, 20, 6285. [Google Scholar] [CrossRef]
- Carlos, F.L.P.; Ubirakitan, M.M.; Rodrigues, M.C.A.; Aguilar-Domingo, M.; Herrera-Gutiérrez, E.; Gómez-Amor, J.; Copelli, M.; Carelli, P.V.; Matias, F.S. Anticipated synchronization in human EEG data: Unidirectional causality with negative phase lag. Phys. Rev. E 2020, 102, 032216. [Google Scholar] [CrossRef]
- Sushkova, O.S.; Morozov, A.A.; Kershner, I.A.; Petrova, N.G.; Gabova, A.V.; Chigaleychik, L.A.; Karabanov, A.V. Investigation of distribution laws of the phase difference of the envelopes of electromyograms of antagonist muscles in Parkinson’s disease and essential tremor patients. RENSIT 2020, 12, 415–428. [Google Scholar] [CrossRef]
- Das, A.; Zabeh, E.; Jacobs, J. How can we detect and analyze traveling waves in human brain oscillations? PsyArXiv 2022. [Google Scholar] [CrossRef]
- Farokhniaee, A.; Marceglia, S.; Priori, A.; Lowery, M.M. Effects of contralateral deep brain stimulation and levodopa on subthalamic nucleus oscillatory activity and phase-amplitude coupling. Neuromodul. Technol. Neural Interface 2022, in press. [Google Scholar] [CrossRef] [PubMed]
- Le Van Quyen, M.; Foucher, J.; Lachaux, J.P.; Rodriguez, E.; Lutz, A.; Martinerie, J.; Varela, F.J. Comparison of Hilbert transform and wavelet methods for the analysis of neuronal synchrony. J. Neurosci. Methods 2001, 111, 83–98. [Google Scholar] [CrossRef] [PubMed]
- Léonard, F. Phase spectrogram and frequency spectrogram as new diagnostic tools. Mech. Syst. Signal Process. 2007, 21, 125–137. [Google Scholar] [CrossRef]
- Sushkova, O.S.; Morozov, A.A.; Gabova, A.V.; Karabanov, A.V.; Illarioshkin, S.N. A statistical method for exploratory data analysis based on 2D and 3D area under curve diagrams: Parkinson’s disease investigation. Sensors 2021, 21, 4700. [Google Scholar] [CrossRef]
- Andreeva, Y.; Khutorskaya, O. EMGs spectral analysis method for the objective diagnosis of different clinical forms of Parkinson’s disease. J. Electromyogr. Clin. Neurophysiol. 1996, 36, 187–192. [Google Scholar]
- Khutorskaya, O.E. Method for Early and Differential Electromyographic Diagnosis of the Main Symptoms of Parkinson’s Disease. Russian Federation Patent No. 2626557, 28 July 2017. [Google Scholar]
- Sushkova, O.S.; Morozov, A.A.; Gabova, A.V. A method of analysis of EEG wave trains in early stages of Parkinson’s disease. In Proceedings of the International Conference on Bioinformatics and Systems Biology (BSB-2016), Allahabad, India, 4–6 March 2016; pp. 1–4. [Google Scholar]
- Sushkova, O.S.; Morozov, A.A.; Gabova, A.V. Data mining in EEG wave trains in early stages of Parkinson’s disease. Adv. Soft Computing. MICAI 2017, 10062, 403–412. [Google Scholar]
- Sushkova, O.S.; Morozov, A.A.; Gabova, A.V.; Karabanov, A.V. Application of brain electrical activity burst analysis method for detection of EEG characteristics in the early stage of Parkinson’s disease. S. S. Korsakov J. Neurol. Psychiatry 2018, 118, 45–48. [Google Scholar] [CrossRef]
- Sushkova, O.S.; Morozov, A.A.; Gabova, A.V. Investigation of specificity of Parkinson’s disease features obtained using the method of cerebral cortex electrical activity analysis based on wave trains. In Proceedings of the SITIS, Jaipur, India, 4–7 December 2017; pp. 168–172. [Google Scholar]
- Sushkova, O.S.; Morozov, A.A.; Gabova, A.V.; Karabanov, A.V. An investigation of the specificity of features of early stages of Parkinson’s disease obtained using the method of cortex electrical activity analysis based on wave trains. J. Phys. Conf. Ser. 2018, 1096, 012078. [Google Scholar] [CrossRef]
- Sushkova, O.S.; Morozov, A.A.; Gabova, A.V.; Karabanov, A.V. Investigation of surface EMG and acceleration signals of limbs’ tremor in Parkinson’s disease patients using the method of electrical activity analysis based on wave trains. In Proceedings of the Advances in Artificial Intelligence, Trujillo, Peru, 13–16 November 2018; Simari, G., Eduardo, F., Gutierrez, S.F., Melquiades, J.R., Eds.; Springer International Publishing: Cham, Switzerland, 2018; pp. 253–264. [Google Scholar]
- Sushkova, O.S.; Morozov, A.A.; Gabova, A.V.; Karabanov, A.V.; Chigaleychik, L.A. Investigation of the 0.5–4 Hz low-frequency range in the wave train electrical activity of muscles in patients with Parkinson’s disease and essential tremor. Radioelectron. Nanosyst. Inf. Technol. 2019, 11, 225–236. [Google Scholar] [CrossRef]
- Sushkova, O.; Morozov, A.; Gabova, A.; Karabanov, A. Investigation of the multiple comparisons problem in the analysis of the wave train electrical activity of muscles in Parkinson’s disease patients. J. Phys. Conf. Ser. 2019, 1368, 052004. [Google Scholar]
- Sushkova, O.; Morozov, A.; Gabova, A.; Karabanov, A. Investigation of the Multiple Comparisons Problem in the Wave Train Electrical Activity Analysis in Parkinson’s Disease Patients. Basic Clin. Pharmacol. Toxicol. 2019, 124, 24–25. [Google Scholar] [CrossRef]
- Sushkova, O.S.; Morozov, A.A.; Gabova, A.V.; Karabanov, A.V.; Chigaleychik, L.A. An investigation of accelerometer signals in the 0.5–4 Hz range in Parkinson’s disease and essential tremor patients. In Proceedings of the International Conference on Frontiers in Computing and Systems, Jalpaiguri, India, 13–15 January 2021; Springer: Berlin/Heidelberg, Germany, 2021; pp. 455–462. [Google Scholar]
- Sushkova, O.; Morozov, A.; Gabova, A.; Karabanov, A. Development of a method for early and differential diagnosis of Parkinson’s disease and essential tremor based on analysis of wave train electrical activity of muscles. In Proceedings of the 2020 International Conference on Information Technology and Nanotechnology (ITNT), Samara, Russia, 26–29 May 2020; pp. 1–5. [Google Scholar]
- Sushkova, O.; Gabova, A.; Zhavoronkova, L.; Karabanov, A.; Kershner, I.; Morozov, A.; Sinkin, M.; Tolmacheva, R.; Chigaleychik, L.; Obukhov, Y.V. Extraction of Diagnostic Information on Brain Diseases by Analyzing Wavelet Spectra of Biomedical Signals. Biomed. Eng. 2021, 55, 21–25. [Google Scholar] [CrossRef]
- Sushkova, O.S.; Morozov, A.A.; Gabova, A.V.; Kershner, I.A.; Chigaleychik, L.A.; Karabanov, A.V. Investigation of phase analysis methods of antagonist muscles electromyograms in patients with neurodegenerative diseases. In Proceedings of the 2021 International Conference on Information Technology and Nanotechnology (ITNT), Samara, Russia, 20–24 September 2021; pp. 1–5. [Google Scholar]
- Sushkova, O.S.; Morozov, A.A.; Petrova, N.G.; Khokhlova, M.N.; Gabova, A.V.; Karabanov, A.V.; Chigaleychik, L.A.; Sarkisova, K.Y. Method of wave train electrical activity analysis – the theoretical basis and application. RENSIT 2022, 12, 415–428. [Google Scholar] [CrossRef]
- Ivanova, E.; Fedin, P.; Brutyan, A.; Ivanova-Smolenskaya, I.; Illarioshkin, S. Clinical and electrophysiological analysis of tremor in patients with essential tremor and Parkinson’s disease. Nevrol. Zhurnal 2013, 18, 21–26. [Google Scholar]
- Deuschl, G.; Lücking, C.; Schenck, E. Essential tremor: Electrophysiological and pharmacological evidence for a subdivision. J. Neurol. Neurosurg. Psychiatry 1987, 50, 1435–1441. [Google Scholar] [CrossRef] [PubMed]
- Akbostanci, M.C.; Ulkatan, S.; Yigit, A.; Aydin, N.; Mutluer, N. Difference of disability between electrophysiologic subgroups of essential tremor. Can. J. Neurol. Sci. 2000, 27, 60–64. [Google Scholar] [CrossRef]
- Milanov, I. Clinical and electromyographic examinations of patients with essential tremor. Can. J. Neurol. Sci. 2000, 27, 65–70. [Google Scholar] [CrossRef]
- Milanov, I. Clinical and electromyographic examinations of Parkinsonian tremor. Park. Relat. Disord. 2000, 6, 229–235. [Google Scholar] [CrossRef]
- Bhatia, K.P.; Bain, P.; Bajaj, N.; Elble, R.J.; Hallett, M.; Louis, E.D.; Raethjen, J.; Stamelou, M.; Testa, C.M.; Deuschl, G.; et al. Consensus Statement on the classification of tremors. From the task force on tremor of the International Parkinson and Movement Disorder Society. Mov. Disord. 2018, 33, 75–87. [Google Scholar] [CrossRef]
- Shtok, V.; Ivanova-Smolenskaya, I.; Levin, O. Extrapyramidal Disorders: Guidelines for Diagnosis and Treatment; MEDpress-Inform: Moscow, Russia, 2002. (In Russian) [Google Scholar]
- Bucher, S.F.; Seelos, K.C.; Dodel, R.C.; Reiser, M.; Oertel, W.H. Activation mapping in essential tremor with functional magnetic resonance imaging. Ann. Neurol. 1997, 41, 32–40. [Google Scholar] [CrossRef]
- Helmich, R.C.; Hallett, M.; Deuschl, G.; Toni, I.; Bloem, B.R. Cerebral causes and consequences of parkinsonian resting tremor: A tale of two circuits? Brain 2012, 135, 3206–3226. [Google Scholar] [CrossRef]
- Magnin, M.; Morel, A.; Jeanmonod, D. Single-unit analysis of the pallidum, thalamus and subthalamic nucleus in parkinsonian patients. Neuroscience 2000, 96, 549–564. [Google Scholar] [CrossRef] [PubMed]
- Qasim, S.E.; de Hemptinne, C.; Swann, N.C.; Miocinovic, S.; Ostrem, J.L.; Starr, P.A. Electrocorticography reveals beta desynchronization in the basal ganglia-cortical loop during rest tremor in Parkinson’s disease. Neurobiol. Dis. 2016, 86, 177–186. [Google Scholar] [CrossRef] [PubMed]
- Dirkx, M.F.; den Ouden, H.; Aarts, E.; Timmer, M.; Bloem, B.R.; Toni, I.; Helmich, R.C. The cerebral network of Parkinson’s tremor: An effective connectivity fMRI study. J. Neurosci. 2016, 36, 5362–5372. [Google Scholar] [CrossRef] [PubMed]
- Woytowicz, E.J.; Westlake, K.P.; Whitall, J.; Sainburg, R.L. Handedness results from complementary hemispheric dominance, not global hemispheric dominance: Evidence from mechanically coupled bilateral movements. J. Neurophysiol. 2018, 120, 729–740. [Google Scholar] [CrossRef] [PubMed]
- Woytowicz, E.J.; Sainburg, R.L.; Westlake, K.P.; Whitall, J. Competition for limited neural resources in older adults leads to greater asymmetry of bilateral movements than in young adults. J. Neurophysiol. 2020, 123, 1295–1304. [Google Scholar] [CrossRef]
- Sainburg, R.L. Evidence for a dynamic-dominance hypothesis of handedness. Exp. Brain Res. 2002, 142, 241–258. [Google Scholar] [CrossRef]
- Sainburg, R.L. Handedness: Differential specializations for control of trajectory and position. Exerc. Sport Sci. Rev. 2005, 33, 206–213. [Google Scholar] [CrossRef]
- Sainburg, R.L. Convergent models of handedness and brain lateralization. Front. Psychol. 2014, 5, 1092. [Google Scholar] [CrossRef]


| Investigated Regularity | Frequency, Hz | PSD, V Hz | Duration, Periods | Bandwidth, Hz | Phase, Rad | AUC | p-Value |
|---|---|---|---|---|---|---|---|
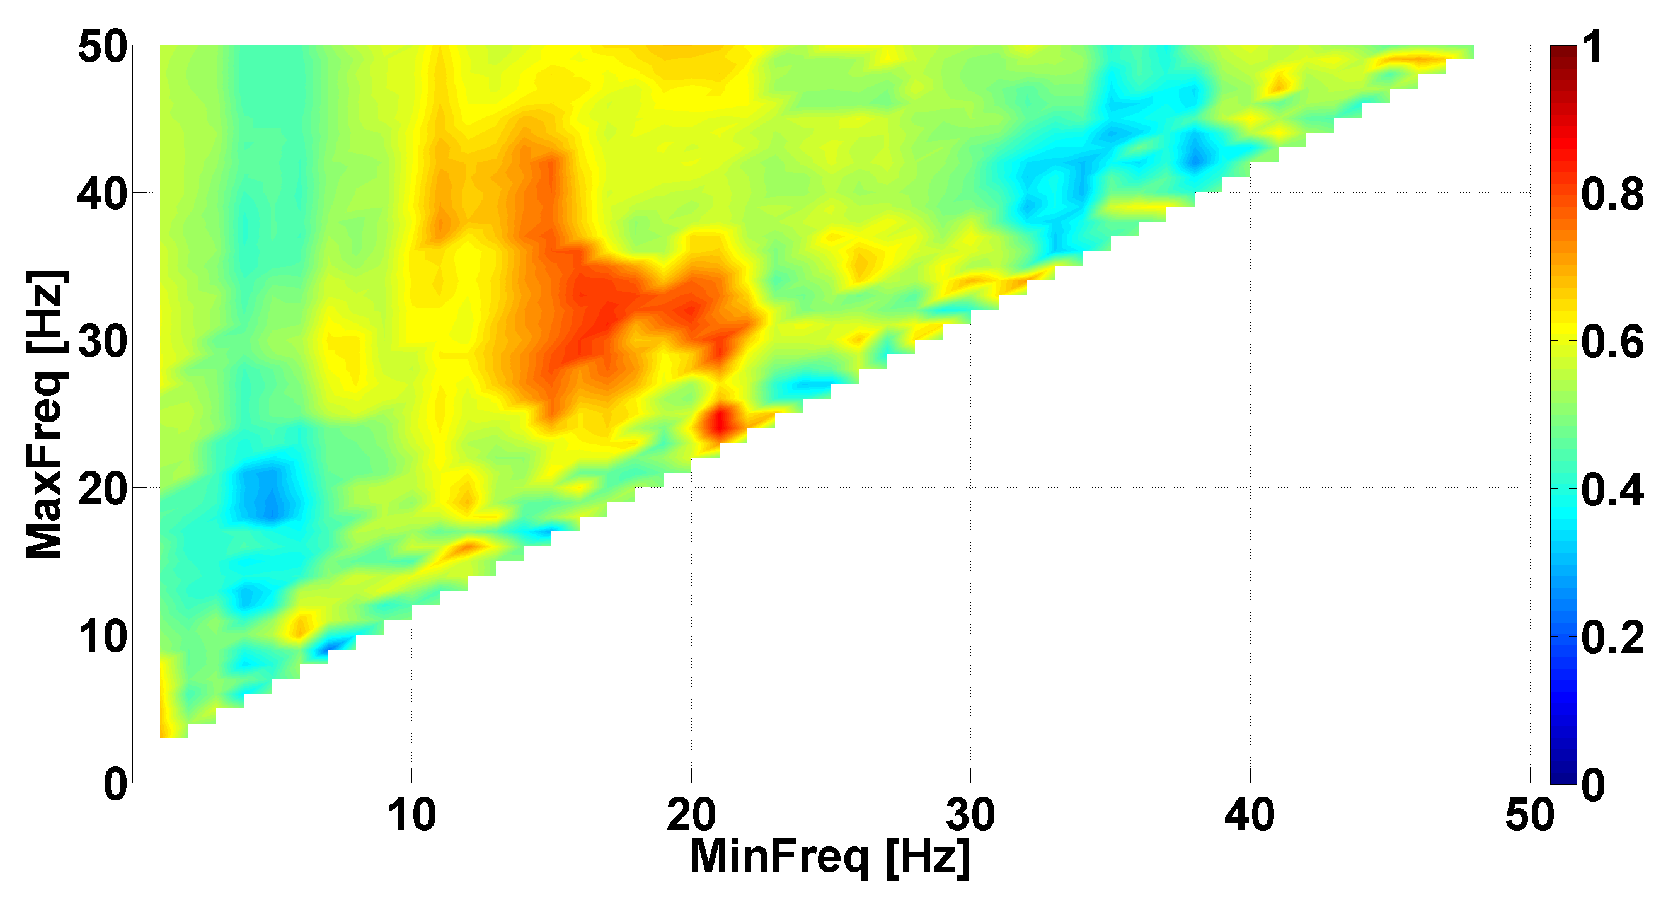
| The first blue area | 2.2–3.9 | 0.01–27 | 0.6–1 | 0.7–1.4 | … | 0 | 0.00007 |
| The first red area | 4–6 | 2–4500 | 1–5 | 0.5–1.2 | … | 1 | 0.00005 |
| The second red area | 8–18 | 1–1200 | 0.4–2 | 1–8 | −2.2…+1.1 | 0.89 | 0.002 |
| The second blue area | 10–37 | 0.02–65 | 0.2–2.4 | 1.5–22 | … | 0.03 | 0.0003 |
Disclaimer/Publisher’s Note: The statements, opinions and data contained in all publications are solely those of the individual author(s) and contributor(s) and not of MDPI and/or the editor(s). MDPI and/or the editor(s) disclaim responsibility for any injury to people or property resulting from any ideas, methods, instructions or products referred to in the content. |
© 2023 by the authors. Licensee MDPI, Basel, Switzerland. This article is an open access article distributed under the terms and conditions of the Creative Commons Attribution (CC BY) license (https://creativecommons.org/licenses/by/4.0/).
Share and Cite
Sushkova, O.S.; Morozov, A.A.; Kershner, I.A.; Khokhlova, M.N.; Gabova, A.V.; Karabanov, A.V.; Chigaleichick, L.A.; Illarioshkin, S.N. Investigation of Phase Shifts Using AUC Diagrams: Application to Differential Diagnosis of Parkinson’s Disease and Essential Tremor. Sensors 2023, 23, 1531. https://doi.org/10.3390/s23031531
Sushkova OS, Morozov AA, Kershner IA, Khokhlova MN, Gabova AV, Karabanov AV, Chigaleichick LA, Illarioshkin SN. Investigation of Phase Shifts Using AUC Diagrams: Application to Differential Diagnosis of Parkinson’s Disease and Essential Tremor. Sensors. 2023; 23(3):1531. https://doi.org/10.3390/s23031531
Chicago/Turabian StyleSushkova, Olga S., Alexei A. Morozov, Ivan A. Kershner, Margarita N. Khokhlova, Alexandra V. Gabova, Alexei V. Karabanov, Larisa A. Chigaleichick, and Sergei N. Illarioshkin. 2023. "Investigation of Phase Shifts Using AUC Diagrams: Application to Differential Diagnosis of Parkinson’s Disease and Essential Tremor" Sensors 23, no. 3: 1531. https://doi.org/10.3390/s23031531
APA StyleSushkova, O. S., Morozov, A. A., Kershner, I. A., Khokhlova, M. N., Gabova, A. V., Karabanov, A. V., Chigaleichick, L. A., & Illarioshkin, S. N. (2023). Investigation of Phase Shifts Using AUC Diagrams: Application to Differential Diagnosis of Parkinson’s Disease and Essential Tremor. Sensors, 23(3), 1531. https://doi.org/10.3390/s23031531