
Deep Learning-Based Driver’s Hands on/off Prediction System Using In-Vehicle Data


Abstract
1. Introduction
- A data collection system that we made can help save significant time and cost to prepare data for training a deep learning model, and supervised by making data to be collected with labels. It guarantees high precision and can be utilized to similar tasks with a few modifications.
- We utilized in-vehicle data instead of any extra sensors. It helps us to reduce development costs and to make a system more reliable.
- The proposed new metric, considering the state transition, helps to understand the model’s performance in a more comprehensive way.
- Our model is validated in that it also works well for the new drivers. It can be used universally by the new drivers with few drivers’ data.
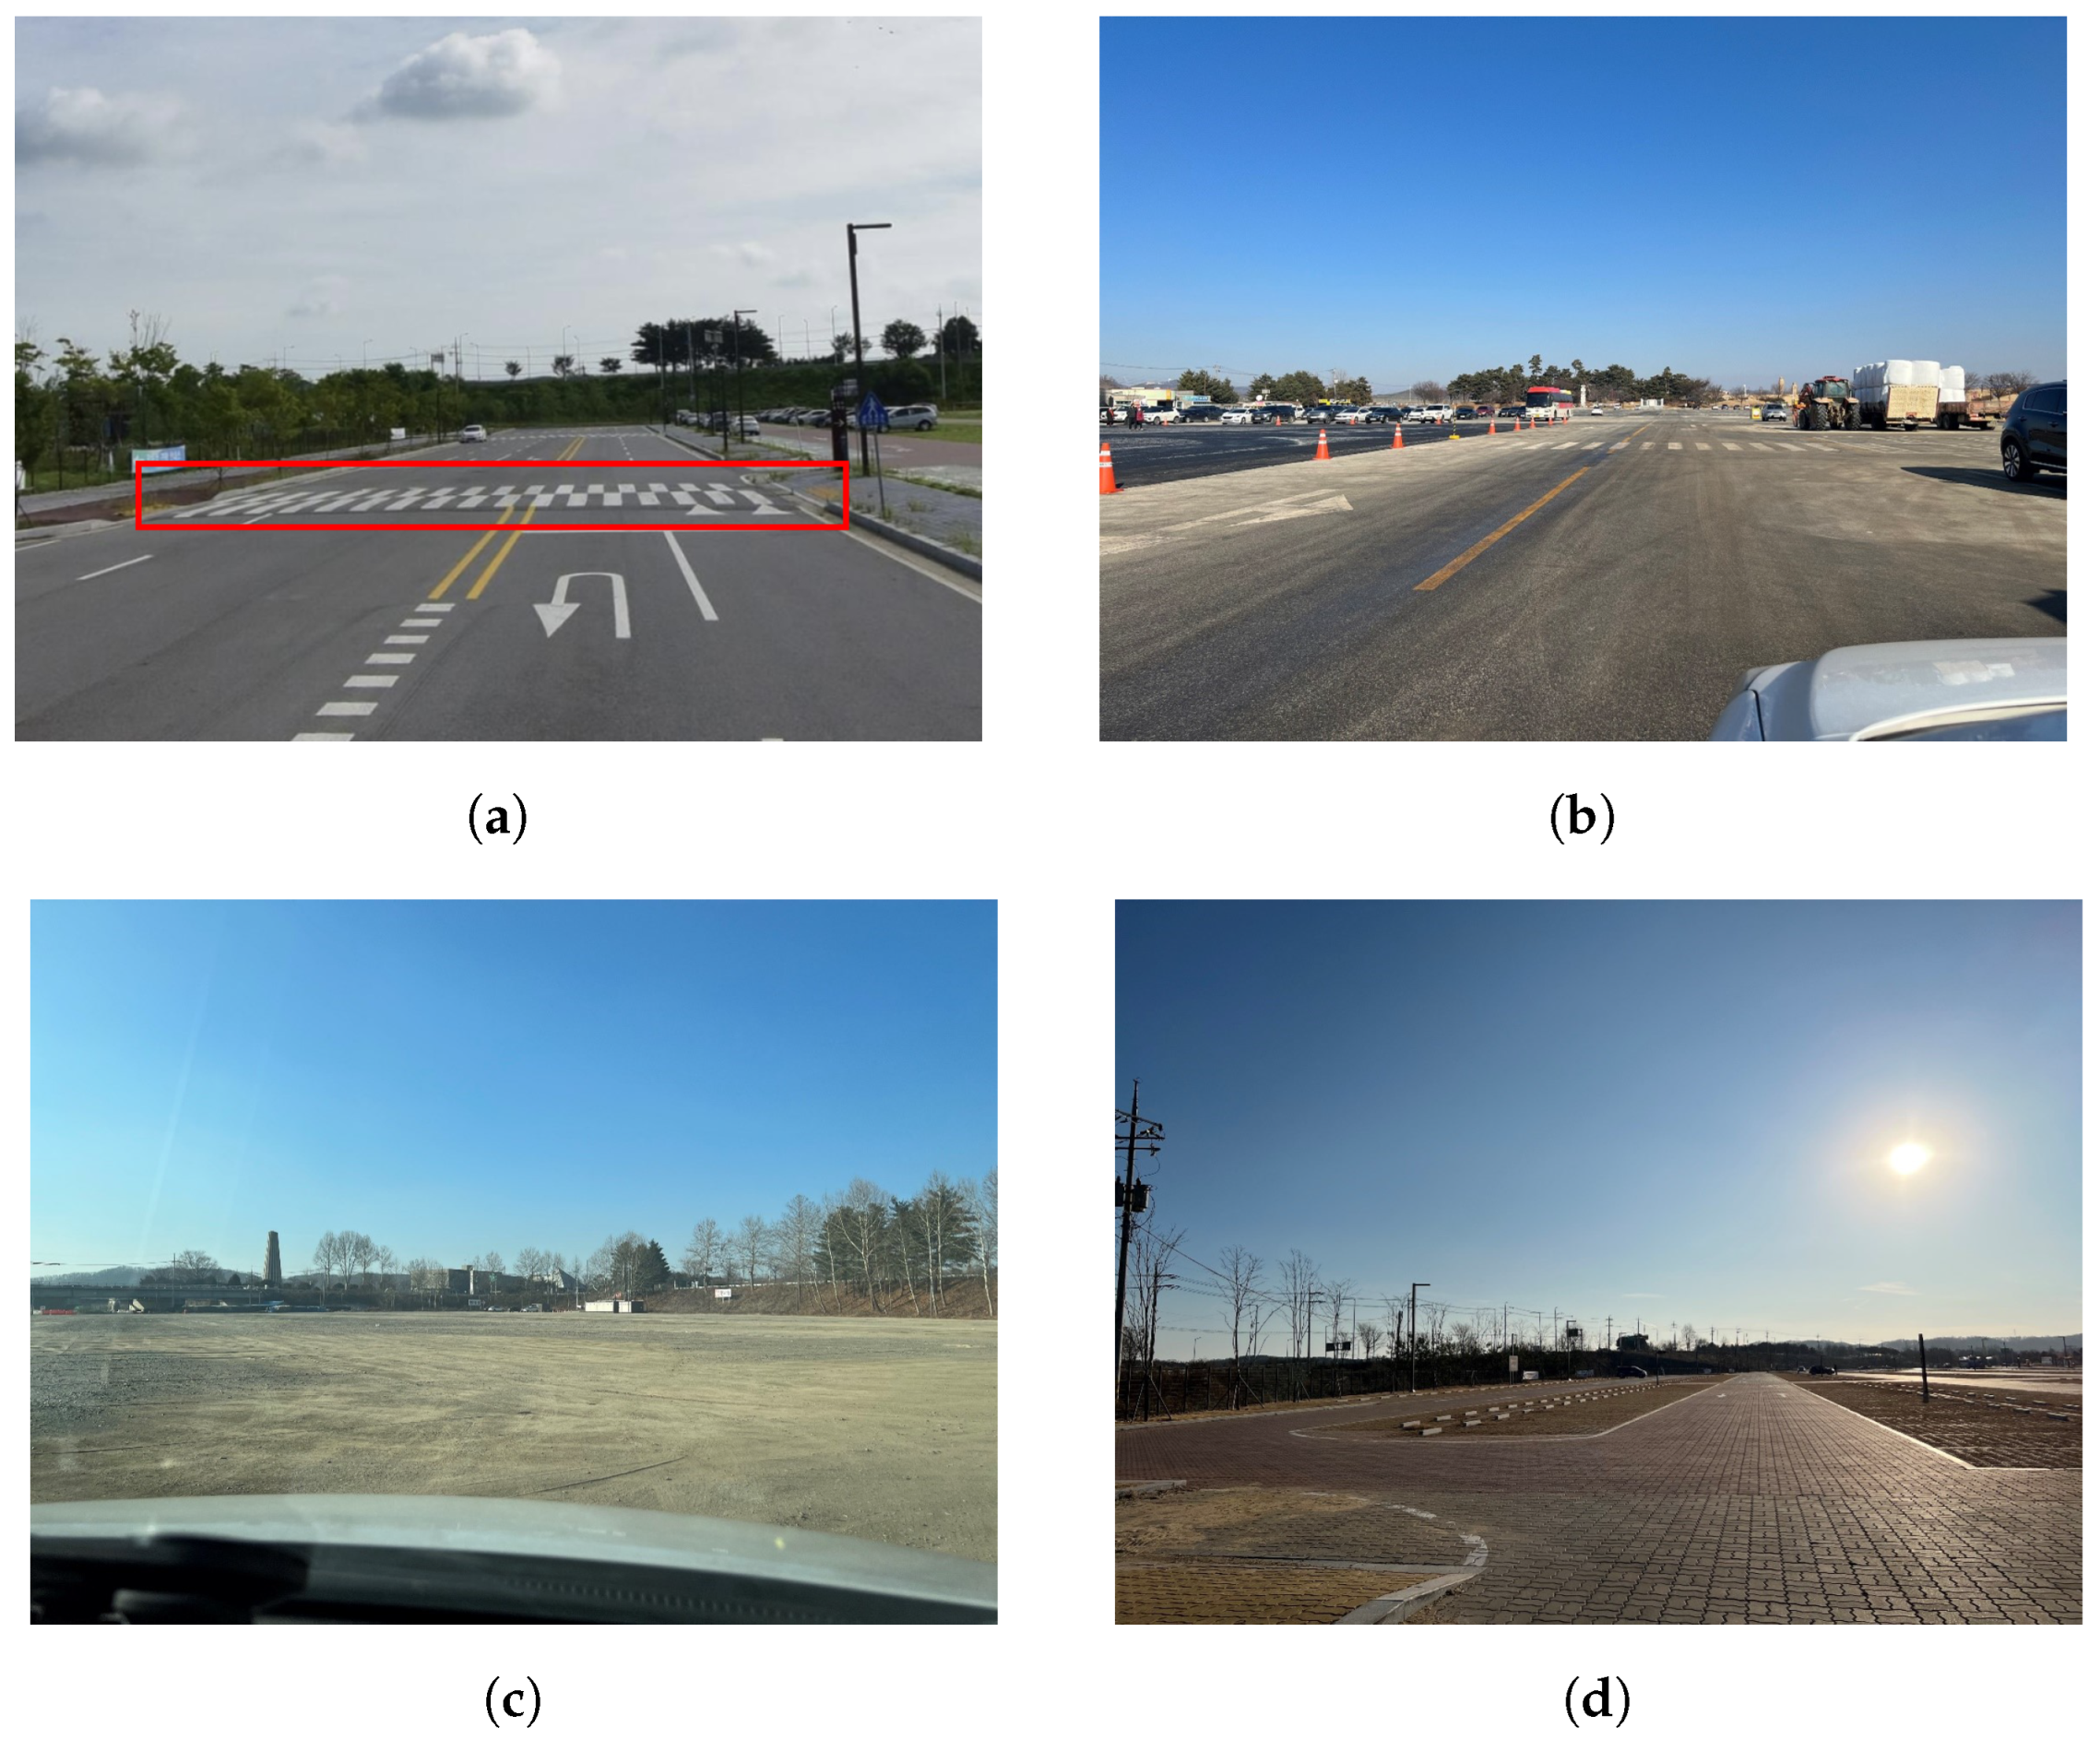
2. Dataset
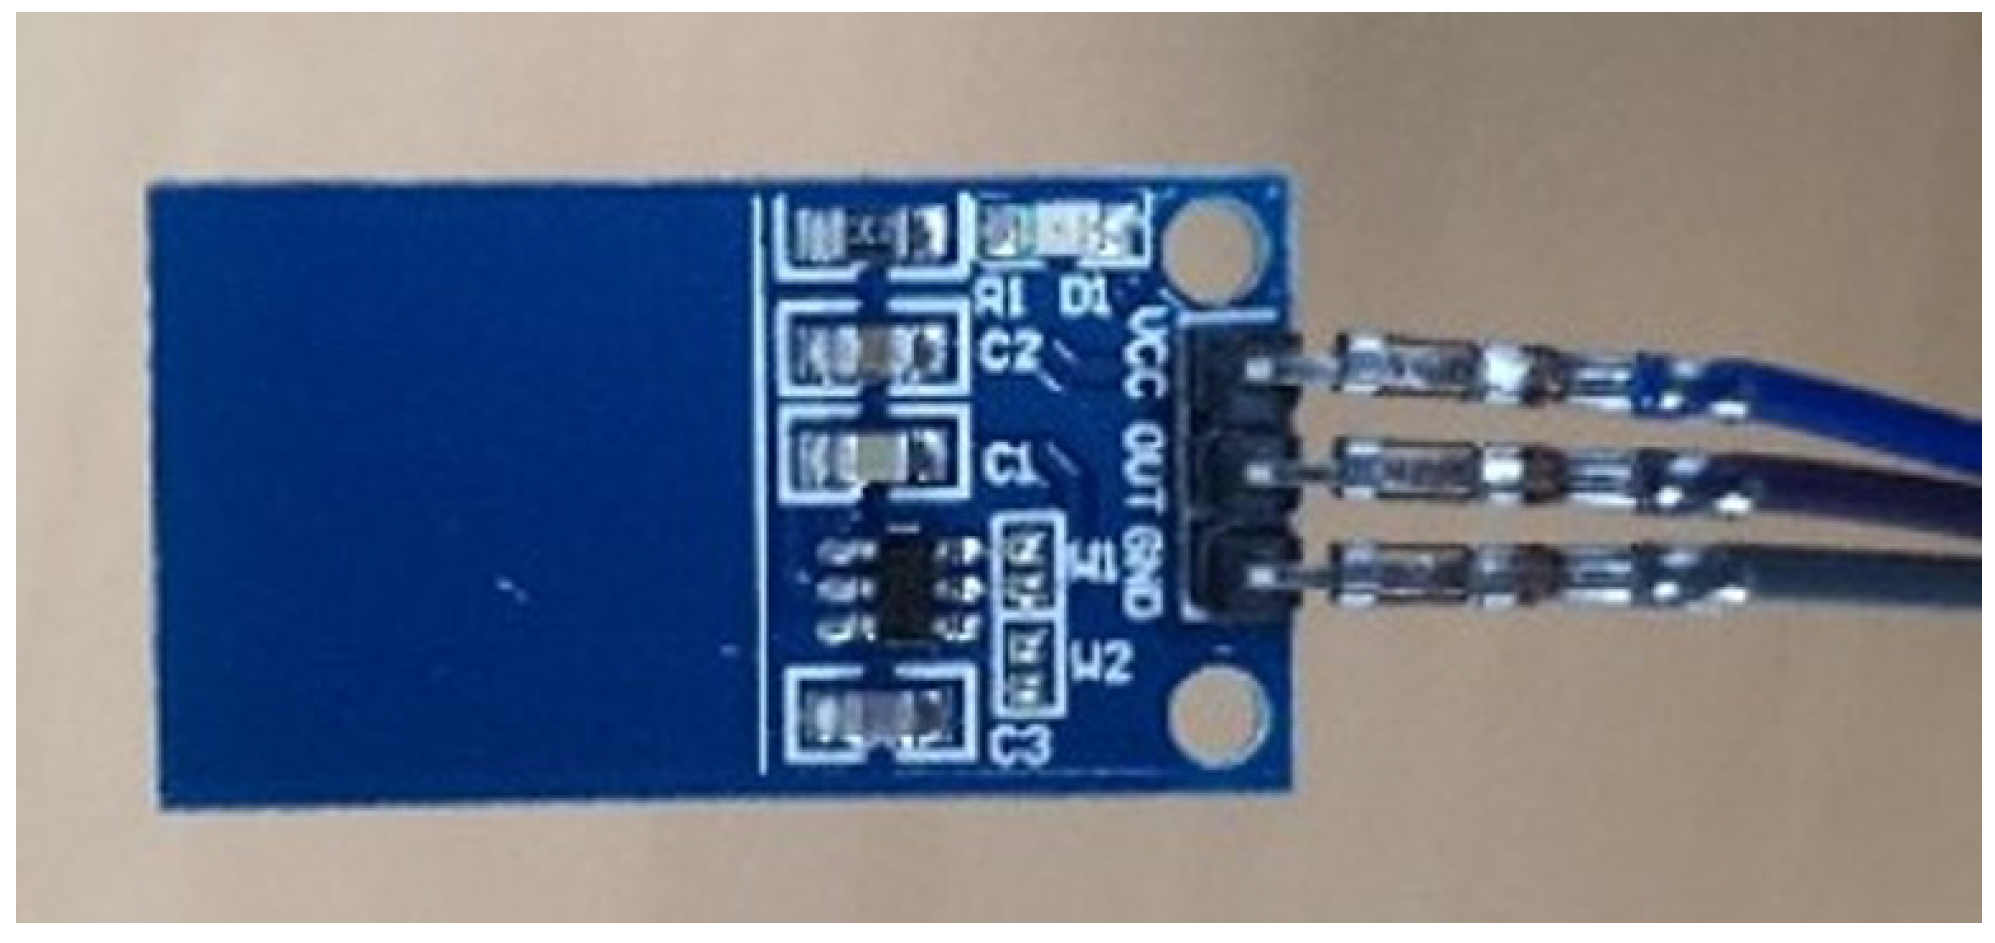
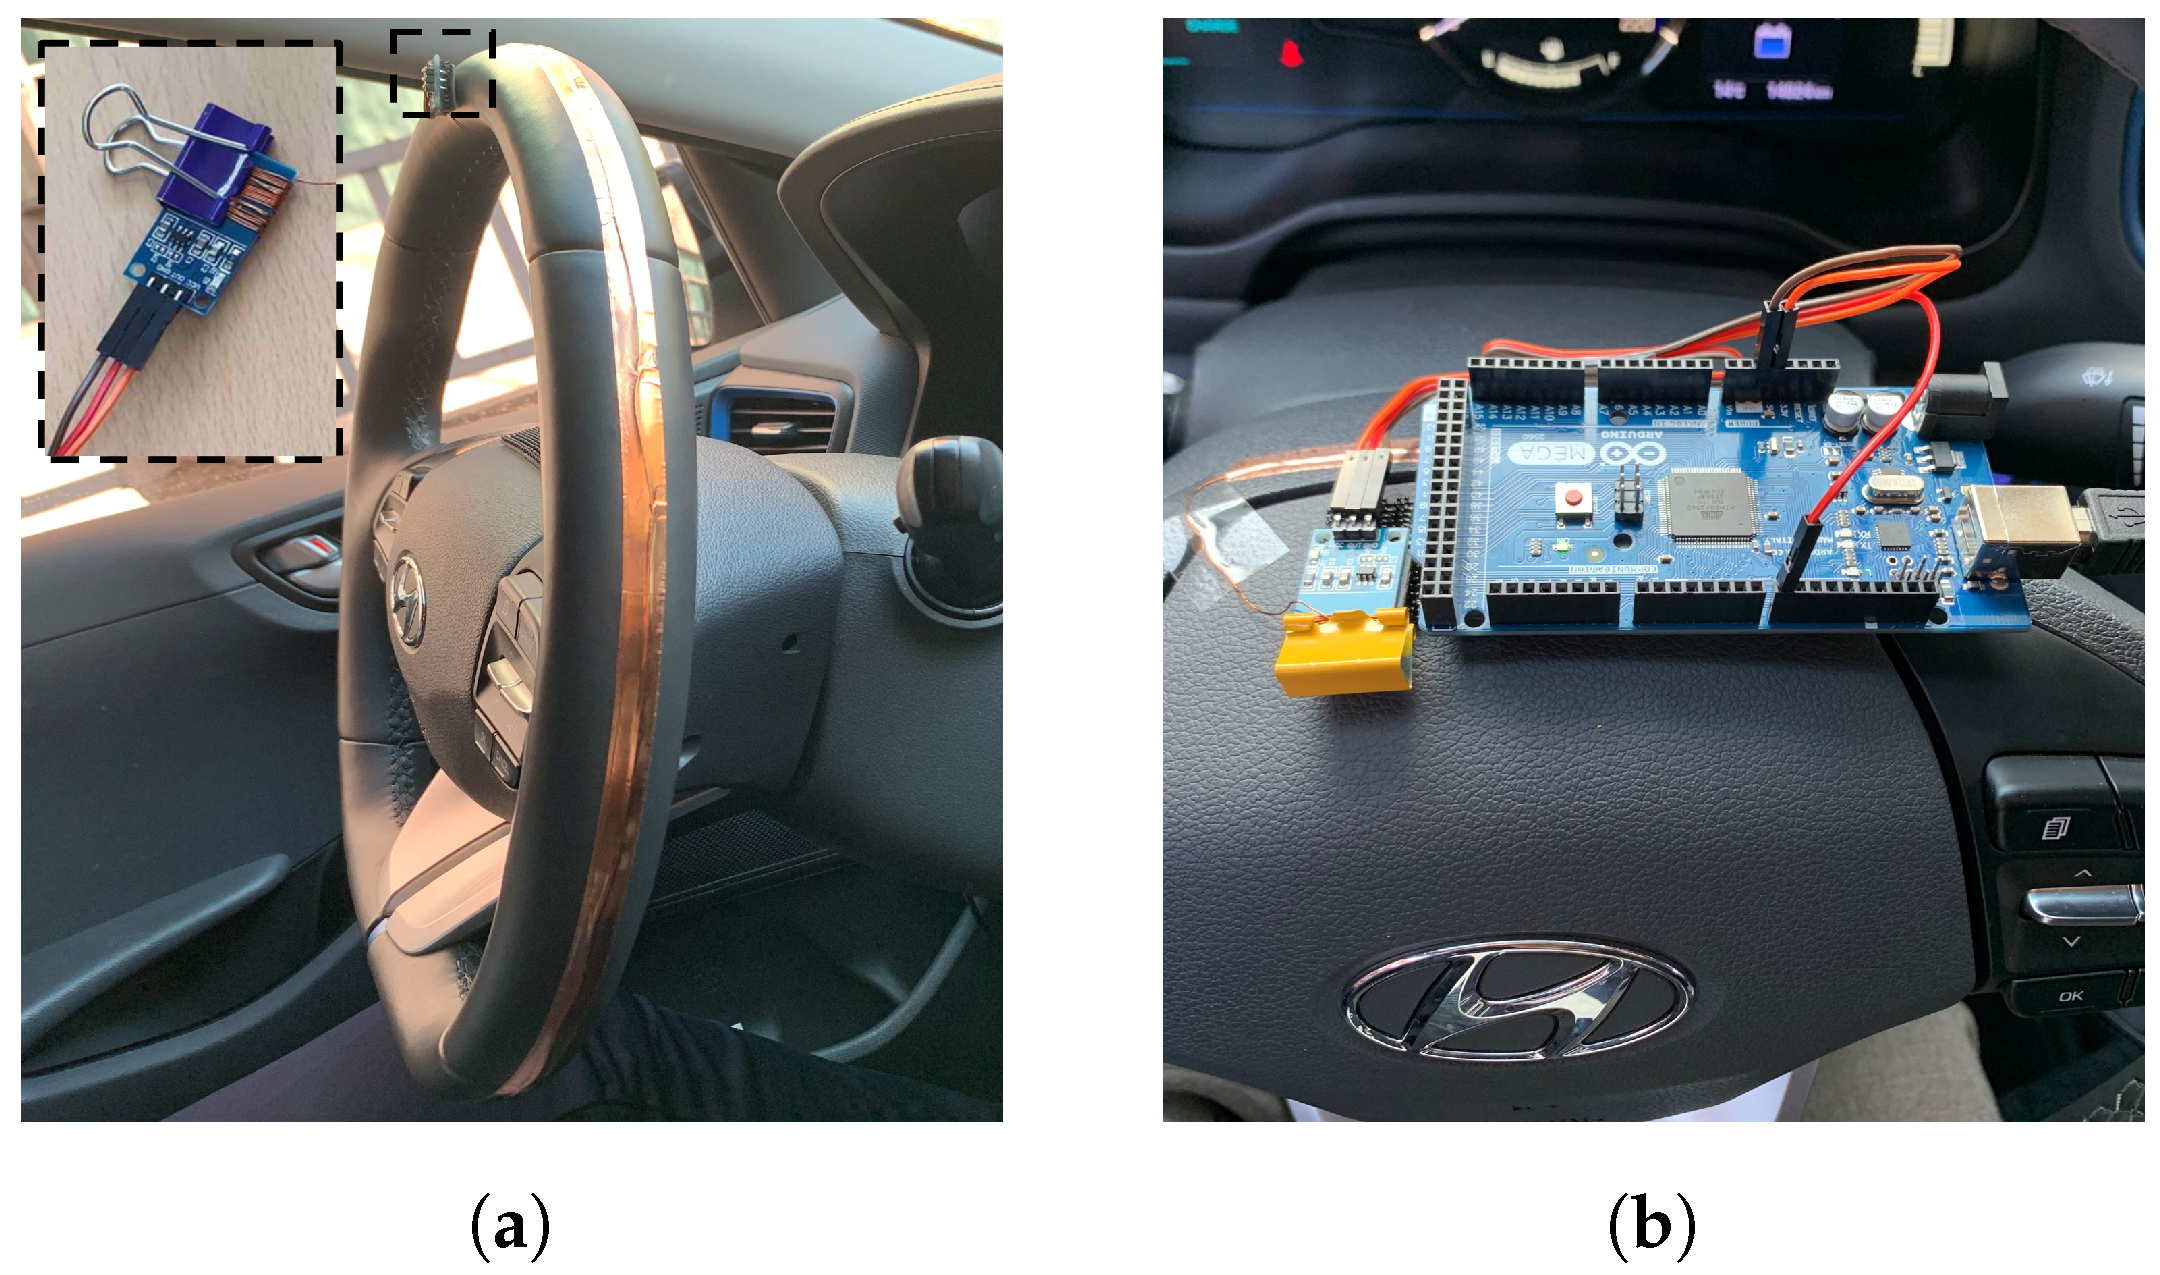
2.1. Data Collection System
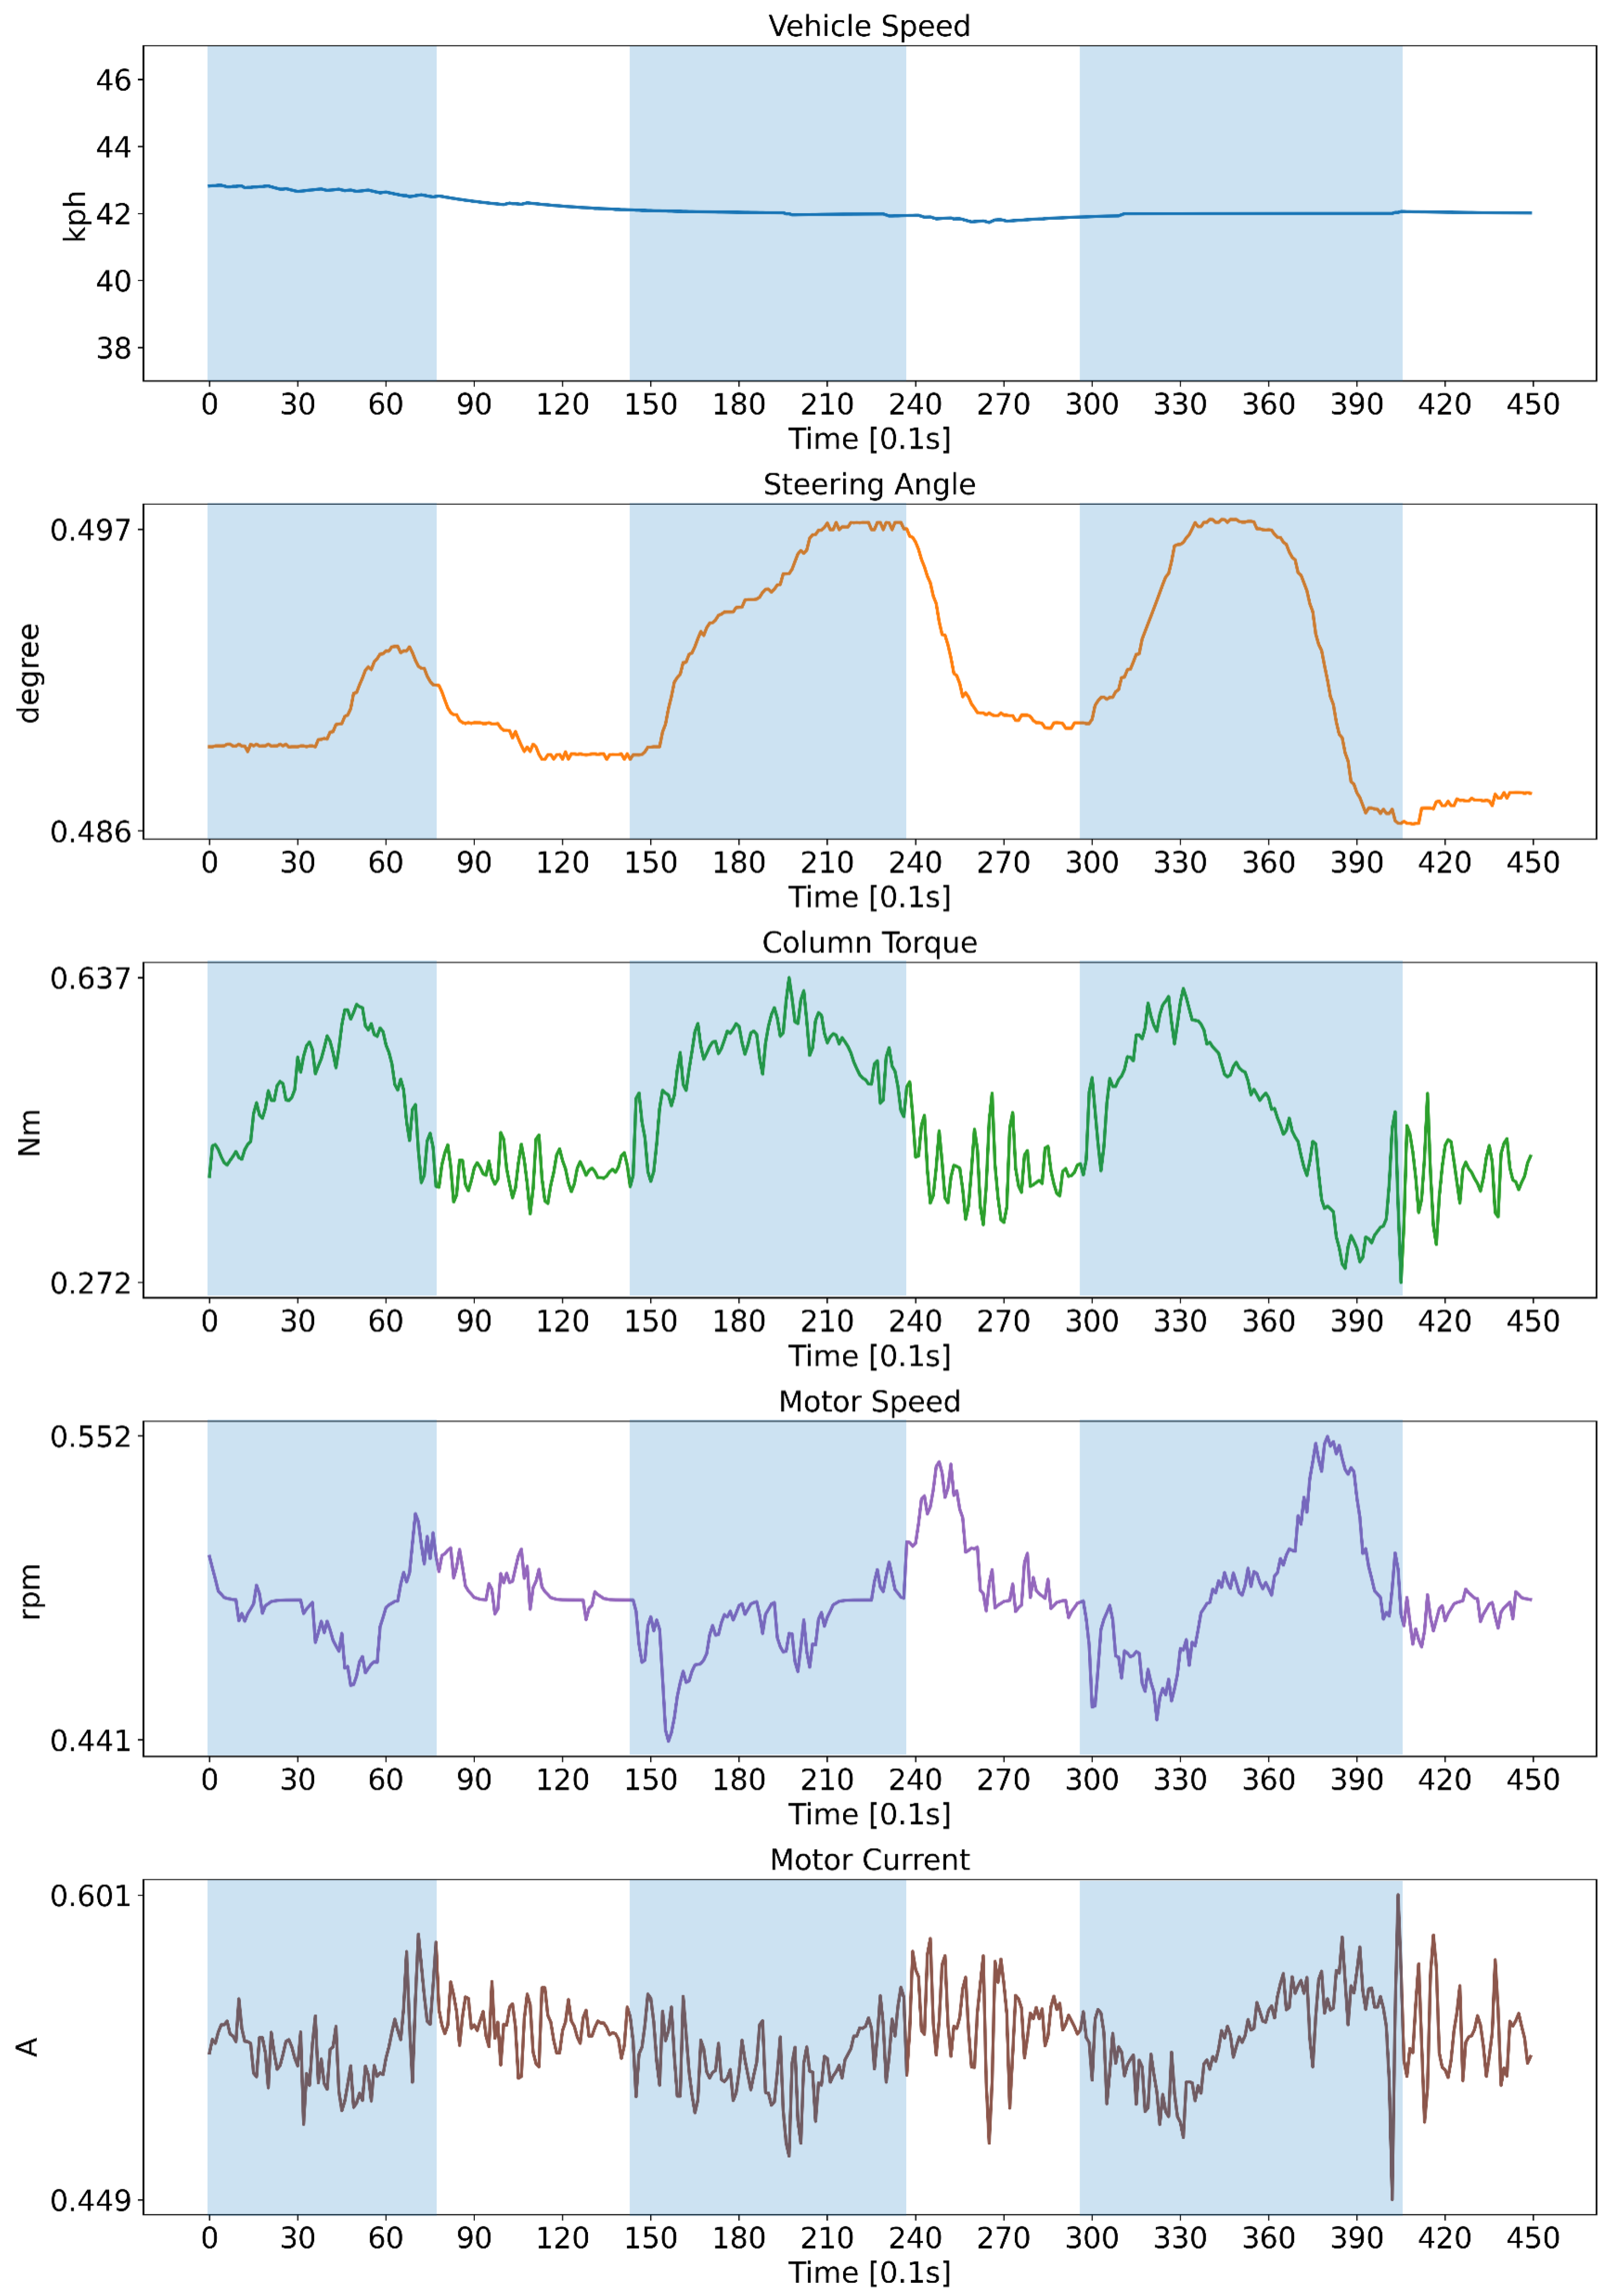
2.2. Data Description
2.3. Data Preprocessing
3. Proposed System
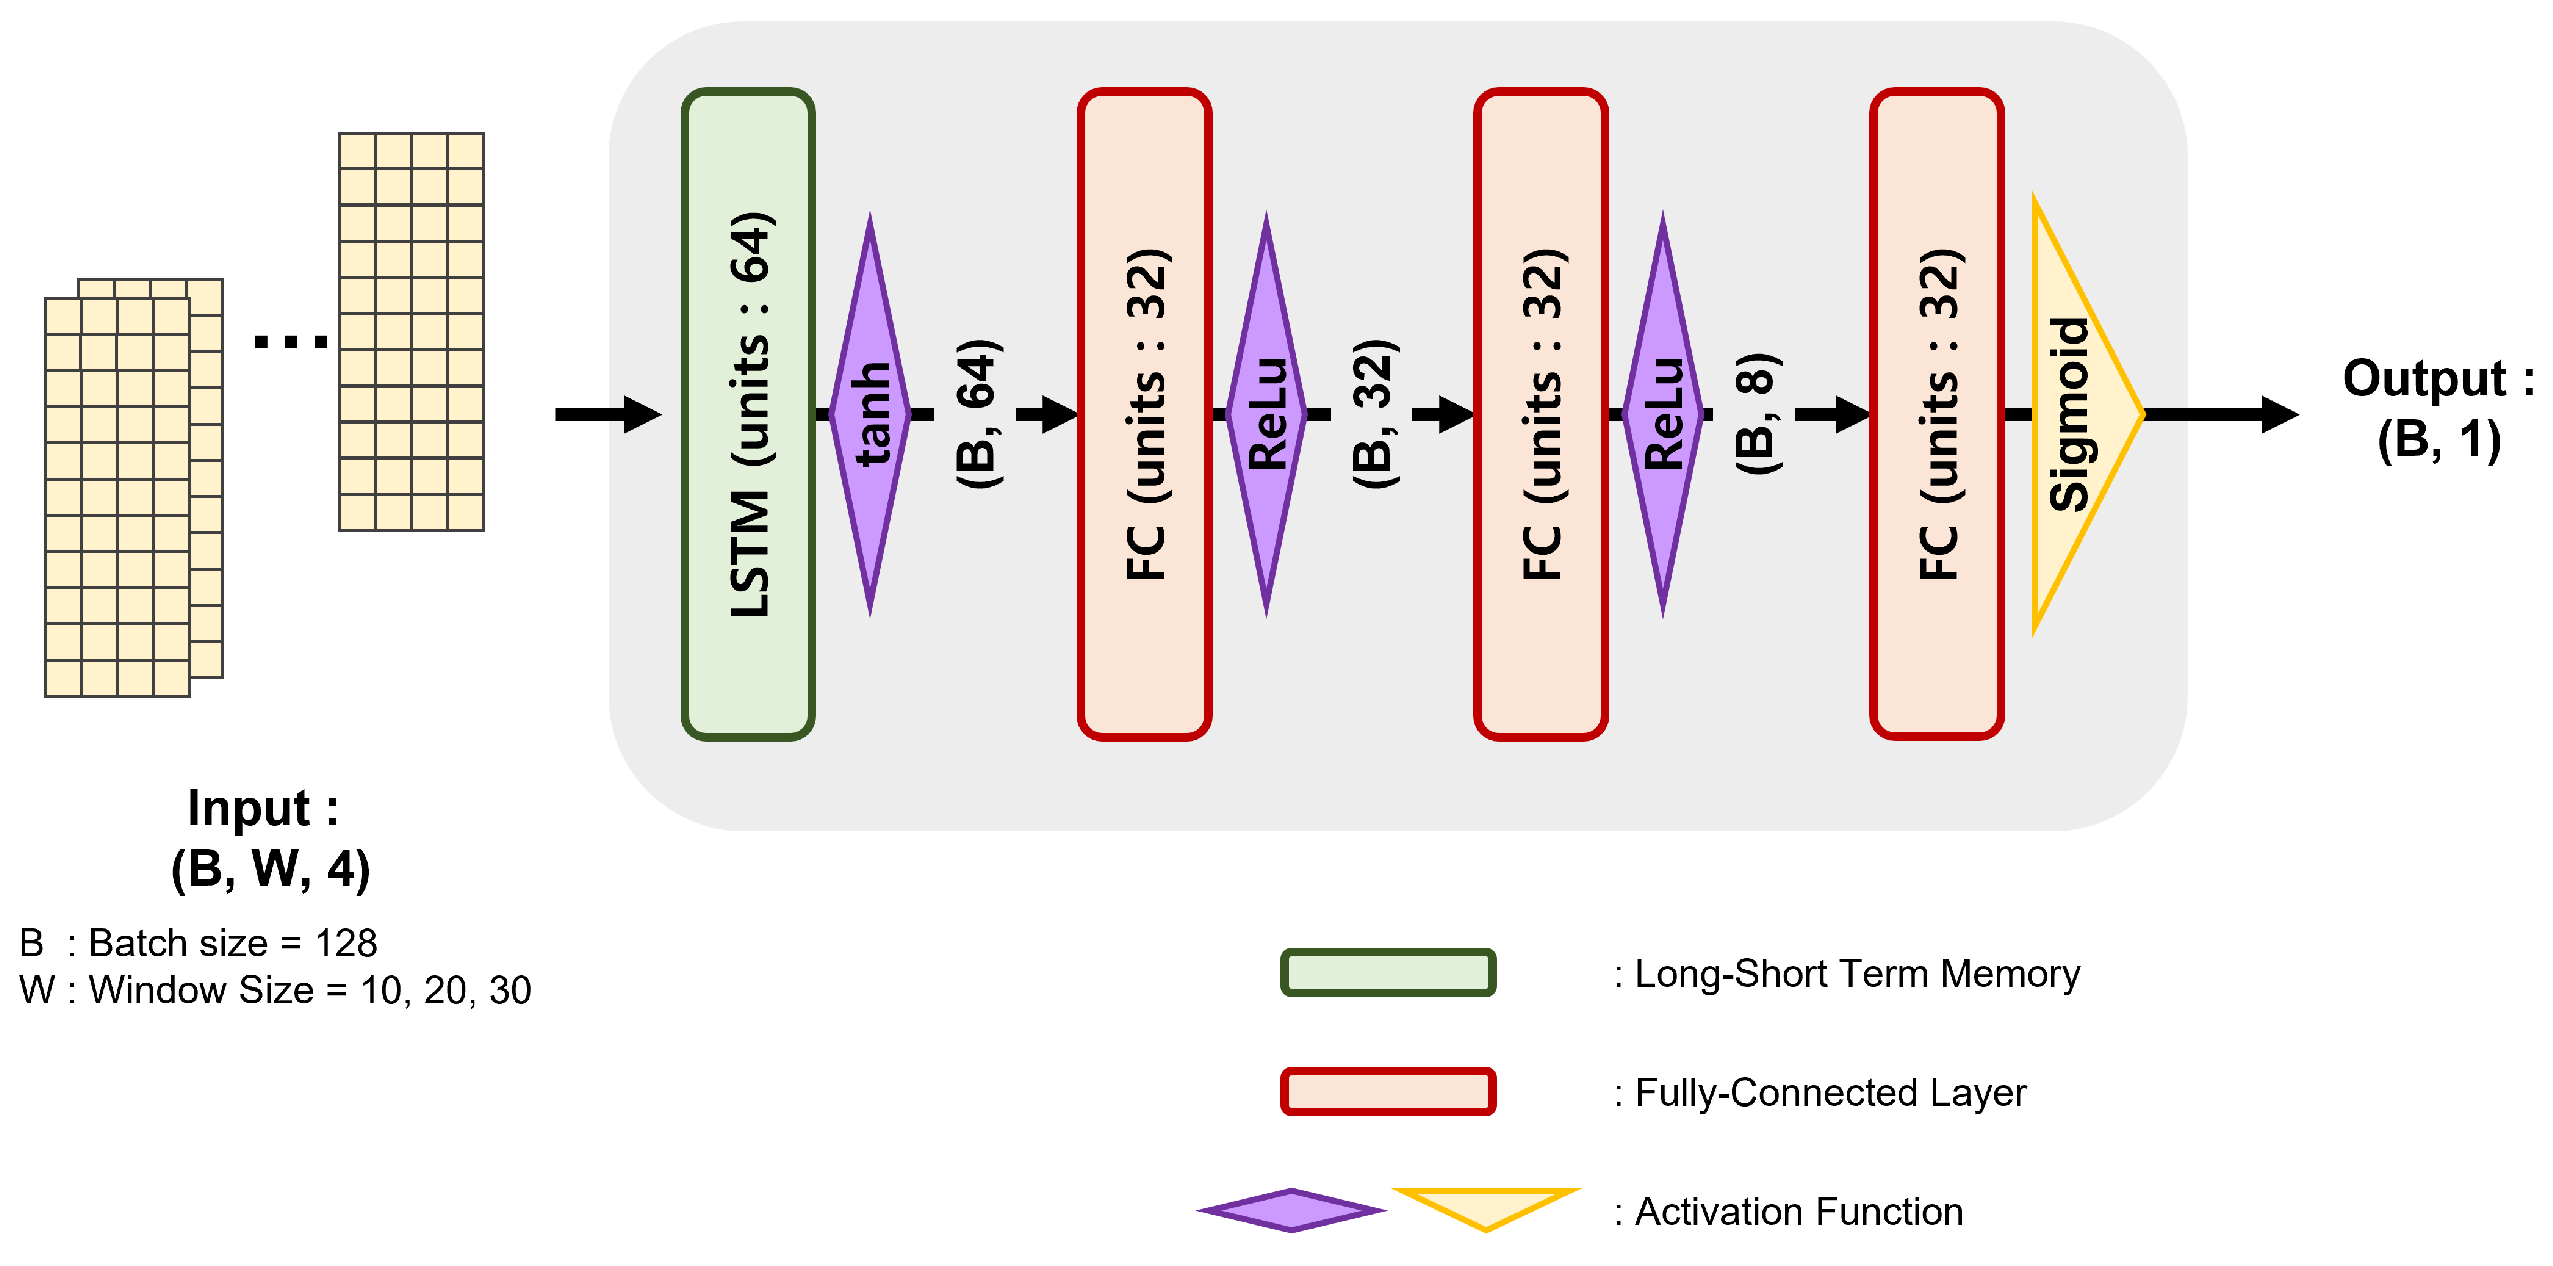
3.1. Model Architecture
3.2. Confidence Logic
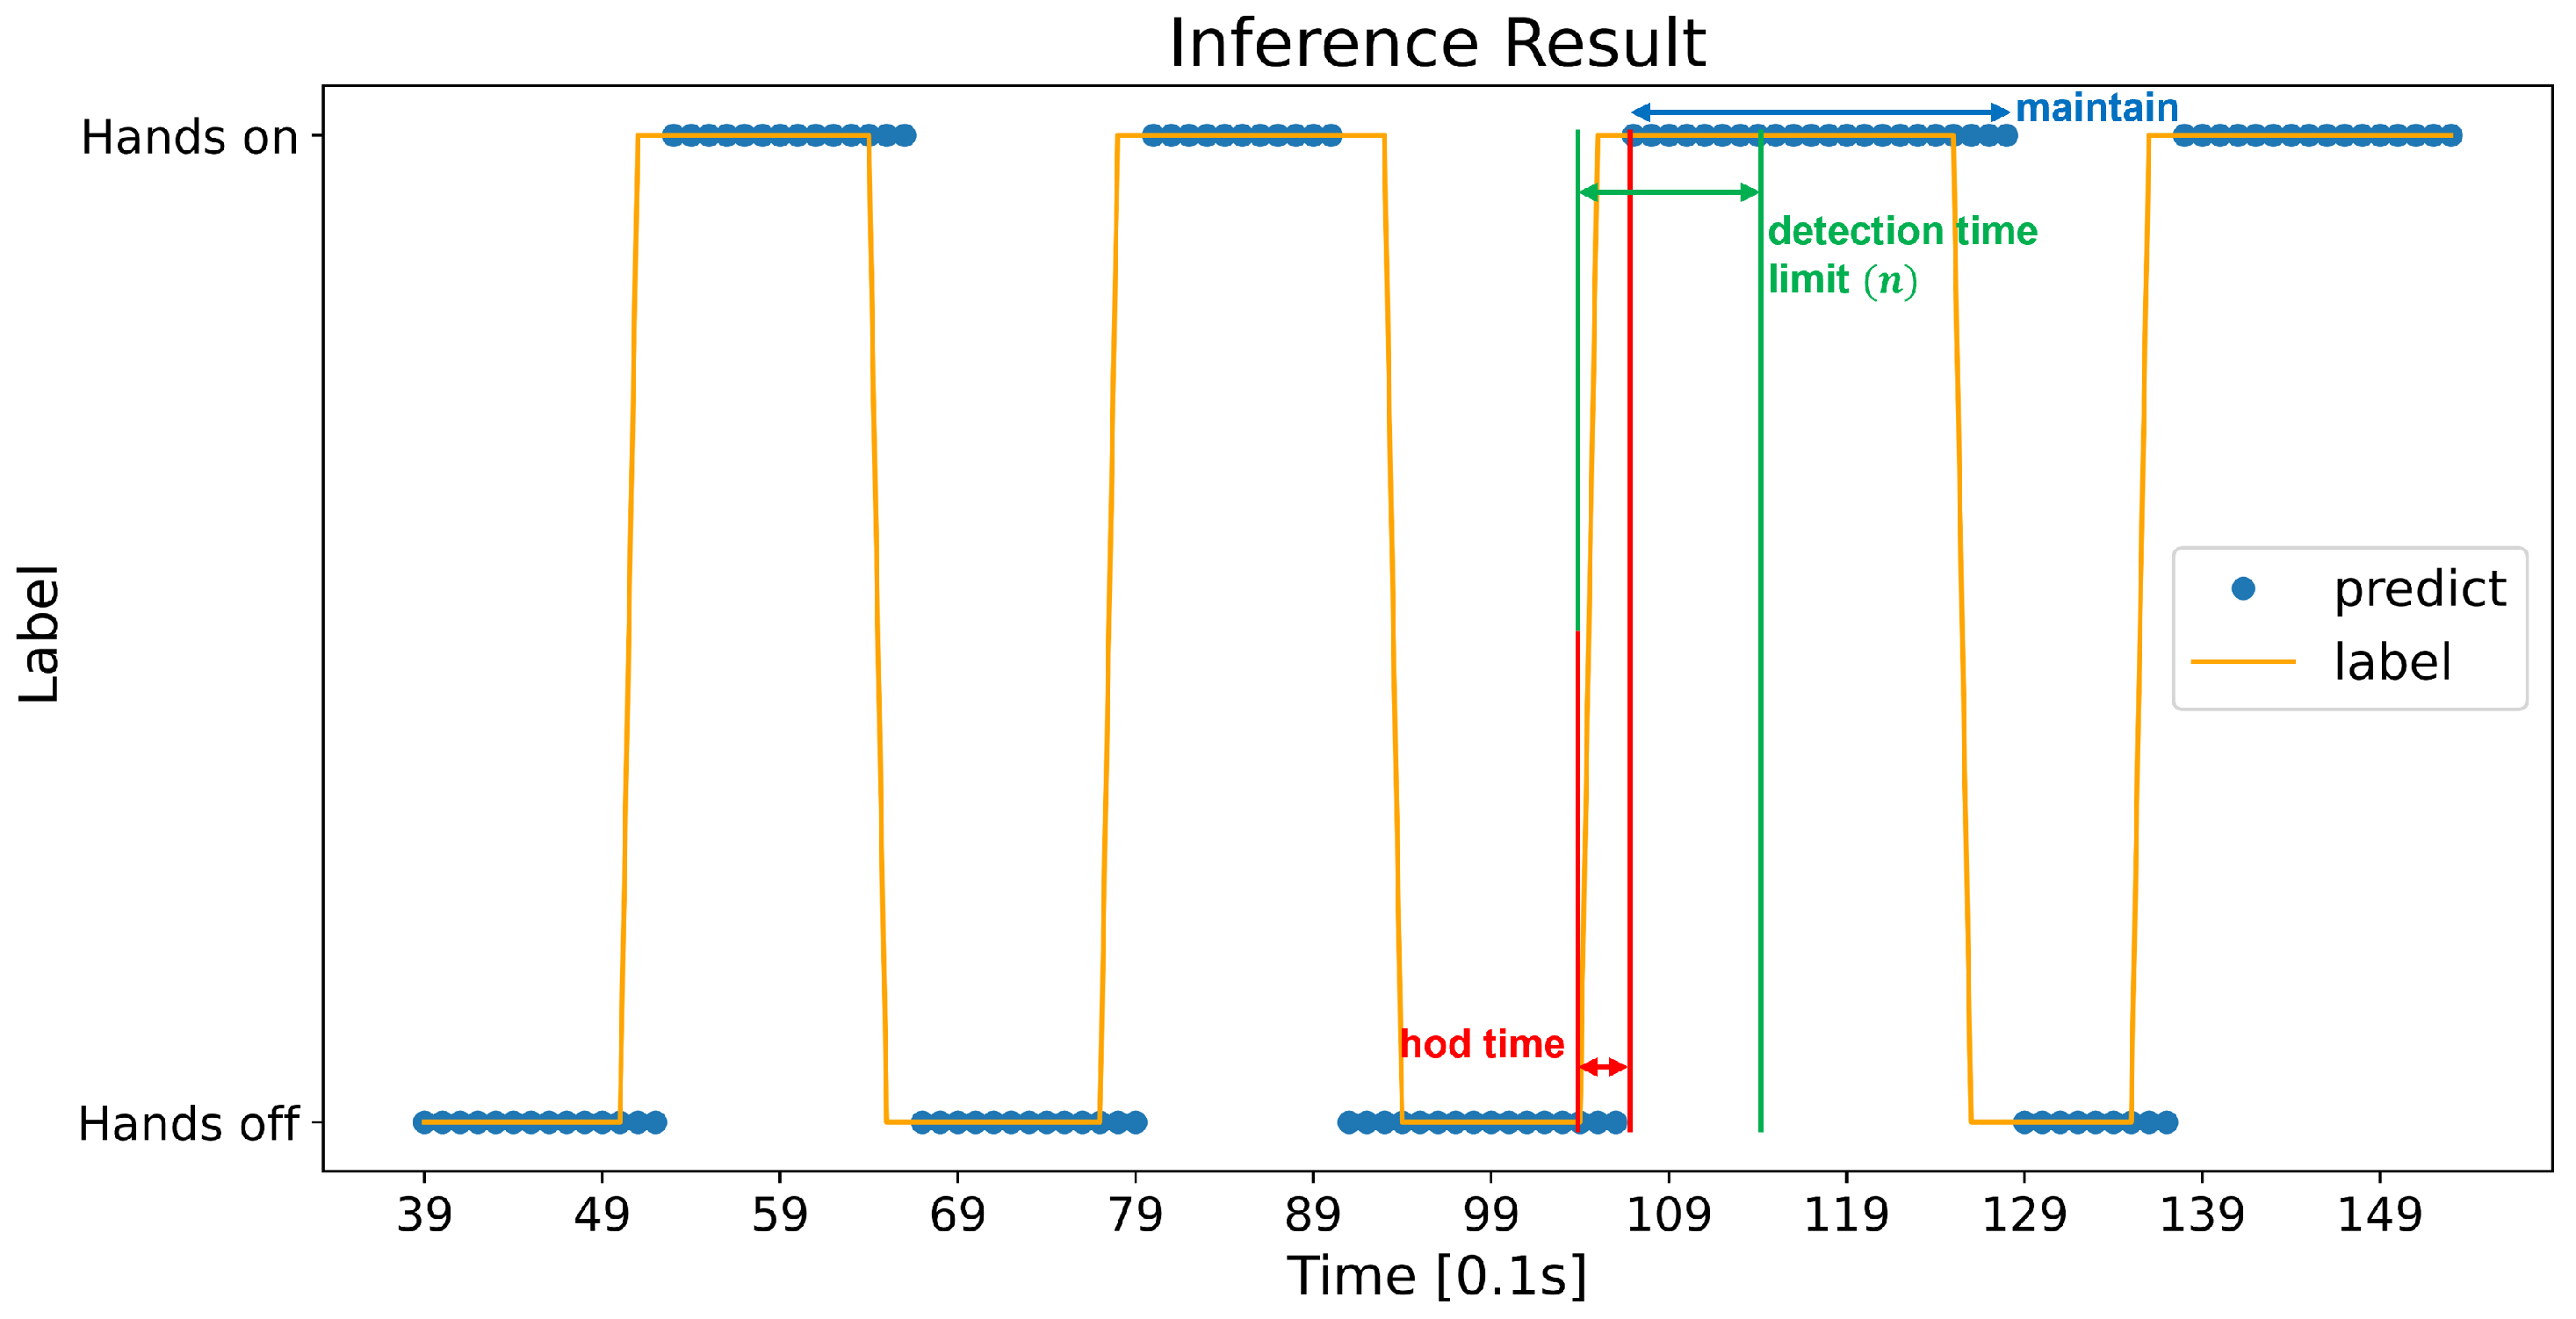
3.3. Evaluation Metric
4. Experiments and Results
4.1. Implementation Details
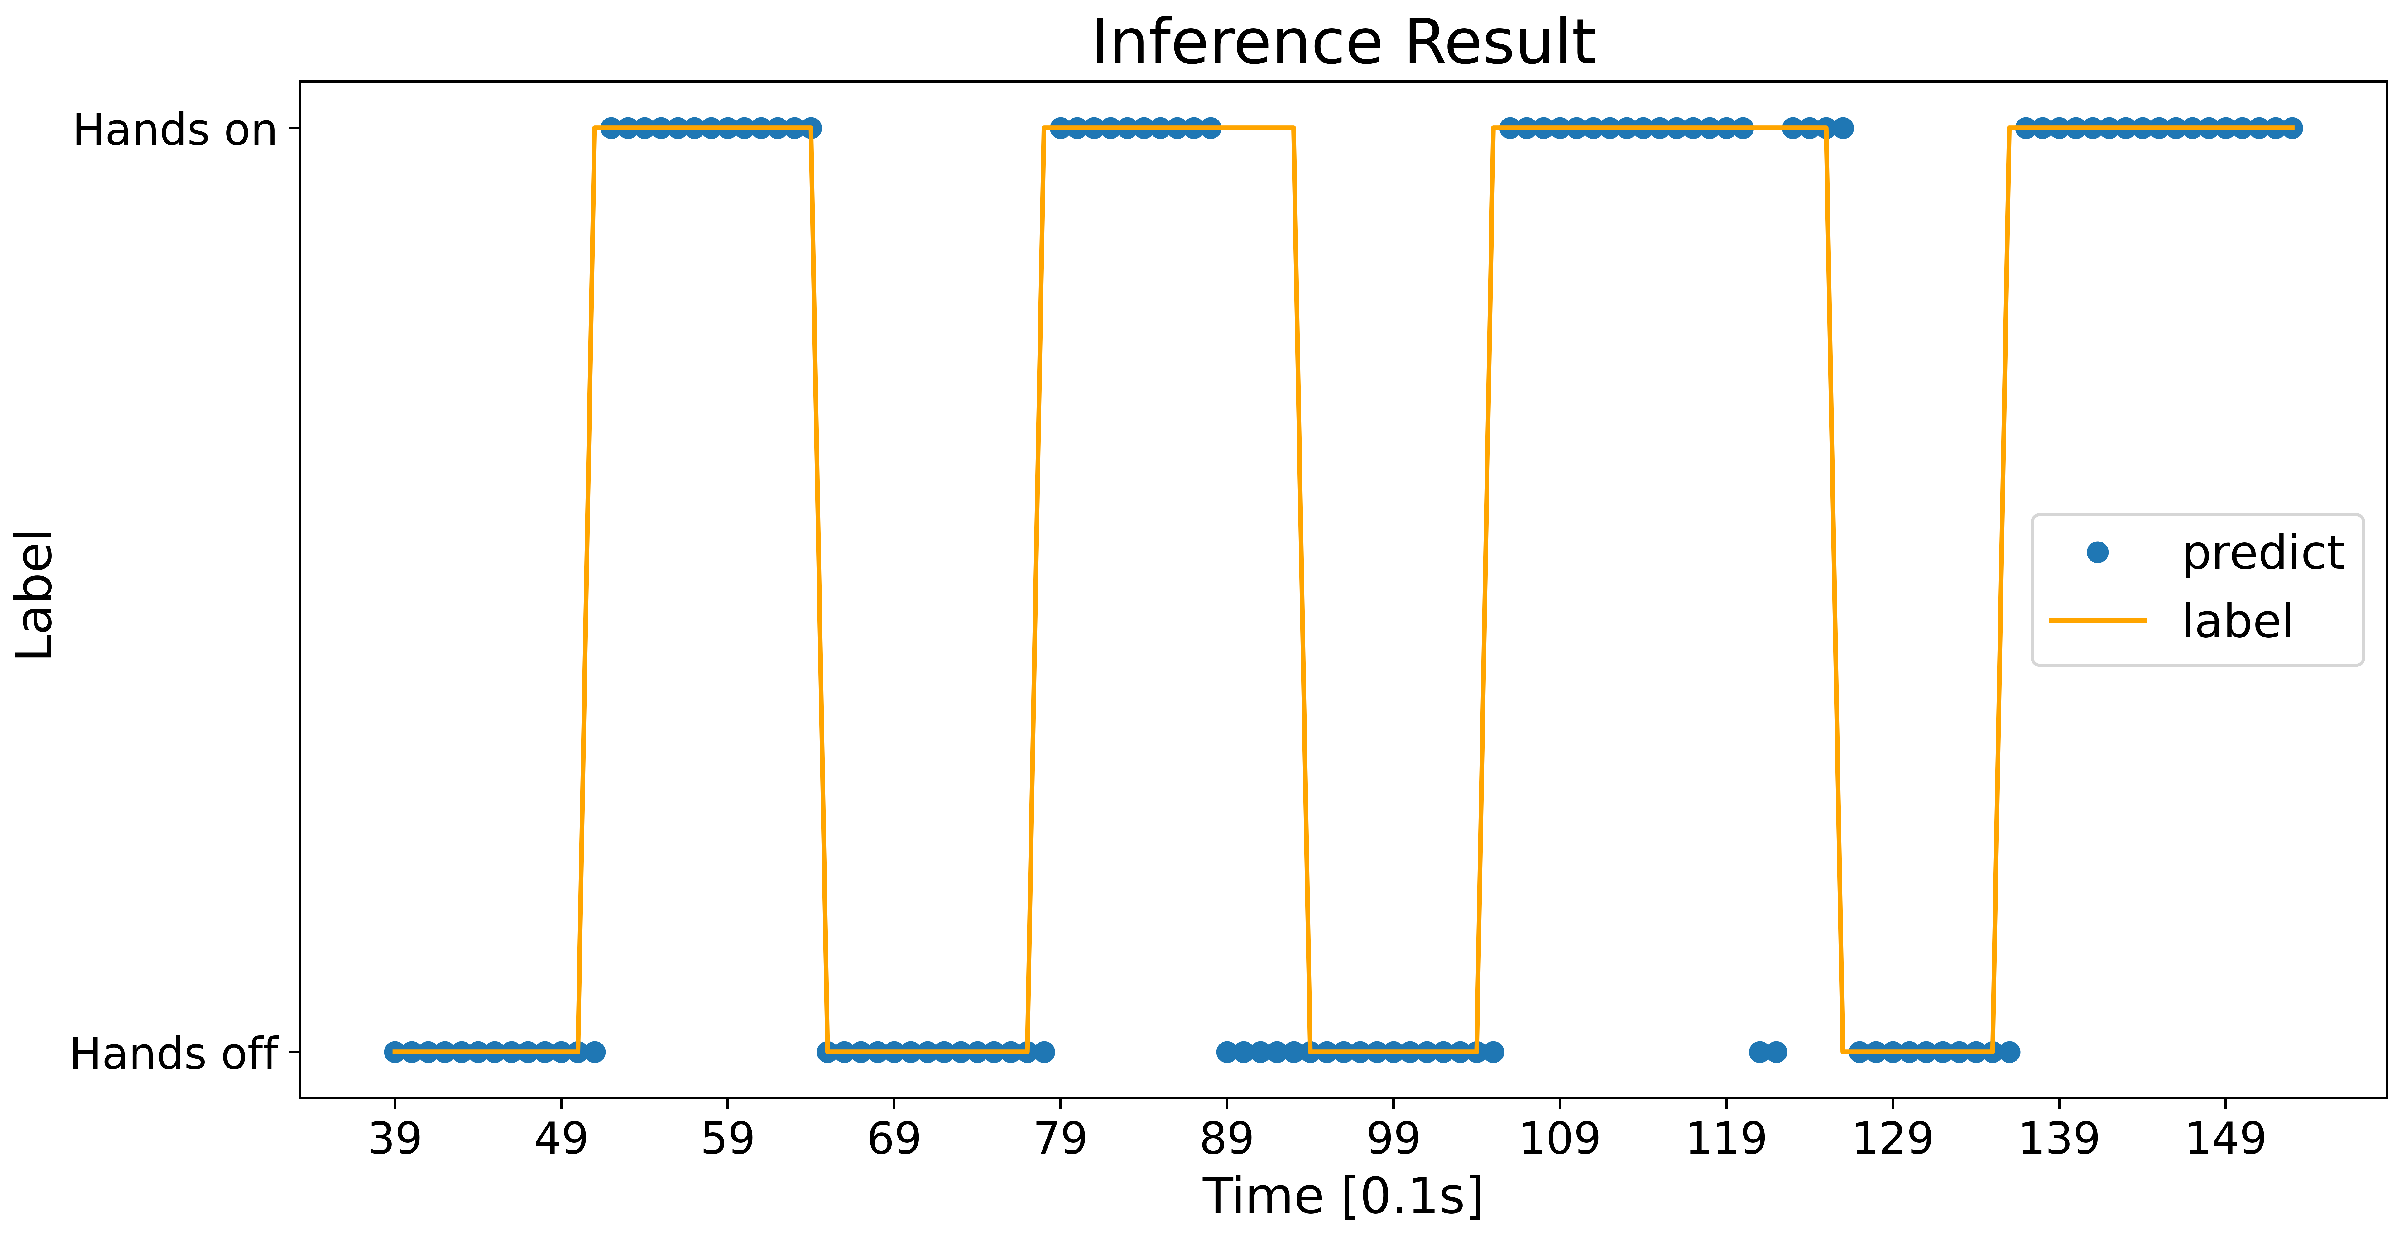
4.2. Training Results
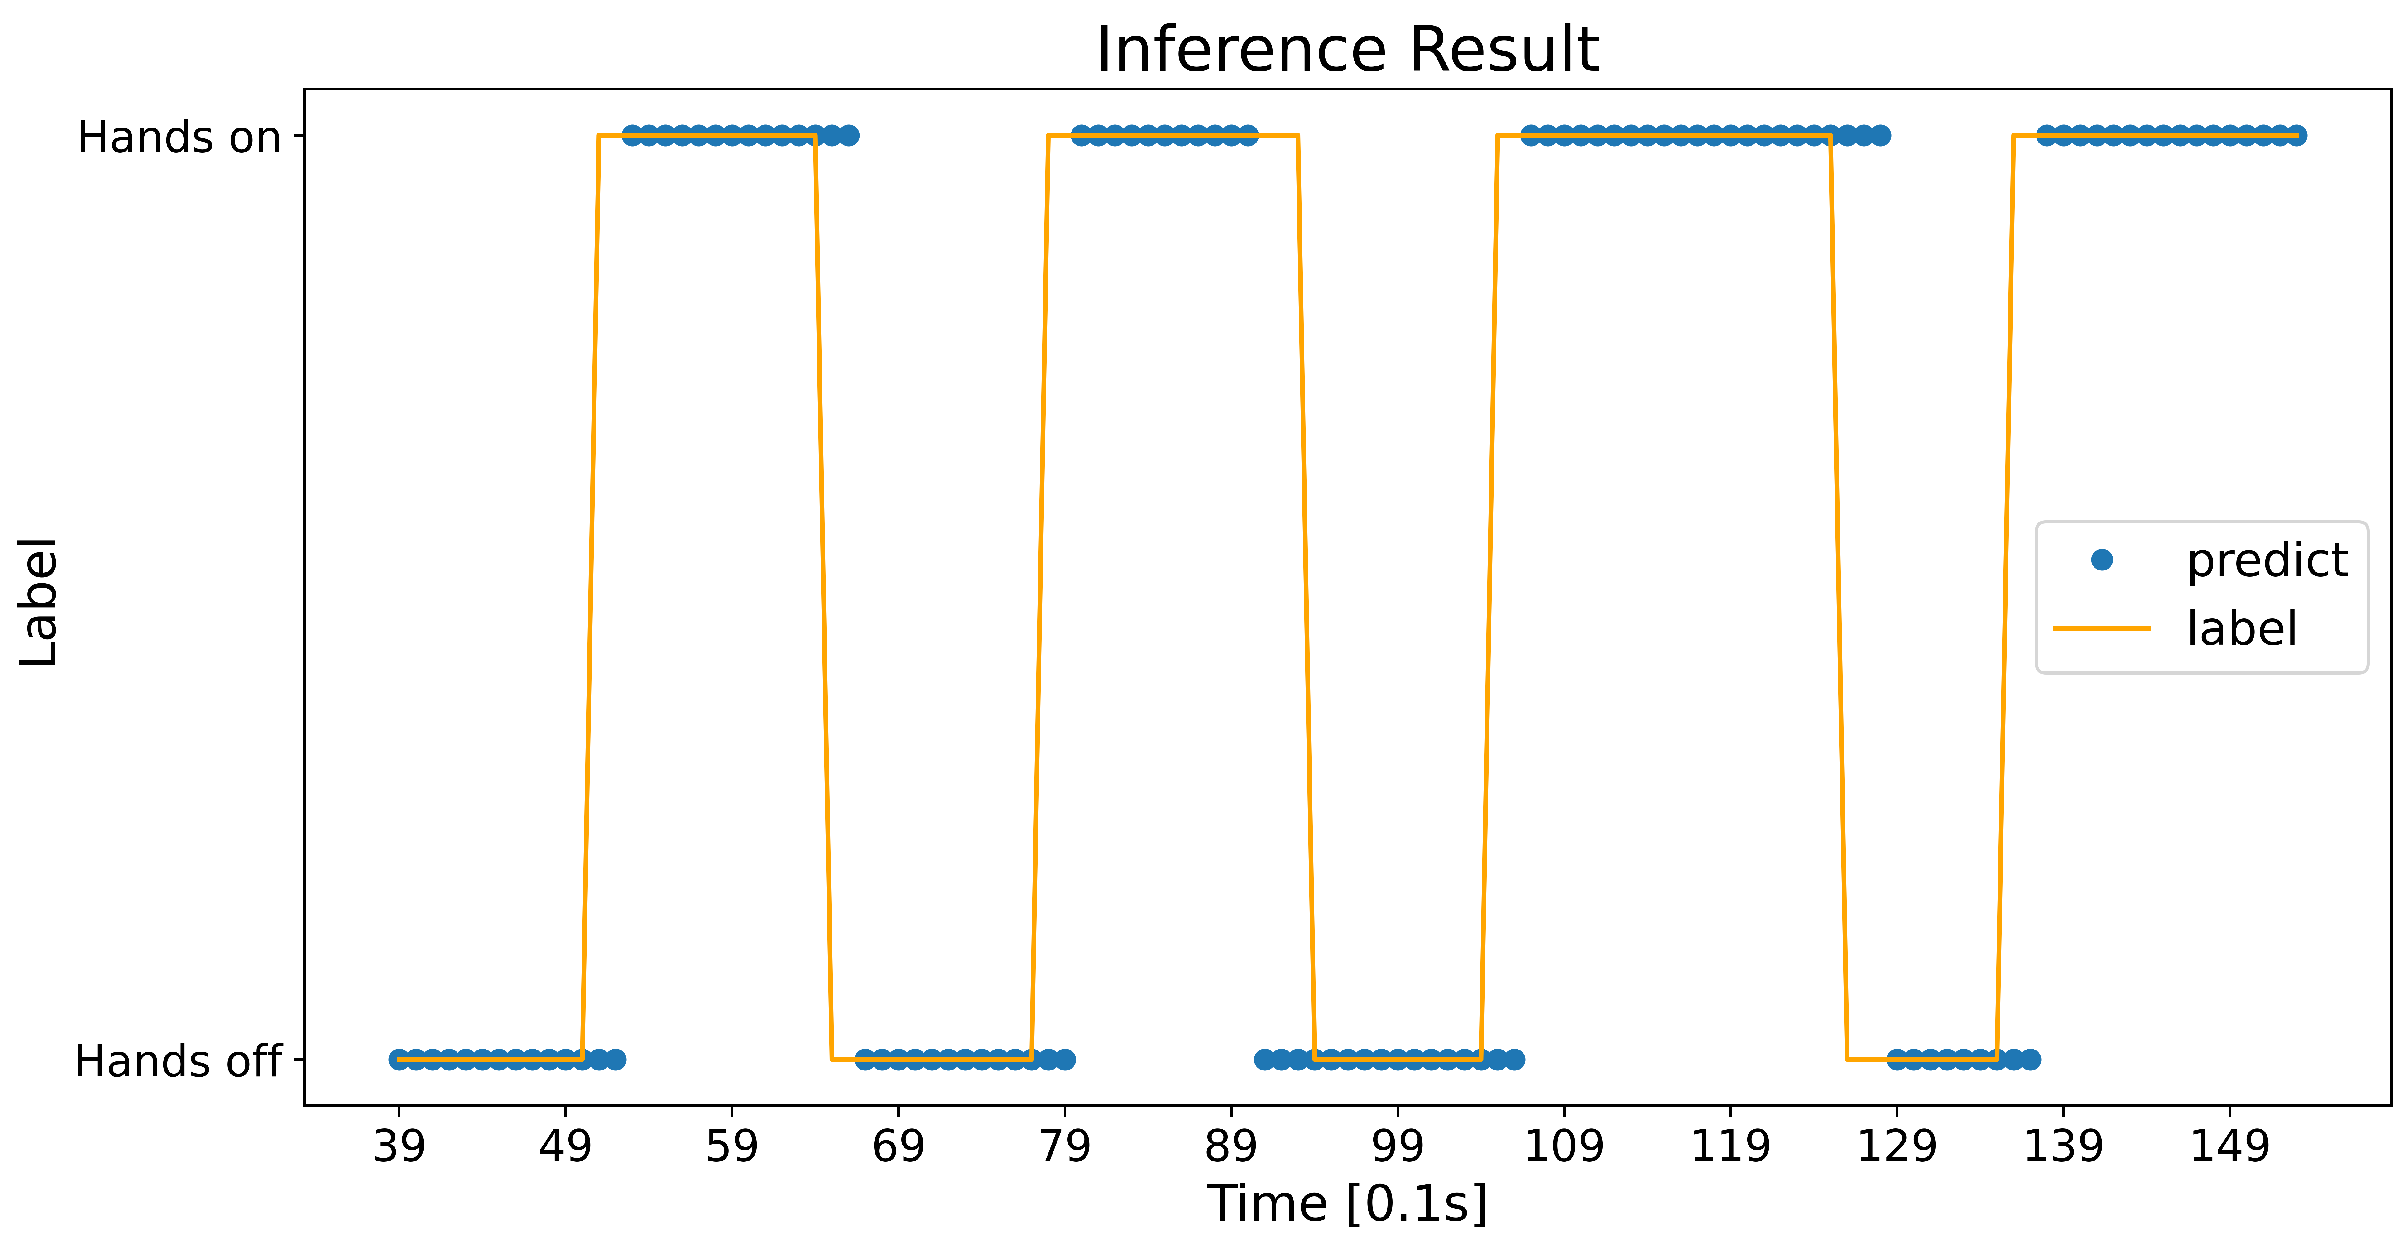
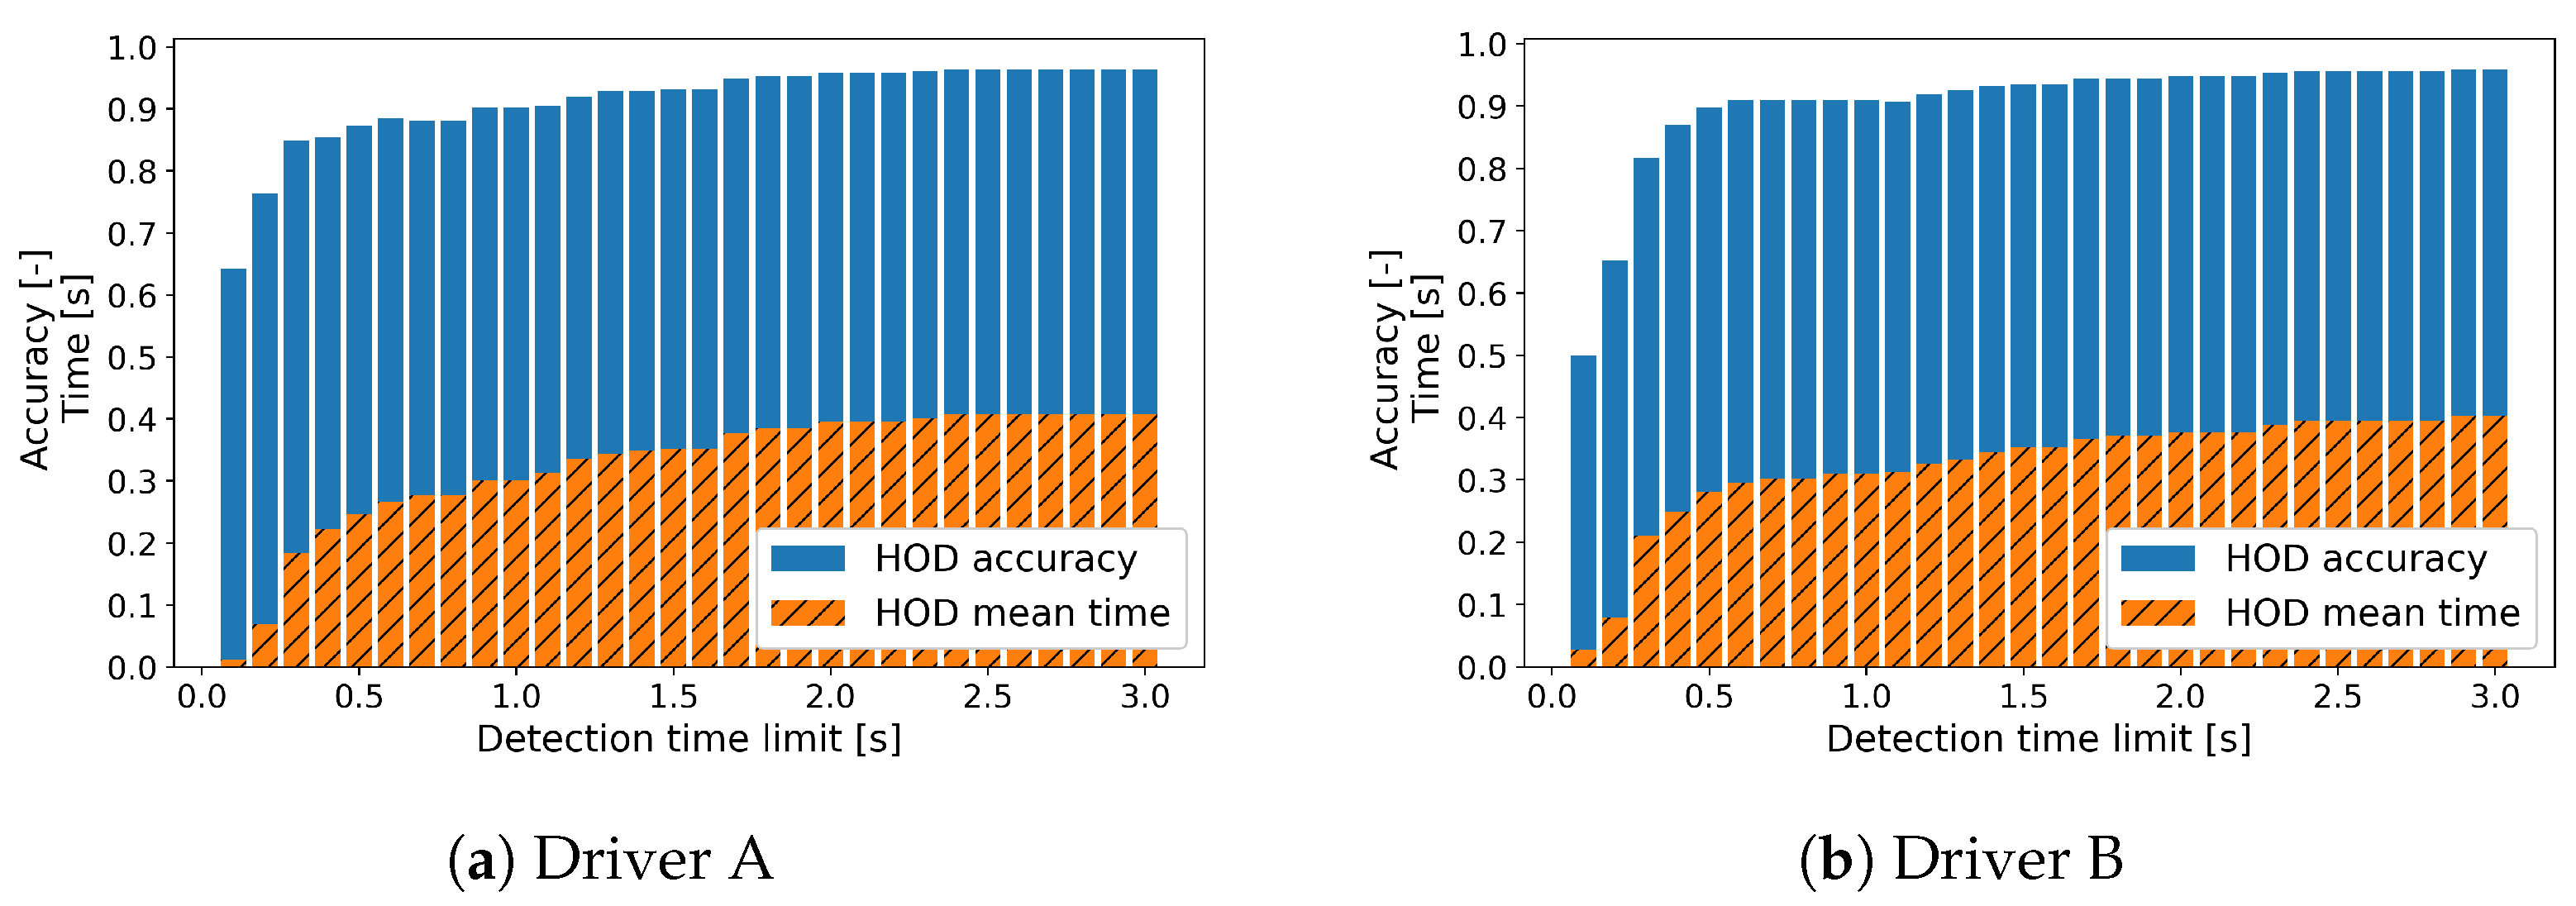
4.3. Driver Generalization Results
5. Discussion
6. Conclusions and Future Work
Author Contributions
Funding
Institutional Review Board Statement
Informed Consent Statement
Data Availability Statement
Conflicts of Interest
References
- Cao, Y.; Griffon, T.; Fahrenkrog, F.; Schneider, M.; Naujoks, F.; Tango, F.; Wolter, S.; Knapp, A.; Page, Y.; Mallada, J.; et al. L3Pilot-Code of Practice for the Development of Automated Driving Functions; 2022. Available online: https://bast.opus.hbz-nrw.de/opus45-bast/frontdoor/deliver/index/docId/2630/file/L3Pilot_CoP-ADF_v1.0.pdf (accessed on 27 October 2022).
- MotorTrend Mercedes-Benz Drive Pilot Autonomous First “Drive”: We Try a World’s First Driverless System. Available online: https://www.motortrend.com/news/mercedes-benz-drive-pilot-eqs-autonomous-driverless-first-drive-review/ (accessed on 27 October 2022).
- Mousel, T.; Treis, A. Hands Off Detection Requirements for UN R79 Regulated Lane Keeping Assist Systems. In Proceedings of the 25th International Technical Conference on the Enhanced Safety of Vehicles (ESV) National Highway Traffic Safety Administration, Detroit, MI, USA, 6 June 2017. [Google Scholar]
- Sakai, M.; Fuchs, R. Hands On/Off Detection Based on EPS Sensors. Available online: https://www.jtekt.co.jp/e/engineering-journal/assets/1017/1017e_06.pdf (accessed on 27 October 2022).
- Schinkel, W.; Sande, T.; Nijmeijer, H. Driver intervention detection via real-time transfer function estimation. IEEE Trans. Intell. Transp. Syst. 2019, 22, 772–781. [Google Scholar] [CrossRef]
- Wang, X.; Guo, L.; Jia, Y. Online sensing of human steering intervention torque for autonomous driving actuation systems. IEEE Sens. J. 2018, 18, 3444–3453. [Google Scholar] [CrossRef]
- Moreillon, M. HIGHLY AUTOMATED DRIVING—Detection of the driver’s hand on and off the steering wheel for ADAS and autonomous driving. In 7th International Munich Chassis Symposium 2016; Springer: Berlin/Heidelberg, Germany, 2017; pp. 505–525. [Google Scholar]
- Xing, Y.; Lv, C.; Liu, Y.; Zhao, Y.; Cao, D.; Kawahara, S. Hybrid-learning-based driver steering intention prediction using neuromuscular dynamics. IEEE Trans. Ind. Electron. 2021, 69, 1750–1761. [Google Scholar] [CrossRef]
- Li, R.; Chen, Y.; Zhang, L. A method for fatigue detection based on Driver’s steering wheel grip. Int. J. Ind. Ergon. 2021, 82, 103083. [Google Scholar] [CrossRef]
- Mühlbacher-Karrer, S.; Faller, L.; Hamid, R.; Zangl, H. A wireless steering wheel gripping sensor for hands on/off detection. In Proceedings of the 2016 IEEE Sensors Applications Symposium (SAS), Catania, Italy, 20–22 April 2016; Springer: Berlin/Heidelberg, Germany, 2016; pp. 1–5. [Google Scholar]
- Chen, H.; Yang, Z.; Huang, C.; Zhang, Q. Drive Safe Inspector: A Wearable-Based Fine-Grained Technique for Driver Hand Position Detection. In Proceedings of the 2018 IEEE Global Communications Conference (GLOBECOM), Abu Dhabi, United Arab Emirates, 9–13 December 218; pp. 1–7.
- Johansson, E.; Linder, R. System for Hands-on Steering Wheel Detection Using Machine Learning. 2021. Available online: https://odr.chalmers.se/items/3d8ba74d-c0b1-4a6d-be14-f89d87981179/full (accessed on 27 October 2022).
- Hoang Ngan Le, T.; Zheng, Y.; Zhu, C.; Luu, K.; Savvides, M. Multiple scale faster-rcnn approach to driver’s cell-phone usage and hands on steering wheel detection. In Proceedings of the IEEE Conference on Computer Vision and Pattern Recognition Workshops, Las Vegas, NV, USA, 26 June–1 July 2016; pp. 46–53. [Google Scholar]
- Rangesh, A.; Trivedi, M. Handynet: A one-stop solution to detect, segment, localize & analyze driver hands. In Proceedings of the IEEE Conference on Computer Vision and Pattern Recognition Workshops, Salt Lake City, UT, USA, 18–22 June 2018; pp. 1103–1110. [Google Scholar]
- Ren, S.; He, K.; Girshick, R.; Sun, J. Faster r-cnn: Towards real-time object detection with region proposal networks. Adv. Neural Inf. Process. Syst. 2015, 28. [Google Scholar] [CrossRef]
- Yudkin, P.; Friedman, E.; Zvitia, O.; Elbaz, G. Hands-Up: Leveraging Synthetic Data for Hands-On-Wheel Detection. arXiv 2022, arXiv:2206.00148. [Google Scholar]
- Omerustaoglu, F.; Sakar, C.; Kar, G. Distracted driver detection by combining in-vehicle and image data using deep learning. Appl. Soft Comput. 2020, 96, 106657. [Google Scholar] [CrossRef]
- Eraqi, H.; Abouelnaga, Y.; Saad, M.; Moustafa, M. Driver distraction identification with an ensemble of convolutional neural networks. J. Adv. Transp. 2019, 2019, 4125865. [Google Scholar] [CrossRef]
- Jegham, I.; Khalifa, A.; Alouani, I.; Mahjoub, M. Safe driving: Driver action recognition using surf keypoints. In Proceedings of the 2018 30th International Conference on Microelectronics (ICM), Sousse, Tunisia, 16–19 December 2018; pp. 60–63. [Google Scholar]
- Borghi, G.; Frigieri, E.; Vezzani, R.; Cucchiara, R. Hands on the wheel: A dataset for driver hand detection and tracking. In Proceedings of the 2018 13th IEEE International Conference on Automatic Face & Gesture Recognition (FG 2018), Xi’an, China, 15–19 May 2018; pp. 564–570. [Google Scholar]
- Vector Informatik GmbH Vector. Available online: https://www.vector.com/kr/ko/company/about-vector/#c55657 (accessed on 17 December 2022).
- pywin32 PyPI. Available online: https://pypi.org/project/pywin32/ (accessed on 17 December 2022).
- Hochreiter, S.; Schmidhuber, J. Long short-term memory. Neural Comput. 1997, 9, 1735–1780. [Google Scholar] [CrossRef]
- Kingma, D.; Ba, J. Adam: A method for stochastic optimization. arXiv 2014, arXiv:1412.6980. [Google Scholar]
- Abadi, M.; Barham, P.; Chen, J.; Chen, Z.; Davis, A.; Dean, J.; Devin, M.; Ghemawat, S.; Irving, G.; Isard, M.; et al. TensorFlow: A system for Large-Scale machine learning. In Proceedings of the 12th USENIX Symposium on Operating Systems Design and Implementation (OSDI 16), Savannah, GA, USA, 2–4 November 2016; pp. 265–283. [Google Scholar]


| Road Type | Label | Data Size (Proportion) |
|---|---|---|
| Asphalt | Hands on | 1 h 20 m (55.91%) |
| Hands off | 1h 3m (44.09%) | |
| Unpaved/Blocked | Hands on | 1 h 48 m (58.96%) |
| Hands off | 1 h 15 m (41.04%) |
| Input Data | Minimum Value | Maximum Value | Unit |
|---|---|---|---|
| Steering wheel angle | −466.0 | 486.4 | deg |
| Steering wheel column torque | −4.6 | 6.0 | Nm |
| Steering motor speed | −1413.8 | 1459.4 | rpm |
| Steering motor current command | −53.1 | 46.3 | A |
| Output Data | Minimum Value | Maximum Value | Unit |
|---|---|---|---|
| Hands on probability | 0 | 1 | - |
| Layer | Neuron | Activation Function |
|---|---|---|
| LSTM | 64 | Tanh |
| FC | 32 | Relu |
| FC | 8 | Relu |
| FC | 1 | Sigmoid |
| Time Window Size | End Epoch of Training | Accuracy | Precision | Recall | F1 Score | AUC |
|---|---|---|---|---|---|---|
| 10 | 97 | 0.8657 | 0.9027 | 0.8702 | 0.8862 | 0.9355 |
| 20 | 70 | 0.8631 | 0.8862 | 0.8826 | 0.8844 | 0.9319 |
| 30 | 65 | 0.8564 | 0.9008 | 0.8487 | 0.874 | 0.9293 |
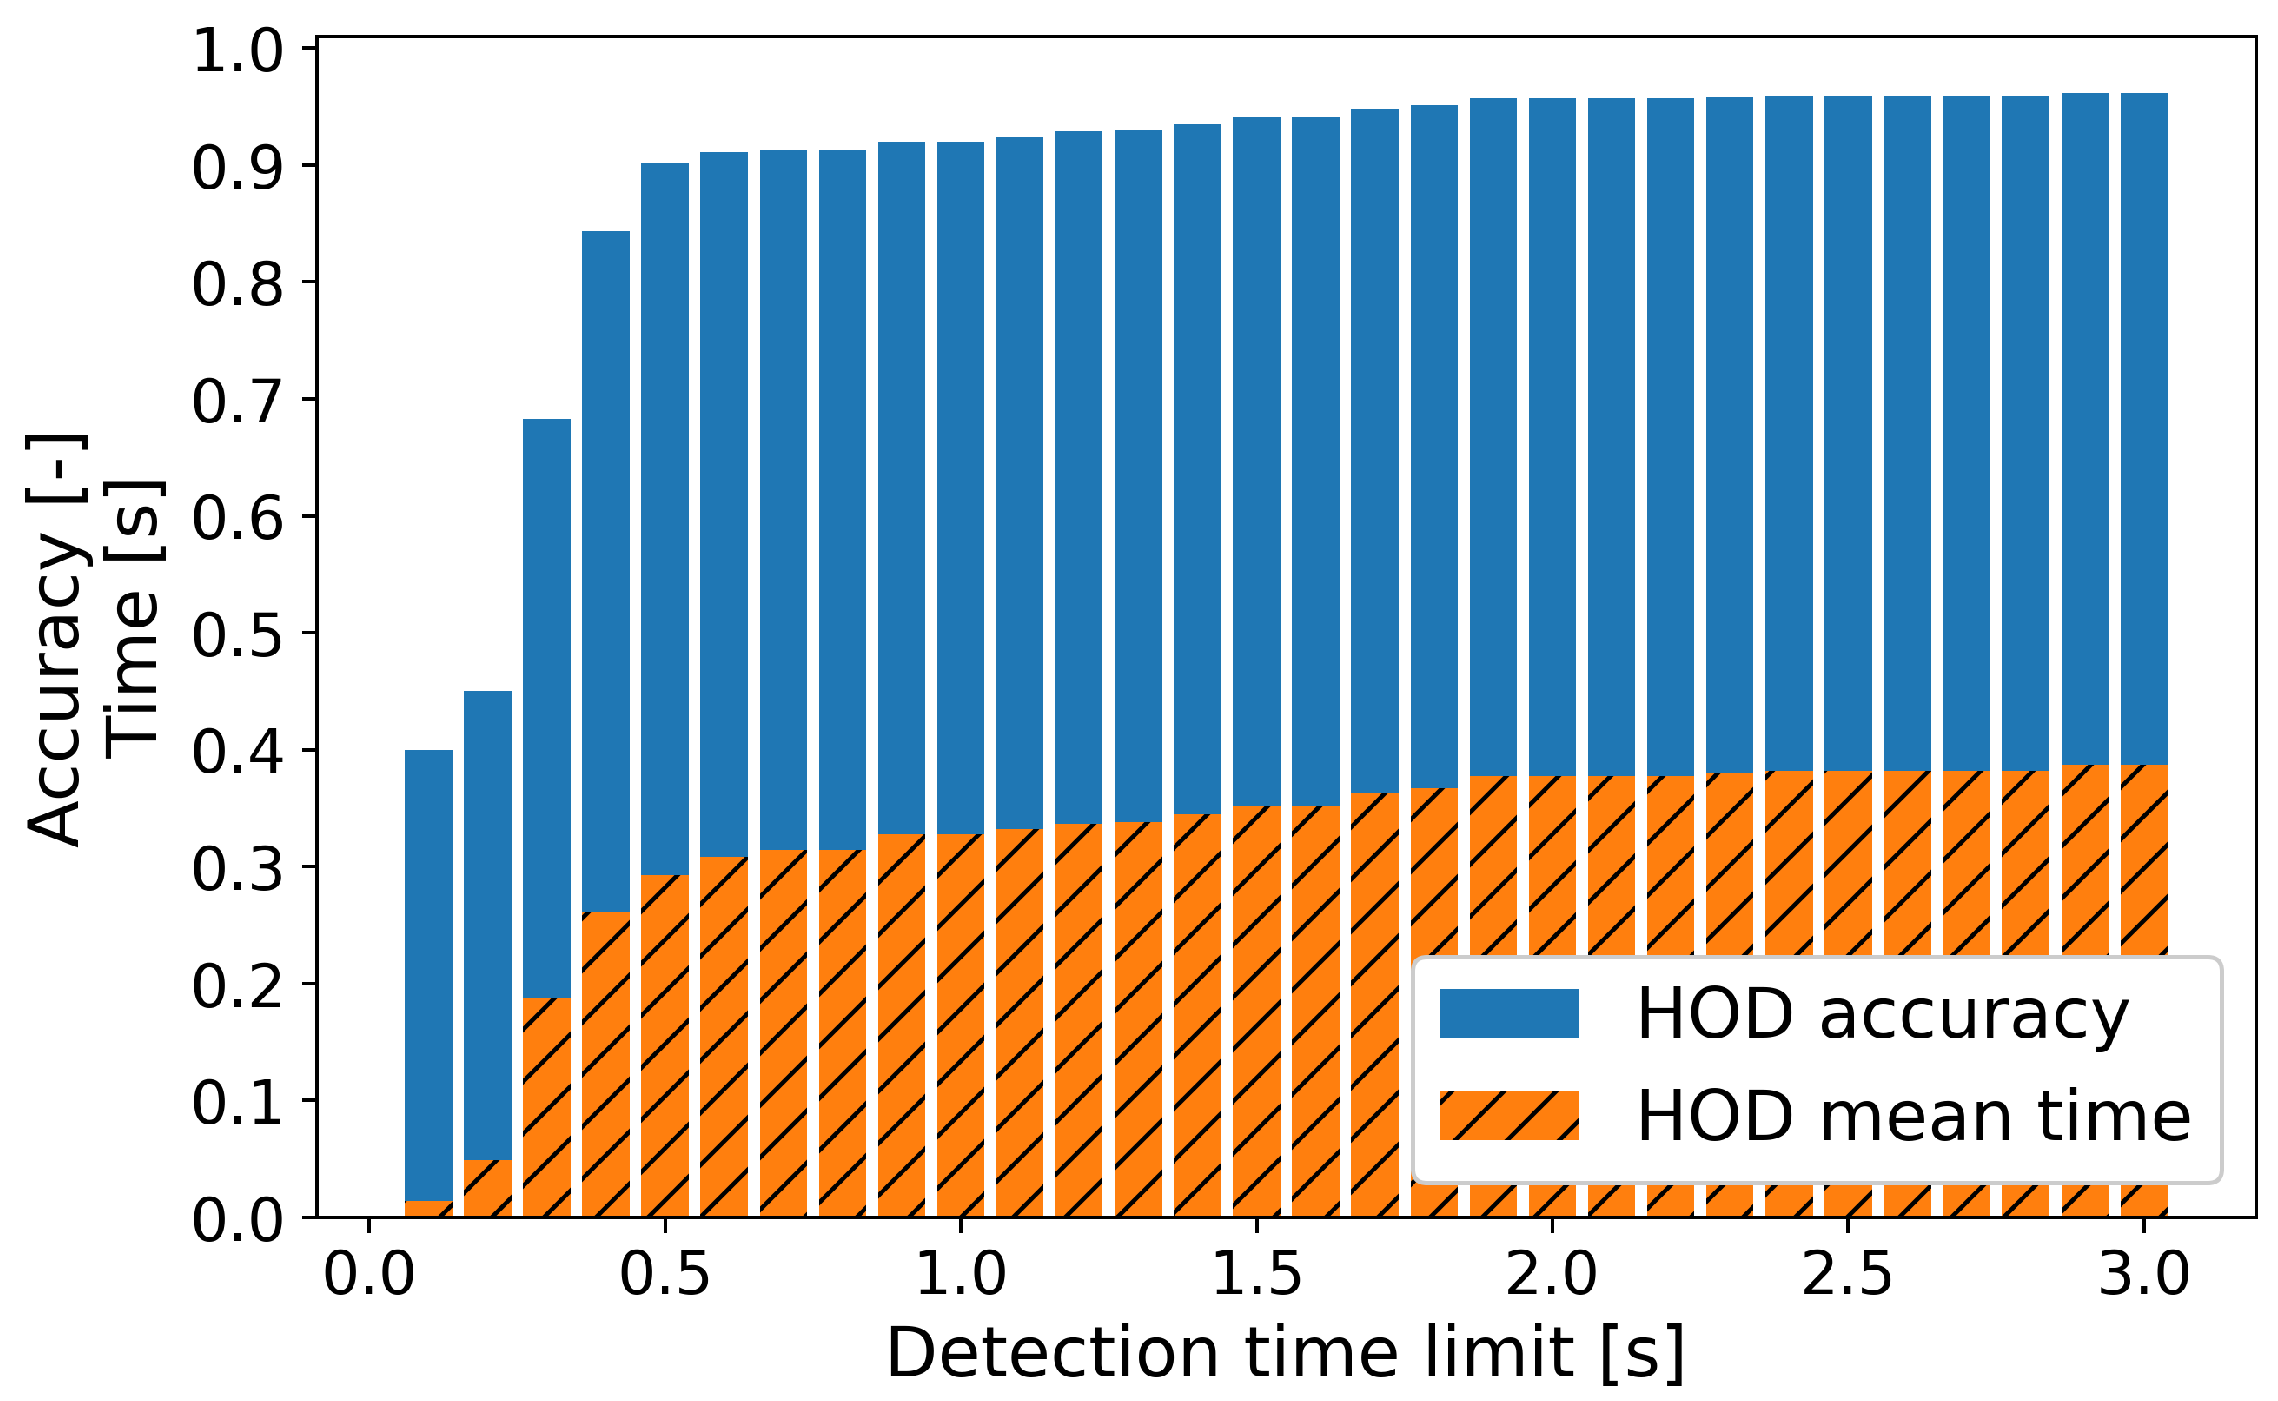
| Detection Time | HOD Accuracy | HOD Time | |
|---|---|---|---|
| Limit (n) | Mean | Standard Deviation | |
| 1 | 0.9234 | 0.3323 | 0.1985 |
| 2 | 0.9574 | 0.3774 | 0.3058 |
| 3 | 0.9617 | 0.3873 | 0.3395 |
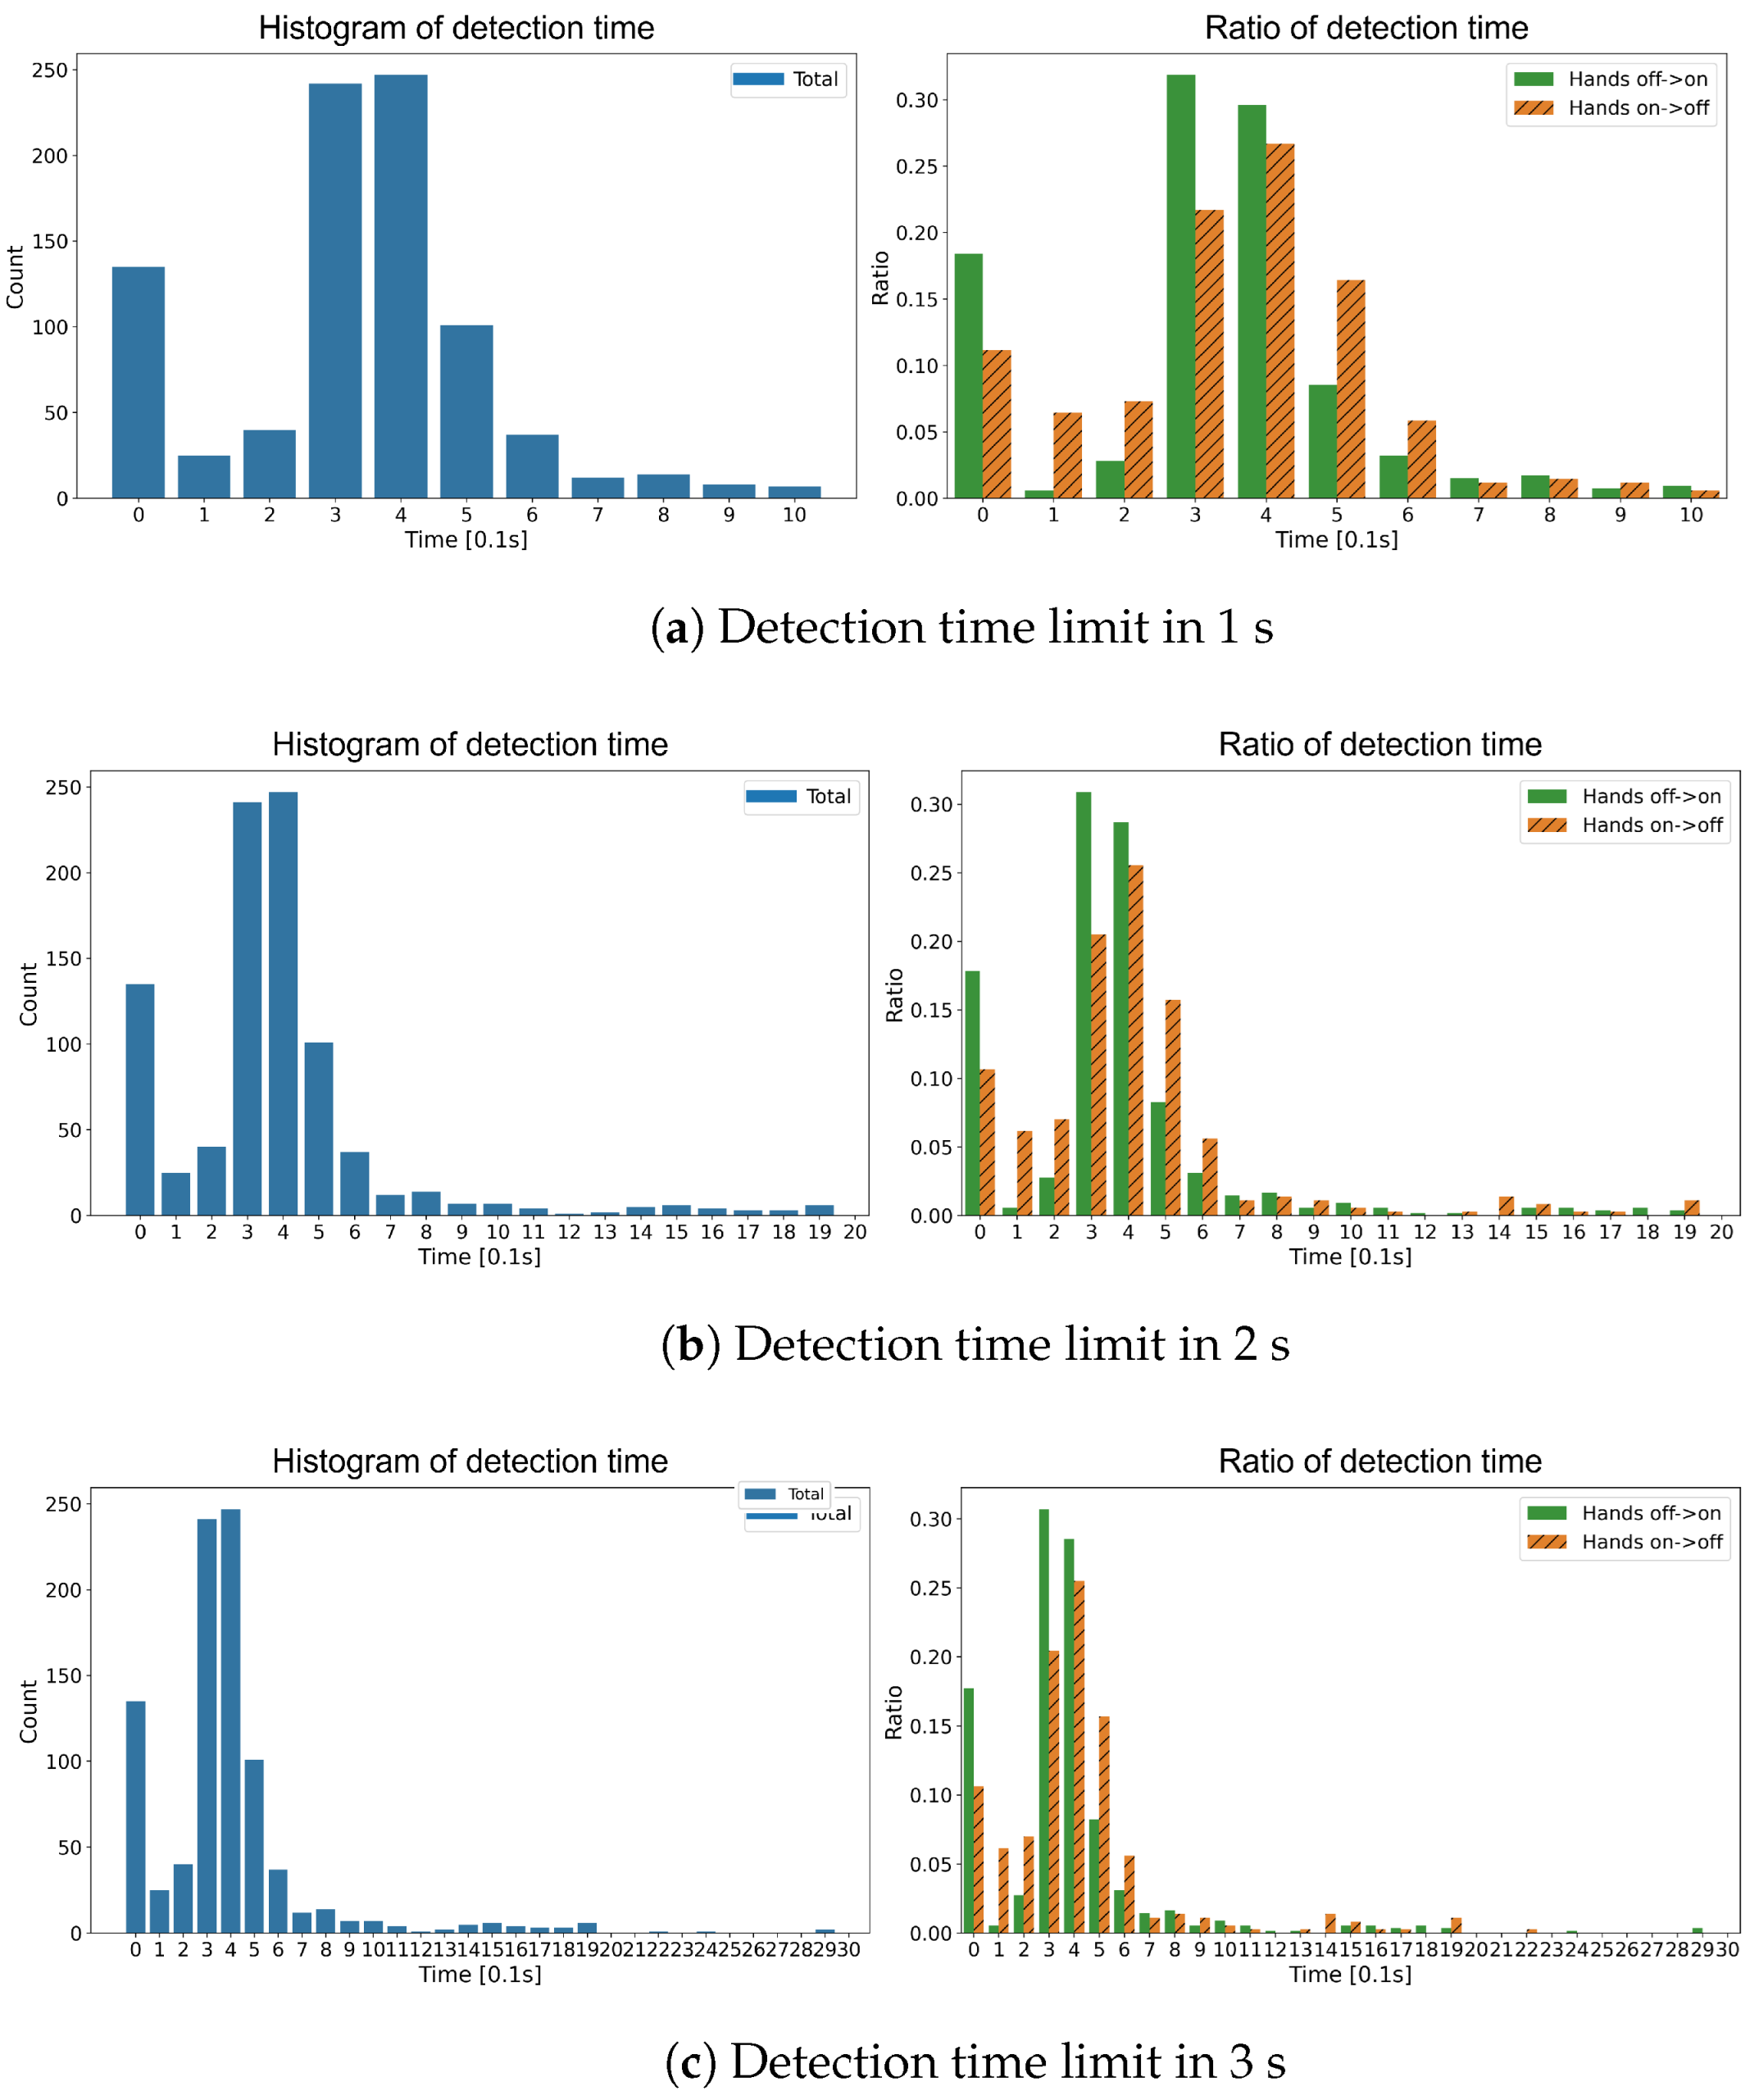
| State Transition | Detection Time | HOD Accuracy | HOD Time | |
|---|---|---|---|---|
| Limit (n) | Mean | Standard Deviation | ||
| Hands Off → On | 1 | 0.9197 | 0.323 | 0.1998 |
| 2 | 0.9494 | 0.3621 | 0.2963 | |
| 3 | 0.9546 | 0.3751 | 0.3439 | |
| Hands Off → On | 1 | 0.9292 | 0.3466 | 0.1958 |
| 2 | 0.97 | 0.4008 | 0.3184 | |
| 3 | 0.9728 | 0.4059 | 0.3319 | |
| Type | Method | Accuracy | AUC | HOD Accuracy |
|---|---|---|---|---|
| Wearable sensor | [11] | 91.59% | - | - |
| Image data | [13] | 93% | - | - |
| [16] | - | 0.9369 / 0.9530 | - | |
| In-vehicle data | ours | 86.57% | 0.9355 | 95.74% |
| Driver | Time Window Size | Accuracy | Precision | Recall | F1 Score | AUC |
|---|---|---|---|---|---|---|
| A | 10 | 0.8851 | 0.8983 | 0.9193 | 0.9087 | 0.9358 |
| 20 | 0.8748 | 0.8931 | 0.9036 | 0.8984 | 0.9324 | |
| 30 | 0.8857 | 0.9048 | 0.9123 | 0.9085 | 0.9402 | |
| B | 10 | 0.9009 | 0.9018 | 0.9271 | 0.9143 | 0.9488 |
| 20 | 0.8979 | 0.9131 | 0.9051 | 0.9091 | 0.9507 | |
| 30 | 0.8857 | 0.9048 | 0.9123 | 0.9085 | 0.9402 |
| Driver | Detection Time | HOD Accuracy | HOD Time | |
|---|---|---|---|---|
| Limit (n) | Mean | Standard Deviation | ||
| A | 1 | 0.9053 | 0.3131 | 0.2194 |
| 2 | 0.9586 | 0.3954 | 0.3692 | |
| 3 | 0.9645 | 0.4074 | 0.3985 | |
| B | 1 | 0.9068 | 0.312 | 0.1787 |
| 2 | 0.9472 | 0.3757 | 0.3111 | |
| 3 | 0.9596 | 0.4023 | 0.3876 | |
| Driver | State Transition | Detection Time | HOD Accuracy | HOD Time | |
|---|---|---|---|---|---|
| Limit (n) | Mean | Standard Deviation | |||
| A | Hands Off → On | 1 | 0.8913 | 0.2268 | 0.1798 |
| 2 | 0.9674 | 0.3242 | 0.3852 | ||
| 3 | 0.9728 | 0.3358 | 0.4141 | ||
| Hands Off → On | 1 | 0.9221 | 0.4127 | 0.2188 | |
| 2 | 0.9481 | 0.4822 | 0.3285 | ||
| 3 | 0.9545 | 0.4946 | 0.3599 | ||
| B | Hands Off → On | 1 | 0.9153 | 0.2704 | 0.1579 |
| 2 | 0.9322 | 0.2994 | 0.2453 | ||
| 3 | 0.9379 | 0.3108 | 0.2854 | ||
| Hands Off → On | 1 | 0.8966 | 0.3638 | 0.1893 | |
| 2 | 0.9655 | 0.4657 | 0.3535 | ||
| 3 | 0.9862 | 0.5084 | 0.4573 | ||
Disclaimer/Publisher’s Note: The statements, opinions and data contained in all publications are solely those of the individual author(s) and contributor(s) and not of MDPI and/or the editor(s). MDPI and/or the editor(s) disclaim responsibility for any injury to people or property resulting from any ideas, methods, instructions or products referred to in the content. |
© 2023 by the authors. Licensee MDPI, Basel, Switzerland. This article is an open access article distributed under the terms and conditions of the Creative Commons Attribution (CC BY) license (https://creativecommons.org/licenses/by/4.0/).
Share and Cite
Pyeon, H.; Kim, H.; Kim, R.C.; Oh, G.; Lim, S. Deep Learning-Based Driver’s Hands on/off Prediction System Using In-Vehicle Data. Sensors 2023, 23, 1442. https://doi.org/10.3390/s23031442
Pyeon H, Kim H, Kim RC, Oh G, Lim S. Deep Learning-Based Driver’s Hands on/off Prediction System Using In-Vehicle Data. Sensors. 2023; 23(3):1442. https://doi.org/10.3390/s23031442
Chicago/Turabian StylePyeon, Hyeongoo, Hanwul Kim, Rak Chul Kim, Geesung Oh, and Sejoon Lim. 2023. "Deep Learning-Based Driver’s Hands on/off Prediction System Using In-Vehicle Data" Sensors 23, no. 3: 1442. https://doi.org/10.3390/s23031442
APA StylePyeon, H., Kim, H., Kim, R. C., Oh, G., & Lim, S. (2023). Deep Learning-Based Driver’s Hands on/off Prediction System Using In-Vehicle Data. Sensors, 23(3), 1442. https://doi.org/10.3390/s23031442