Article

Mechanochemical Synthesis of TiO2-CeO2 Mixed Oxides Utilized as a Screen-Printed Sensing Material for Oxygen Sensor

by
Jelena N. Stevanović
1,
Srđan P. Petrović
1,
Nenad B. Tadić
2,
Katarina Cvetanović
1,
Ana G. Silva
3,
Dana Vasiljević Radović
1 and
Milija Sarajlić
1,*
1
Institute of Chemistry, Technology and Metallurgy, University of Belgrade, Njegoševa 12, 11000 Belgrade, Serbia
2
Faculty of Physics, University of Belgrade, Studentski trg 16, 11000 Belgrade, Serbia
3
CeFiTec, Nova School of Science and Technology, New University of Lisbon, Campus da Caparica, 2829-516 Caparica, Portugal
*
Author to whom correspondence should be addressed.
Sensors 2023, 23(3), 1313; https://doi.org/10.3390/s23031313
Submission received: 27 December 2022 / Revised: 14 January 2023 / Accepted: 21 January 2023 / Published: 24 January 2023
(This article belongs to the Special Issue The State-of-the-Art in Semiconductor Materials Based Sensors)

Abstract

:
TiO2 and CeO2 are well known as oxygen sensing materials. Despite high sensitivity, the actual utilization of these materials in gas detection remains limited. Research conducted over the last two decades has revealed synergistic effects of TiO2-CeO2 mixed oxides that have the potential to improve some aspects of oxygen monitoring. However, there are no studies on the sensing properties of the TiO2-CeO2 obtained by mechanochemical treatment. We have tested the applicability of the mechanochemically treated TiO2-CeO2 for oxygen detection and presented the results in this study. The sensing layers are prepared as a porous structure by screen printing a thick film on a commercial substrate. The obtained structures were exposed to various O2 concentrations. The results of electrical measurements showed that TiO2-CeO2 films have a significantly lower resistance than pure oxide films. Mixtures of composition TiO2:CeO2 = 0.8:0.2, ground for 100 min, have the lowest electrical resistance among the tested materials. Mixtures of composition TiO2:CeO2 = 0.5:0.5 and ground for 100 min proved to be the most sensitive. The operating temperature can be as low as 320 °C, which places this sensor in the class of semiconductor sensors working at relatively lower temperatures.

1. Introduction

The increase in greenhouse gases emission began with the industrial revolution and continues to the present day [1]. As fossil fuel combustion represents the main contribution to CO2 emission, combustion control in transportation and industry has become a top priority in modern environmental protection [1,2]. Novel environmental regulations have encouraged the development and testing of gas-sensitive materials for on-site monitoring of combustion in power plants, heating systems, transportation, and industry [3]. The optimization of exhaust gas composition during combustion increases the efficiency of the process via feedback systems and eventually leads to the reduction of a carbon footprint and lower fuel consumption [2,4]. Controlled combustion conditions in automotive applications and industrial plants can be maintained using sensors for monitoring exhaust oxygen concentration at elevated temperatures [3].
Several types of oxygen sensors have been developed, depending on the sensing mechanism and active material, such as optical sensors [5], semiconductor metal oxide sensors [6], electrochemical sensors [6], cantilever-based sensors [7], etc. Semiconductor metal oxide gas sensors belong to the group of the most investigated gas sensors [8]. Simple design, miniature packaging, low cost, and facile fabrication [9] make them suitable for integration into sensor networks for air-quality monitoring [7].
Properties and applications of, separately, TiO2 and CeO2 are well known and extensively investigated [10,11,12]. Many studies have proven the great oxygen sensing features of TiO2 and CeO2 thin films at 600 °C, 700 °C, and 800 °C [13,14,15,16]. At lower temperatures, thermodynamic equilibrium on the solid-gas interface between the sensing layer and oxygen cannot be achieved [17]. However, operating at high temperatures may lead to a decrease in the long-term stability of the sensor [6]. Insufficient long-term stability represents one of the limiting factors in the application of sensors based on metal oxide [3]. One way to overcome temperature-related disadvantages and improve stability is by adding a metal oxide to the primary oxide or by direct synthesis of mixed metal oxides [6,18].
In the last two decades, TiO2-CeO2 mixed systems have become an increasingly common topic of research in the field of gas sensing and Materials Science [19,20,21]. Mohammadi and Fray [22] studied the sensing properties of TiO2-CeO2 thin films obtained by the aqueous sol–gel route. They showed the remarkable response of a thin film-based sensor towards low concentrations of CO gas at the operating temperature of 200 °C. The use of sol-gel prepared TiO2-CeO2 thin films in gas sensing applications was also investigated by Trinchi and his coworkers [23]. The sensor response was measured on operating temperatures below 470 °C and for oxygen concentrations between 1 ppm and 10,000 ppm. It was found that the sensors based on materials with excess CeO2 have higher sensitivity than others. In 2016, Uzunoglu et al. [24] reported an increasing oxygen storage capacity when mixing TiO2 and CeO2 using the coprecipitation method. These reports [23,24] also point out the importance of the composition of composites, i.e., the mass ratios of starting oxides, for reliable oxygen detection. However, there is no work examining the influence of dry mechanochemical treatment on the oxygen sensing properties of TiO2-CeO2 mixtures. The possibility of using mechanochemically activated TiO2-CeO2 mixtures as sensing material for improving the performance of oxygen sensor is thus unexplored.
Mechanochemical preparation of powder mixture has recently emerged as a cost-effective and fast technology method for obtaining an active catalyst with excellent structural and morphological properties [25,26,27]. As a treatment that does not require toxic metal-organic precursors nor leaves harmful waste, it has no environmental footprint [25,26,27,28,29,30,31]. High-energy ball milling is a mechanochemical process that involves the direct absorption of mechanical energy by solid reactants. Energy is being released during collision, shear, and friction between the balls and the reactants inside the jar, and it is sufficient to initiate and stimulate chemical reactions. Intense mechanical stresses and bond breakage are induced by the effect of mechanochemical forces, leading to structural changes and the increasing reactivity of atoms at the reactant interface [31,32].
We conducted systematic testing of TiO2-CeO2 mixtures obtained by high energy ball milling and deposited by screen-printing of the paste on commercial alumina substrate with a gold interdigitated capacitor. Screen-printed thick TiO2-CeO2 films were then exposed to different partial pressures of O2 in the flow of the Ar-O2 gas mixture. In order to evaluate the sensitivity of our materials at lower operating temperatures, sensor response measurements were carried out in the temperature range from 270 °C to 400 °C. At the starting operating temperature, the electrical readout proved to be very unstable. A temperature of 320 °C was the minimum operating temperature at which response stability was satisfactory, and oxygen sensitivity was high. Therefore, measurements of the electrical resistance of the sensors performed at 320 °C are presented. Particle size distribution analysis (PSD), X-ray diffraction (XRD), scanning electron microscopy (SEM), atomic force microscopy (AFM), and Raman spectroscopy were employed to study the morphological, structural, and electronic properties of the obtained materials. In order to provide an understanding of sensing performance of the mixtures, the results of these method of characterizations were discussed.

2. Materials and Methods

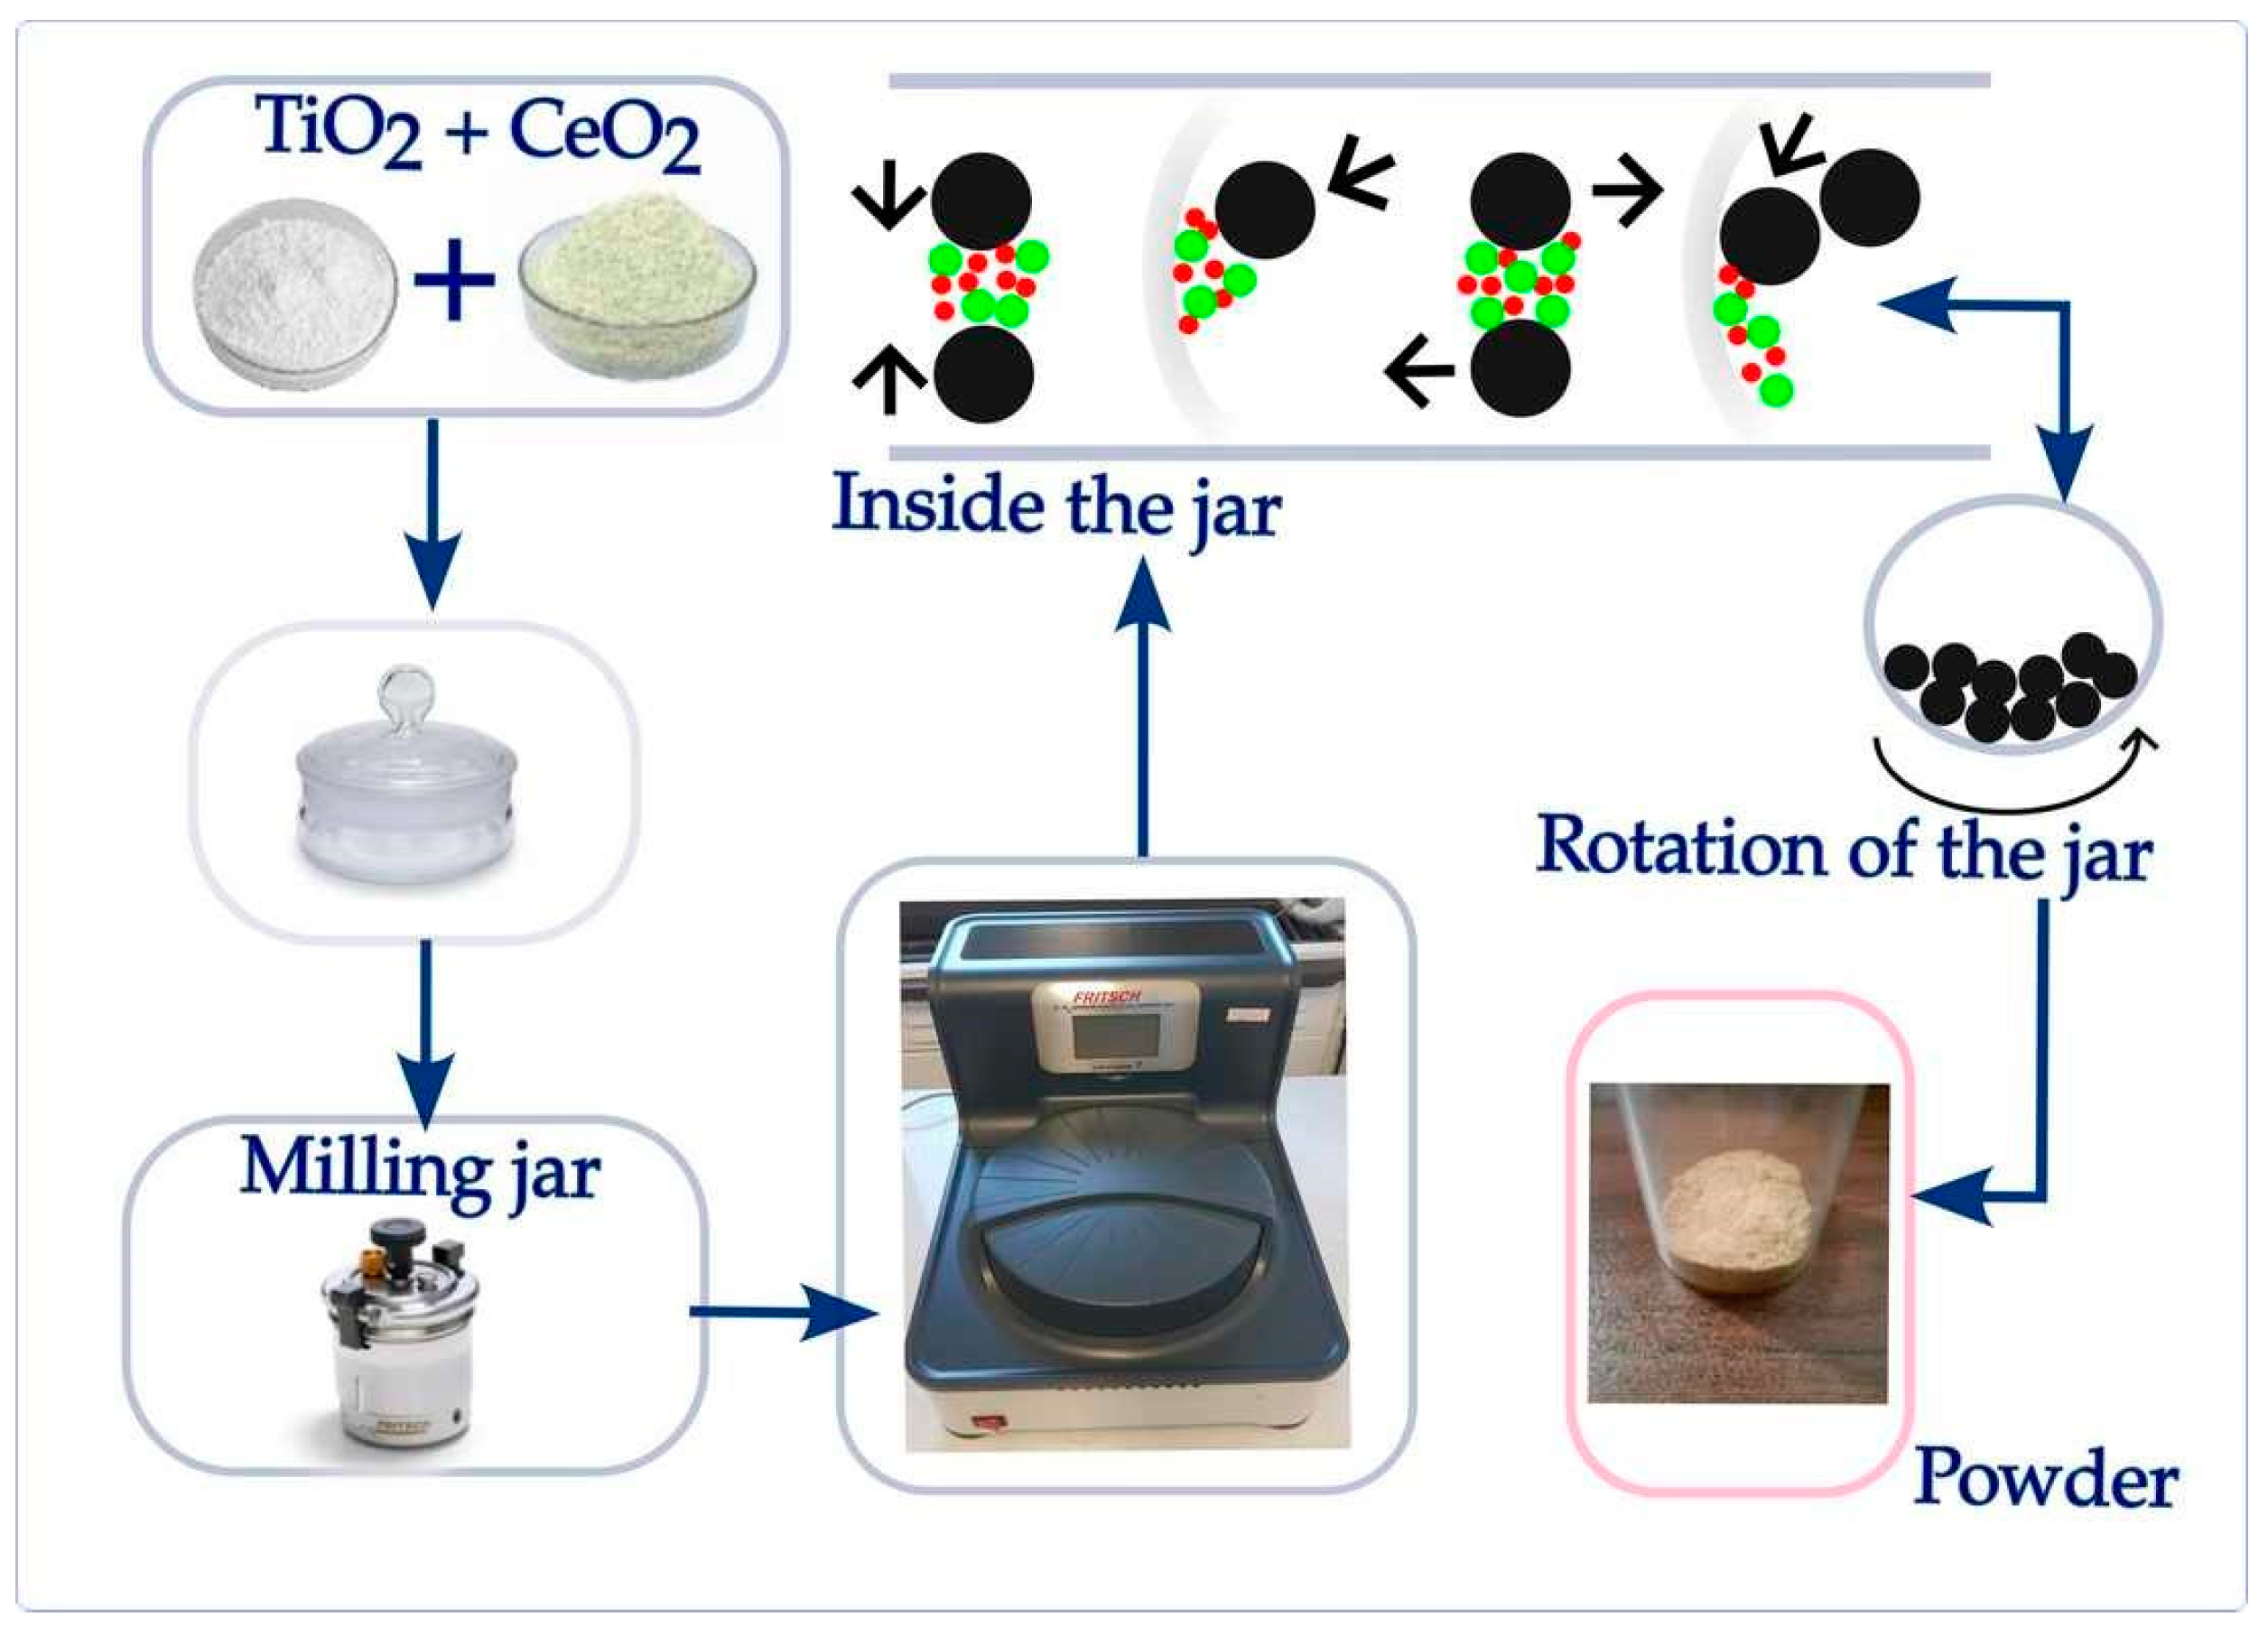
2.1. Mechanochemical Synthesis of TiO2-CeO2 Powders

Dry mechanochemical synthesis of TiO2-CeO2 mixtures was performed using a high-energy ball mill (Planetary Micro Mill Pulverisette 7 premium line, Fritsch, Germany). The synthesis procedure is illustrated in Figure 1.
Pure TiO2 (purity > 99%, purchased, Alfa Aesar, ThermoFisher GmbH, Kandel, Germany) and CeO2 (purity >99.9, purchased, Johnson Matthey Alfa Product, Karlsruhe, Germany) powders were used as a starting material. Milling was conducted at atmospheric conditions in a silicon nitride jar, 80 cm3 in volume, with 25 silicon nitride balls with a diameter of 10 mm. The ball-to-total powder mass ratio was constant at about 1:10 for all the experiments. The quantity of powder mixture used in each synthesis was 4.87 g, with the following mass ratios of TiO2 to CeO2: 0.8:0.2, 0.2:0.8, and 0.5:0.5. The mixtures were grounded for either 40 or 100 min with a 5-min break after every 20 min of the process. The rotation speed of a milling jar was kept constant at 350 rpm during all mixture preparations. A total of six different powders were obtained. The labeling of the mixed oxides according to the grinding conditions is shown in Table 1. The obtained powders were investigated with the help of particle size distribution analysis and X-ray diffraction. Thick films representing sensing materials are made from powders by a procedure that will be described below.

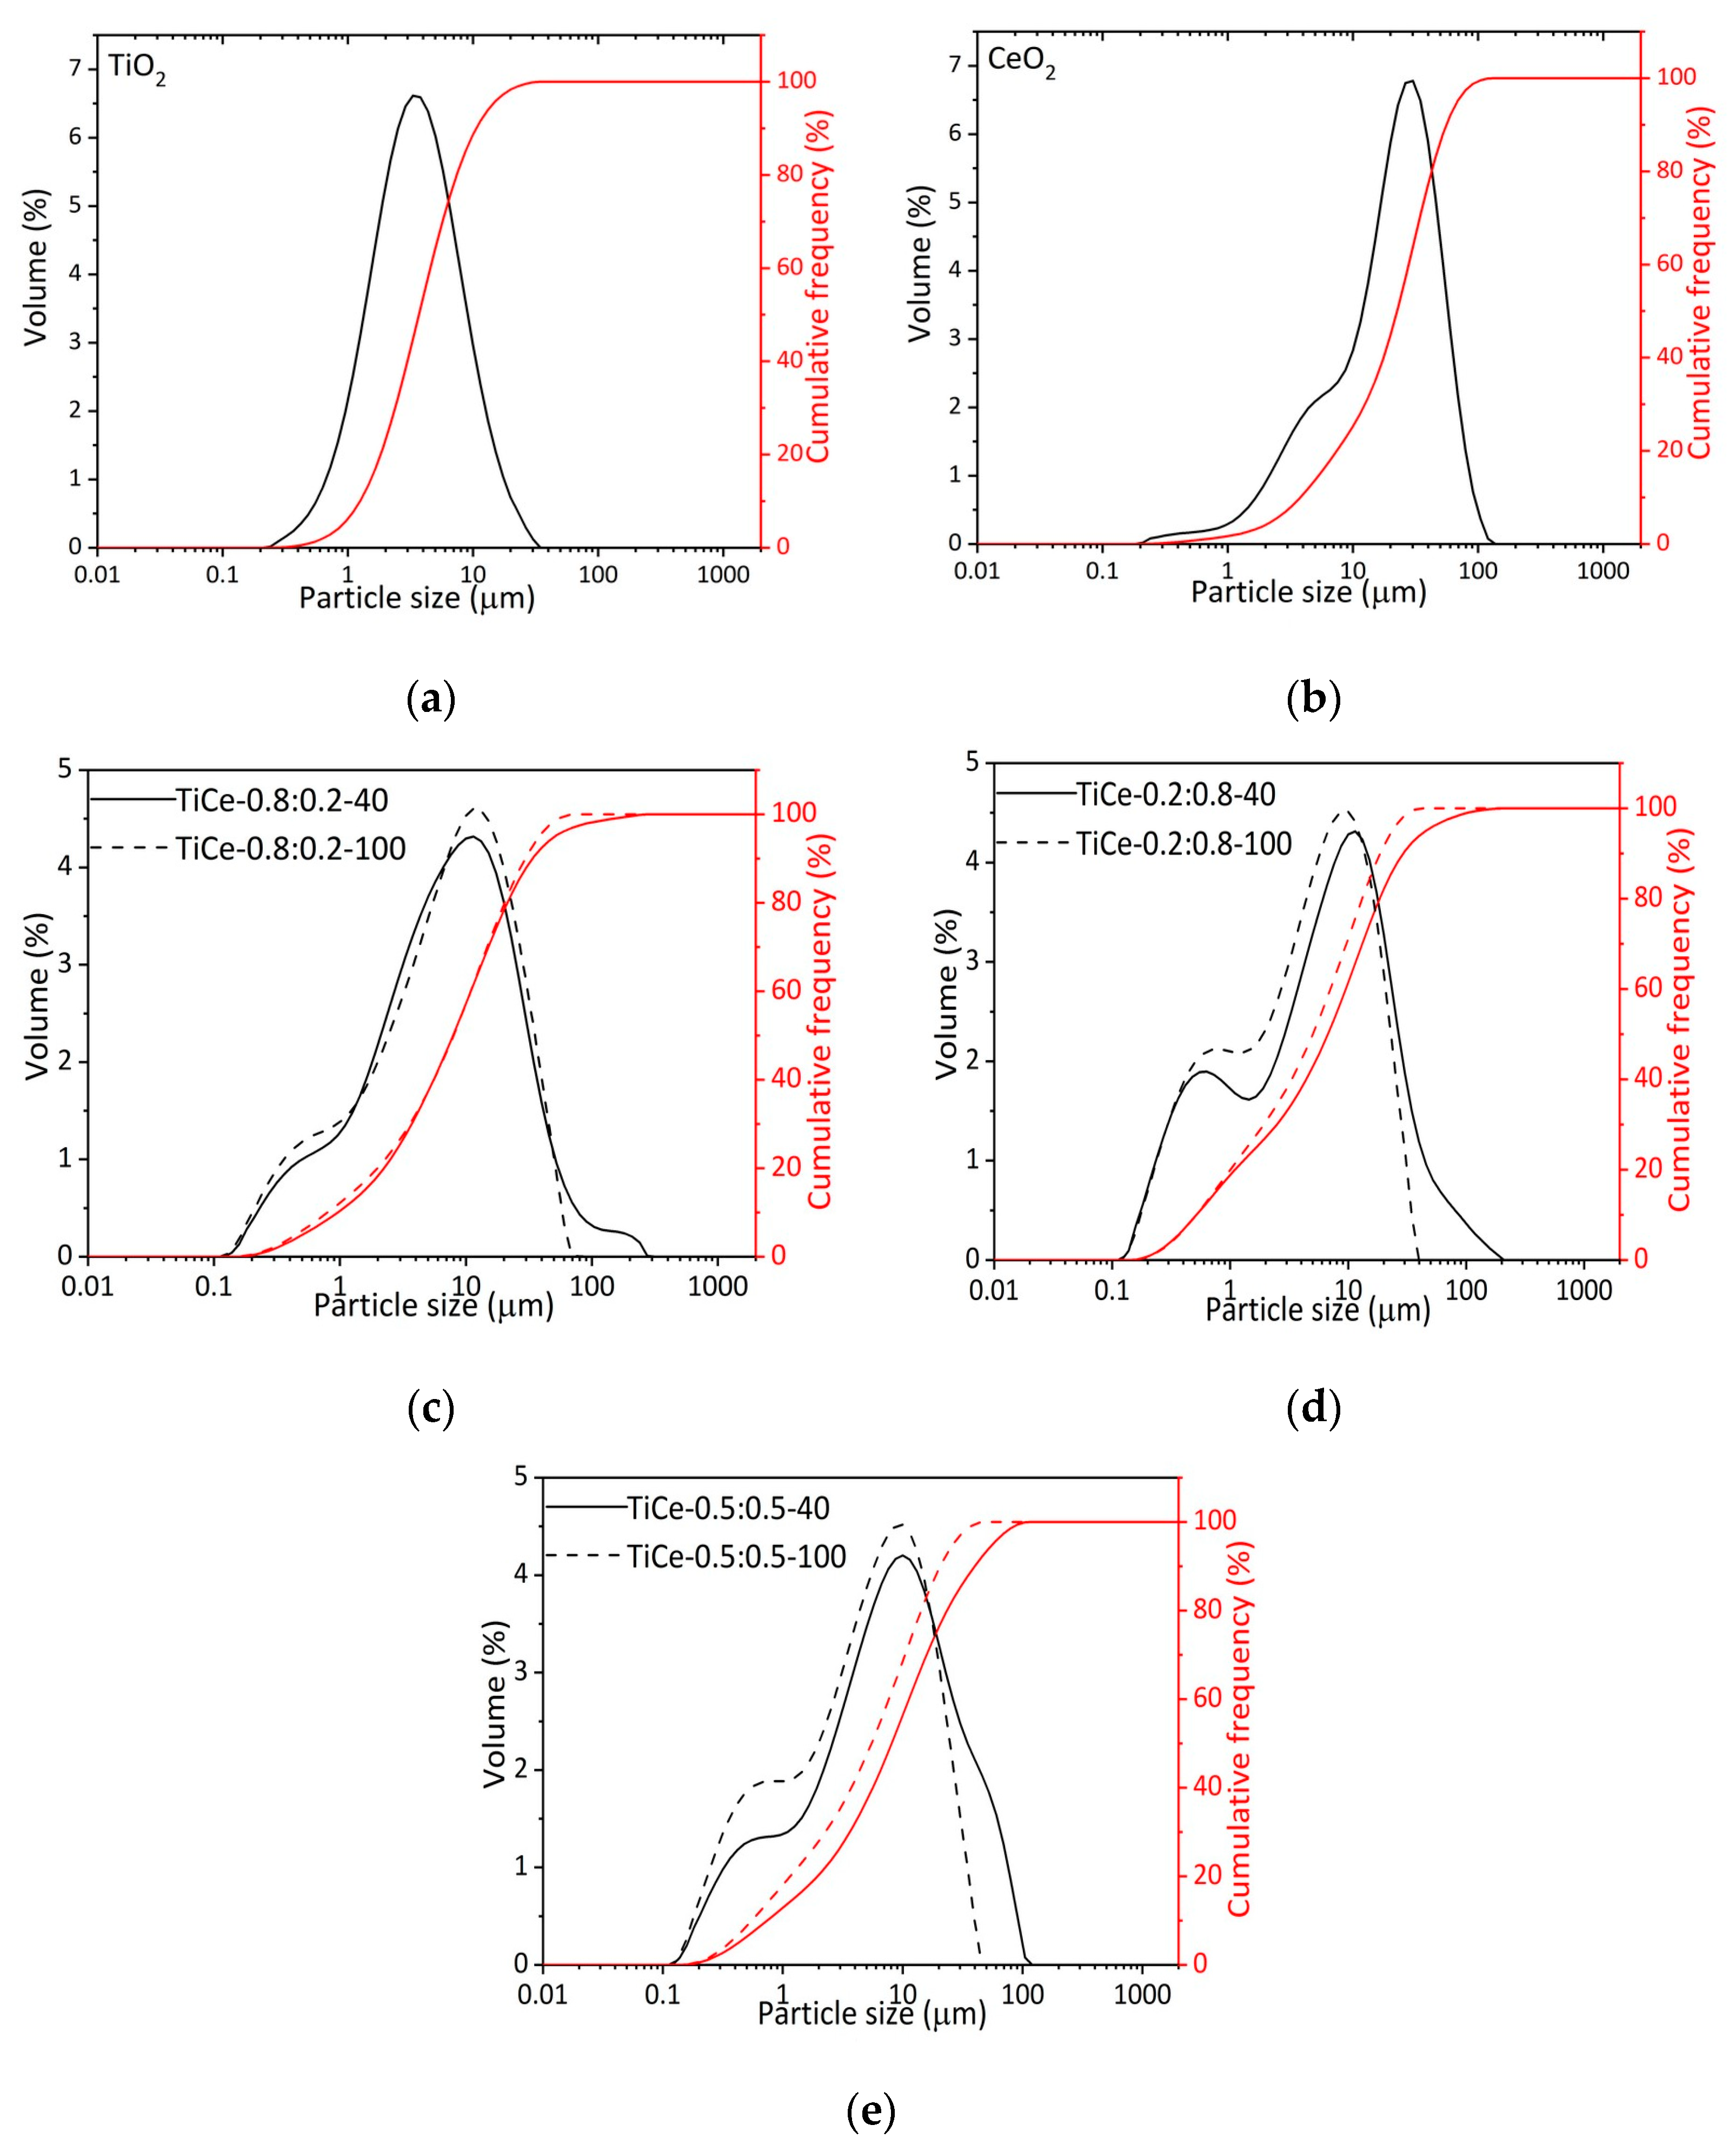
2.1.1. Particle Size Distribution Analysis

The high-energy shear forces between milling balls in most cases facilitate particle size reduction and improve the surface properties of the powders [32,33]. In order to evaluate the influence of different milling times on the average particle size of powders and their size distribution, particle size analysis (PSA) was employed. The used instrument was the Mastersizer 2000 (Malvern Panalytical, Malvern, UK) particle size analyzer based on laser diffraction, which covers the particle size range of 0.02-2000 µm. For the sake of the PSA measurements, the powders were dispersed in ethanol and treated in an ultrasonic bath, low-intensity ultrasound, at a frequency of 40 kHz and power of 50 W.
In Figure 2c–e the effect of ball milling treatment on particle size distribution is presented. The particle size distribution of starting oxides is also given (Figure 2a,b). The following characteristic diameters are shown: d10 (10% of particles smaller than this diameter), d50 (average particle size), and d90 (90% of particles smaller than this diameter) [34]. It is noticeable that mixtures grounded for 40 min (TiCe-0.8:0.2-40, TiCe-0.2:0.8-40, TiCe-0.5:0.5-40) have a larger average particle size (d50) and wider particle size distribution than those grounded for 100 min (TiCe-0.8:0.2-100, TiCe-0.2:0.8-100, TiCe-0.5:0.5-100). The width of the distribution is usually quantified by calculating the span as (d90-d10)/d50 [34].
The smallest average particle sizes were observed for TiCe-0.2:0.8-100 and TiCe-0.5:0.5-100 samples, 5.01 µm and 5.50 µm, respectively. The distribution curves of mixtures ground for 100 min are characterized by the absence of a tail corresponding to the size of particles larger than 100 µm (Figure 2c–e), which leads to the conclusion that a prolonged mechanochemical process promotes the fragmentation of agglomerates. Considering the values of average particle size previously mentioned, it can be assumed that the influence of mechanical forces on the particle size is more pronounced for mixed oxides with a high amount of CeO2, i.e., TiCe-0.2:0.8-100 and TiCe-0.5:0.5-100. A possible explanation lies in the significant difference between the particle size distribution curve of starting oxides. In fact, TiO2 particle size values at 10%, 50%, and 90% of the cumulative frequency are less than those of CeO2. The particle size values at 10%, 50%, and 90% of the cumulative weight and span values are shown in Table 2.

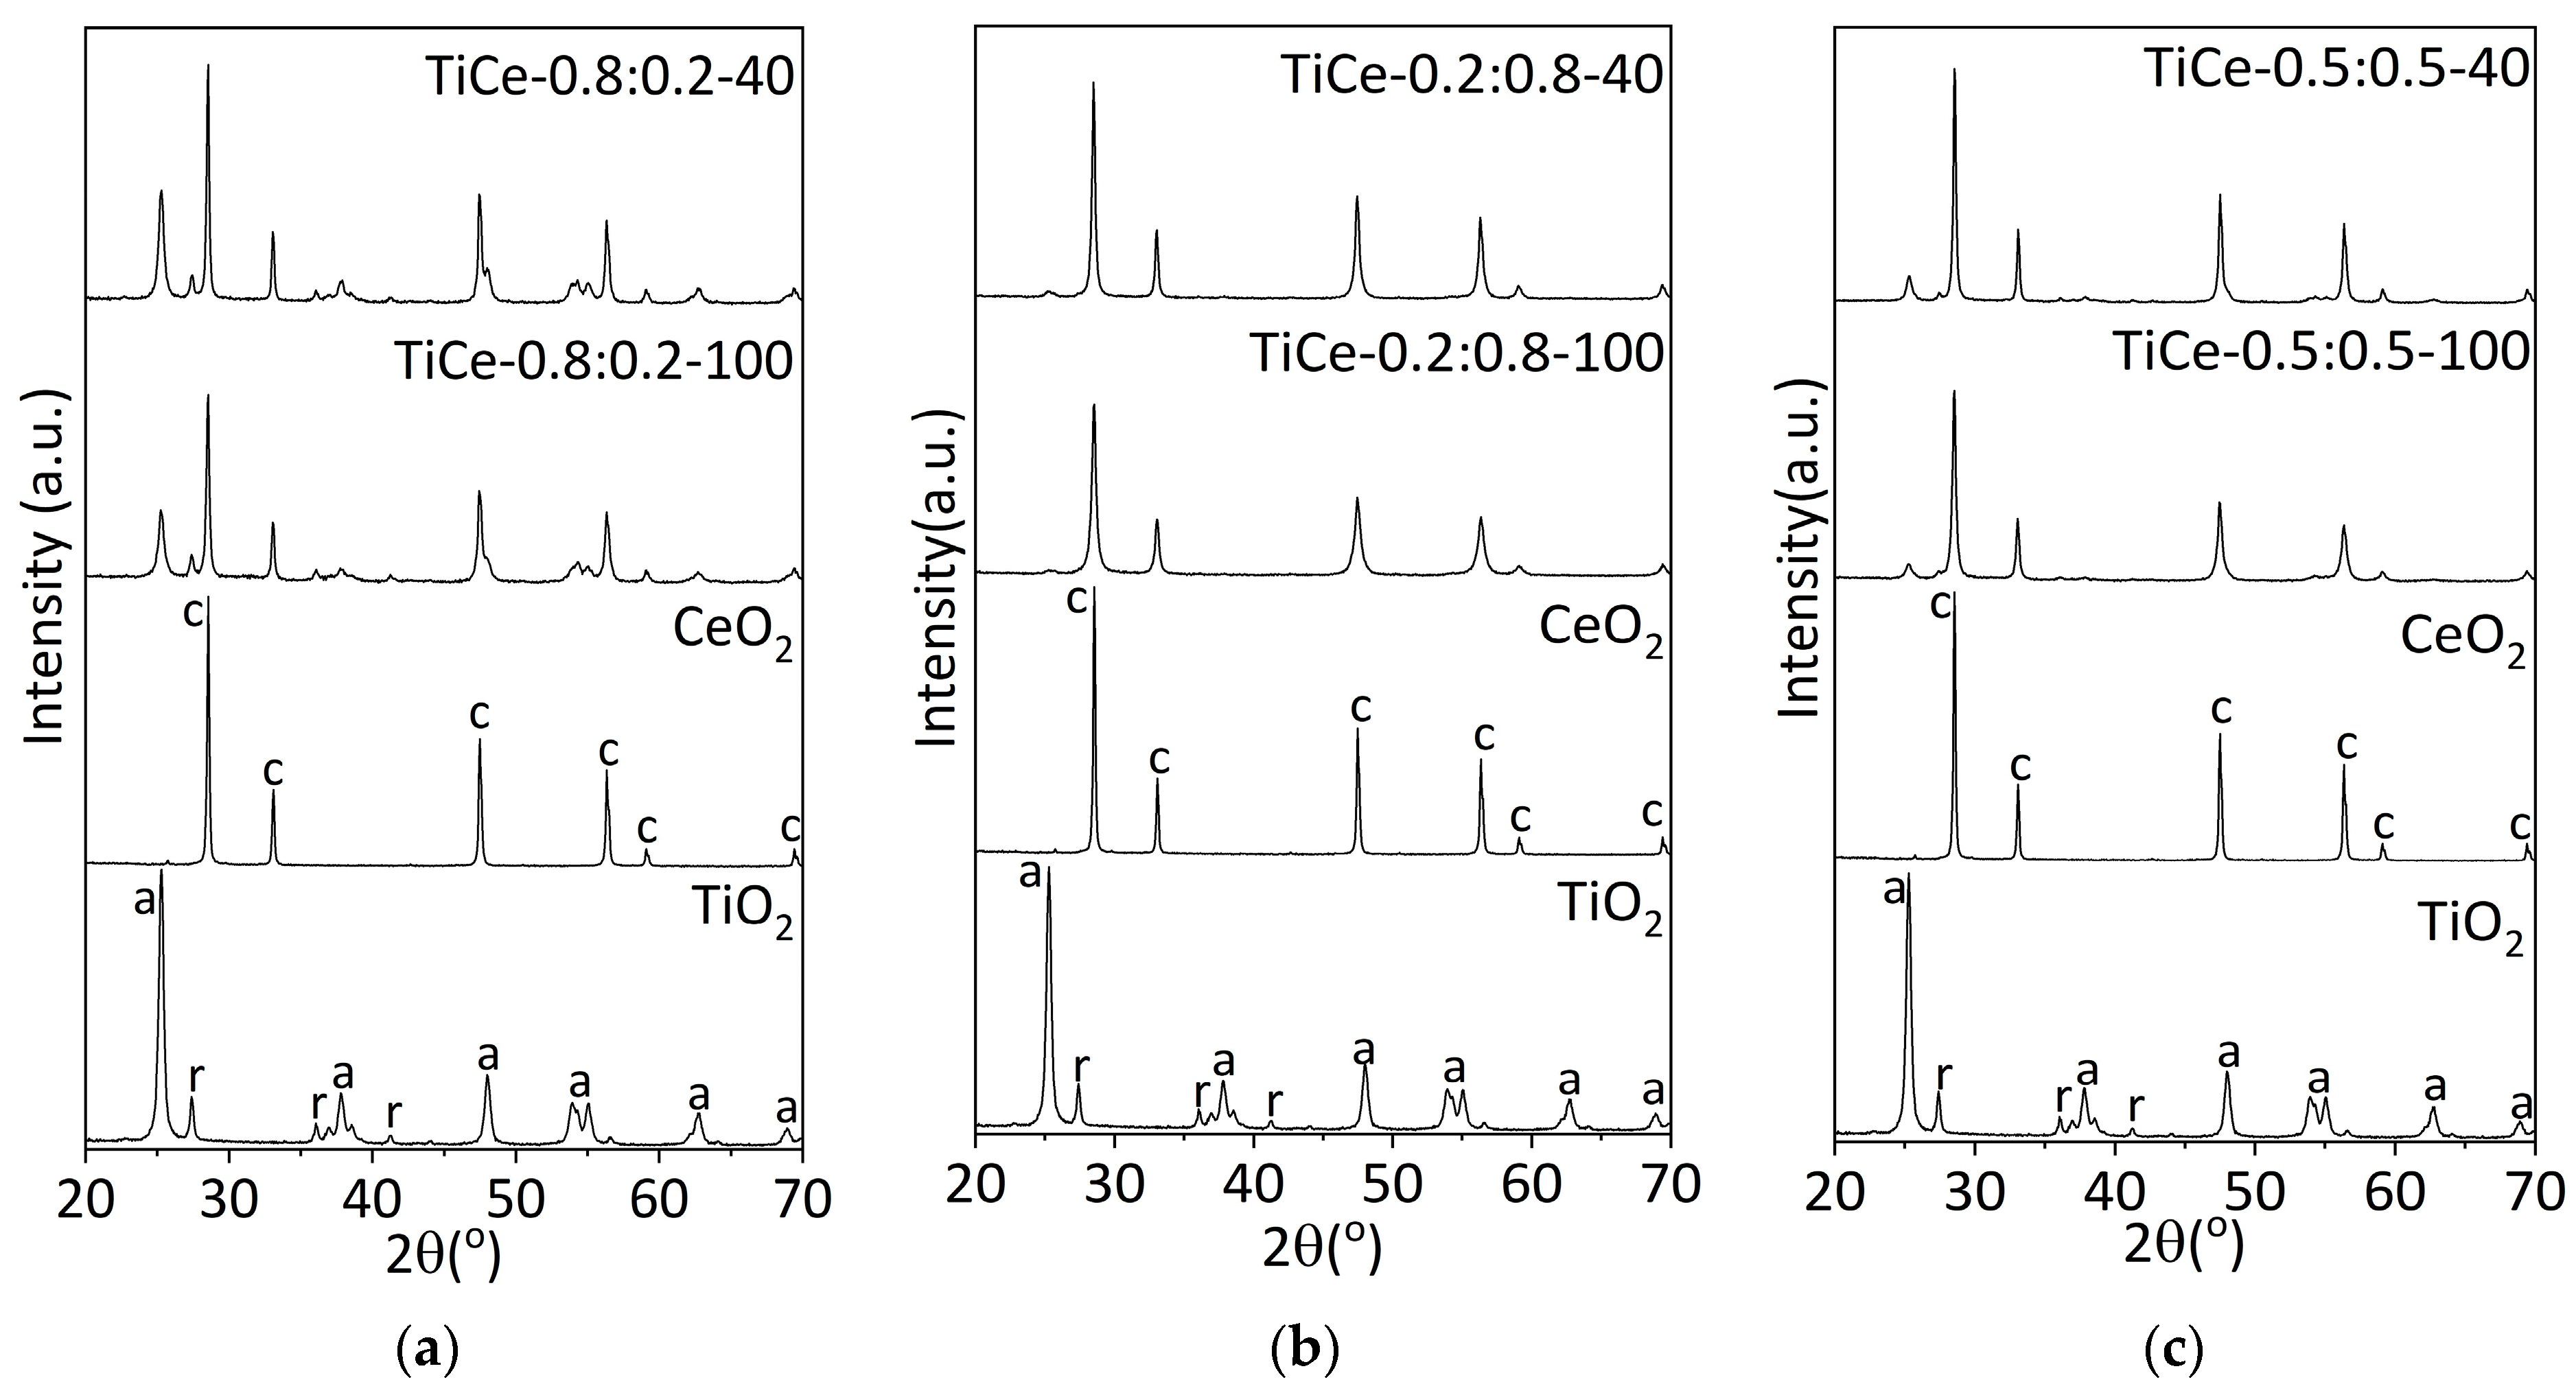
2.1.2. X-ray Powder Diffraction

X-ray powder diffraction (XRPD) was used to examine changes in the crystal structure of the powders after undergoing mechanochemical treatment. Diffraction data were acquired over the scattering angle from 20° to 70° with a speed of 0.05 °/s and an acquisition time of 1 min using the Rigaku Ultima IV diffractometer in Bragg-Brentano geometry (Tokyo, Japan). The irradiation used was Ni-filtered CuKα radiation with a wavelength of 1.542 Å.
Figure 3a–c displays the XRPD patterns of TiO2-CeO2 mixed oxides and starting powders. The results are arranged in order to visualize the influence of the milling time. XRPD measurements provide characteristic reflections of the anatase and rutile phases of TiO2 and the cubic form of CeO2. No reflections belonging to the new crystalline structures are present in the TiO2-CeO2 patterns. This indicates that there is no detectable chemical reaction between TiO2 and CeO2 in composites [35]. The absence of crystalline Ce-Ti-O compounds could be a consequence of the method of preparation of mixed oxides and the preparation conditions: composition, temperature, and atmosphere [36,37]. The formation of various compounds with Ce-Ti-O interaction, such as Ce2TiO5, Ce2Ti2O7, and Ce4Ti9O24, has been reported in the literature when heating appropriate mixtures to a temperature of 1523 K [36]. The mechanical energy and local temperature introduced into the system under the given milling conditions are insufficient to cause a chemical reaction that leads to the formation of more complex oxides.
The mechanochemical treatment did not affect the position of the peak in any of the presented patterns. Shifting of the peak would indicate a change in the lattice parameters as a result of the incorporation of the dopant atoms into the host lattice [38]. This further confirms that the unit cell parameters remained unchanged, and no solid solution was formed.
The phase crystallite size in the mixtures was evaluated and summarized in Table 3. The most prominent reflection of the mixed oxides tended to increase the full width at half maximum (FWHM) compared to the peaks of the pure components. The broadening of diffraction peaks is a measure of deviation from the ideal crystal structure, such as the final crystallite size, and lattice strain arising from increased dislocations and two-dimensional lattice defects [39,40]. Increasing the milling time led to a further broadening of reflection peaks and a weakening of its intensity, indicating a reduction in crystallite size and a decrease in the amount of the corresponding phase [26]. The average crystallite size (D) was estimated from the full width at half maximum of the most prominent peak using the Scherrer formula, ignoring the contribution of strain [38]:
D = Kλ/βcosθ
Here, K is the morphological parameter for spherically shaped particles equal to 0.94 [26], λ is the wavelength of the radiograph (1.542 Å) for CuKα radiation, θ is the Bragg diffraction angle, and FWHM is rewritten as β and expressed in radians. Another consequence of subjecting the crystal to mechanochemical actions is the microstrain of the crystal lattice. Therefore, it is recommended to use the Warren-Averbach or Williamson–Hall methods [41] to estimate the effects of crystallite strain and crystallite size on the XRD peak width, separately. However, considering that ceramic materials are weakly influenced by strain hardening, even when containing dislocations [42], the use of Scherrer equations is justified.
As it can be noted from Table 3, the mean crystallite size of anatase and ceria phases in mechanochemically treated mixtures decreases with increasing milling time (mark “-“ signifies the absence of a reflection of the corresponding phase in the spectrum). It should be stressed that this trend was not observed in the case of the rutile phase. Comparing the post-synthesis crystallite size to that of the pure TiO2 and CeO2, it is observed that prolonged milling time affects the CeO2 crystallite size to a greater extent than anatase, in all mixtures except the one labeled as TiCe-0.2:0.8-40. Crystal size depends not only on the milling time but also on the composition of the mixture. The estimated values indicate that with an increase in the amount of CeO2 and, at the same time, a decrease in the amount of TiO2 in the mixture, the crystallite size of both mentioned phases reduces. The largest reduction in the size of CeO2 crystallites was observed in the sample milled for 100 min and containing 80% CeO2 (TiCe-0.2:0.8-100). Weak or absent reflection of TiO2 in the XRD pattern of the aforementioned sample (Figure 3b) suggests a decrease in crystallite size to the extent that it cannot be detected under the given conditions.
The intensity of rutile reflection in the XRPD pattern of milled powders varies depending on the milling time and the composition of the mixture (Figure 3a–c). Rutile phase fraction was determined by using the anatase (101) and rutile (110) peak, according to Spurr’s equation [26]:
f = 1−1/(1 + 1.265Ir/Ia)
where Ir and Ia represent the peak intensities of rutile and anatase, respectively. The calculated values listed in Table 4 show that all milled powders contain a larger amount of the rutile phase with respect to TiO2. The rutile weight fraction in mixtures of the same composition increases with prolonged milling time.
Due to the friction, shear, and collisions between the milling balls and the powder, so-called “hot spots” are formed, which are characterized by a rise in temperature and pressure [30,43]. Local high temperature and pressure induce anatase to rutile transition [26]. The change in the weight fraction of the phase in the mixtures with the change in the synthesis conditions might be the reason for the observed increase in the size of the rutile crystallites with the increase in milling duration.

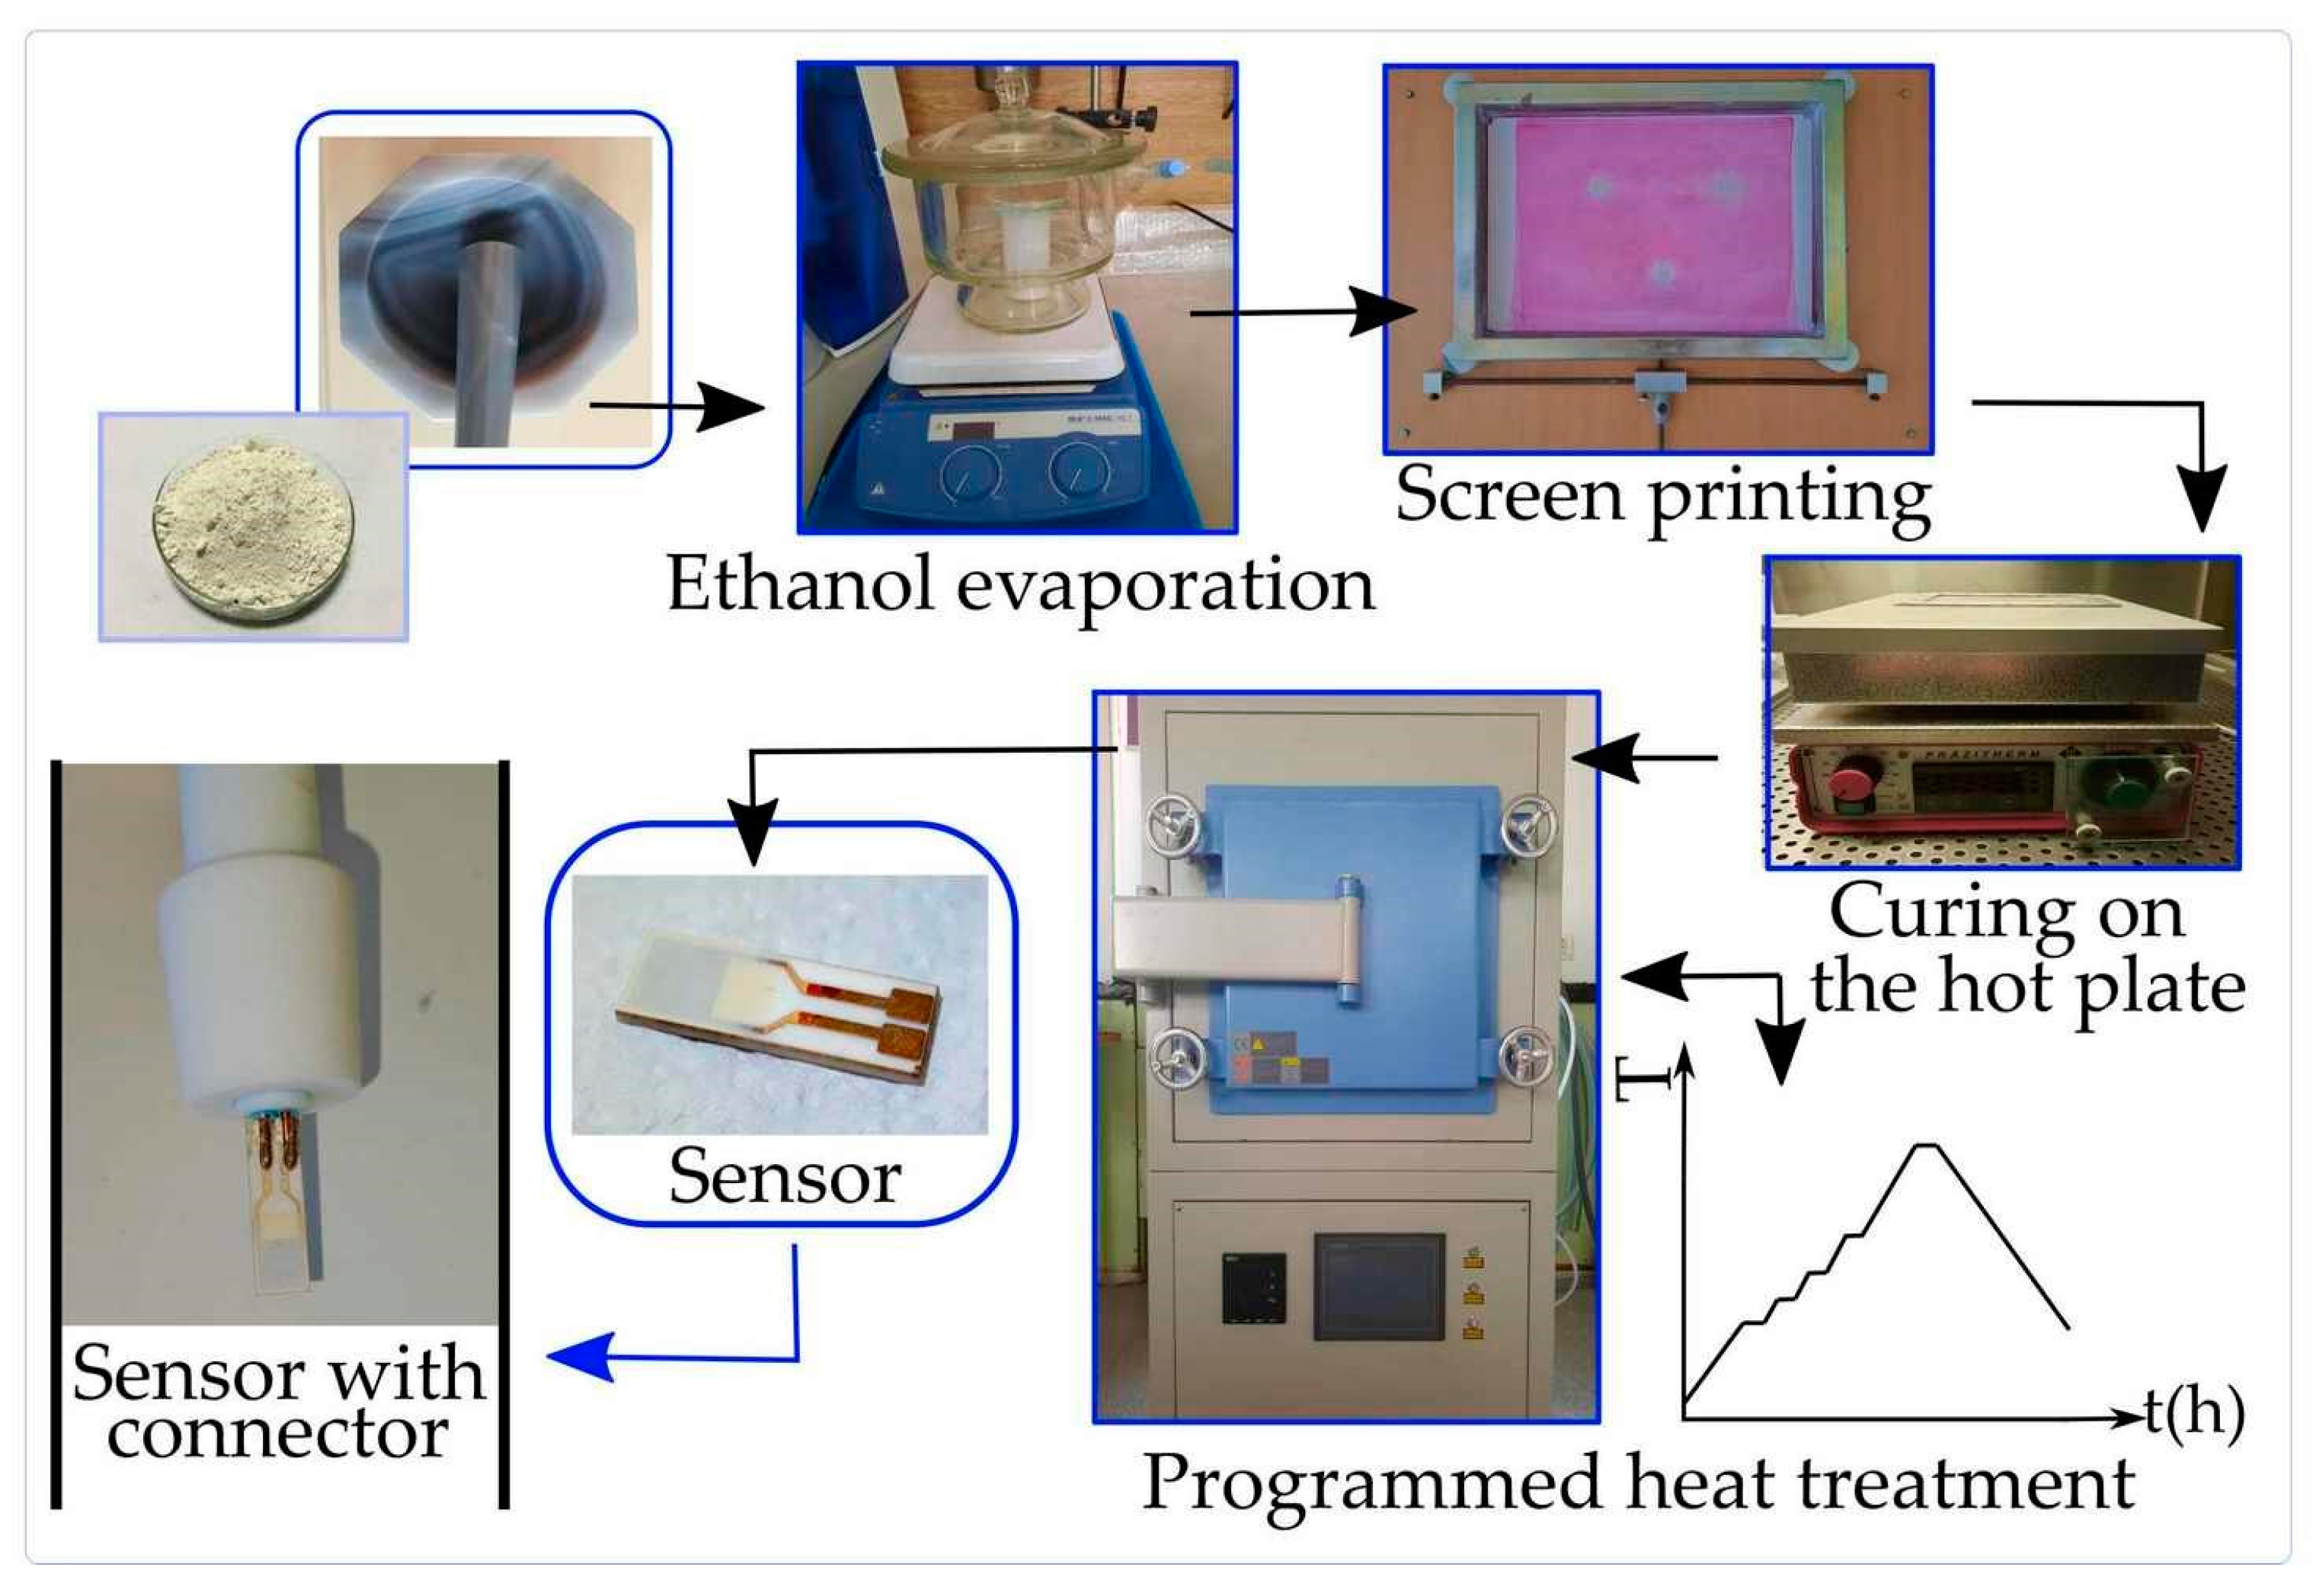
2.2. TiO2-CeO2 Paste Preparation and Sensor Fabrication

The TiO2-CeO2 pastes were prepared by following the recipe for the fabrication of TiO2 paste for dye-sensitized solar cells, which was established by Ito and his coworkers [44]. A mass of 1 g of mechanochemically treated powders was ground in a porcelain mortar with the addition of acetic acid, water, and ethanol, respectively. The content of the dispersion in ethanol was concentrated by evaporating ethanol in a desiccator on a magnetic stirrer. The pressure was lowered to 10 mbar using a vacuum pump. The same procedure was applied for making TiO2 and CeO2 pastes from starting powders.
The step-by-step sensor fabrication is illustrated in Figure 4. Before applying each layer, the paste is homogenized by stirring on a magnetic stirrer (MR 3001 K, Heidolph, Wood Dale, IL USA). A total of six layers are deposited by a screen-printing technique on an alumina substrate, in the form of thick films. Commercial substrates DropSense InterDigitated Gold Electrodes with a Platinum heater on the other side (DropSense, Interdigitated Gold Electrode/200 microns lines and gaps, Metrohm AG, Herisau, Switzerland) were used. Screen printing equipment used in this work was handmade. After each layer application, the substrate was dried on a hot plate (PZ28-2, Präzitherm, Harry Gestigkeit GmbH, Düsseldorf, Germany) at 125 °C for 6 min. The last step in sensor fabrication is programmed heat treatment in an oven (CY-A1200-4IT, Zhengzhou CY Scientific Instrument Co., Ltd., Zhengzhou, China) up to 800 °C in an atmosphere of Ar. The heating process serves to degrade the organic substances from the paste and sinter the sensing layer during the temperature hold. By initiating the necks growth between the particles, the sintering step improves the electromechanical bonding of the particles [45]. The obtained structures were fixed between two pairs of copper connector wires, which were made in our laboratory to measure sensor response.

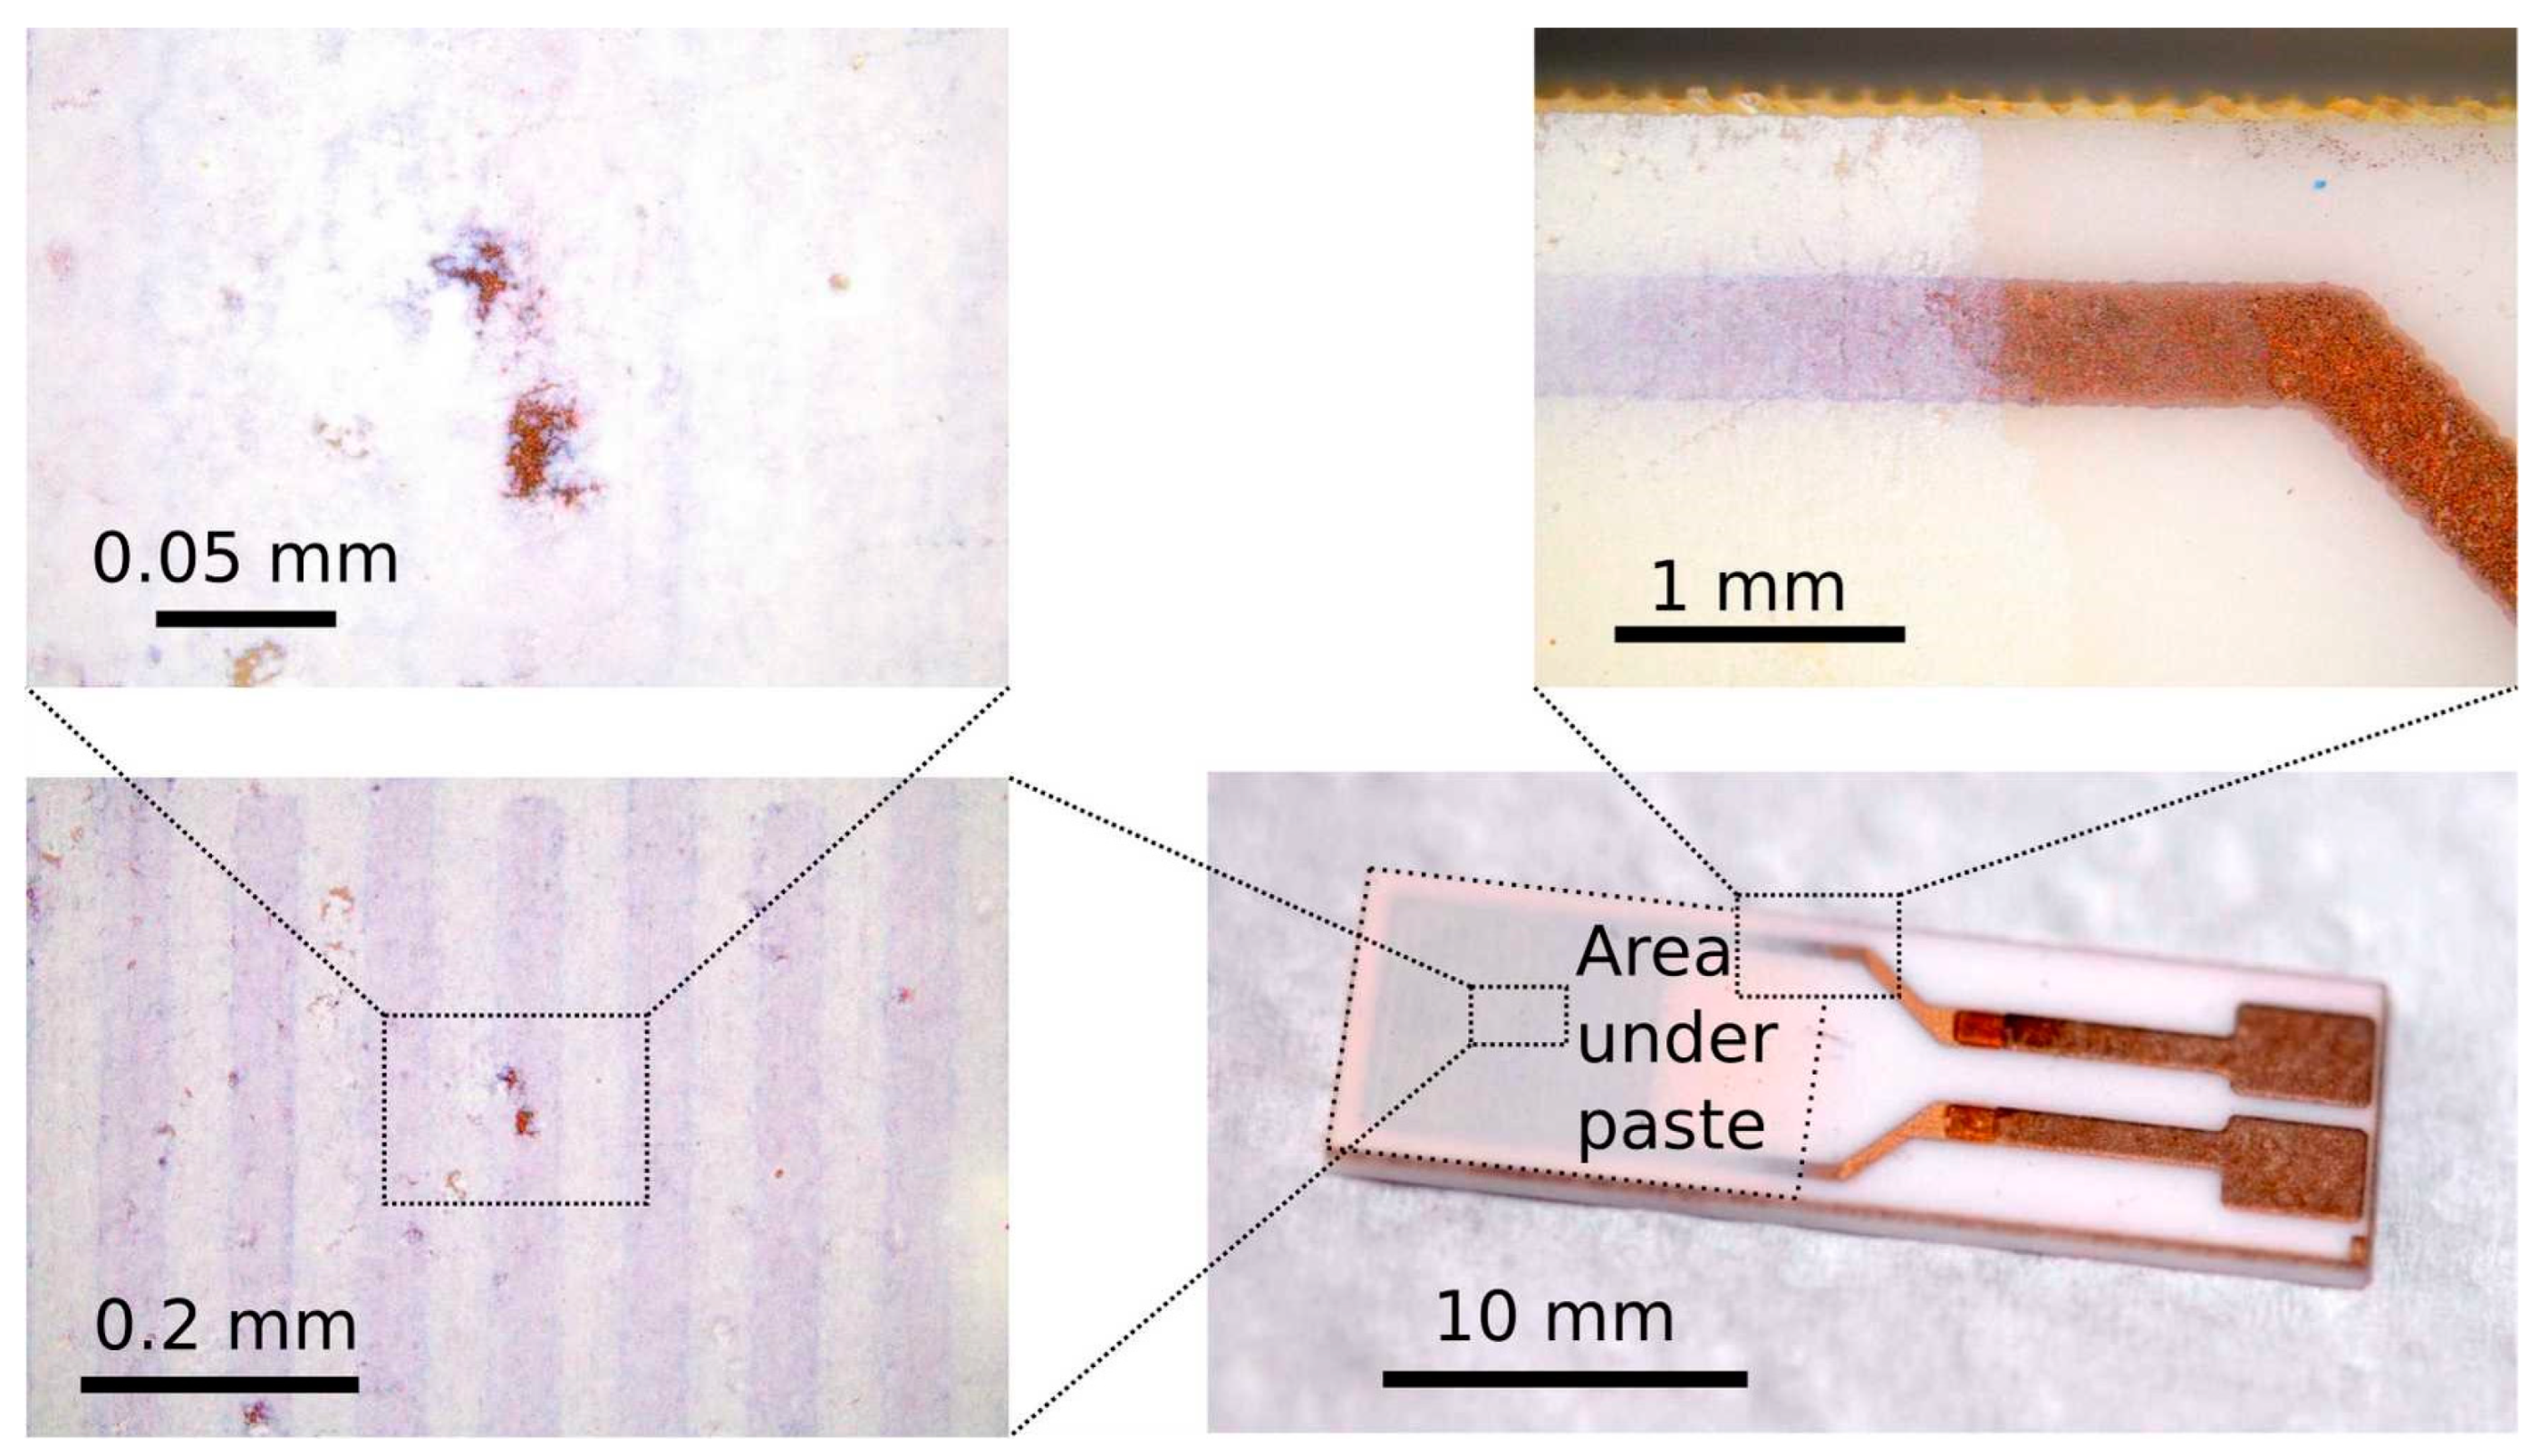
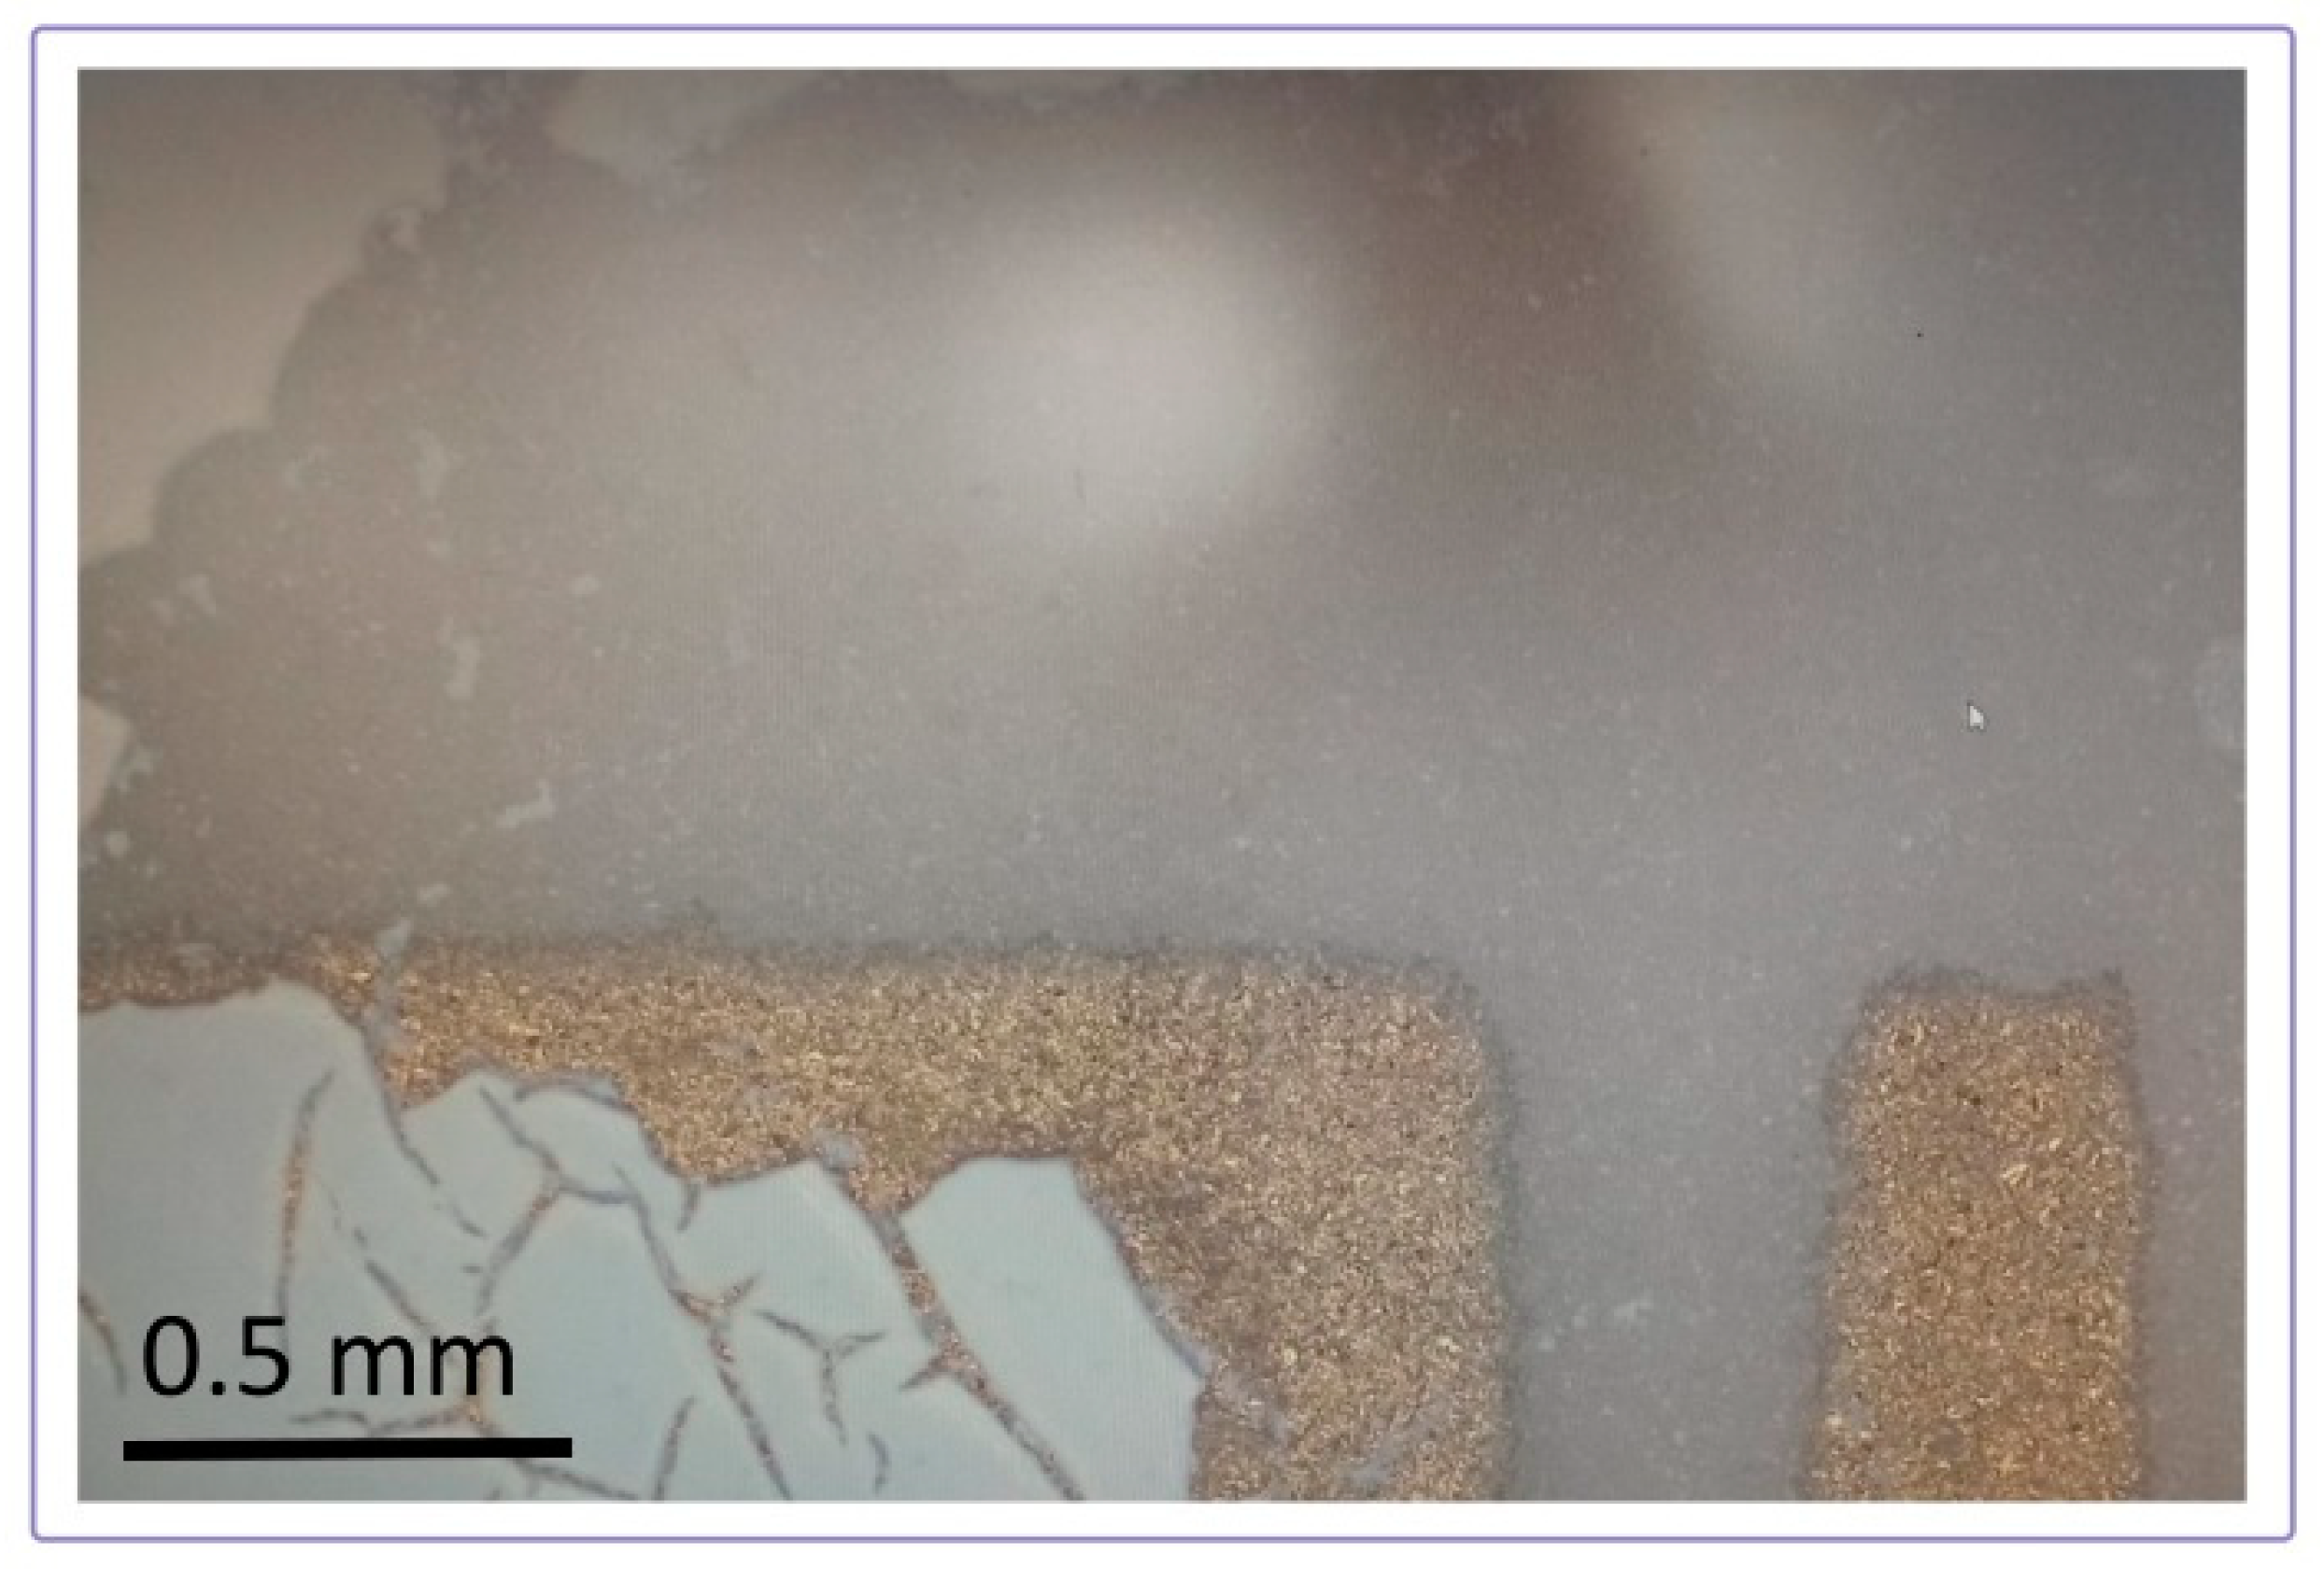
2.2.1. Optical Microscopy

Visual inspection of the substrate coverage with the screen-printed material was performed using an optical microscope (BX53MTRF-S, Olympus, Tokyo, Japan). The surface was examined at various points of interest, zooming into the small surface (Figure 5). The optical inspection revealed the uniformity of the screen-print deposition with visible patches of paste of relatively low thickness. This might be the consequence of the manual screen-printing technique used in the process of sensor fabrication.
The thick film of mixtures and CeO2 exhibited good attachment to the alumina substrate, without peeling off. On the other hand, it was observed that parts of the TiO2 films near the edge of the substrate cracked and fell off after the heat treatment. Figure 6 shows a close examination of the substrate coverage with TiO2 films. Parts of the alumina and gold electrodes at the edge of the substrate that are not covered with a film are visible.

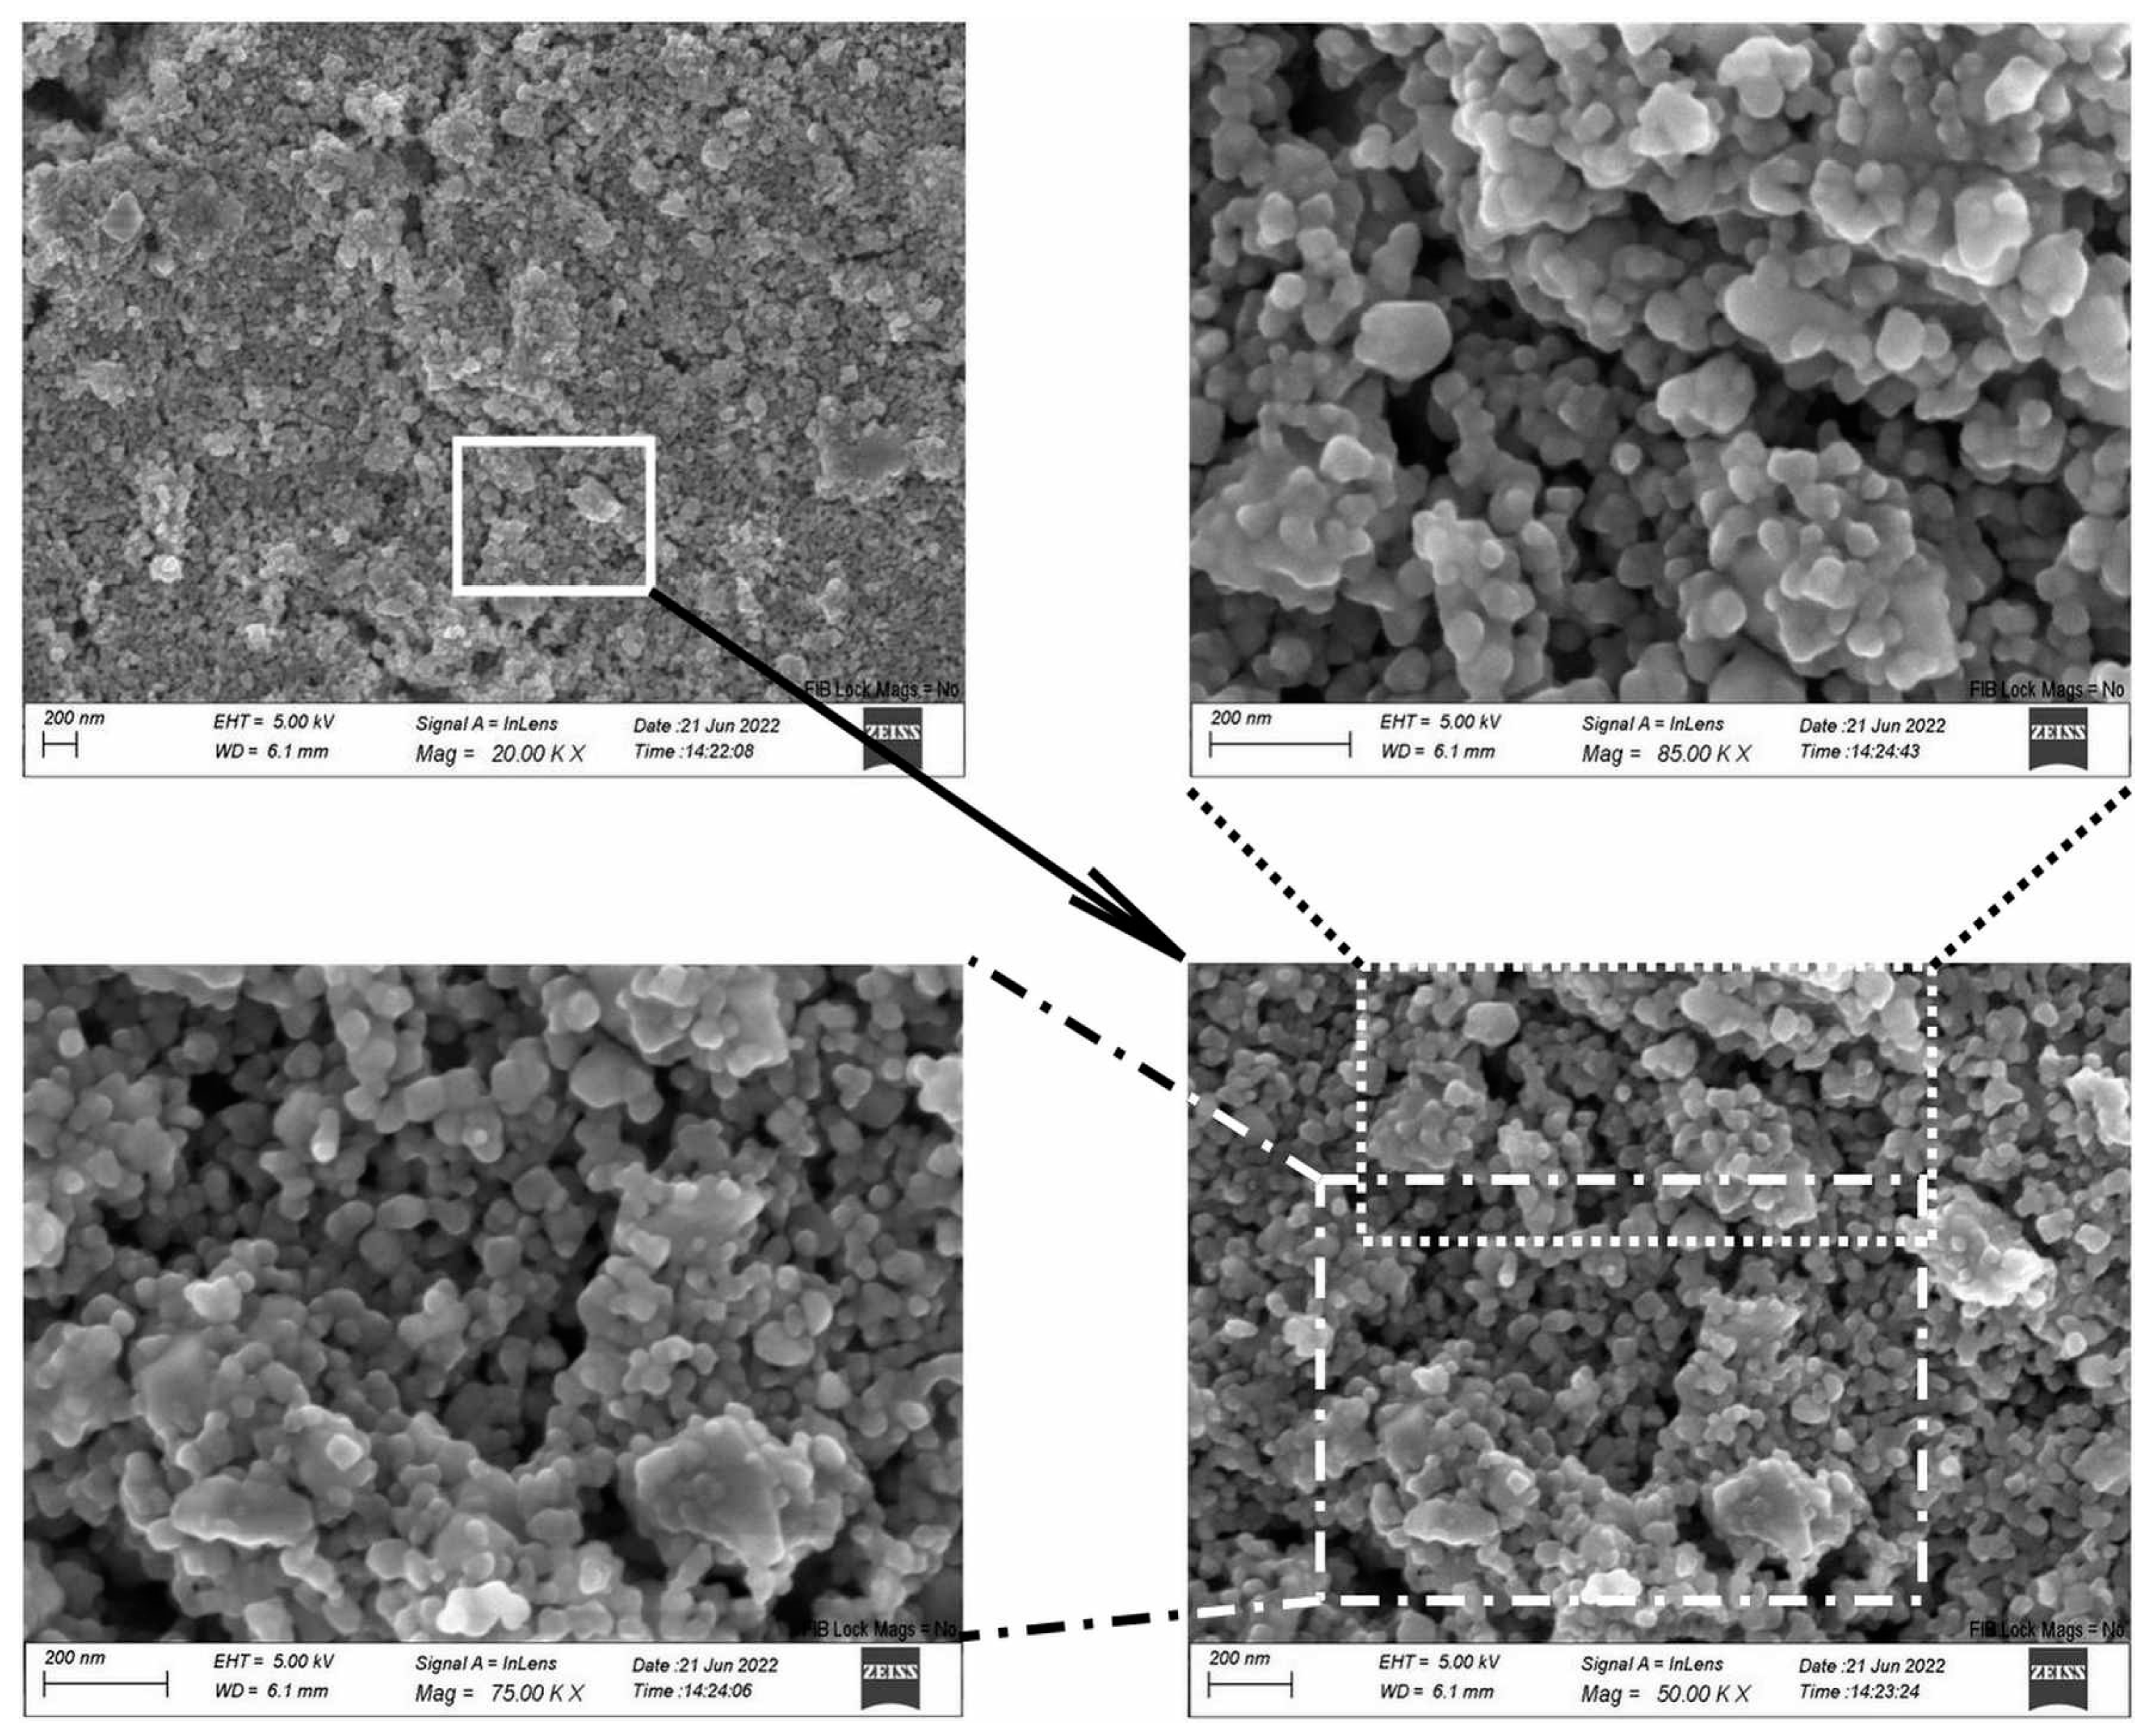
2.2.2. Scanning Electron Microscopy of a Film Surface

Scanning Electron Microscopy and Energy Dispersive Spectroscopy (DSM 962, Zeiss, Jena, Germany) were employed to examine the surface of the TiO2-CeO2 films on the substrate. SEM imaging of the mixtures revealed randomly distributed particles of various size (Figures S1–S5). Small, isolated grains, as well as agglomerates, were observed. Larger particles are irregular in shape, whereas smaller ones appear to be spherical. Such a morphology is a consequence of the wide distribution of particle size of the powder. Identical surface characteristics and a lack of particle ordering were found for all mixtures. The surface structure of the TiCe-0.5:0.5-40 film is given in Figure 7 as an example of a SEM visualization results. EDS analysis showed that the amount of Ti and Ce on the surface of the mentioned sample corresponds to the ratios of the starting oxides (Figure 8). A small amount of carbon is present on the surface of each sample, which is considered an unavoidable contaminant when the material is in contact with air.

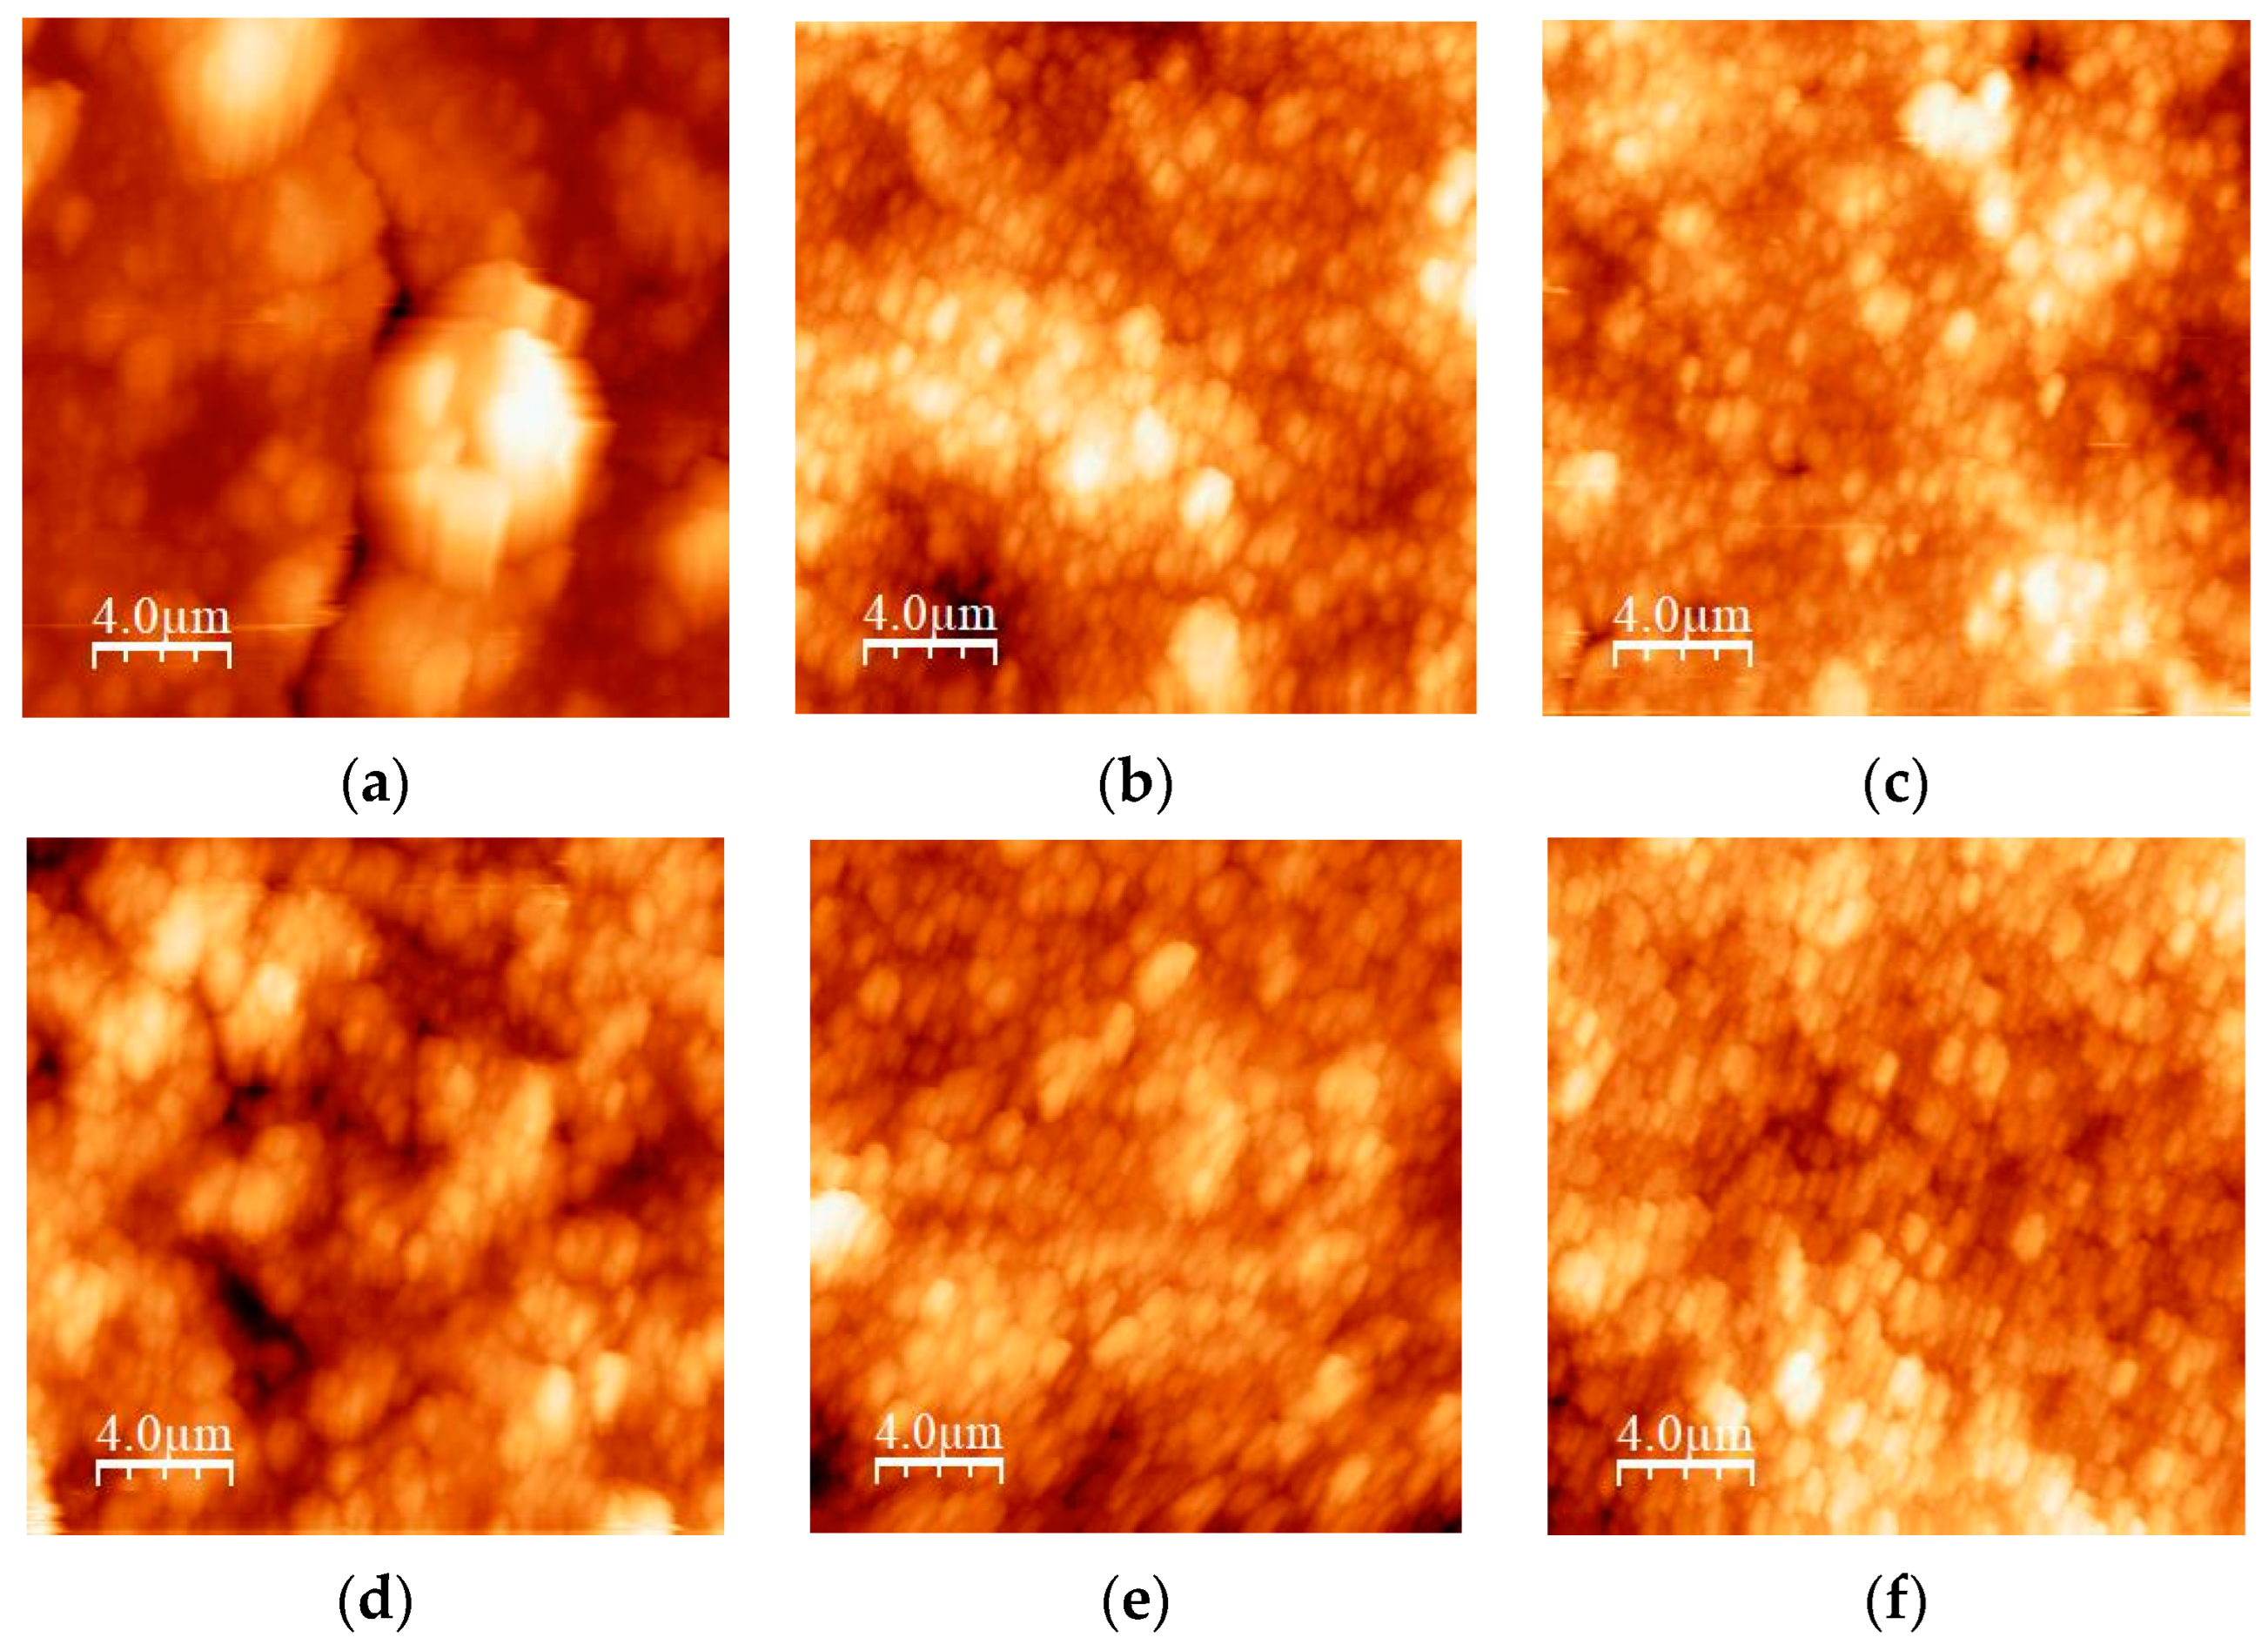
2.2.3. Atomic Force Microscopy

The topography of the thick films was investigated using an atomic force microscope in the intermittent-contact mode (NTEGRA Prima, NT-MDT, Moscow, Russia). The scan area was (20 × 20) µm2. The image analysis and roughness parameters calculation were performed using the WSXM 4.0 software beta 9.3 version [46]. In Figure 9a–f, the 2D AFM images for all studied samples are given. The values of the average roughness (Ra) and the root mean square roughness (Rq) determined by the mentioned software are given in Table 5. No correlation between roughness and particle size distribution was established. The roughness of the film surface did not change significantly after increasing the milling time, except for the mixture with a high amount of TiO2 (TiO2:CeO2 = 0.8:0.2).

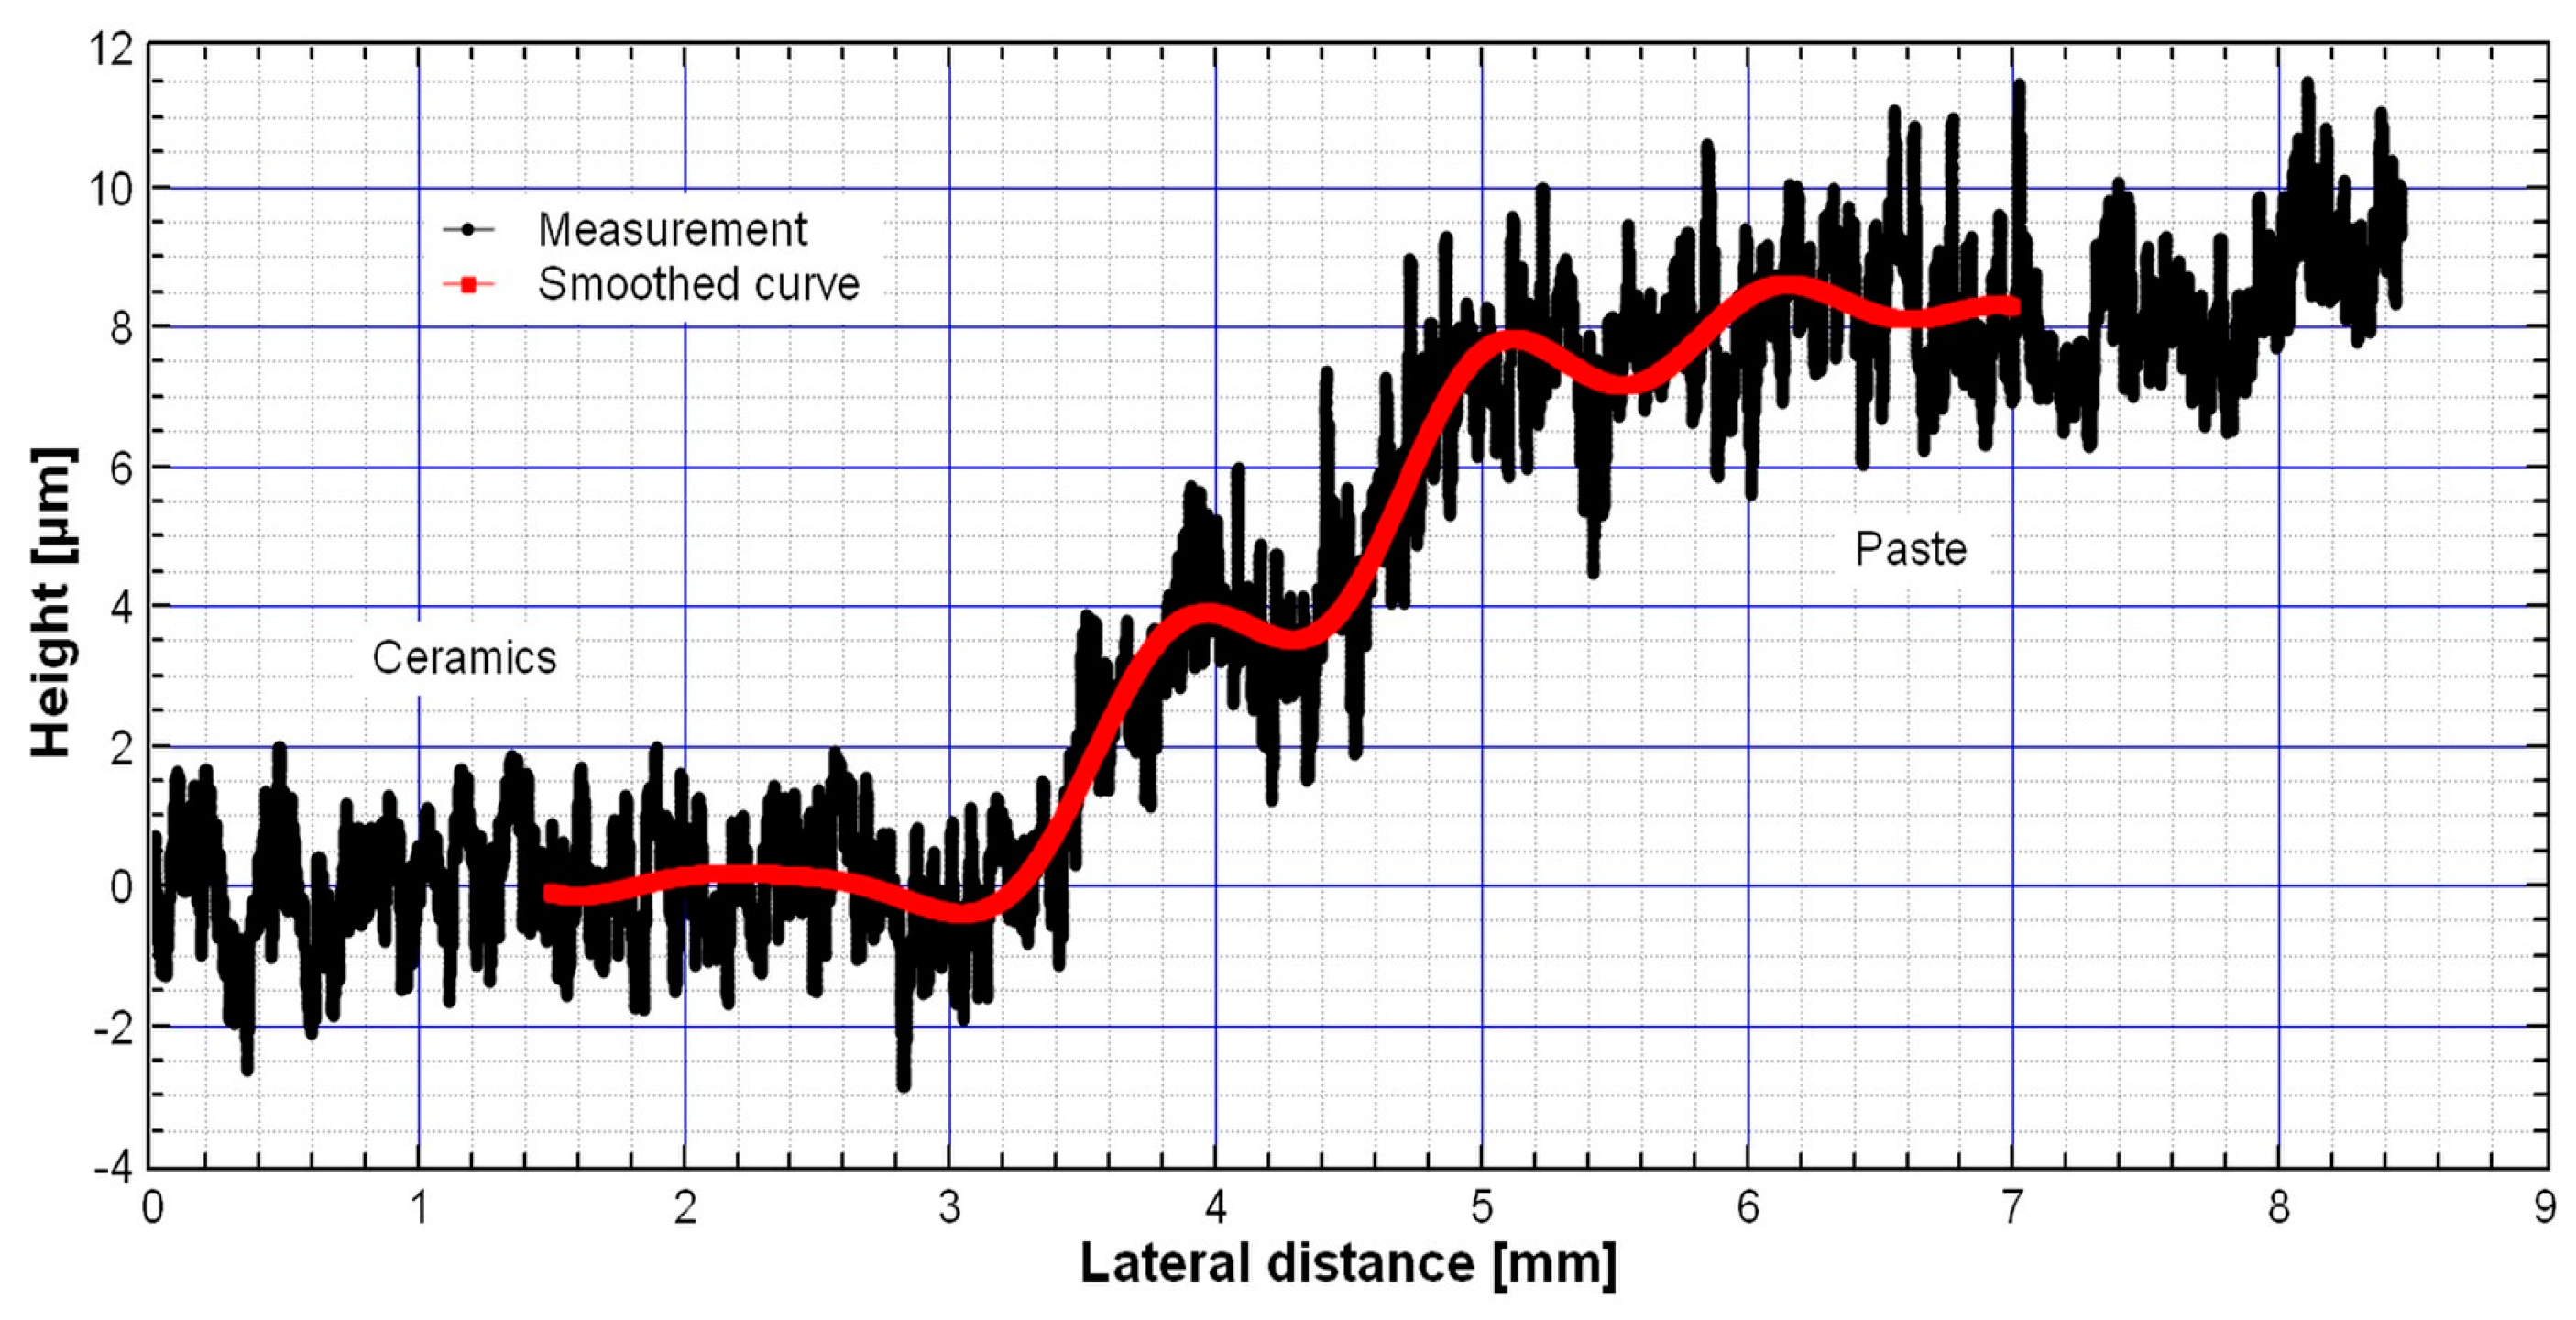
2.2.4. Film Profilometry

The thickness of the thermally treated TiO2-CeO2 films on the DropSense substrate was measured with a stylus profilometer (DektakXT+N-lite, Bruker, Billerica, MA USA). The force was adjusted to 0.3 mg in order to prevent the film from cutting as the needle of the stylus crosses the surface. Figure 10 shows the thickness measurements result for the sample TiCe-0.5:0.5-40. The layer thickness on the substrate was estimated at 8 µm. A high roughness of the film surface originates by both the non-uniform size of particles and holes in the screen-printing image.

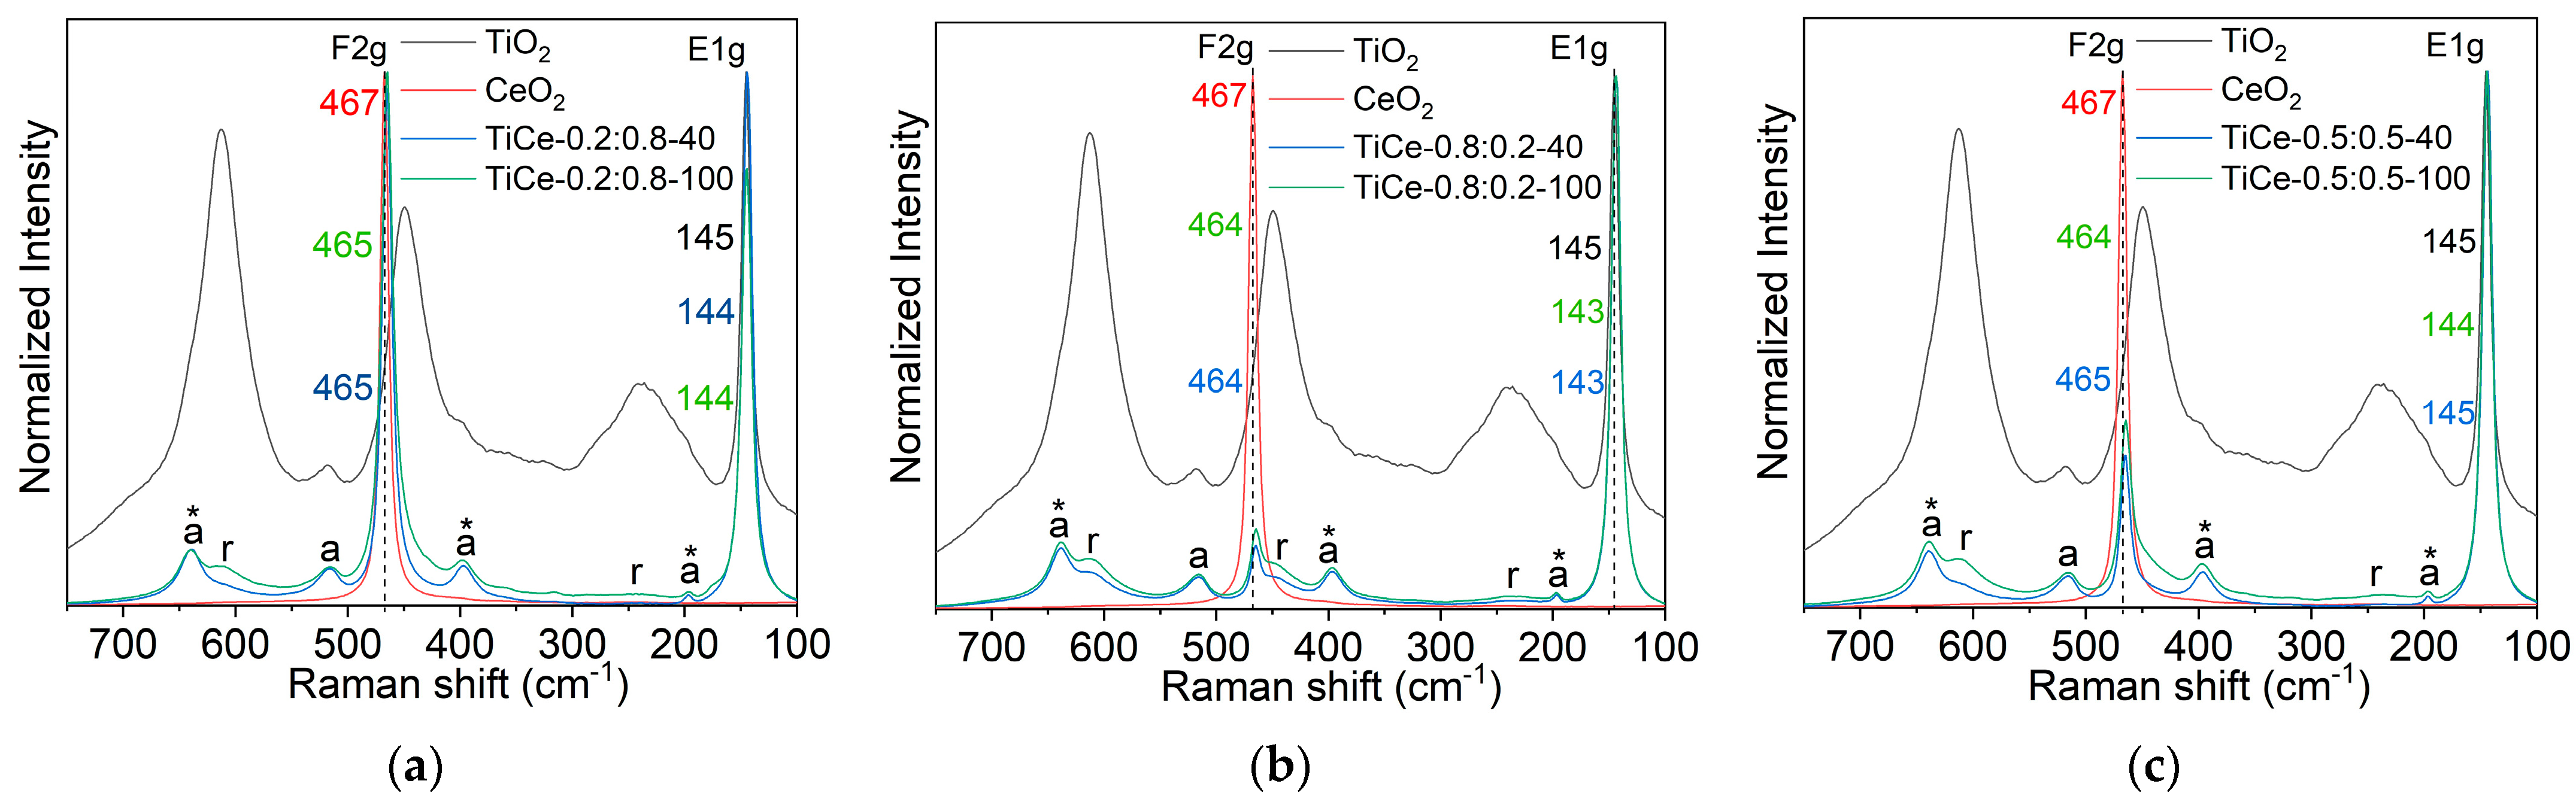
2.2.5. Raman Spectroscopy

The Raman spectra of the films of starting oxides and TiO2-CeO2 mixtures were recorded with a DXR Raman microscope (Thermo Fisher Scientific, Madison, WI USA), equipped with a research optical microscope and a CCD detector. A frequency-stabilized single mode diode laser with an excitation wavelength of 532 nm was used. The laser power level was adjusted to 1 mW.
The Raman spectra of the TiO2-CeO2 films are composed of the characteristic bands of the starting oxides suggesting that a mechanical mixture of oxides was sustainable after thermal treatment (Figure 11a–c). There is no evidence of the formation of detectable compounds between CeO2 and TiO2.
In the spectra of TiO2, two bands belonging to the anatase phase were identified; the most prominent was (E1g) [47], and the second one was at 518 cm−1 (A1g) [47]. The phase transformation of anatase into rutile caused by the thermal treatment of a paste at elevated temperatures [48,49] resulted in the masking of the anatase modes by strong rutile bands. After the mechanochemical activation of mixtures, the appearance and position of the TiO2 and CeO2 bands changed. The TiO2-CeO2 spectra revealed three extra bands at around 640, 397, and 195 cm−1, assigned to E3g, B1g, and E2g modes of the anatase phase (marked with an asterisk in Figure 11a–c) [47]. Calculations of Ti-O length relations show that these vibrations correspond to a moderately distorted TiO6−8 octahedron in anatase [50]. The sharp and narrow features at around 145 cm−1 and 464 cm−1 indicate high crystallinity of the anatase and CeO2 phases in all the synthesized mixtures. Compared to the native TiO2, the relative amount of rutile in TiO2-CeO2 films decreases, as evidenced by the normalized intensity decrease of the Raman bands at 612, 445, and 238 cm−1 [50]. In the spectra of the mixtures with the highest amount of CeO2 (TiCe-0.2:0.8-40 and TiCe-0.2:0.8-100), anatase vibrations can be clearly seen, whereas the normalized intensity of the rutile band was found to be the lowest among all samples. This leads to the conclusion that the presence of CeO2 hinders the anatase-rutile transition, stabilizes the anatase phase, and prevents the growth of the rutile crystals [51]. It can be seen that the characteristic bands of rutile are stronger in the spectra of the mixtures that were subjected to the prolonged milling of 100 min. This coincides with the results of XRD powder analysis, which demonstrated that the rutile weight fraction in mixtures increases with extended milling time (Table 4).
The inhibition of phase transformation most likely occurred due to the formation of the Ce−O−Ti interaction at the interface between the TiO2 and CeO2 domains [51]. The lattice mismatch between two dissimilar crystals in contact usually causes lattice strain and distortion. The observed shift of the TiO2 and CeO2 dominant features can be a result of introduced bond distortion [52]. This red shift is more pronounced for the F2g mode, especially in the spectra of samples that do not contain excess CeO2, namely: TiCe-0.8:0.2-40, TiCe-0.8:0.2-100, and TiCe-0.5:0.5-100 (up to 3 cm−1). Another contribution to the noticeable redshift of the CeO2 vibration in the spectra of the mixtures may come from certain concentrations of oxygen vacancies [53] introduced by mechanical forces.

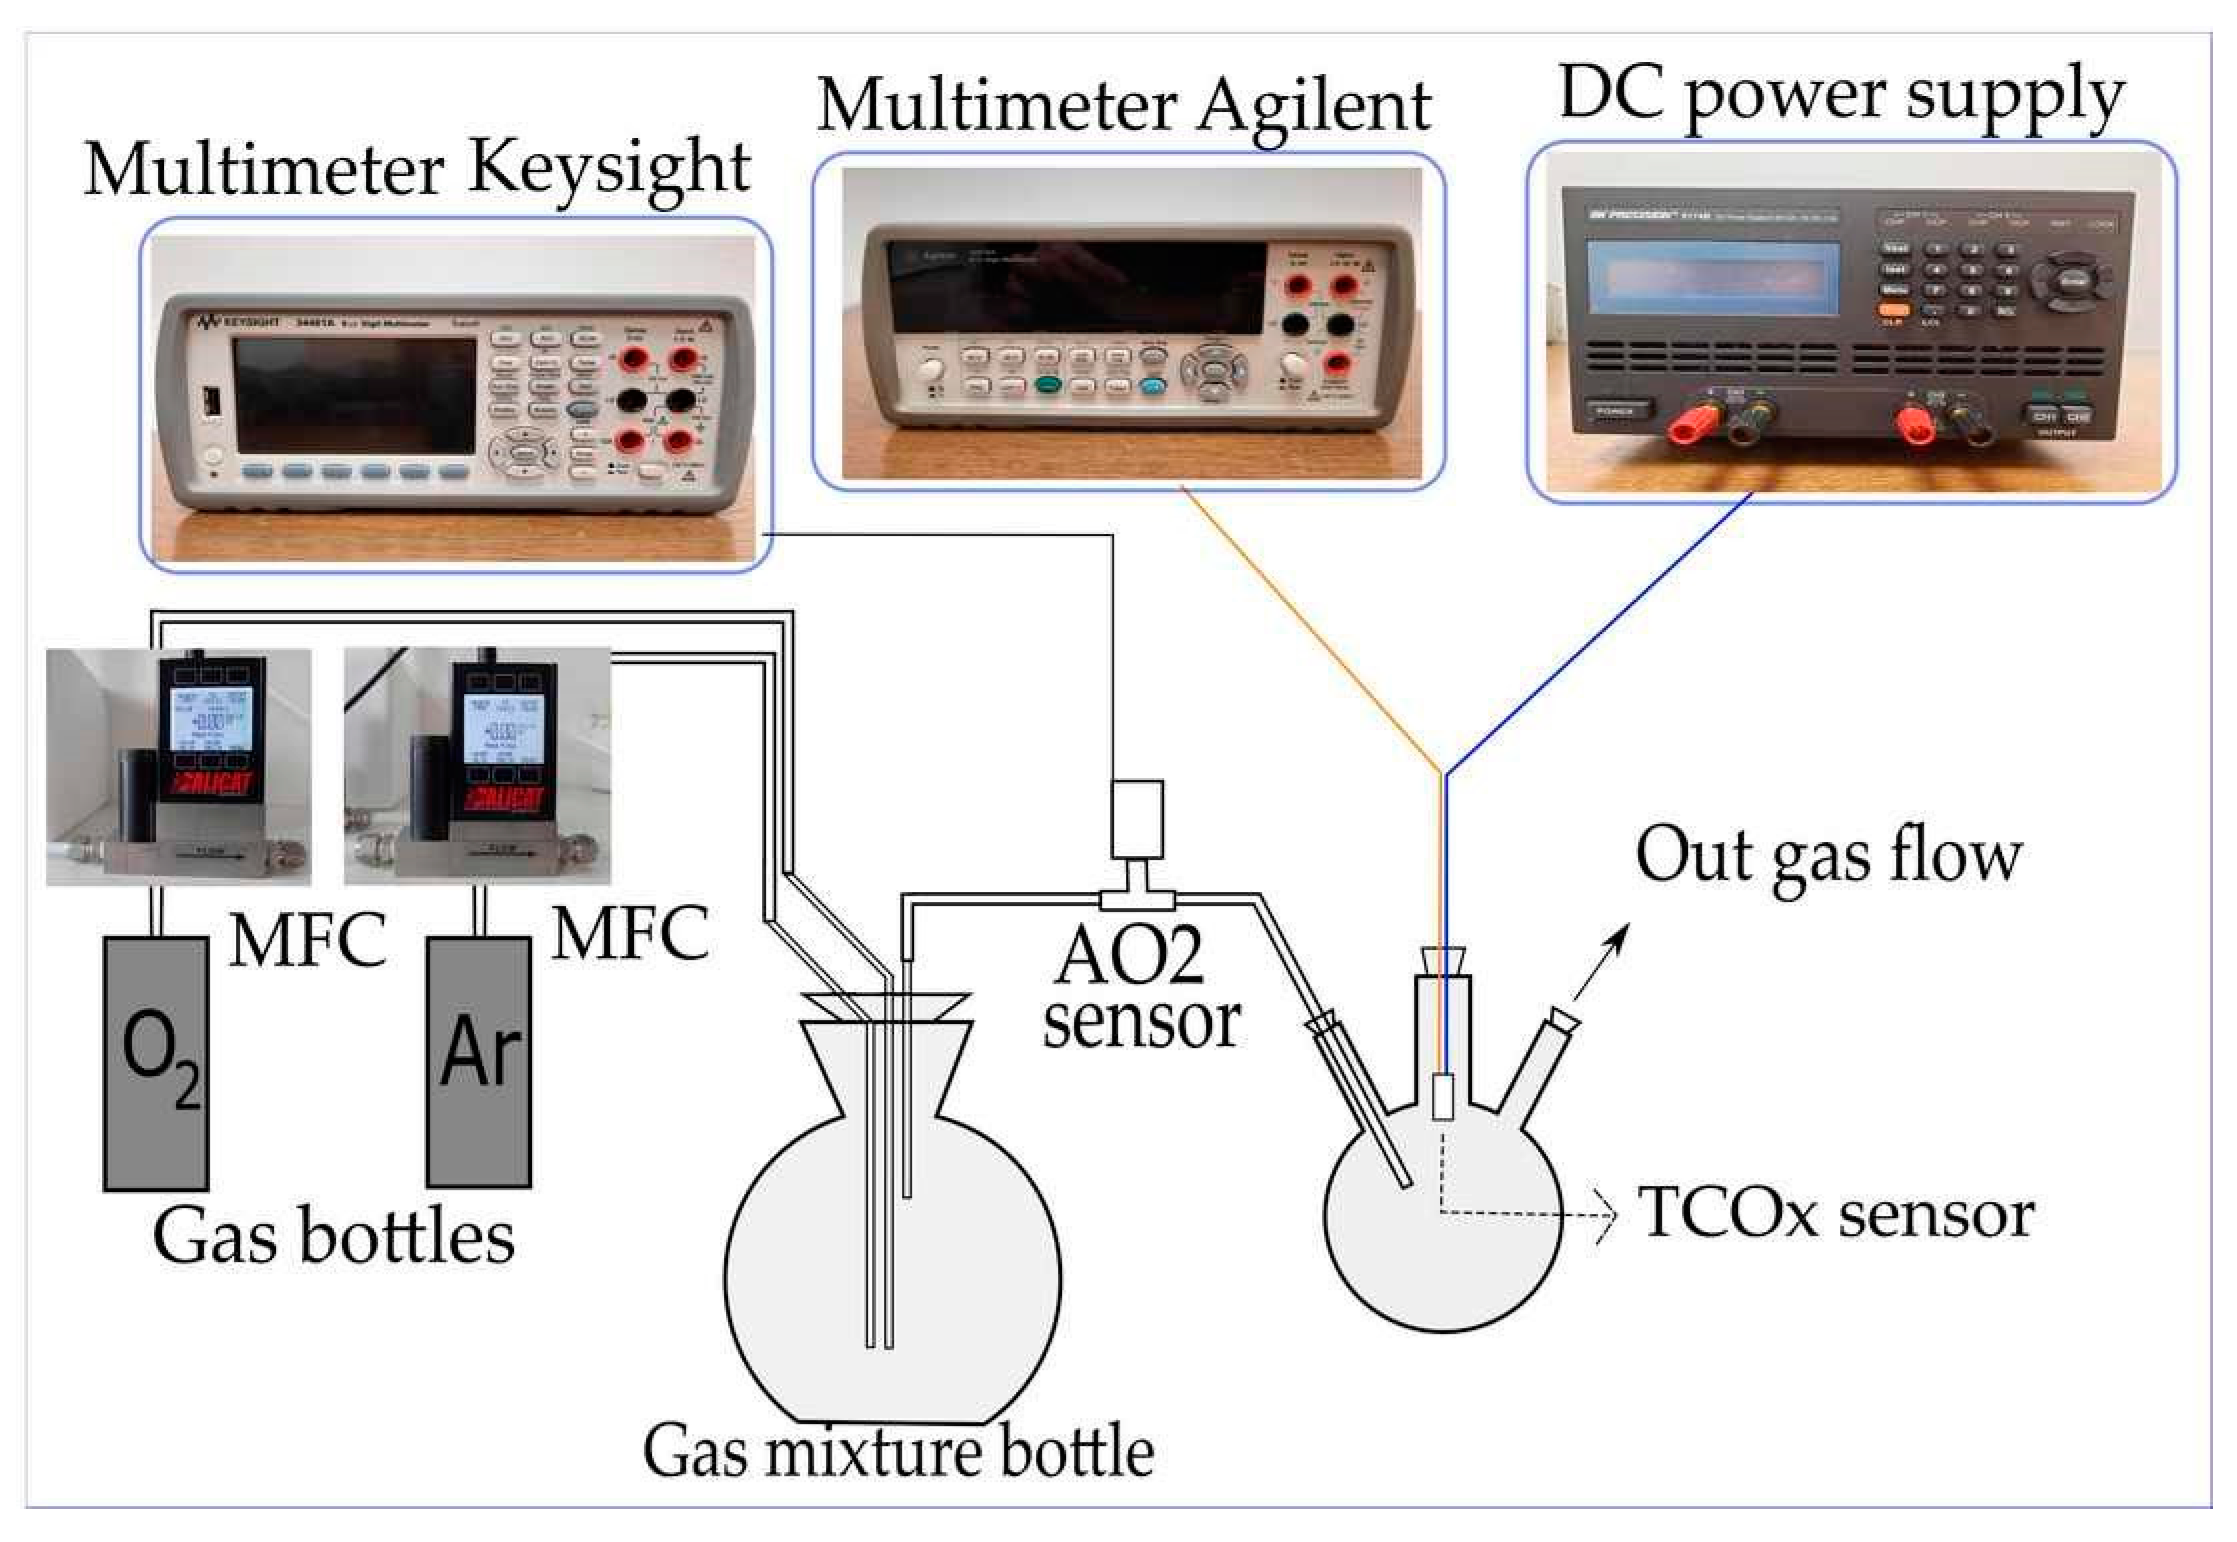
3. Results of Electrical Measurements

Electrical measurements of the obtained structures were performed in order to explore the sensitivity of TiO2-CeO2 mechanochemically treated mixtures. A system for measurements of the responsiveness of the sensors in gas flow was constructed (Figure 12). The sensors were exposed to different volumetric concentrations of O2 in the range from 0 to 100%. The concentration was varied by adjusting the rate of O2 flow (5N purity) and Ar (5N purity) using two mass flow controllers (MC-200SCCM-D/5M, Alicat Scientific, Tucson, AZ USA). The total flow of the gas mixture remained constant during the experiment (200 mL/min), but the ratio of O2 to Ar flow was altered in order to obtain various O2 concentrations. The O2 concentration was monitored by measuring the response of the reference sensor (AA428-210 (AO2) Citicel, Honeywell City Technology, India) using a multimeter (34461A, Keysight, Santa rosa, CA USA). The TiO2-CeO2 (TCOx) sensor was placed in a closed glass flask with inlets for the gas mixture and electrical contacts for the sensor. The sensor was heated by connecting the built-in platinum heater to a direct current (DC) power supply (9174B, B&K Precision, Yorba Linda, CA USA).
The supply voltage level was adjusted to 7 V, 8 V, and 9 V to obtain different working temperatures of the TCOx sensor (270 °C, 300 °C, and 320 °C, respectively). After setting the voltage, the value of the DC supply current was monitored. A stable current was taken as an indicator of a steady temperature. The temperature of the TCOx sensor was previously calibrated using an IR thermal camera (E5, FLIR Systems, Wilsonville, OR USA). Direct current resistance (DCR) measurements of the sensors were performed using a multimeter (34410A, Agilent, Santa Clara, CA USA), as it has the capability of measuring the resistance up to 1 GΩ.
The TCOx sensors were tested at different temperatures for a fixed O2 concentration. The same temperature behavior was observed for all mixtures. The minimum temperature at which the resistance falls below 1 GΩ and becomes measurable was around 270 °C. As the temperature rises, the resistance drops sharply to lower levels. As an example of the measurements at different temperatures, the response of the sensor based on the TiCe-0.5:0.5-40 mixture is shown in the Figure 13.
The TCOx sensor response measurements presented in this study were carried out at 320 °C. This operating temperature was chosen as the minimum temperature at which resistance of the sensor is low enough to be measurable by most available instruments for all samples. The resistance values were monitored for 15 min to test the stability of the sensor response at 320 °C. Figure 14 shows the results of time-dependent electrical measurement for the TiCe-0.8:0.2-100 mixture at a given operating temperature.
The mean value along with the standard deviation was derived from the last 200 s of electrical measurement for all TCOx sensors and presented in Figure 15 as the dependence of DC resistance on O2 volumetric concentration. Some of the oxide mixtures were screen printed on two substrates in order to test the repeatability of the sensing layer fabrication process. The same color on the graph indicates TCOx sensors made out of the same mixture.
It can be seen that the pure TiO2 film shows a very erratic response to the O2 concentrations, with a large standard deviation at 30% O2. We assume that the main cause of the unreliable sensor response is the peeling of the TiO2 film from the edge of the substrate, which is observed after heat treatment. For samples containing some amount of CeO2, such an irregular response of the sensor was not found, which can be seen in the behavior of other sensors, except the one based on pure TiO2. Most of the samples show monotonic behavior, with resistance increasing from low values to significantly higher values as the O2 concentration was raised. This feature makes the particular sample useful in real-world applications, since the correspondence between measured resistance and oxygen concentration is unambiguous. The resistance of the screen-printed CeO2 film is relatively high, typically on the order of hundreds of MΩ. This makes the practical applicability of the CeO2 sensor challenging, since it is hard to measure the resistance of such a range. Electrical measurements have shown that TiO2-CeO2 films have significantly lower resistance than pure CeO2. From the data in Figure 15, we found that the mixture TiCe-0.2:0.8-100 has the lowest absolute value of resistance.
Since the used screen printing equipment is manual, parameters such as the pressure on the screen and the amount of paste applied can vary with each deposition of a layer. The insufficient reproducibility of the screen printing technique obviously affected the reproducibility of sensor performance (Figure 15). The oxygen responses of sensors based on the identical TiO2-CeO2 mixtures were slightly different. This discrepancy can also originate from random errors introduced during the paste preparation. Moreover, the wide particle size distribution of the mechanochemically synthesized powders can contribute to the non-uniformity of the screen-printed layers. However, it was observed that the resistance values of the same TCOx sensors are grouped next to each other. In order to achieve the best possible reliable oxygen response, optimization of the screen printing process is required.
The sensitivity of the TCOx sensor was calculated as the ratio between the change in resistance and the change in oxygen concentration:
S = ΔR/ΔO2
where S is the sensitivity, ΔR is the resistance change, and ΔO2 is the change in oxygen concentration. The obtained values for the sensitivity of CeO2 and TCOx sensors are presented in Figure 16a–d. Results for mixtures of the same composition are shown in the same graph.
According to the graph data, the sensitivity of all mixtures strongly depends on oxygen level; it is the highest in the region of low concentrations (around 10%) and then drops sharply. The mixtures of composition TiO2:CeO2 = 0.5:0.5 that were milled for 100 min proved to be the most sensitive to the presence of oxygen (Figure 16c). The highest sensitivity was obtained in the range from 10% to 30%, reaching values between 3.5 and 8.2. In the case of mixed oxides at the mass ratio TiO2:CeO2 = 0.2:0.8, a trend of decreasing sensitivity with prolonged milling time was observed. Although the sensitivity of the sensor based on CeO2 is higher than that of the examined mixtures, its resistance exceeds 100 MOhm, even for very low percentages of O2.

4. Discussion

The sensing mechanism of semiconductor gas sensors is based on a shift of equilibrium of the surface oxygen chemisorption as a consequence of the change in environmental oxygen concentration [6,54]. The sensing properties are assumed to be influenced by two functions: receptor function and transducer function (Figure 17) [6]. According to Korotcenkov and Cho [55], receptor function represents the ability of the metal oxide surface to interact with the target gas. Therefore, it is determined by the chemical properties of surface oxygen. When the surface of the sensing layer is changed by adding a noble metal or another oxide, the modification of receptor function occurs [6]. The sensitivity can be significantly affected in this way. The second function determines the efficiency of oxygen-oxide interactions’ detection and conversion into an electrical signal [56]. It is based on the free carrier transport mechanism through the barrier between adjacent grains, which takes place at high temperatures. Contact between identical neighboring grains is called homo-contact [57]. A double Schottky barrier model is most often used to describe the free carrier transport process [6,56].
When O2 molecules are adsorbed on an n-type oxide surface, they extract electrons from the conduction band (Ec) and trap them at the surface. Double charged oxygen vacancies (V••) are the dominant active sites that O2 occupies, and they behave as electron donors [6]:
V•• + 2e + 1/2O2→Oionic
As a result of surface occupation by O2, the metal oxide layer loses electrons and ionic species are formed (Oionic = O2, O, O2−) [18]. O is believed to be the dominant form of adsorbed oxygen at the operating temperature of 300–450 °C [56]. In addition, the layer of charged oxygen species on the surface repels other electrons from the bulk of films, causing the formation of an electron-depleted region, and hence increasing the height of the Schottky barrier (eVs on Figure 16) [6]. The thickness of the electron-depleted region, the so-called space-charge layer, is the length of the band bending region. The creation of a potential barrier at the grain boundary restricts the flow of electrons and increases the resistance of the sensing layer [6,58].
As a result of the chemisorption of oxygen molecules, electron mobility and active sites for further adsorption are reduced. The electrical conductivity of the n-type semiconductor decreases with increasing oxygen partial pressure (pO), following the equation [6]:
σ = Aexp(−EA/kT)pO1/N
where σ is the conductivity, A is the constant, EA is the activation energy that determines adsorption reaction rate, k is the equilibrium constant, T is the working temperature, and N is the value that depends on the type of the defect. For the n-type semiconductor, this value is negative. Observing the calibration curve in Figure 14, it becomes clear that the TiO2-CeO2 mixtures behave as individual n-type oxides over the whole range of partial pressure, as well as pure CeO2.
Raman spectroscopy of the screen-printed TiO2-CeO2 films revealed that CeO2 crystals surround TiO2 crystals, inhibiting the anatase-rutile phase transformation. This implies that the TiO2 and CeO2 domains are in direct contact, forming a defined hetero-interface. Although the understanding of the working mechanism of sensors based on mixed oxides is still far from satisfactory, it is well known that the hetero-interface largely affects the sensing properties. The nature of the oxide-oxide interface can be briefly described with the help of characterization methods. XRD spectra of TiO2-CeO2 powders indicate that no solid solution between TiO2 and CeO2 was formed, at least not in a detectable amount. The Raman spectroscopy of the thick films did not show any features attributable to the new compound (Figure 11a–c), further indicating that the heat treatment of the paste did not lead to chemical bonding between TiO2 and CeO2. Thus, it is most likely that the interaction at the TiO2-CeO2 interface is physical. The red shift of the CeO2 band in the Raman spectra further suggests that the presence of the interface facilitates the reduction of Ce4+ ions and hence the formation of oxygen vacancies in mixtures. Studies that confirm this through experimental or theoretical analysis can be found [59,60].
When assembling two types of semiconductors with significantly different physical properties and work functions, in addition to homo-contacts, hetero-contacts are formed [57]. A hetero-contact is an interface between two types of grains, characterized by the generation of a potential that represents a thin double layer of physically separated positive and negative charges. The contact potential attenuates drift mobility for the electrons running in the direction against it, although it does not affect the electrons running in the opposite direction, hence increasing the resistivity of the interface. As a result, electrons with insufficient energy to overcome the contact potential are scattered, and the resistance of the material increases. Hetero-contacts can have a drastic impact on the sensor transducer’s function if the structure of the sensing layer is properly designed [61]. In that case, the response of the sensor is affected by the presence of the target gas in two ways: by changing the surface density of grain electrons and by changing the drift mobility of electrons passing through the contact. High sensing performances can be achieved by selecting the appropriate combination of grains and the structure in which the grains are packaged [57,61].
SEM imaging of the surface of TiO2-CeO2 films revealed irregularly distributed grains (particles) of different sizes with a tendency to form agglomerates (Figure 7). Grains that are randomly packed into a three-dimensional structure are considered a random network of homo- and hetero-contact potential [57]. N. Yamazoea and K. Shimanoea [61] showed that the resistance of the semiconductor structure is almost cut in half when grains of two different semiconductors are randomly mixed together, independent of the presence of the target gas. All particles are assumed to be the same size. Such a chaotically arranged structure will allow current to flow through a path of lower resistance contact, such as homo-contacts. Hetero-contacts will not act as the main electron transport pathway [57]. Therefore, simply mixing two groups of semiconductors is not an appropriate structure design, as it contributes to its conductivity. Electrical measurements performed in this study revealed that the most noticeable change in the response of TCOx sensors compared to pure CeO2 is precisely the lower value of electrical resistance for each oxygen concentration. TiO2 is excluded from the discussion due to its unreliable response to oxygen.
Since the particle size distribution obtained by high-energy ball milling is wide (Figure 2a–e), the approximation of grains of the same size is not well-founded for this study. The contribution of hetero-contact between grains of different sizes cannot be neglected. XRD analysis of the powders showed a significant amount of the rutile phase induced by mechanochemical forces (Table 4). Hence, better O2 adsorption and its more efficient reduction to the rutile phase then to the anatase should also be taken into account [62]. Increasing the amount of rutile in the mixture can improve the sensitivity of the sensor. The coexistence of the three phases, anatase, rutile, and CeO2, and their interactions, determine the structure of TiO2-CeO2 in a complex and uncertain way, which makes it demanding to establish a specific relation that would describe the influence of milling parameters on sensing properties of the TCOx sensor.
Like it was already mentioned, receptor function is concerned with the surface structure of the sensing material. Based on the AFM imaging results of the film surface, the receptor function of TCOx sensors does not appear to alter much (Table 5). A significantly higher parameter of roughness for the mixture TiCe-0.8:0.2-40 deviates from the others, which are more or less similar. With an increase in the milling time during the synthesis of TiCe-0.8:0.2-40 powder, the surface area of the film became significantly smoother. Most interestingly, the film with the smallest surface roughness was the one made from mixtures with a ratio of TiO2:CeO2 = 0.5:0.5. Just such a mixture milled for 100 min showed the highest sensitivity to oxygen among the tested mixtures.

5. Conclusions

The purpose of this study was to show that the mechanochemical process can be used to create a TiO2-CeO2 powder mixture suitable for oxygen sensors. The mechanochemical synthesis in conjunction with screen printing was successful, generally indicating the potential application of this route for the fabrication of sensors for a variety of purposes. The procedure in a high-energy planetary ball mill corresponds to the green chemistry trend of avoiding or minimizing the use of solvents, increasing selectivity toward the synthesis of a specific product, and reducing the number of synthesis steps.
The research presented in this paper also shows that there is plenty of room for improvement in both the powder synthesis procedure and the procedure for producing screen printing paste with improved adhesion properties. The synthesis conditions did not provide the ideal structure of the sensing material, as demonstrated in the paper. Thin films of TiO2-CeO2 are mechanical mixtures with randomly distributed homo- and hetero-contacts. Nonetheless, electrical measurements show that the mechanochemically treated TiO2-CeO2 mixed oxides have promising properties for oxygen sensing at lower working temperatures than the metal oxide-based sensor. The mixture of TiO2-CeO2 in the ratio 0.2:0.8, ground for 100 min, has the lowest absolute resistance, which is advantageous in terms of electrical measurement simplicity. This study also reveals that TiO2 films have poor adhesion to an alumina substrate and an erratic response to oxygen levels. With the addition of CeO2, adhesion and oxygen responsiveness improve significantly. The study of the electronic structure of the mixtures will be one of the primary focal points of future research. We anticipate that this will help to provide a more accurate description of the sensing mechanism of TCOx sensors. Work will also be carried out on the improvement of the paste screen printing process and the optimization of mechanochemical synthesis parameters.

Supplementary Materials

The following supporting information can be downloaded at: https://www.mdpi.com/article/10.3390/s23031313/s1, Figure S1: SEM image of the TiCe-0.8:0.2-40 sample at the center of the paste region; Figure S2: SEM image of the TiCe-0.2:0.8-40 sample at the center of the paste region; Figure S3: SEM image of the TiCe-0.8:0.2-100 sample at the center of the paste region; Figure S4: SEM image of the TiCe-0.2:0.8-100 sample at the center of the paste region; Figure S5: SEM image of the TiCe-0.5:0.5-100 sample at the center of the paste region.

Author Contributions

Conceptualization: J.N.S., D.V.R. and M.S.; Methodology: J.N.S., M.S. and D.V.R.; Validation: M.S.; Formal Analysis: J.N.S., S.P.P. and D.V.R.; Investigation: J.N.S., S.P.P. and K.C.; Resources: S.P.P., N.B.T., A.G.S. and K.C.; Data curation: J.N.S. and M.S.; Writing—original draft preparation: J.N.S. and M.S.; Writing—Review and Editing: S.P.P., K.C. and A.G.S.; Visualization: J.N.S. and M.S.; Supervision: M.S.; Project administration: D.V.R. and M.S. All authors have read and agreed to the published version of the manuscript.

Funding

This research was funded by the Ministry of Education, Science and Technological Development of the Republic of Serbia (grant number 451-03-68/2022-14/200026 and 451-03-68/2022-14/200162) and Portuguese Science Foundation, Fundação para a Ciência e Tecnologia, the funding of the project UIDB/00068/2020.

Institutional Review Board Statement

Not applicable.

Informed Consent Statement

Not applicable.

Data Availability Statement

Data available upon request.

Acknowledgments

The authors acknowledge the scientific assistance of Smilja Marković (Particle size analysis), Daniela Nunez Gomez (SEM images acquisition) and Danica Bajuk-Bogdanović (Raman spectra acquisition). The authors would like to thank EMERGE project, European Union’s Horizon 2020 research and innovation programme, grant agreement number 101008701, and the Warsaw University of Technology, CEZAMAT Institute, Warsaw, Poland, for their help in providing instrumentation for profilometry measurement. The mass flow controllers (MFCs) used in the experiments were obtained through funding provided by the Science Fund of the Republic of Serbia, grant number 6057070, Gramulsen project. The authors would like to thank Biljana Šljukić Paunković, Faculty of Physical Chemistry, University of Belgrade, for her helpful advice on the theoretical issues examined in this paper.

Conflicts of Interest

The authors declare no conflict of interest.

References

  1. Sekereci, Y.; Petrovskii, S. Global Warming Can Lead to Depletion of Oxygen by Disrupting Phytoplankton Photosynthesis: A Mathematical Modelling Approach. Geosciences 2018, 8, 201. [Google Scholar] [CrossRef] [Green Version]
  2. Saruhan, B.; Fomekong, R.L.; Nahirniak, S. Review: Influences of Semiconductor Metal Oxide Properties on Gas Sensing Characteristics. Front. Sens. 2021, 2, 657391. [Google Scholar] [CrossRef]
  3. Manandhar, S.; Battu, A.K.; Deveraj, A.; Shuttanandan, V.; Thevuthasan, S.; Ramana, C.V. Rapid Response High Temperature Oxygen Sensor Based on Titanium Doped Gallium Oxide. Sci. Rep. 2020, 10, 178. [Google Scholar] [CrossRef] [PubMed] [Green Version]
  4. Liu, Y.; Parisi, J.; Sun, X.; Lei, Y. Solid-state gas sensors for high temperature applications-A Review. J. Mater. Chem. A 2014, 2, 9919–9943. [Google Scholar] [CrossRef]
  5. Wang, X.; Wolfbeis, O.S. Optical methods for sensing and imaging oxygen: Materials, spectroscopies and applications. Chem. Soc. Rev. 2014, 43, 3666–3761. [Google Scholar] [CrossRef] [Green Version]
  6. Dey, A. Semiconductor metal oxide gas sensors: A review. Mater. Sci. Eng. B 2018, 229, 206–217. [Google Scholar] [CrossRef]
  7. Santonico, M.; Zompanti, A.; Sabatini, A.; Vollero, L.; Grasso, S.; Mezza, C.D.; Pennazza, G. CO2 and O2 Detection by Electric Field Sensors. Sensors 2020, 20, 668. [Google Scholar] [CrossRef] [PubMed] [Green Version]
  8. Barsan, N.; Koziej, D.; Weimar, U. Metal oxide-based gas sensor research: How to? Sens. Actuators B Chem. 2007, 121, 18–35. [Google Scholar] [CrossRef]
  9. Raghu, A.V.; Karuppana, K.K.; Pullithadathi, B. Highly Sensitive, Temperature-Independent Oxygen Gas Sensor Based on Anatase TiO2 Nanoparticle Grafted, 2D Mixed Valent VOx Nanoflakelets. ACS Sens. 2018, 3, 1811–1821. [Google Scholar] [CrossRef]
  10. Mele, G.; Sole, R.D.; Lü, X. 18-Applications of TiO2 in sensor devices. In Titanium Dioxide (TiO2) and Its Applications, 1st ed.; Korotcenkov, G., Parrino, F., Palmisano, L., Eds.; Elsevier: Amsterdam, The Netherlands, 2020; pp. 527–572. [Google Scholar]
  11. Aneggi, E.; Leitenburg, C.D.; Boaro, M.; Fornasiero, P.; Trovarelli, A. 3-Catalytic Application of cerium dioxide. In Cerium Oxide (CeO2): Synthesis, Properties and Applications, 1st ed.; Korotcenkov, G., Scirè, S., Palmisano, L., Eds.; Elsevier: Amsterdam, The Netherlands, 2019; pp. 45–108. [Google Scholar]
  12. Diebold, U. The surface science of titanium dioxide. Surf. Sci. Rep. 2003, 48, 53–229. [Google Scholar] [CrossRef]
  13. Gao, X.; Zhang, T. An overview: Facet-dependent metal oxide semiconductor gas sensors. Sens. Actuators B Chem. 2018, 277, 604–633. [Google Scholar] [CrossRef]
  14. Al-Hashem, M.; Akbar, S.; Morris, P. Role of Oxygen Vacancies in Nanostructured Metal-Oxide Gas Sensors: A Review. Sens. Actuators B Chem. 2019, 301, 126845. [Google Scholar] [CrossRef]
  15. Zheng, L.; Xu, T.; Li, G.; Ying, Q. Influence of Thickness on Oxygen-Sensing Properties of TiO2 Thin Films on Al2O3. Jpn. J. Appl. Phys. 2002, 41, 4655–4658. [Google Scholar] [CrossRef]
  16. Jasinski, P.; Suzuki, T.; Anderson, H.U. Nanocrystalline undoped ceria oxygen sensor. Sens. Actuators B Chem. 2003, 95, 73–77. [Google Scholar] [CrossRef]
  17. Rotchschlid, A.; Edelman, F.; Komem, Y.; Cosandey, F. Sensing behavior of TiO2 thin films exposed to air at low temperatures. Sens. Actuators B Chem. 2000, 67, 282–289. [Google Scholar] [CrossRef]
  18. Yang, S.; Lei, G.; Xu, H.; Lan, Z.; Wang, Z.; Gu, G. Metal Oxide Based Heterojunction for Gas Sensor: A review. Nanomaterials 2021, 11, 1026. [Google Scholar] [CrossRef]
  19. Watanabe, S.; Ma, X.; Song, C. Characterization of Structural and Surface Properties of Nanocrystalline TiO2-CeO2 Mixed Oxides by XRD, XPS, TPR, and TPD. J. Phys. Chem. C 2009, 113, 14249–14257. [Google Scholar] [CrossRef]
  20. Zeng, Y.; Haw, K.G.; Wang, Y.; Zhang, S.; Wang, Z.; Zhong, Q.; Kawi, S. Recent Progress of CeO2-TiO2 Based Catalysts for Selective Catalytic Reduction of NOx by NH3. ChemCatChem 2021, 13, 491–505. [Google Scholar] [CrossRef]
  21. Gionco, C.; Giamello, E.; Mino, L.; Paganini, M.C. The interaction of oxygen with the surface of CeO2–TiO2 mixed systems: An example of fully reversible surface-to-molecule electron transfer. Phys. Chem. Chem. Phys 2014, 16, 21438–21445. [Google Scholar] [CrossRef] [Green Version]
  22. Mohammadi, M.R.; Fray, D.J. Nanostructured TiO2–CeO2 mixed oxides by an aqueous sol–gel process: Effect of Ce:Ti molar ratio on physical and sensing properties. Sens. Actuators B Chem. 2010, 150, 631–640. [Google Scholar] [CrossRef]
  23. Trinchi, A.; Li, Y.X.; Wlodarski, W.; Kaciulis, S.; Pandolfi, L.; Viticoli, S.; Comini, E.; Sberveglieri, G. Investigation of sol–gel prepared CeO2–TiO2 thin films for oxygen gas sensing. Sens. Actuators B Chem. 2003, 95, 145–150. [Google Scholar] [CrossRef]
  24. Uzunglu, A.; Zhang, H.; Andreescu, S.; Stanciu, L.A. CeO2-MOx (M: Zr, Ti, Cu) mixed metal oxides with enhanced oxygen storage capacity. J. Mater. Sci. 2015, 50, 3750–3762. [Google Scholar] [CrossRef]
  25. Rožić, L.; Petrović, S.; Lončarević, D.; Grbić, B.; Radić, N.; Stojadinović, S.; Jović, V.; Lamovec, J. Influence of annealing temperature on structural, optical and photocatalytic properties of TiO2-CeO2 nanopowders. Ceram. Int. 2019, 45, 2361–2367. [Google Scholar] [CrossRef]
  26. Petrović, S.; Rožić, L.; Jović, V.; Stojadinović, S.; Grbić, B.; Radić, N.; Lamovec, J.; Vasilic, R. Optimization of a nanoparticle ball milling process parameters using the response surface method. Adv. Powder Technol. 2018, 29, 2129–2139. [Google Scholar] [CrossRef]
  27. Petrović, S.; Rožić, L.; Grbić, B.; Radić, N.; Stefanov, P.; Stojadinović, S.; Jović, V.; Lamovec, J. Effect of high energy ball milling on the physicochemical properties of TiO2-CeO2 mixed oxide and its photocatalytic behavior in the oxidation reaction. Reac. Kinet. Mech. Catal. 2019, 127, 175–186. [Google Scholar] [CrossRef]
  28. Furlani, E.; Aneggi, E.; Leitenburg, C.D.; Maschio, S. High energy ball milling of titania and titania–ceria powder mixtures. Powder Technol. 2014, 254, 591–596. [Google Scholar] [CrossRef]
  29. Leonardi, M.; Villacampa, M.; Menendez, M. Multicomponent mechanochemical synthesis. Chem. Sci. 2018, 9, 2042–2064. [Google Scholar] [CrossRef] [Green Version]
  30. James, S.L.; Adams, C.J.; Bolm, C.; Braga, D.; Collier, P.; Friščič, T.; Grepioni, F.; Harris, K.D.M.; Hyett, G.; Jones, W.; et al. Mechanochemistry: Opportunities for new and cleaner synthesis. Chem. Soc. Rev. 2012, 41, 413–447. [Google Scholar] [CrossRef] [Green Version]
  31. Amrute, A.P.; Bellis, J.D.; Felderhoff, M.; Schüth, F. Mechanochemical Synthesis of Catalytic Materials. Chem. Eur. J. 2021, 27, 6819–6847. [Google Scholar] [CrossRef]
  32. Szczesniak, B.; Choma, J.; Jaroniec, M. Recent advances in mechanochemical synthesis of mesoporous metal oxides. Mater. Adv. 2021, 2, 2510–2523. [Google Scholar] [CrossRef]
  33. Kumar, M.; Xiong, X.; Wan, Z.; Sun, Y.; Tsang, D.C.W.; Gupta, J.; Gao, B.; Cao, X.; Tang, J.; Ok, Y.S. Ball milling as a mechanochemical technology for fabrication of novel biochar nanomaterials. Bioresour. Technol. 2020, 312, 123613. [Google Scholar] [CrossRef]
  34. Balanč, B.; Trifković, K.; Đorđević, V.; Marković, S.; Pjanović, R.; Nedović, V.; Bugarski, B. Novel resveratrol delivery systems based on alginate-sucrose and alginate-chitosan microbeads containing liposomes. Food Hydrocoll. 2016, 61, 832–842. [Google Scholar] [CrossRef]
  35. Yuesong, S.; Dahai, Z.; Bo, Y.; Songbo, N.; Shemin, Z. Synergetic catalyst of ceria and titania for selective reduction of NO. J. Rare Earths 2012, 30, 431–436. [Google Scholar] [CrossRef]
  36. Reddy, B.M.; Khan, A.; Yamada, Y.; Kobayashi, T.; Loridant, S.; Volta, J.C. Structual chararacterization of Structural Characterization of CeO2−MO2 (M = Si4+, Ti4+, and Zr4+) Mixed Oxides by Raman Spectroscopy, X-ray Photoelectron Spectroscopy, and Other Techniques. J. Phys. Chem. B 2003, 107, 11475–11484. [Google Scholar] [CrossRef]
  37. Matějová, L.; Valeš, V.; Fajgar, R.; Matěj, Z.; Holỳ, V.; Šolcová, O. Reverse micelles directed synthesis of TiO2–CeO2 mixed oxides and investigation of their crystal structure and morphology. J. Solid State Chem. 2013, 198, 485–495. [Google Scholar] [CrossRef]
  38. Torres-Romero, A.; Cajero-Juárez, M.; Nuñez-Anita, R.E.; Contreras-García, M.E. Ceria-Doped Titania Nanoparticles as Drug Delivery System. J. Nanosci. Nanotechnol. 2020, 20, 3971–3980. [Google Scholar] [CrossRef]
  39. Dolabella, S.; Borzì, A.; Dommann, A.; Neels, A. Lattice Strain and Defects Analysis in Nanostructured Semiconductor Materials and Devices by High-Resolution X-Ray Diffraction: Theoretical and Practical Aspects. Small Methods 2022, 6, 2100932. [Google Scholar] [CrossRef]
  40. Bindu, P.; Thomas, S. Estimation of lattice strain in ZnO nanoparticles: X-ray peak profile analysis. J. Theor. Appl. Phys. 2014, 8, 123–134. [Google Scholar] [CrossRef] [Green Version]
  41. Venkateswalru, K.; Bose, A.C.; Rameshbabu, N. X-ray peak broadening studies of nanocrystalline hydroxyapatite by Williamson–Hall analysis. Phys. B Condens. 2010, 405, 4256–4261. [Google Scholar] [CrossRef]
  42. Askeland, D.R. Strain Hardening and Annealing. In The Science and Engineering of Materials; Springer: Berlin/Heidelberg, Germany, 1996; pp. 188–215. [Google Scholar] [CrossRef]
  43. Giannakoudakis, D.A.; Chatel, G.; Colmenares, J.C. Mechanochemical Forces as a Synthetic Tool for Zero- and One-Dimensional Titanium Oxide-Based Nano-photocatalysts. Top. Curr. Chem. 2020, 378, 2. [Google Scholar] [CrossRef] [Green Version]
  44. Ito, S.; Chen, P.; Comte, P.; Nazeeruddin, M.K.; Liska, P.; Péchy, P.; Grätzel, M. Fabrication of Screen -Printing Pastes from TiO2 powders for Dye-Sensitised Solar Cells. Prog. Photovol. Res. Appl. 2007, 15, 603–612. [Google Scholar] [CrossRef]
  45. Gonzalez-Gutierrez, J.; Cano, S.; Schuschnigg, S.; Kukla, C.; Sapkota, J.; Holzer, C. Additive Manufacturing of Metallic and Ceramic Components by the Material Extrusion of Highly-Filled Polymers: A Review and Future Perspectives. Materials 2018, 11, 840. [Google Scholar] [CrossRef] [PubMed] [Green Version]
  46. Horcas, I.; Fernández, R.; Gómez-Rodríguez, J.M.; Colchero, J.; Gómez-Herrero, J.; Baró, A.M. WSXM: A software for scanning probe microscopy and a tool for nanotechnology. Rev. Sci. Instrum. 2007, 78, 013705. [Google Scholar] [CrossRef] [PubMed] [Green Version]
  47. Siuzdak, K.; Sawczak, M.; Klein, M.; Nowaczyk, G.; Jurgac, S.; Ceniana, A. Preparation of platinum modified titanium dioxide nanoparticles with the use of laser ablation in water. Phys. Chem. Chem. Phys. 2014, 16, 15199–15206. [Google Scholar] [CrossRef] [PubMed]
  48. Hanaor, D.; Sorrell, C.C. Review of the anatase to rutile phase transformation. J. Mater. Sci. 2011, 46, 855–874. [Google Scholar] [CrossRef] [Green Version]
  49. Byrne, C.; Fagan, R.; Hinder, S.; McCormack, D.E.; Pillai, S.C. New approach of modifying the anatase to rutile transition temperature in TiO2 photocatalysts. RSC Adv. 2016, 6, 95232–95238. [Google Scholar] [CrossRef]
  50. Hardcastle, F.; Ishihara, H.; Sharma, R.; Boris, A.S. Photoelectroactivity and Raman spectroscopy of anodized titania (TiO2) photoactive water-splitting catalysts as a function of oxygen-annealing temperature. J. Mater. Chem. 2011, 21, 6337–6345. [Google Scholar] [CrossRef]
  51. Suzana, M.; Francisco, P.; Mastelaro, V.R. Inhibition of the Anatase−Rutile Phase Transformation with Addition of CeO2 to CuO−TiO2 System:  Raman Spectroscopy, X-ray Diffraction, and Textural Studies. Chem. Mater. 2002, 14, 2514–2518. [Google Scholar] [CrossRef]
  52. Fiorenza, R.; Bellardita, M.; D’Urso, L.; Compagnini, G.; Palmisano, L.; Scirè, S. Au/TiO2-CeO2 Catalysts for Photocatalytic Water Splitting and VOCs Oxidation Reactions. Catalyst 2016, 6, 121. [Google Scholar] [CrossRef]
  53. De Castro Silva, I.; Reinaldo, A.C.; Sigoli, F.A.; Mazali, I.O. Reversible Oxygen Vacancies Generation on Pure CeO2 Nanorods Evaluated by in Situ Raman Spectroscopy. J. Phys. Chem. C 2017, 121, 12928–12935. [Google Scholar] [CrossRef]
  54. Zhang, J.; Qin, Z.; Zeng, D.; Xie, C. Metal-oxide-semiconductor based gas sensors: Screening, preparation, and integration. Phys. Chem. Chem. Phys. 2017, 19, 6313–6329. [Google Scholar] [CrossRef] [PubMed]
  55. Korotcenkov, G.; Cho, B.K. Metal oxide composites in conductometric gas sensors: Achievements and challenges. Sens. Actuators B Chem. 2017, 244, 182–210. [Google Scholar] [CrossRef]
  56. Wang, C.; Yin, L.; Zhang, L.; Xiang, D.; Gao, R. Metal Oxide Gas Sensors: Sensitivity and Influencing Factors. Sensors 2010, 10, 2088–2106. [Google Scholar] [CrossRef] [PubMed] [Green Version]
  57. Yamazoe, N.; Shimanoe, K. Proposal of contact potential promoted oxide semiconductor gas sensor. Sens. Actuators B Chem. 2013, 187, 162–167. [Google Scholar] [CrossRef]
  58. Mirabella, D.A.; Buono, C.; Aldao, C.M.; Resasco, D.E. Chemisorption and sensitivity at semiconductor sensors revisited. Sens. Actuators B Chem. 2019, 285, 232–239. [Google Scholar] [CrossRef]
  59. Johnston-Peck, A.C.; Senanayake, S.D.; Plata, J.J.; Kundu, S.; Xu, W.; Barrio, L.; Graciani, J.; Sanz, J.F.; Navarro, R.M.; Fierro, J.L.G.; et al. Nature of the Mixed-Oxide Interface in Ceria−Titania Catalysts: Clusters, Chains, and Nanoparticles. J. Phys. Chem. C 2013, 117, 14463–14471. [Google Scholar] [CrossRef]
  60. Luo, S.; Nguyen-Phan, T.D.; Johnston-Peck, A.C.; Barrio, L.; Sallis, S.; Arena, D.A.; Kundu, S.; Xu, W.; Piper, L.F.J.; Stach, E.A.; et al. Hierarchical Heterogeneity at the CeOx-TiO2 Interface: Electronic and Geometric Structural Influence on the Photocatalytic Activity of Oxideon Oxide Nanostructures. J. Phys. Chem. C 2015, 119, 2669–2679. [Google Scholar] [CrossRef]
  61. Yamazoe, N.; Shimanoe, K. Basic approach to the transducer function of oxide semiconductor gas sensors. Sens. Actuators B Chem. 2011, 160, 1352–1362. [Google Scholar] [CrossRef]
  62. Buchalska, M.; Kobielusz, M.; Matuszek, A.; Pacia, M.; Wojtyla, S.; Macyk, W. On Oxygen Activation at Rutile- and Anatase-TiO2. ACS Catal. 2015, 5, 7424–7431. [Google Scholar] [CrossRef]
Figure 1. Schematic illustration of the mechanochemical procedure. Also shown are the processes that occur during high ball milling inside the jar: collision, impact, shear, and friction.
Sensors 23 01313 g001
Figure 2. Volume-based particle size distribution and cumulative frequency of: (a) TiO2; (b) CeO2; (ce) mixed oxide powders.
Sensors 23 01313 g002
Figure 3. XRD patterns of starting oxides and mixtures of the following composition: (a) TiO2:CeO2 = 0.8:0.2; (b) TiO2:CeO2 = 0.2:0.8; (c) TiO2:CeO2 = 0.5:0.5; a—anatase, r—rutile, c—ceria fluorite structure.
Sensors 23 01313 g003
Figure 4. Schematic illustration of paste preparation and sensor fabrication.
Sensors 23 01313 g004
Figure 5. Optical microscopy of the sensor based on the TiCe-0.8:0.2-40 mixture.
Sensors 23 01313 g005
Figure 6. Peeling off of the TiO2 layer from the substrate edges.
Sensors 23 01313 g006
Figure 7. SEM image of the TiCe-0.5:0.5-40 sample at the center of the paste region.
Sensors 23 01313 g007
Figure 8. The EDS analysis of the TiCe-0.5:0.5-40 sample.
Sensors 23 01313 g008
Figure 9. 2D AFM images of: (a) TiCe-0.8:0.2-40; (b) TiCe-0.2:0.8-40; (c) TiCe-0.5:0.5-40; (d) TiCe-0.8:0.2-100; (e) TiCe-0.2:0.8-100; (f) TiCe-0.5:0.5-100.
Sensors 23 01313 g009
Figure 10. Thickness measurement of the TiCe-0.5:0.5-40 film on the substrate.
Sensors 23 01313 g010
Figure 11. Raman spectrum of: (a) TiCe-0.8:0.2-40 and TiCe-0.8:0.2-100; (b) TiCe-0.2:0.8-40 and TiCe-0.2:0.8-100; (c) TiCe-0.5:0.5-40 TiCe-0.5:0.5-100; the anatase and rutile bands are marked with “a“ and “r“, respectively. The spectra of mixtures of the same composition are arranged in the same graph.
Sensors 23 01313 g011
Figure 12. Scheme of the electrical measurements set-up.
Sensors 23 01313 g012
Figure 13. Dependence of the DC resistance of the TCOx sensor on temperature at 30% O2 volumetric concentration for the TiCe-0.5:0.5-40 sample.
Sensors 23 01313 g013
Figure 14. An example of the time monitoring of the resistance at different volumetric concentrations of O2 for the TiCe-0.8:0.2-100 mixture (this sample is not shown in the Figure 15).
Sensors 23 01313 g014
Figure 15. Measurements of the resistance of the mixed and pure oxides at different volumetric concentrations of O2 at a temperature of 320 °C.
Sensors 23 01313 g015
Figure 16. Obtained values for sensitivity of: (a) mixtures with ratio TiO2:CeO2 =0.8:0.2; (b) mixtures with ratio TiO2:CeO2 = 0.2:0.8; (c) mixtures with ratio TiO2:CeO2 = 0.5:0.5; (d) CeO2.
Sensors 23 01313 g016aSensors 23 01313 g016b
Figure 17. The illustration on the left is the receptor function of the semiconductor; right is the transducer function, band bending, and Schottky barrier between the same adjacent grains.
Sensors 23 01313 g017
Table 1. Labelling of the samples after mechanochemical treatment.
SampleMass Ratio (TiO2:CeO2)Milling Time
TiCe-0.8:0.2-400.8:0.240 min
TiCe-0.2:0.8-400.2:0.840 min
TiCe-0.5:0.5-400.5:0.540 min
TiCe-0.8:0.2-1000.8:0.2100 min
TiCe-0.2:0.8-1000.2:0.8100 min
TiCe-0.5:0.5-1000.5:0.5100 min
Table 2. The particle size values at 10%, 50%, and 90% of the cumulative frequency and span values.
Sampled10 [µm]d50 [µm]d90 [µm]Span
TiO21.253.7010.612.532
CeO23.8022.5855.812.303
TiCe-0.8:0.2-400.967.8833.794.166
TiCe-0.2:0.8-400.526.7229.274.282
TiCe-0.5:0.5-400.748.0839.94.845
TiCe-0.8:0.2-1000.807.9729.563.609
TiCe-0.2:0.8-1000.525.0118.663.618
TiCe-0.5:0.5-1000.555.5020.543.635
Table 3. The crystallite size of anatase, rutile, and ceria in mixtures and pure oxides.
SampleAnatase (nm)Rutile (nm)Ceria (nm)
TiCe-0.8:0.2-4020.6527.3846.04
TiCe-0.2:0.8-4012.97-33.32
TiCe-0.5:0.5-4017.8733.1941.98
TiCe-0.8:0.2-10018.9830.4039.28
TiCe-0.2:0.8-100--24.97
TiCe-0.5:0.5-10015.9326.8631.25
TiO221.4831.52-
CeO2--49.50
Table 4. The weight fraction of rutile in the mixtures and starting TiO2.
SampleRutile Weight Fraction
TiCe-0.8:0.2-400.27
TiCe-0.2:0.8-40-
TiCe-0.5:0.5-400.36
TiCe-0.8-0.2-1000.35
TiCe-0.2:0.8-100-
TiCe-0.5:0.5-1000.40
TiO20.19
Table 5. Roughness parameters estimated from AFM measurements.
SampleRa (nm)Rq (nm)
TiCe-0.8:0.2-40420560
TiCe-0.2:0.8-40180220
TiCe-0.5:0.5-40130170
TiCe-0.8:0.2-100190230
TiCe-0.2:0.8-100170210
TiCe-0.5:0.5-100120140
Disclaimer/Publisher’s Note: The statements, opinions and data contained in all publications are solely those of the individual author(s) and contributor(s) and not of MDPI and/or the editor(s). MDPI and/or the editor(s) disclaim responsibility for any injury to people or property resulting from any ideas, methods, instructions or products referred to in the content.

