


Validity of AI-Based Gait Analysis for Simultaneous Measurement of Bilateral Lower Limb Kinematics Using a Single Video Camera

 , , , ,
Abstract
:1. Introduction
2. Materials and Methods
2.1. Participants
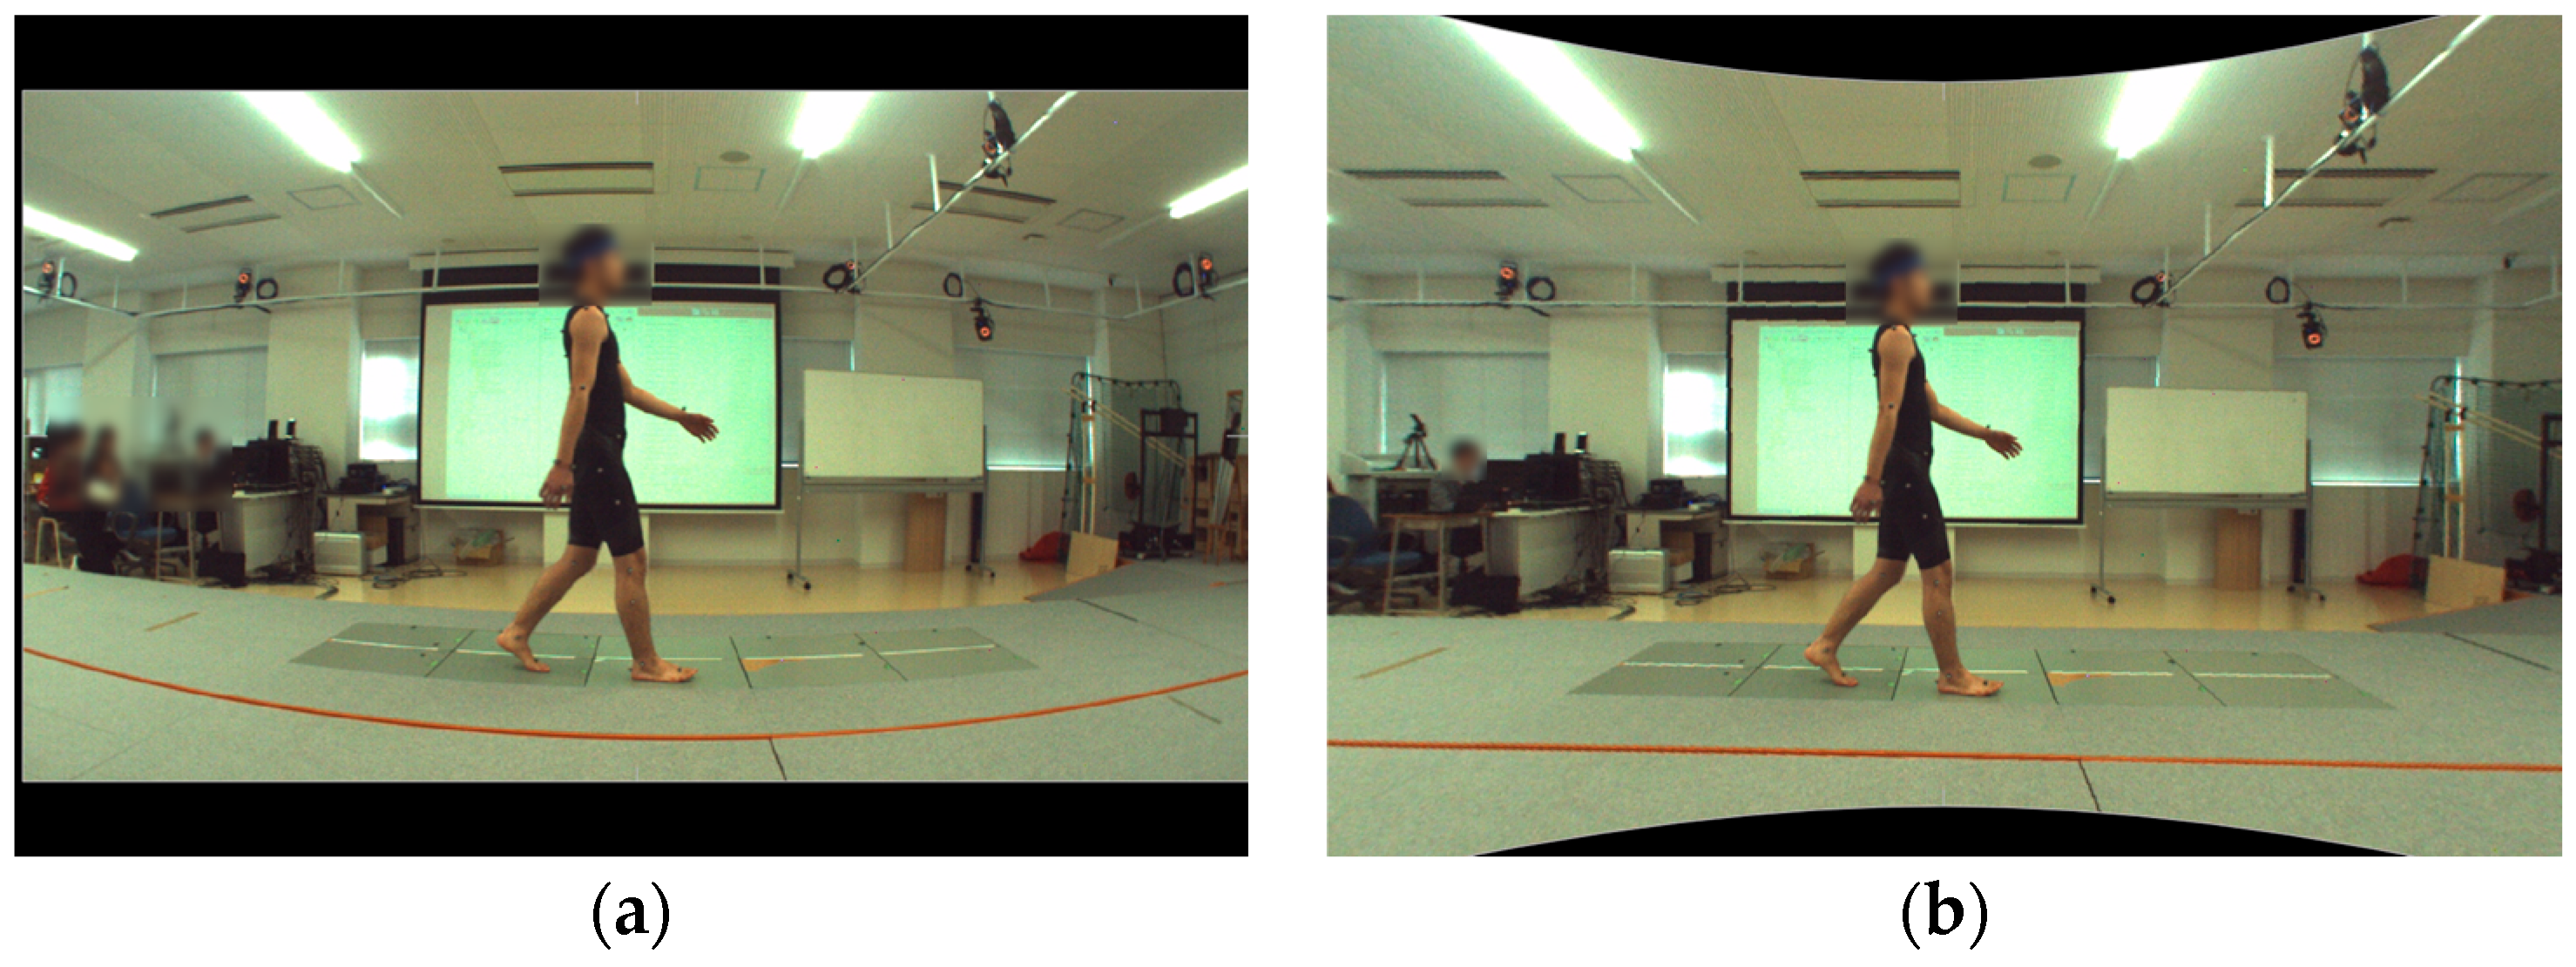
2.2. Gait Task
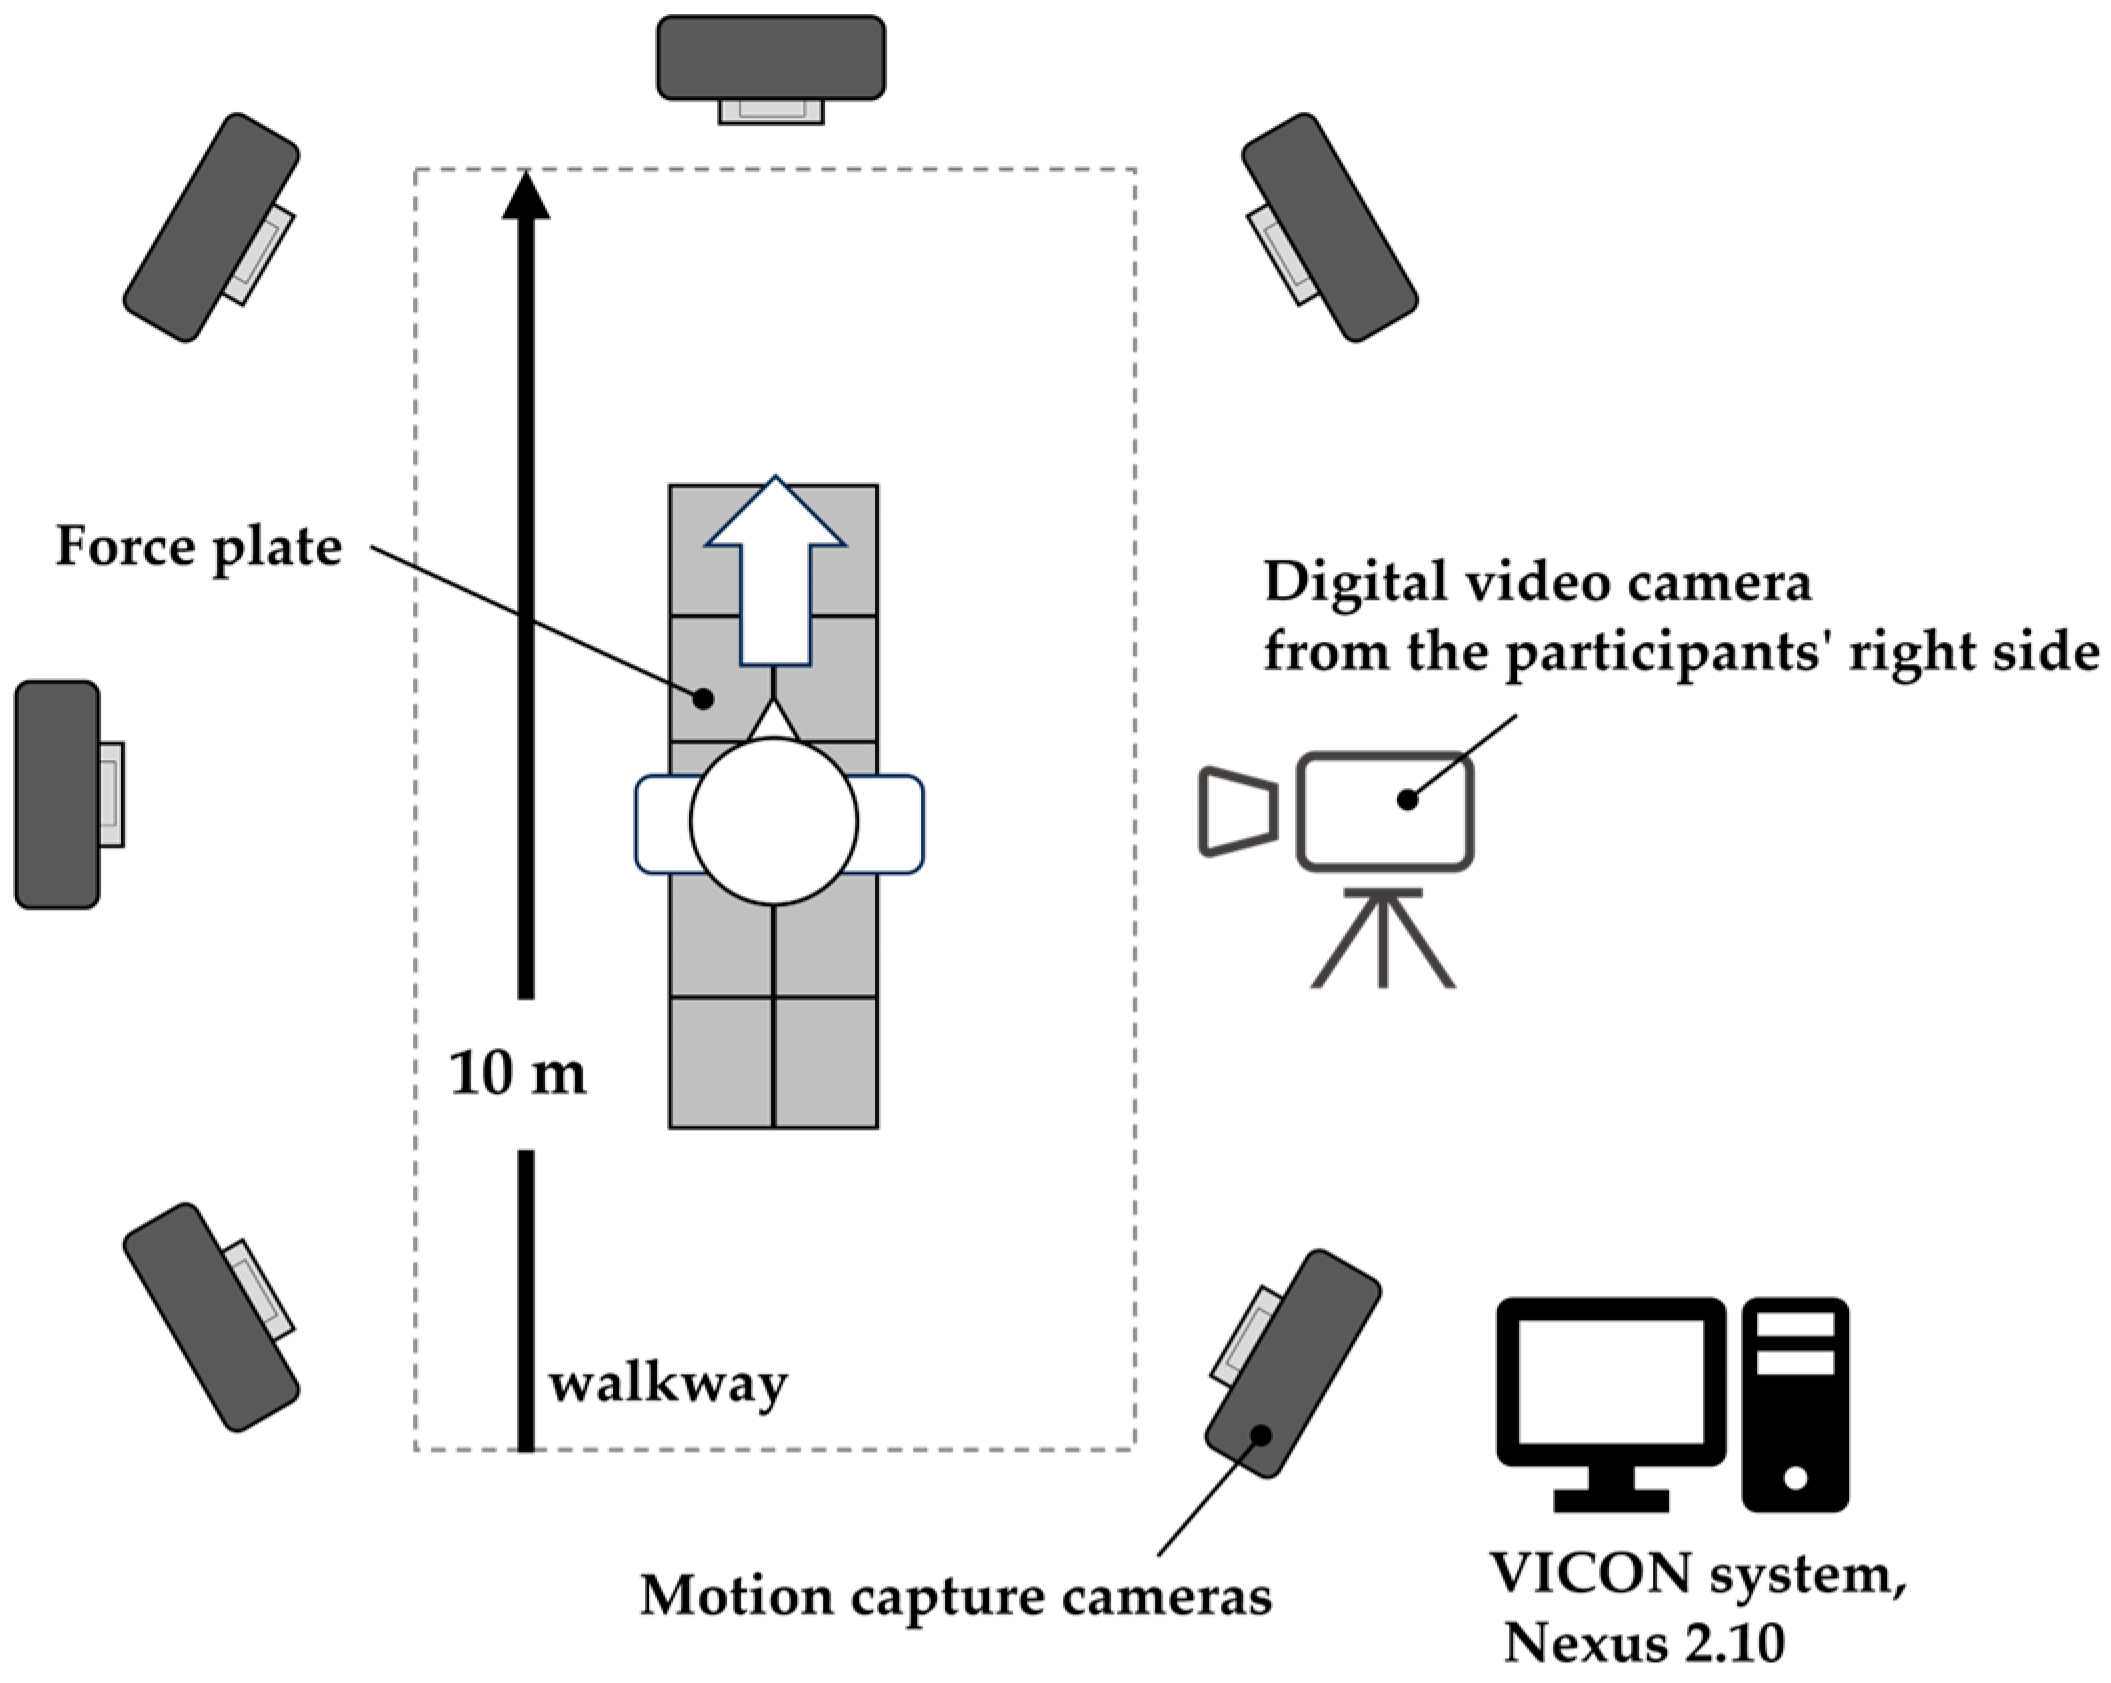
2.3. Measurement System and Equipment
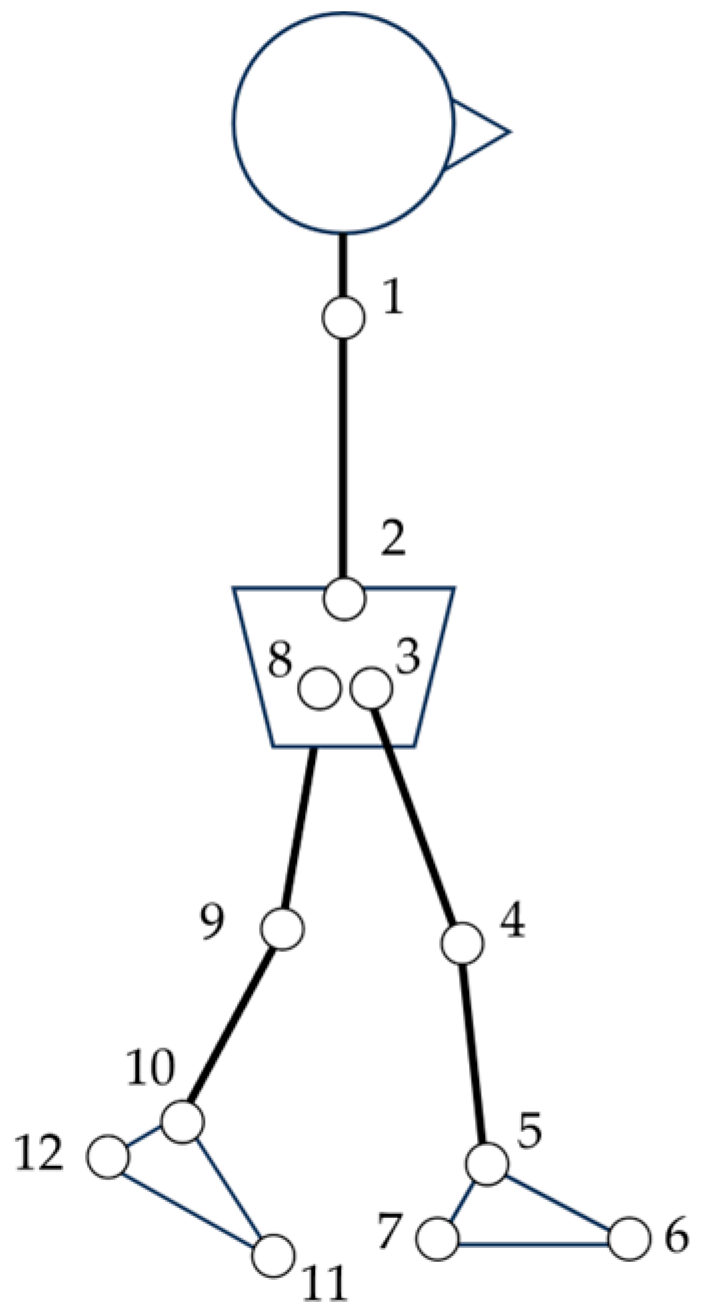
2.4. Data Processing
2.5. Data Analysis and Statistics
3. Results
4. Discussion
- It eliminates human work in extracting lower limb kinematics from two-dimensional videos.
- It avoids bias and human error in joint position identification.
- Compared to 3D-MA, it offers a vastly broader adaptability in terms of measurement space and environment.
- It is significantly more cost-effective than 3D-MA.
5. Conclusions
Author Contributions
Funding
Institutional Review Board Statement
Informed Consent Statement
Data Availability Statement
Acknowledgments
Conflicts of Interest
References
- Cao, Z.; Hidalgo, G.; Simon, T.; Wei, S.E.; Sheikh, Y. OpenPose: Realtime Multi-Person 2D Pose Estimation Using Part Affinity Fields. IEEE Trans. Pattern Anal. Mach. Intell. 2021, 43, 172–186. [Google Scholar] [CrossRef] [PubMed]
- Li, B.; Williamson, J.; Kelp, N.; Dick, T.; Bo, A.P.L. Towards balance assessment using Openpose. Annu. Int. Conf. IEEE Eng. Med. Biol. Soc. 2021, 2021, 7605–7608. [Google Scholar] [PubMed]
- Sato, K.; Nagashima, Y.; Mano, T.; Iwata, A.; Toda, T. Quantifying normal and parkinsonian gait features from home movies: Practical application of a deep learning-based 2D pose estimator. PLoS ONE 2019, 14, e0223549. [Google Scholar] [CrossRef]
- Bao, W.; Niu, T.; Wang, N.; Yang, X. Pose estimation and motion analysis of ski jumpers based on ECA-HRNet. Sci. Rep. 2023, 13, 6132. [Google Scholar] [CrossRef] [PubMed]
- Haberkamp, L.D.; Garcia, M.C.; Bazett-Jones, D.M. Validity of an artificial intelligence, human pose estimation model for measuring single-leg squat kinematics. J. Biomech. 2022, 144, 111333. [Google Scholar] [CrossRef] [PubMed]
- Menychtas, D.; Petrou, N.; Kansizoglou, I.; Giannakou, E.; Grekidis, A.; Gasteratos, A.; Gourgoulis, V.; Douda, E.; Smilios, I.; Michalopoulou, M.; et al. Gait analysis comparison between manual marking, 2D pose estimation algorithms, and 3D marker-based system. Front. Rehabil. Sci. 2023, 4, 1238134. [Google Scholar] [CrossRef]
- Yamamoto, K.; Hasegawa, Y.; Suzuki, T.; Suzuki, H.; Tanabe, H.; Fujii, K. Extracting proficiency differences and individual characteristics in golfers’ swing using single-video markerless motion analysis. Front. Sports Act. Living 2023, 5, 1272038. [Google Scholar] [CrossRef]
- Wade, L.; Needham, L.; McGuigan, P.; Bilzon, J. Applications and limitations of current markerless motion capture methods for clinical gait biomechanics. PeerJ 2022, 10, e12995. [Google Scholar] [CrossRef]
- Lin, P.C.; Chen, Y.J.; Chen, W.S.; Lee, Y.J. Automatic real-time occupational posture evaluation and select corresponding ergonomic assessments. Sci. Rep. 2022, 12, 2139. [Google Scholar] [CrossRef]
- Moshayedi, A.J.; Uddin, N.M.I.; Khan, A.S.; Zhu, J.; Emadi Andani, M. Designing and Developing a Vision-Based System to Investigate the Emotional Effects of News on Short Sleep at Noon: An Experimental Case Study. Sensors 2023, 23, 8422. [Google Scholar] [CrossRef]
- Sabo, A.; Gorodetsky, C.; Fasano, A.; Iaboni, A.; Taati, B. Concurrent Validity of Zeno Instrumented Walkway and Video-Based Gait Features in Adults With Parkinson’s Disease. IEEE J. Transl. Eng. Health Med. 2022, 10, 2100511. [Google Scholar] [CrossRef] [PubMed]
- Holm, D.J.; Stålbom, M.; Keogh, J.W.; Cronin, J. Relationship between the kinetics and kinematics of a unilateral horizontal drop jump to sprint performance. J. Strength. Cond. Res. 2008, 22, 1589–1596. [Google Scholar] [CrossRef] [PubMed]
- Needham, L.; Evans, M.; Cosker, D.P.; Colyer, S.L. Can Markerless Pose Estimation Algorithms Estimate 3D Mass Centre Positions and Velocities during Linear Sprinting Activities? Sensors 2021, 21, 2889. [Google Scholar] [CrossRef]
- Zhang, H.; Yan, X.; Li, H. Ergonomic posture recognition using 3D view-invariant features from single ordinary camera. Autom. Constr. 2018, 94, 1–10. [Google Scholar] [CrossRef]
- Ota, M.; Tateuchi, H.; Hashiguchi, T.; Kato, T.; Ogino, Y.; Yamagata, M.; Ichihashi, N. Verification of reliability and validity of motion analysis systems during bilateral squat using human pose tracking algorithm. Gait Posture 2020, 80, 62–67. [Google Scholar] [CrossRef] [PubMed]
- D’Antonio, E.; Taborri, J.; Mileti, I.; Rossi, S.; Patané, F. Validation of a 3D Markerless System for Gait Analysis Based on OpenPose and Two RGB Webcams. IEEE Sens. J. 2021, 21, 17064–17075. [Google Scholar] [CrossRef]
- Liang, S.; Zhang, Y.; Diao, Y.; Li, G.; Zhao, G. The reliability and validity of gait analysis system using 3D markerless pose estimation algorithms. Front. Bioeng. Biotechnol. 2022, 10, 857975. [Google Scholar] [CrossRef]
- Zago, M.; Luzzago, M.; Marangoni, T.; De Cecco, M.; Tarabini, M.; Galli, M. 3D Tracking of Human Motion Using Visual Skeletonization and Stereoscopic Vision. Front. Bioeng. Biotechnol. 2020, 8, 181. [Google Scholar] [CrossRef]
- Ota, M.; Tateuchi, H.; Hashiguchi, T.; Ichihashi, N. Verification of validity of gait analysis systems during treadmill walking and running using human pose tracking algorithm. Gait Posture 2021, 85, 290–297. [Google Scholar] [CrossRef]
- Stenum, J.; Rossi, C.; Roemmich, R.T. Two-dimensional video-based analysis of human gait using pose estimation. PLoS Comput. Biol. 2021, 17, e1008935. [Google Scholar] [CrossRef]
- Viswakumar, A.; Rajagopalan, V.; Ray, T.; Gottipati, P.; Parimi, C. Development of a Robust, Simple, and Affordable Human Gait Analysis System Using Bottom-Up Pose Estimation with a Smartphone Camera. Front. Physiol. 2021, 12, 784865. [Google Scholar] [CrossRef] [PubMed]
- Yamamoto, M.; Shimatani, K.; Hasegawa, M.; Kurita, Y.; Ishige, Y.; Takemura, H. Accuracy of Temporo-Spatial and Lower Limb Joint Kinematics Parameters Using OpenPose for Various Gait Patterns With Orthosis. IEEE Trans. Neural Syst. Rehabil. Eng. 2021, 29, 2666–2675. [Google Scholar] [CrossRef] [PubMed]
- Faul, F.; Erdfelder, E.; Buchner, A.; Lang, A.G. Statistical power analyses using G*Power 3.1: Tests for correlation and regression analyses. Behav. Res. Methods 2009, 41, 1149–1160. [Google Scholar] [CrossRef] [PubMed]
- Faul, F.; Erdfelder, E.; Lang, A.G.; Buchner, A. G*Power 3: A flexible statistical power analysis program for the social, behavioral, and biomedical sciences. Behav. Res. Methods 2007, 39, 175–191. [Google Scholar] [CrossRef]
- Cao, Z.; Hidalgo Martinez, G.; Simon, T.; Wei, S.-E.; Sheikh, Y.A. OpenPose: Realtime Multi-Person 2D Pose Estimation using Part Affinity Fields. arXiv 2019, arXiv:1812.08008. [Google Scholar] [CrossRef]
- Plug-In Gait Reference Guide—Nexus Documentation, Vicon Documentation. Available online: https://docs.vicon.com/display/Nexus210/Plug-in+Gait+Reference+Guide (accessed on 11 December 2023).
- Fleiss, J.L. The Design and Analysis of Clinical Experiments; Wiley: New York, NY, USA, 1986. [Google Scholar]
- Bessone, V.; Hoschele, N.; Schwirtz, A.; Seiberl, W. Validation of a new inertial measurement unit system based on different dynamic movements for future in-field applications. Sports Biomech. 2022, 21, 685–700. [Google Scholar] [CrossRef]
- McGinley, J.L.; Baker, R.; Wolfe, R.; Morris, M.E. The reliability of three-dimensional kinematic gait measurements: A systematic review. Gait Posture 2009, 29, 360–369. [Google Scholar] [CrossRef]
- Ferrari, A.; Cutti, A.G.; Cappello, A. A new formulation of the coefficient of multiple correlation to assess the similarity of waveforms measured synchronously by different motion analysis protocols. Gait Posture 2010, 31, 540–542. [Google Scholar] [CrossRef]
- Ferrari, A.; Cutti, A.G.; Garofalo, P.; Raggi, M.; Heijboer, M.; Cappello, A.; Davalli, A. First in vivo assessment of “Outwalk”: A novel protocol for clinical gait analysis based on inertial and magnetic sensors. Med. Biol. Eng. Comput. 2010, 48, 1–15. [Google Scholar] [CrossRef]
- Ishida, T.; Samukawa, M. Validity and Reliability of a Wearable Goniometer Sensor Controlled by a Mobile Application for Measuring Knee Flexion/Extension Angle during the Gait Cycle. Sensors 2023, 23, 3266. [Google Scholar] [CrossRef]
- Rivera, B.; Cano, C.; Luis, I.; Elias, D.A. A 3D-Printed Knee Wearable Goniometer with a Mobile-App Interface for Measuring Range of Motion and Monitoring Activities. Sensors 2022, 22, 763. [Google Scholar] [CrossRef] [PubMed]
- Nuesch, C.; Roos, E.; Pagenstert, G.; Mundermann, A. Measuring joint kinematics of treadmill walking and running: Comparison between an inertial sensor based system and a camera-based system. J. Biomech. 2017, 57, 32–38. [Google Scholar] [CrossRef] [PubMed]
- Shuai, Z.; Dong, A.; Liu, H.; Cui, Y. Reliability and Validity of an Inertial Measurement System to Quantify Lower Extremity Joint Angle in Functional Movements. Sensors 2022, 22, 863. [Google Scholar] [CrossRef] [PubMed]
- Pourtabib, J.; Hull, M.L. Joint Coordinate System Using Functional Axes Achieves Clinically Meaningful Kinematics of the Tibiofemoral Joint as Compared to the International Society of Biomechanics Recommendation. J. Biomech. Eng. 2023, 145, 051005. [Google Scholar] [CrossRef]
- Nishizawa, A.; Katsuhira, J.; Watanabe, M.; Fujii, T.; Yoshimoto, T.; Oka, H.; Matsudaira, K. Relationship between the locomotive syndrome and kinetic and kinematic parameters during static standing and level walking. Gait Posture 2022, 93, 146–152. [Google Scholar] [CrossRef]
- Saito, Y.; Ishida, T.; Kataoka, Y.; Takeda, R.; Tadano, S.; Suzuki, T.; Nakamura, K.; Nakata, A.; Osuka, S.; Yamada, S.; et al. Evaluation of gait characteristics in subjects with locomotive syndrome using wearable gait sensors. BMC Musculoskelet. Disord. 2022, 23, 457. [Google Scholar] [CrossRef]
- Martini, E.; Boldo, M.; Aldegheri, S.; Vale, N.; Filippetti, M.; Smania, N.; Bertucco, M.; Picelli, A.; Bombieri, N. Enabling Gait Analysis in the Telemedicine Practice through Portable and Accurate 3D Human Pose Estimation. Comput. Methods Programs Biomed. 2022, 225, 107016. [Google Scholar] [CrossRef]


| Right (Camera Side) | Left (Opposite Camera Side) | |||
|---|---|---|---|---|
| AI-MA | 3D-MA | AI-MA | 3D-MA | |
| Ankle | ||||
| Peak dorsiflexion angle | 0.84 [0.66–0.93] | 0.95 [0.90–0.98] | 0.77 [0.53–0.90] | 0.98 [0.96–0.99] |
| Peak plantarflexion angle | 0.92 [0.84–0.97] | 0.93 [0.86–0.97] | 0.93 [0.86–0.97] | 0.97 [0.94–0.99] |
| Angular excursion | 0.93 [0.84–0.97] | 0.93 [0.86–0.97] | 0.86 [0.71–0.94] | 0.96 [0.91–0.98] |
| Knee | ||||
| Peak flexion angle of stance phase | 0.98 [0.97–0.99] | 0.99 [0.97–0.99] | 0.98 [0.95–0.99] | 0.99 [0.98–0.99] |
| Peak extension angle of stance phase | 0.96 [0.92–0.98] | 0.99 [0.97–0.99] | 0.96 [0.91–0.98] | 0.98 [0.97–0.99] |
| Angular excursion of stance phase | 0.81 [0.62–0.92] | 0.91 [0.81–0.96] | 0.81 [0.61–0.92] | 0.97 [0.93–0.99] |
| Peak flexion angle of swing phase | 0.99 [0.97–0.99] | 0.99 [0.97–1.00] | 0.96 [0.92–0.98] | 0.99 [0.97–0.99] |
| Peak extension angle of swing phase | 0.95 [0.88–0.98] | 0.98 [0.95–0.99] | 0.89 [0.76–0.95] | 0.97 [0.93–0.99] |
| Angular excursion of swing phase | 0.85 [0.69–0.94] | 0.94 [0.87–0.97] | 0.73 [0.43–0.88] | 0.91 [0.82–0.96] |
| Hip | ||||
| Peak flexion angle | 0.97 [0.93–0.99] | 0.98 [0.97–0.99] | 0.99 [0.97–0.99] | 0.99 [0.97–1.00] |
| Peak extension angle | 0.96 [0.92–0.98] | 0.99 [0.98–0.99] | 0.96 [0.91–0.98] | 0.99 [0.99–1.00] |
| Angular excursion | 0.92 [0.84–0.97] | 0.94 [0.87–0.98] | 0.91 [0.81–0.96] | 0.97 [0.91–0.98] |
| Right (Camera Side) | Left (Opposite Camera Side) | p Value | |
|---|---|---|---|
| Ankle dorsiflexion/plantarflexion | 3.1 (2.7–3.5) | 4.1 (3.7–4.6) | <0.001 |
| Knee flexion/extension | 2.3 (2.1–2.6) | 3.1 (2.8–3.4) | <0.001 |
| Hip flexion/extension | 2.5 (1.1–3.9) | 3.5 (3.2–3.9) | 0.013 |
| Right (Camera Side) | Left (Opposite Camera Side) | |||||
|---|---|---|---|---|---|---|
| AI-MA | 3D-MA | p Value | AI-MA | 3D-MA | p Value | |
| Ankle | ||||||
| Peak dorsiflexion angle | 13.1 (4.0) | 14.1 (4.2) | 0.395 | 15.8 (3.9) | 15.5 (4.2) | 0.829 |
| Peak plantarflexion angle | 13.4 (6.2) | 13.9 (6.1) | 0.801 | 16.7 (7.1) | 13.9 (6.2) | 0.162 |
| Angular excursion | 26.5 (8.2) | 28.0 (6.7) | 0.503 | 32.5 (5.9) | 29.4 (5.5) | 0.078 |
| Knee | ||||||
| Stance phase peak flexion angle | 14.5 (8.3) | 15.7 (8.6) | 0.613 | 15.8 (8.1) | 16.6 (8.7) | 0.726 |
| Stance phase peak extension angle | 2.1 (5.6) | 3.4 (5.9) | 0.470 | 1.7 (5.4) | 4.5 (6.1) | 0.114 |
| Stance phase angular excursion | 9.6 (3.2) | 9.8 (3.5) | 0.563 | 11.8 (3.8) | 10.6 (4.1) | 0.310 |
| Swing phase peak flexion angle | 61.0 (6.7) | 59.7 (7.6) | 0.876 | 59.6 (6.7) | 62.3 (8.1) | 0.233 |
| Swing phase peak extension angle | 0.3 (5.1) | 2.8 (5.6) | 0.121 | 7.5 (6.5) | 4.3 (6.1) | 0.088 |
| Swing phase angular excursion | 57.7 (4.4) | 55.3 (4.1) | 0.065 | 55.4 (3.8) | 56.4 (4.2) | 0.397 |
| Hip | ||||||
| Peak flexion angle | 30.1 (6.3) | 30.6 (6.0) | 0.797 | 33.7 (6.5) | 32.1 (6.6) | 0.193 |
| Peak extension angle | 12.3 (4.6) | 11.4 (5.0) | 0.530 | 9.3 (5.5) | 10.8 (5.5) | 0.359 |
| Angular excursion | 42.4 (4.3) | 42.0 (3.8) | 0.721 | 43.0 (4.7) | 42.0 (3.4) | 0.394 |
| Right (Camera Side) | Left (Opposite Camera Side) | |||
|---|---|---|---|---|
| Pearson’s r | p Value | Pearson’s r | p Value | |
| Ankle | ||||
| Peak dorsiflexion angle | 0.734 | <0.001 | 0.857 | <0.001 |
| Peak plantarflexion angle | 0.877 | <0.001 | 0.942 | <0.001 |
| Angular excursion | 0.794 | <0.001 | 0.816 | <0.001 |
| Knee | ||||
| Peak flexion angle of stance phase | 0.987 | <0.001 | 0.957 | <0.001 |
| Peak extension angle of stance phase | 0.937 | <0.001 | 0.973 | <0.001 |
| Angular excursion of stance phase | 0.806 | <0.001 | 0.625 | 0.001 |
| Peak flexion angle of swing phase | 0.875 | 0.006 | 0.836 | <0.001 |
| Peak extension angle of swing phase | 0.944 | <0.001 | 0.894 | <0.001 |
| Angular excursion of swing phase | 0.473 | 0.023 | 0.338 | 0.115 |
| Hip | ||||
| Peak flexion angle | 0.913 | <0.001 | 0.933 | <0.001 |
| Peak extension angle | 0.932 | <0.001 | 0.954 | <0.001 |
| Angular excursion | 0.598 | 0.003 | 0.716 | <0.001 |
| Right (Camera Side) | Left (Opposite Camera Side) | p Value | |
|---|---|---|---|
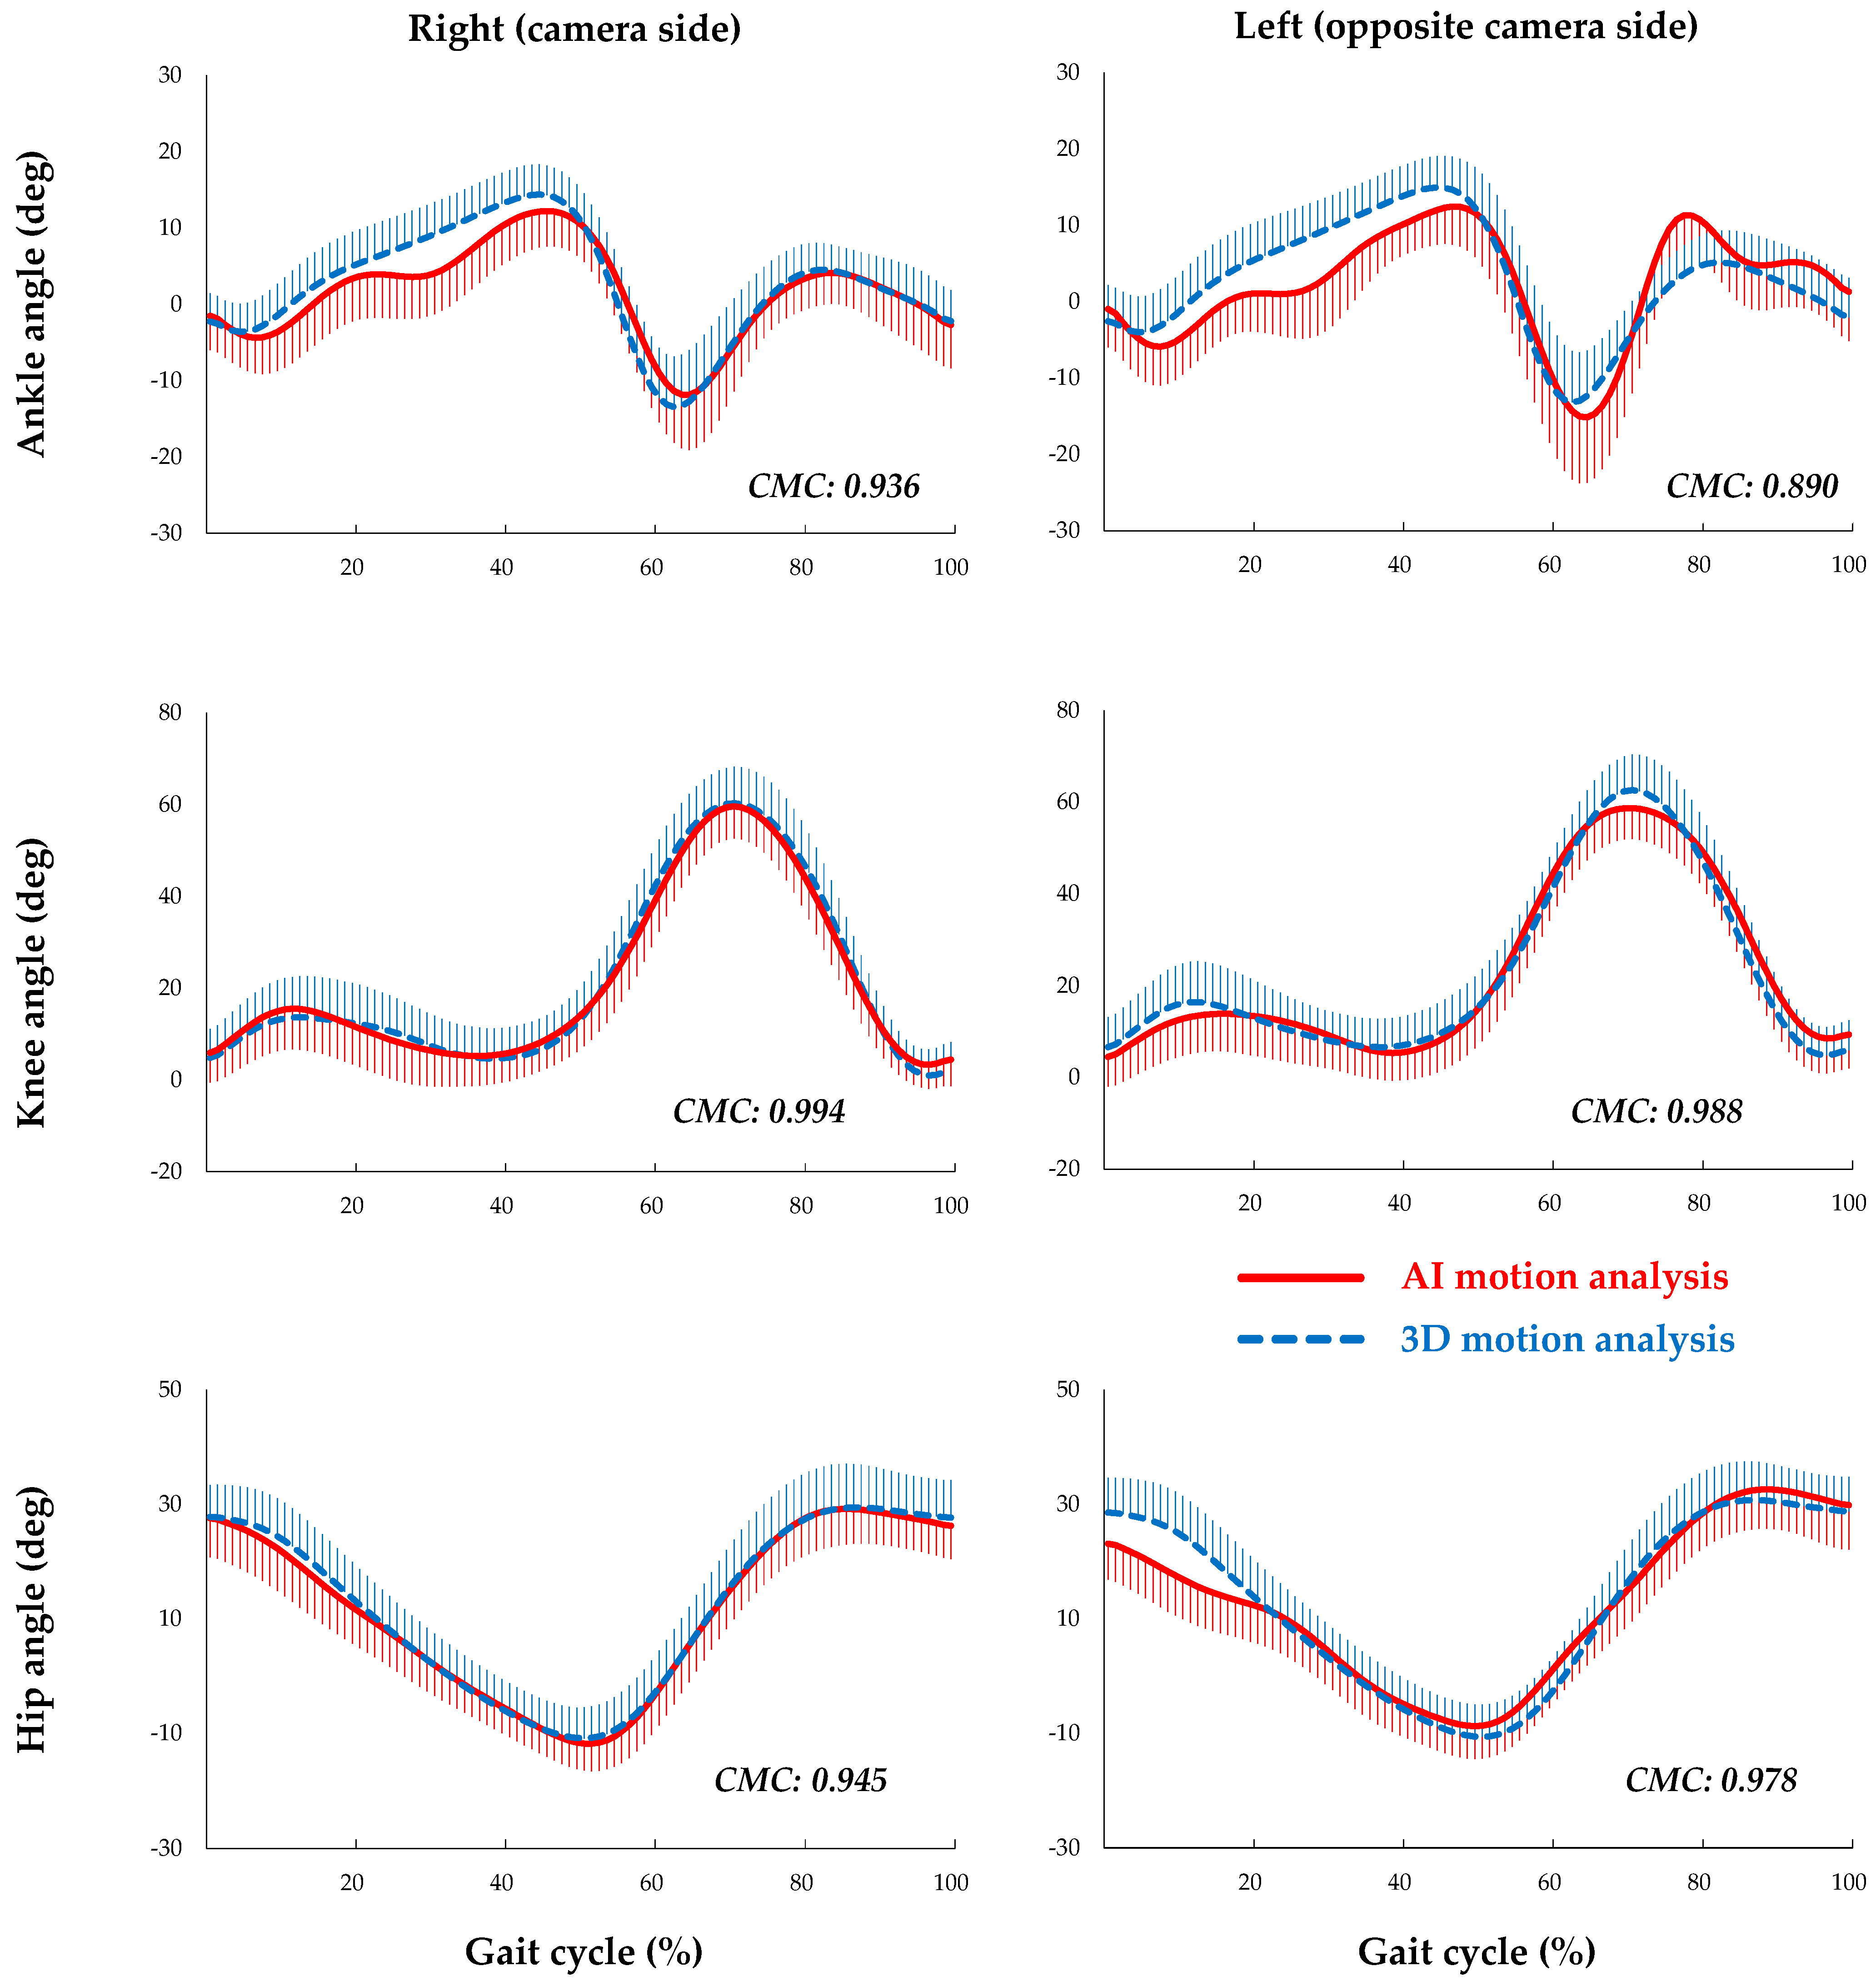
| Ankle dorsiflexion/plantarflexion | 0.936 (0.032) | 0.890 (0.042) | <0.001 |
| Knee flexion/extension | 0.994 (0.003) | 0.988 (0.010) | 0.002 |
| Hip flexion/extension | 0.945 (0.209) | 0.978 (0.007) | 0.452 |
Disclaimer/Publisher’s Note: The statements, opinions and data contained in all publications are solely those of the individual author(s) and contributor(s) and not of MDPI and/or the editor(s). MDPI and/or the editor(s) disclaim responsibility for any injury to people or property resulting from any ideas, methods, instructions or products referred to in the content. |
© 2023 by the authors. Licensee MDPI, Basel, Switzerland. This article is an open access article distributed under the terms and conditions of the Creative Commons Attribution (CC BY) license (https://creativecommons.org/licenses/by/4.0/).
Share and Cite
Ino, T.; Samukawa, M.; Ishida, T.; Wada, N.; Koshino, Y.; Kasahara, S.; Tohyama, H. Validity of AI-Based Gait Analysis for Simultaneous Measurement of Bilateral Lower Limb Kinematics Using a Single Video Camera. Sensors 2023, 23, 9799. https://doi.org/10.3390/s23249799
Ino T, Samukawa M, Ishida T, Wada N, Koshino Y, Kasahara S, Tohyama H. Validity of AI-Based Gait Analysis for Simultaneous Measurement of Bilateral Lower Limb Kinematics Using a Single Video Camera. Sensors. 2023; 23(24):9799. https://doi.org/10.3390/s23249799
Chicago/Turabian StyleIno, Takumi, Mina Samukawa, Tomoya Ishida, Naofumi Wada, Yuta Koshino, Satoshi Kasahara, and Harukazu Tohyama. 2023. "Validity of AI-Based Gait Analysis for Simultaneous Measurement of Bilateral Lower Limb Kinematics Using a Single Video Camera" Sensors 23, no. 24: 9799. https://doi.org/10.3390/s23249799
APA StyleIno, T., Samukawa, M., Ishida, T., Wada, N., Koshino, Y., Kasahara, S., & Tohyama, H. (2023). Validity of AI-Based Gait Analysis for Simultaneous Measurement of Bilateral Lower Limb Kinematics Using a Single Video Camera. Sensors, 23(24), 9799. https://doi.org/10.3390/s23249799