Author Contributions
Conceptualization, O.K. and B.A.; methodology, O.K., V.D., T.F., L.L., L.M., K.P., F.S., F.T. and A.W.; software, O.K., V.D., T.F., L.L., L.M., K.P., F.S., F.T. and A.W.; validation, O.K., V.D., T.F., L.L., L.M., K.P., F.S., F.T. and A.W.; formal analysis, O.K., V.D., T.F., L.L., L.M., K.P., F.S., F.T. and A.W.; investigation, O.K., R.v.d.W., H.G., M.L. and B.A.; resources, H.G., M.L. and B.A.; data curation, O.K., V.D., T.F., L.L., L.M., K.P., F.S., F.T. and A.W.; writing—original draft preparation, O.K.; writing—review and editing, O.K., R.v.d.W. and B.A.; visualization, O.K., R.v.d.W., V.D., T.F., L.L., L.M., K.P., F.S., F.T., and A.W.; supervision, H.G., M.L. and B.A.; project administration, O.K. and L.L.; funding acquisition, H.G., M.L. and B.A. All authors have read and agreed to the published version of the manuscript.
Figure 1.
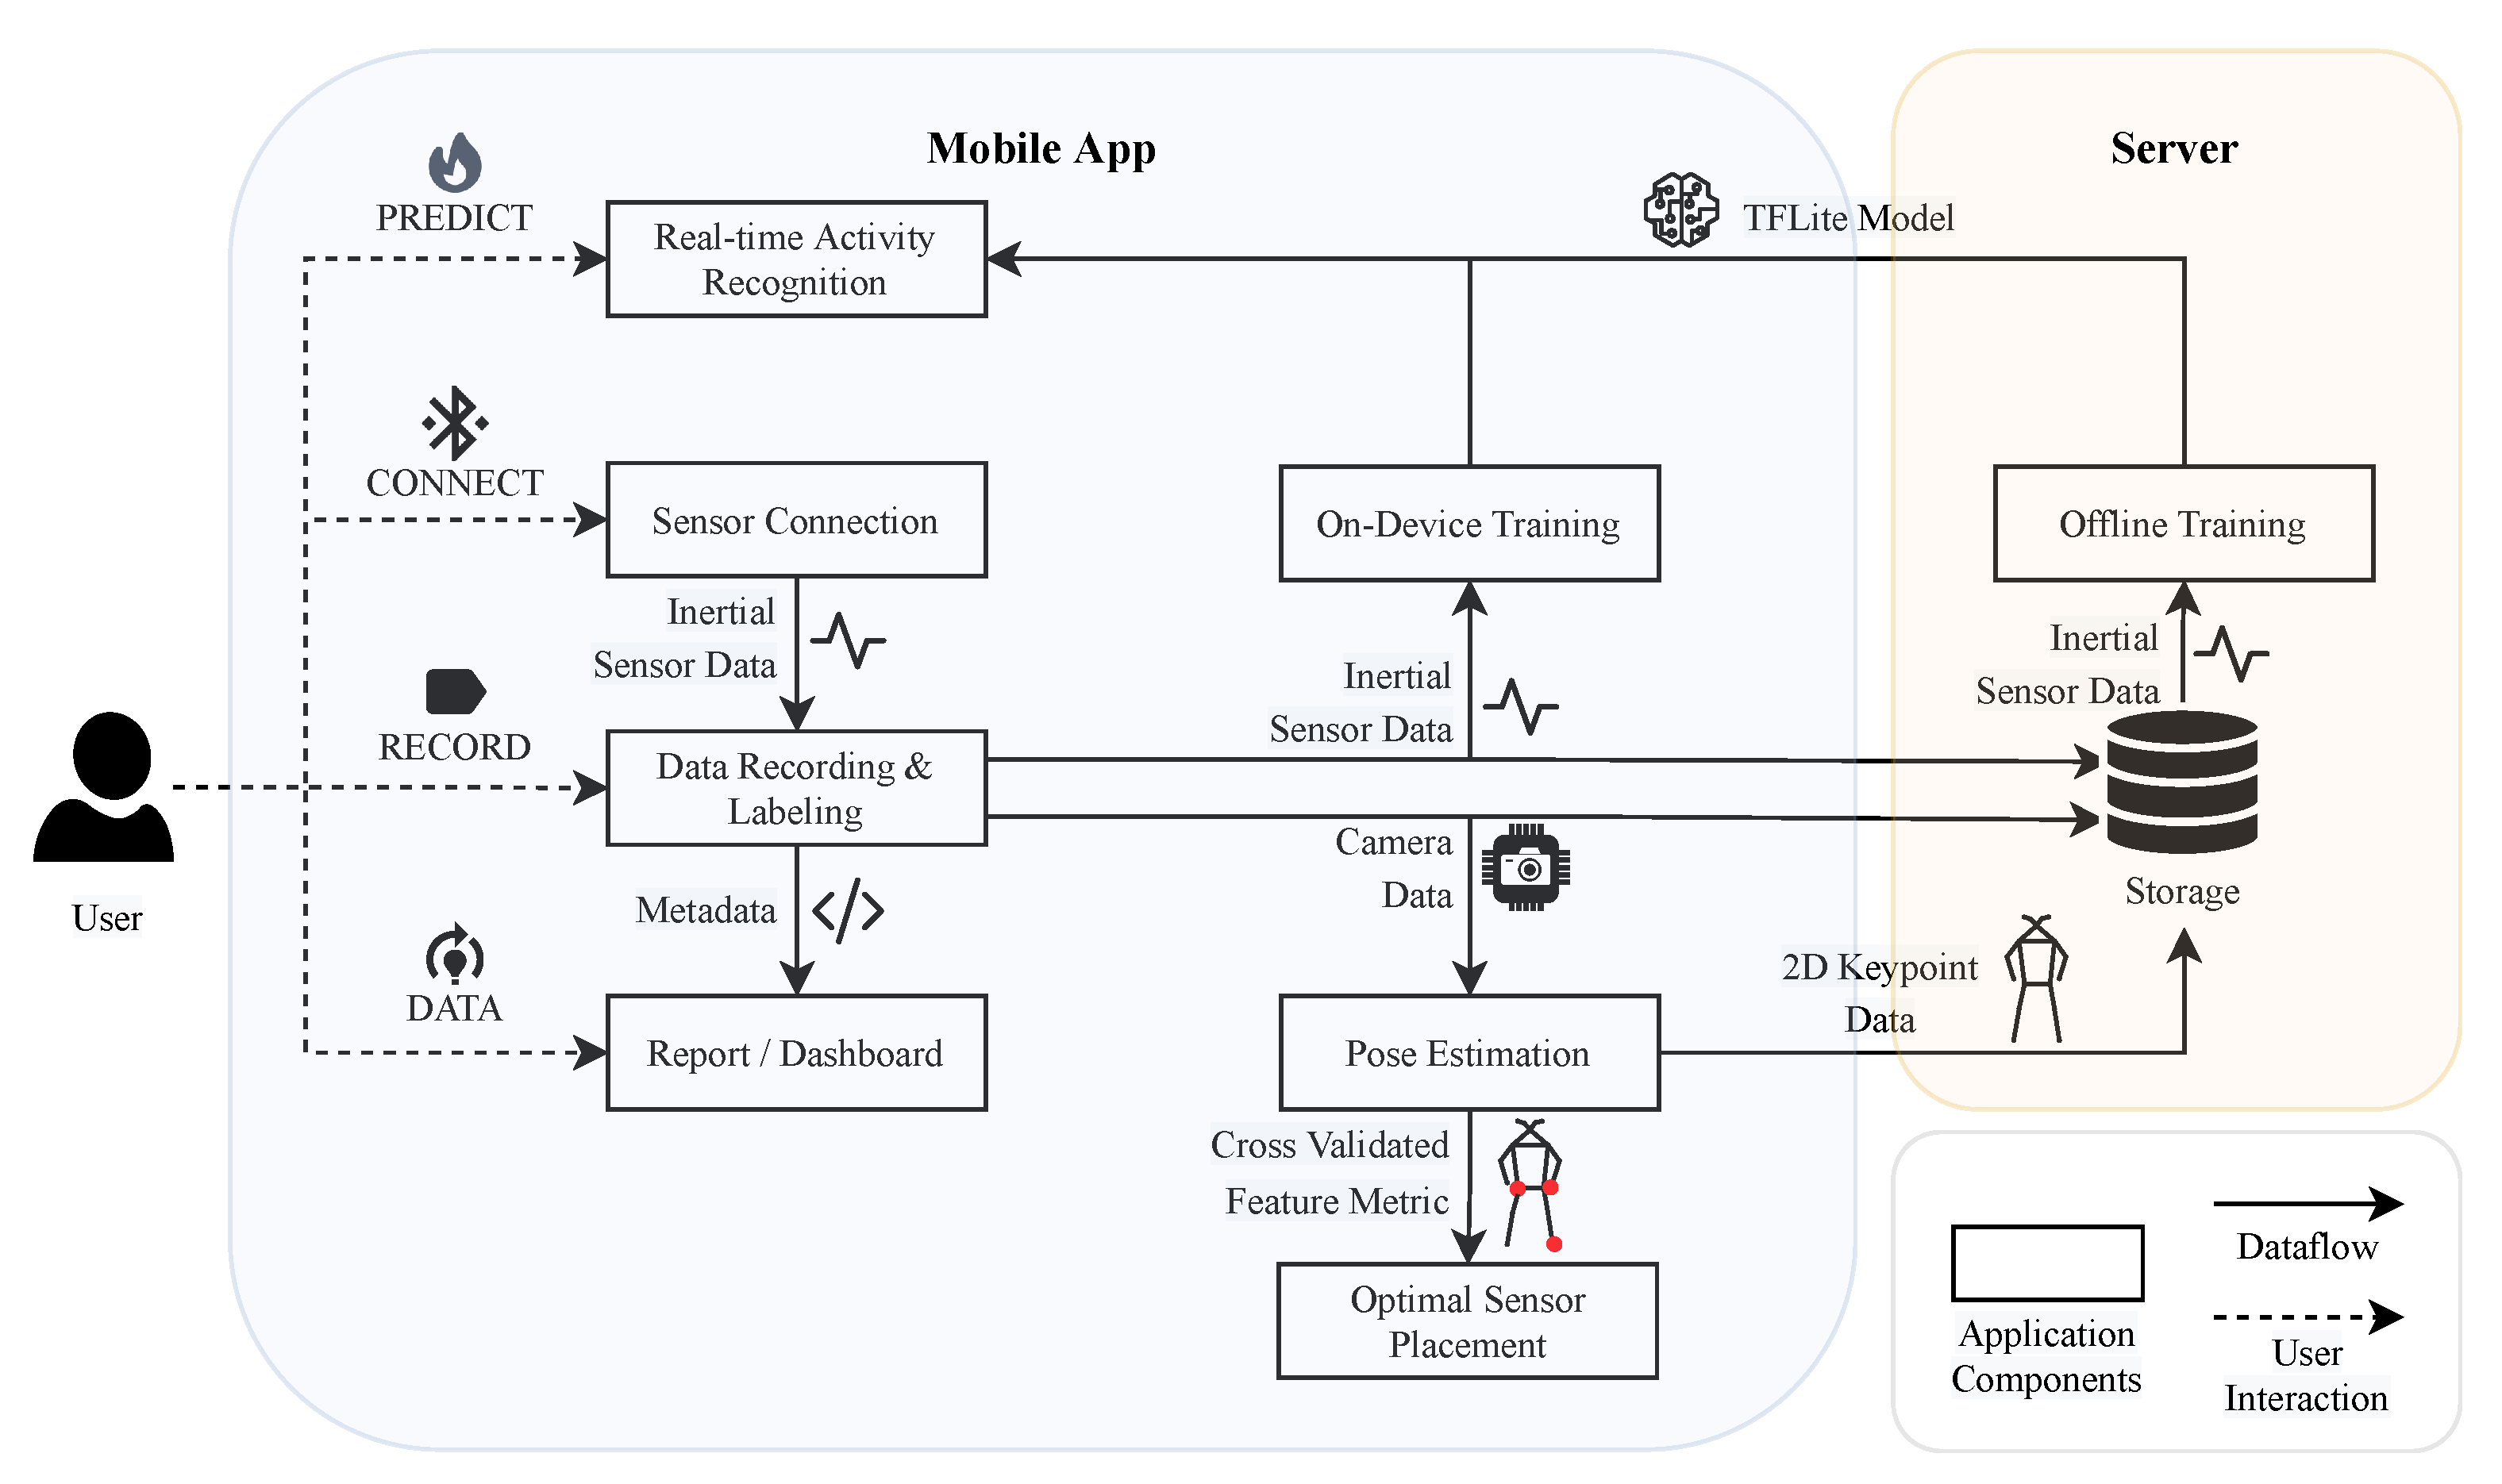
The application’s architecture can be divided into two parts—mobile app and server—to ensure efficient data handling and processing. Mobile app: The app comprises different views depicted as rectangles, each important to conduct a study for human activity recognition. The arrows illustrate the dataflow, which can be of different data modalities. Server: The collected data can be uploaded to a server, and a lightweight deep learning model can be trained and embedded into the app.
Figure 1.
The application’s architecture can be divided into two parts—mobile app and server—to ensure efficient data handling and processing. Mobile app: The app comprises different views depicted as rectangles, each important to conduct a study for human activity recognition. The arrows illustrate the dataflow, which can be of different data modalities. Server: The collected data can be uploaded to a server, and a lightweight deep learning model can be trained and embedded into the app.
Figure 2.
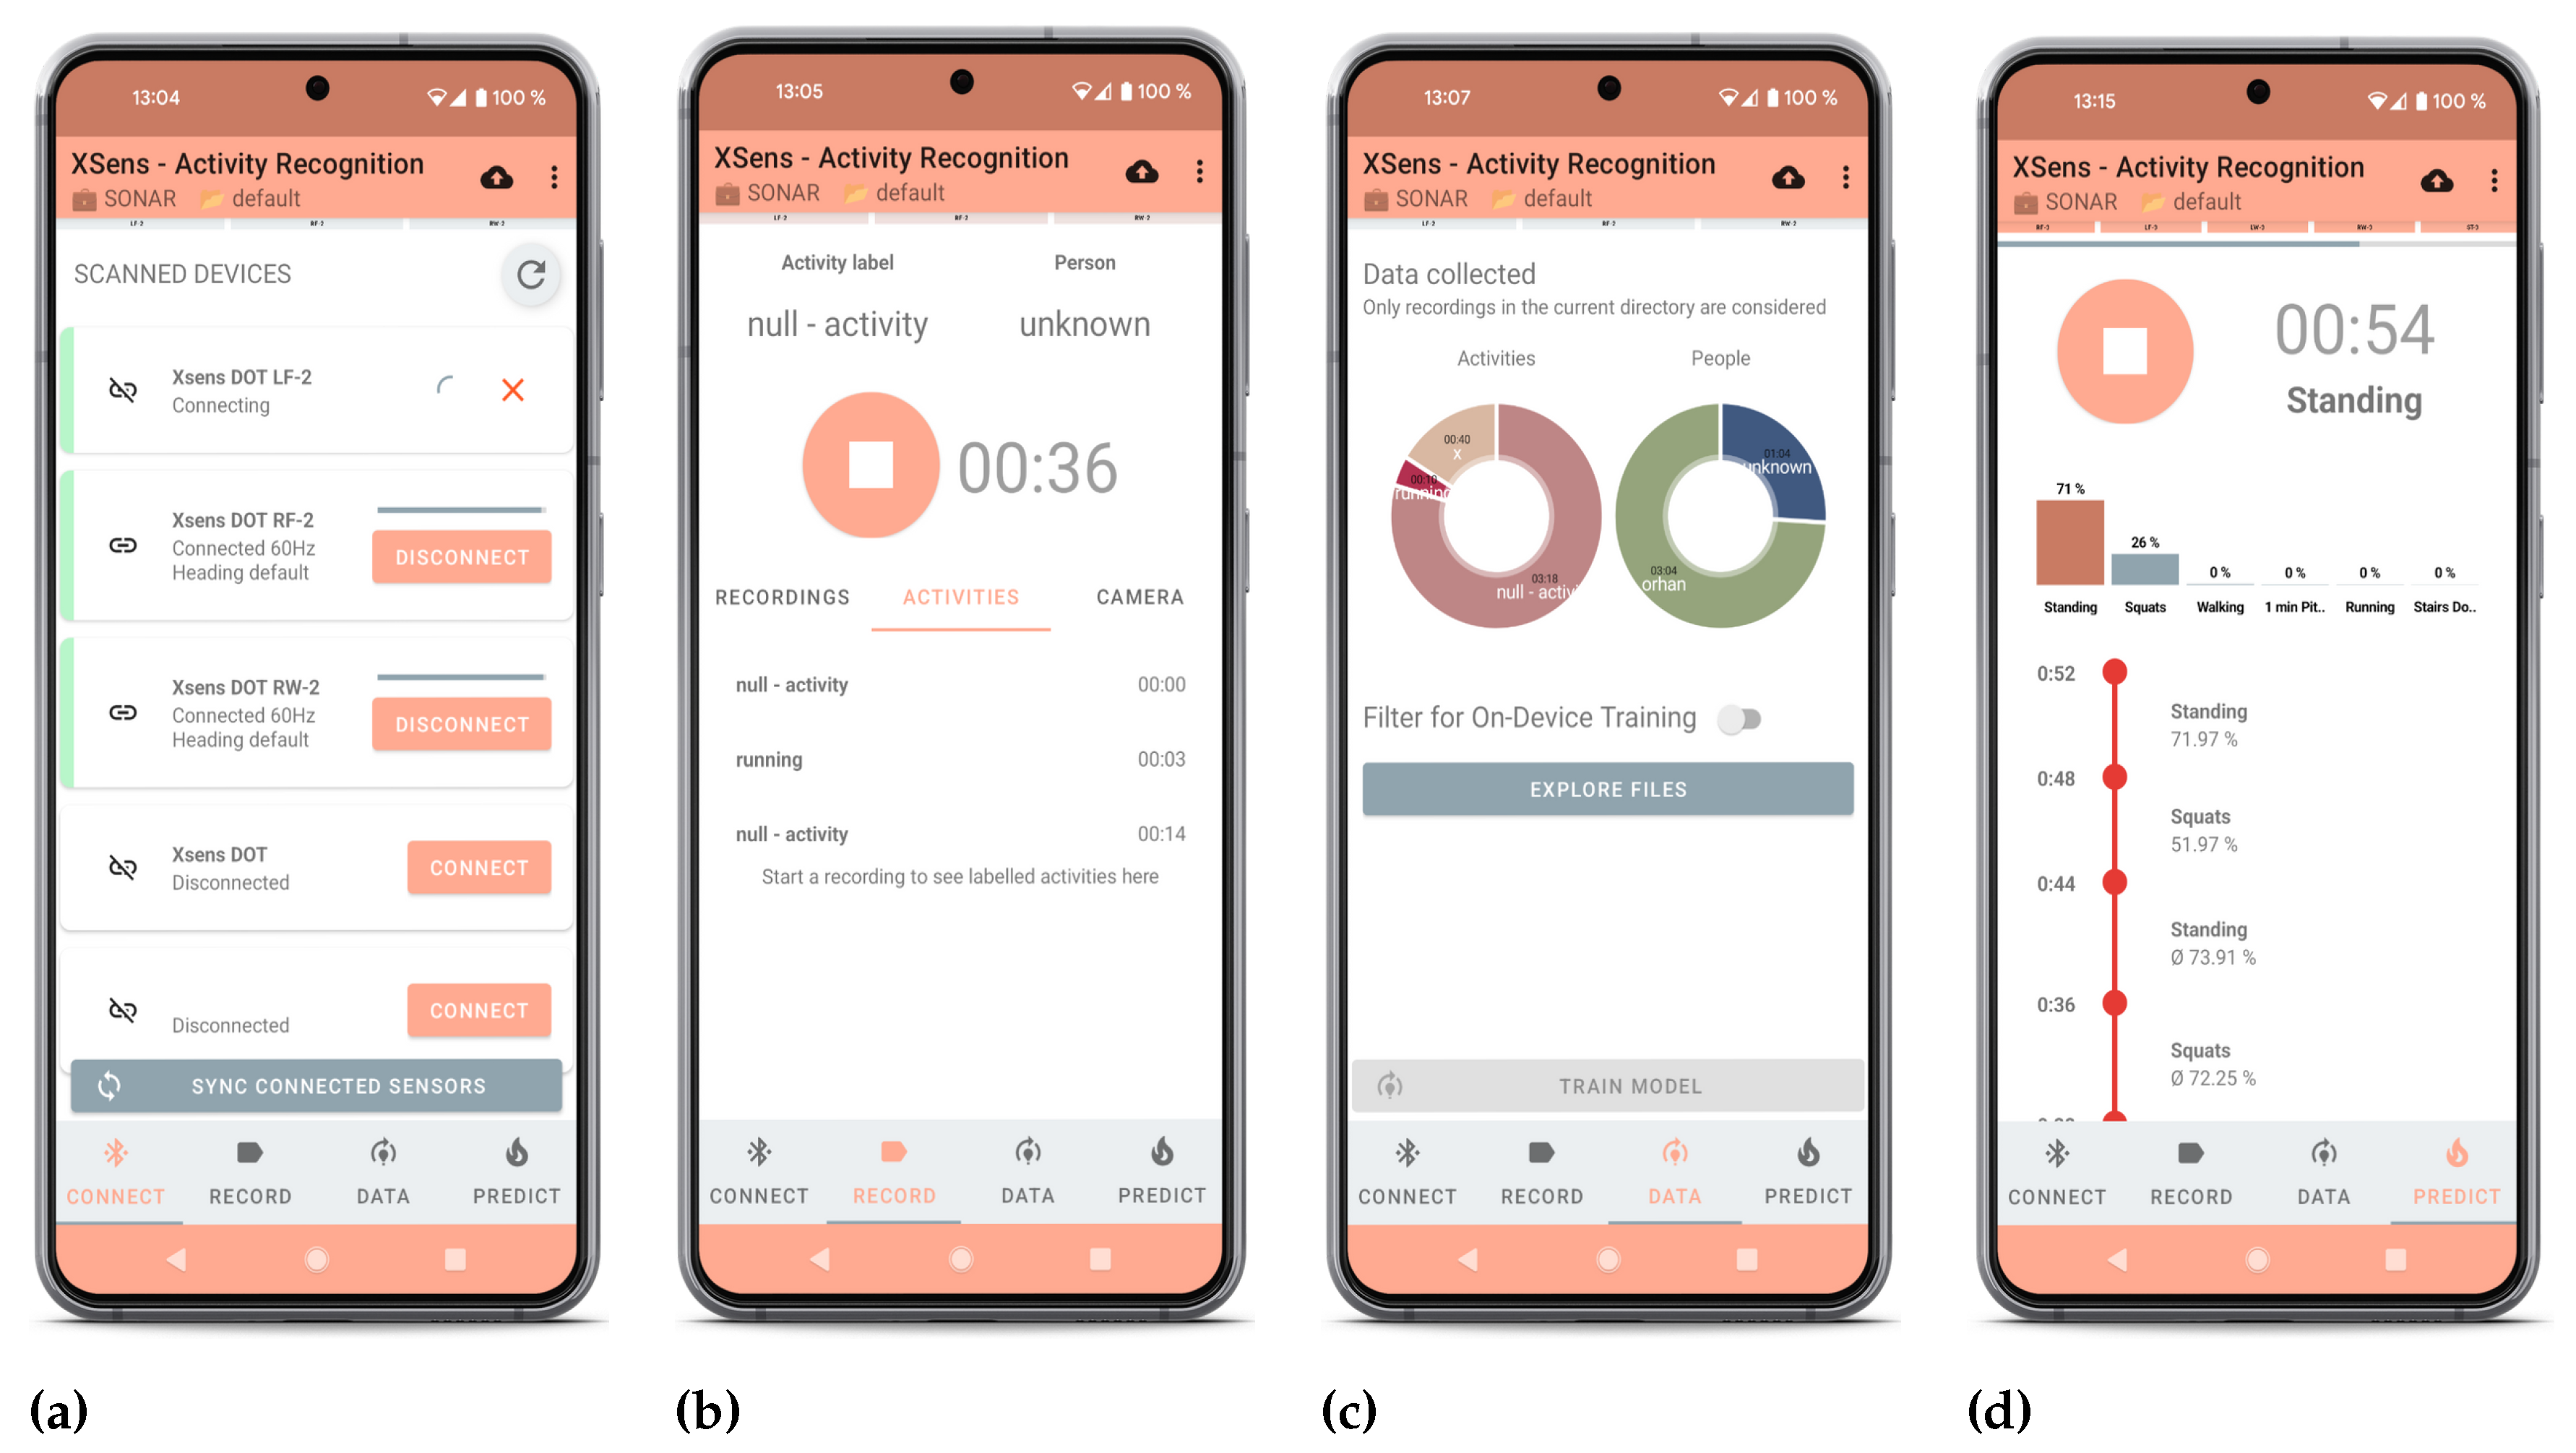
Different functionalities of the application highlight the versatility of HARE. (a) Connection overview for connecting and synchronizing the Xsens DOT sensors. (b) Recording interface for saving inertial, camera, and pose estimation data together with labeling activities in each timestamp. (c) Data dashboard allows exploring the recorded data. (d) Prediction overview allows real-time activity recognition for the incoming data.
Figure 2.
Different functionalities of the application highlight the versatility of HARE. (a) Connection overview for connecting and synchronizing the Xsens DOT sensors. (b) Recording interface for saving inertial, camera, and pose estimation data together with labeling activities in each timestamp. (c) Data dashboard allows exploring the recorded data. (d) Prediction overview allows real-time activity recognition for the incoming data.
Figure 3.
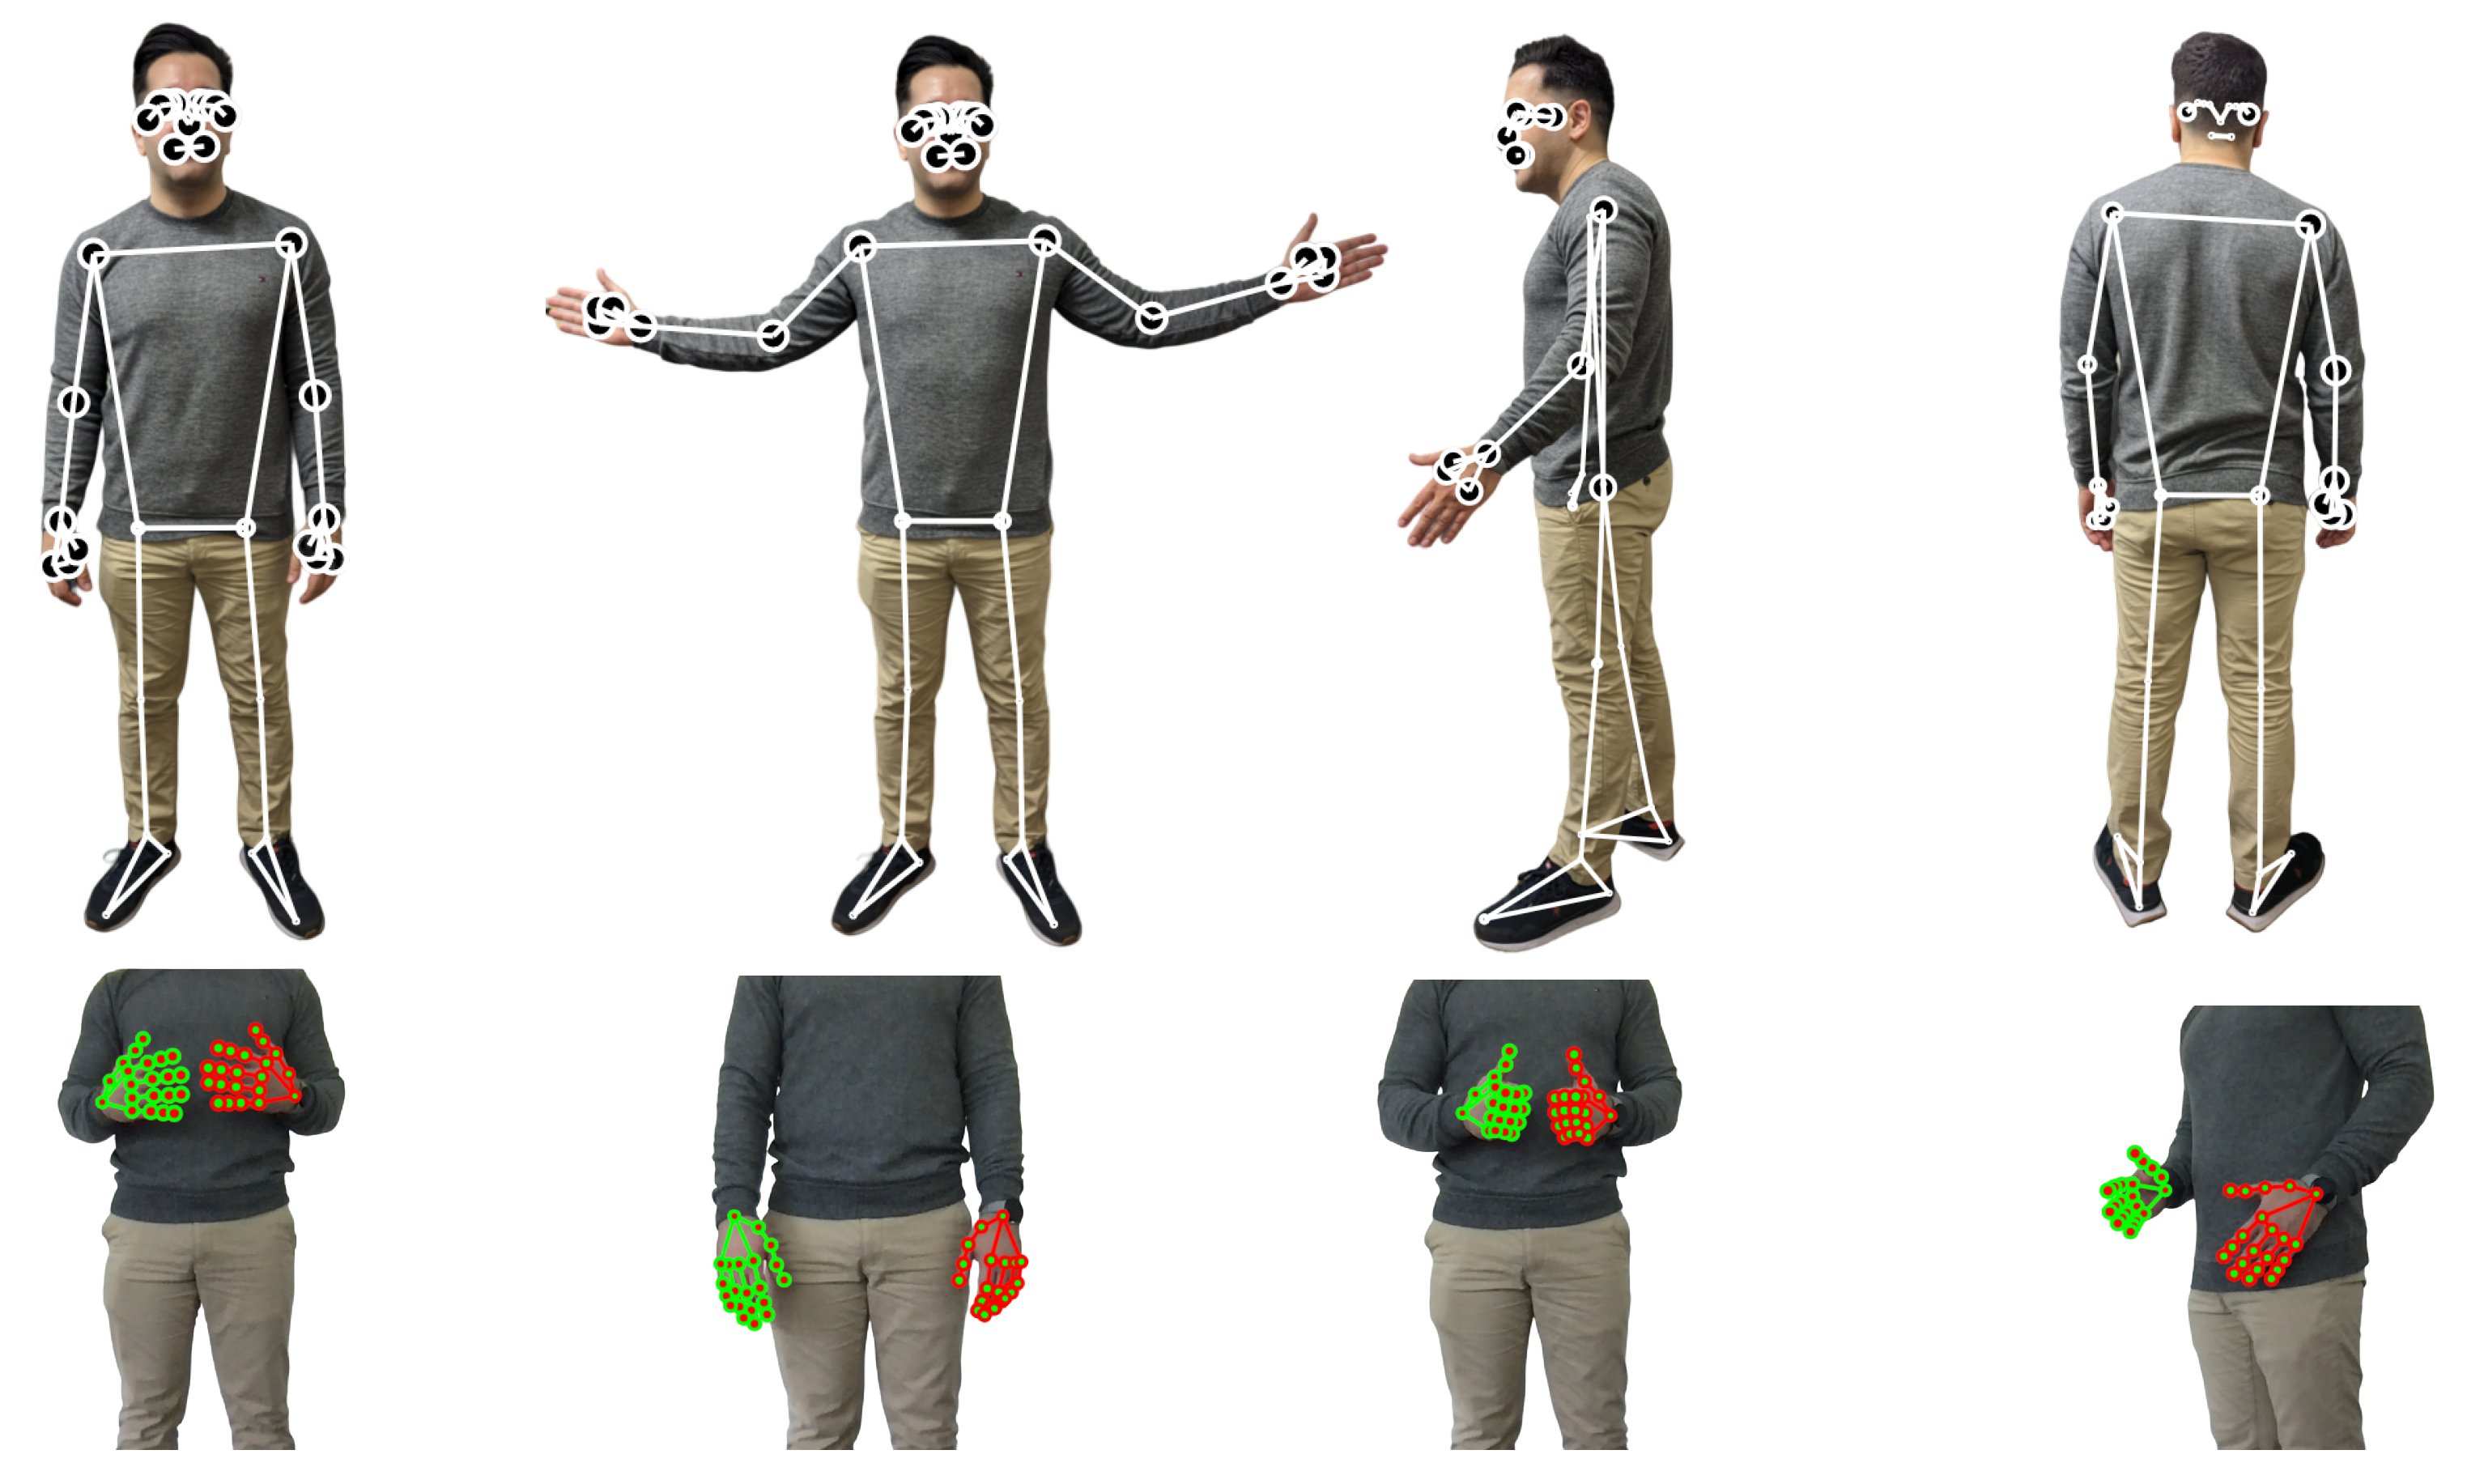
HARE’s adaptability to different use cases is demonstrated by leveraging diverse landmark estimation models. The top row shows examples of 2D pose estimations, while the second row illustrates hand landmarks with specific annotations (e.g., right hand with red circles and green connection lines, left hand with green landmarks and red connection lines). By utilizing different models, HARE can accommodate a wide range of applications.
Figure 3.
HARE’s adaptability to different use cases is demonstrated by leveraging diverse landmark estimation models. The top row shows examples of 2D pose estimations, while the second row illustrates hand landmarks with specific annotations (e.g., right hand with red circles and green connection lines, left hand with green landmarks and red connection lines). By utilizing different models, HARE can accommodate a wide range of applications.
Figure 4.
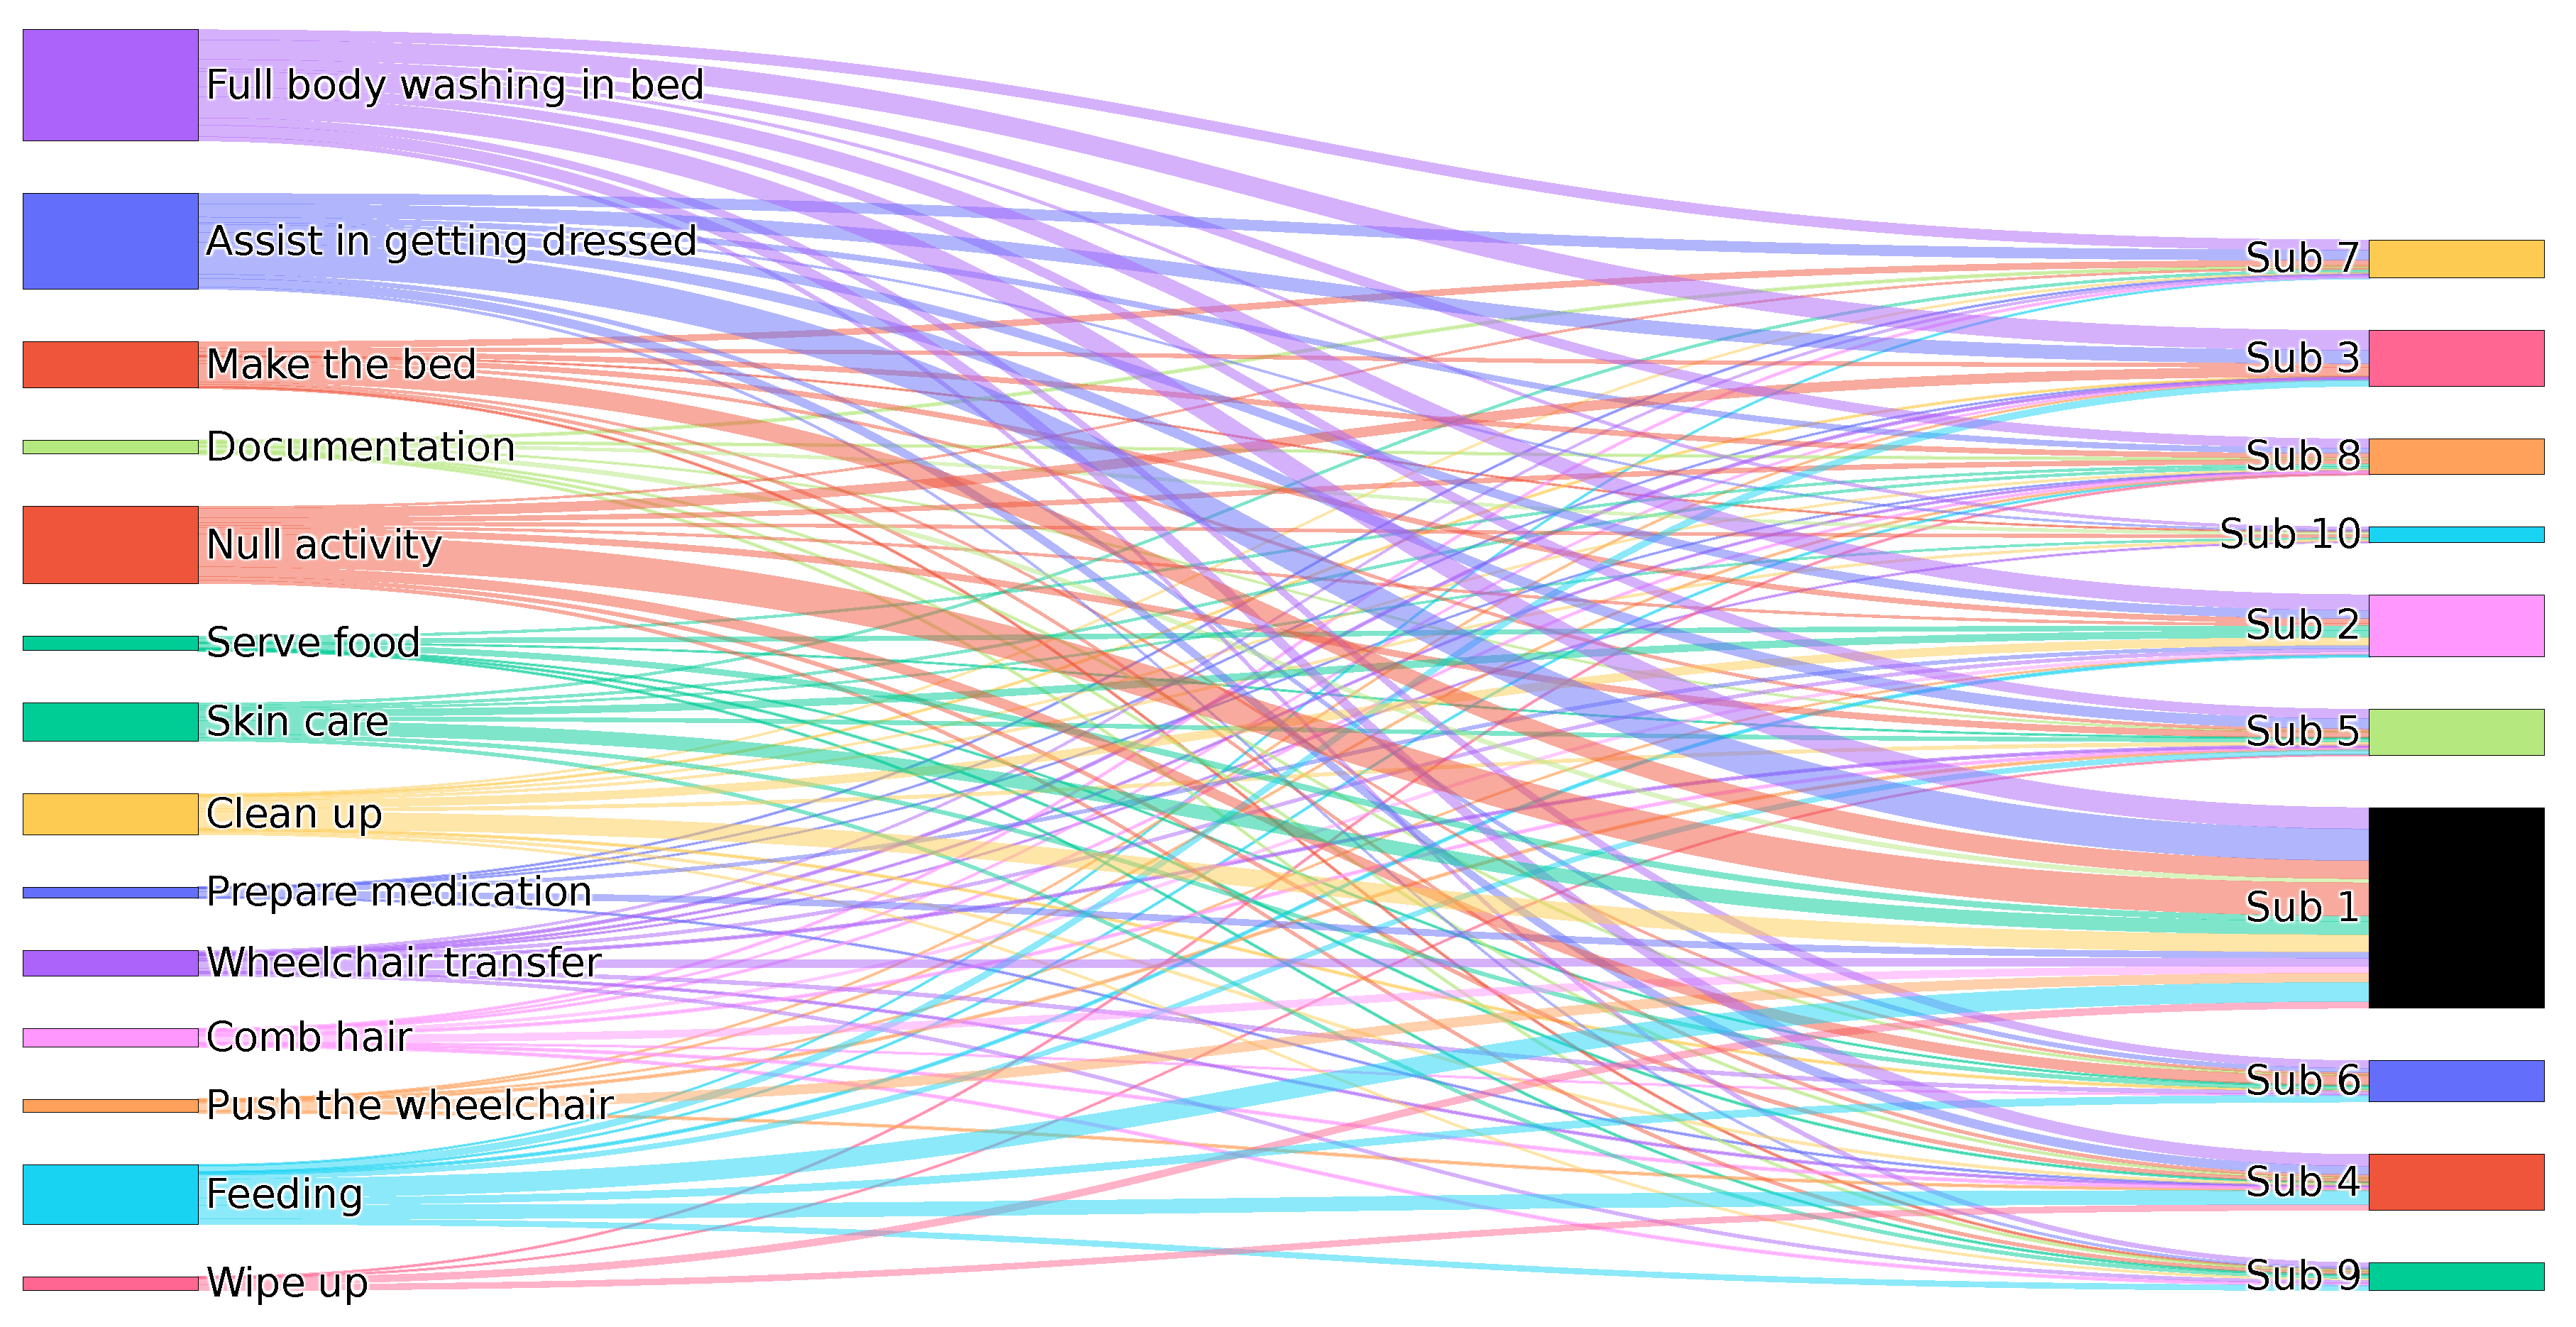
Sankey diagram showing the distribution of activities performed by Subjects 1 to 10 (denoted as Sub 1–Sub 10).
Figure 4.
Sankey diagram showing the distribution of activities performed by Subjects 1 to 10 (denoted as Sub 1–Sub 10).
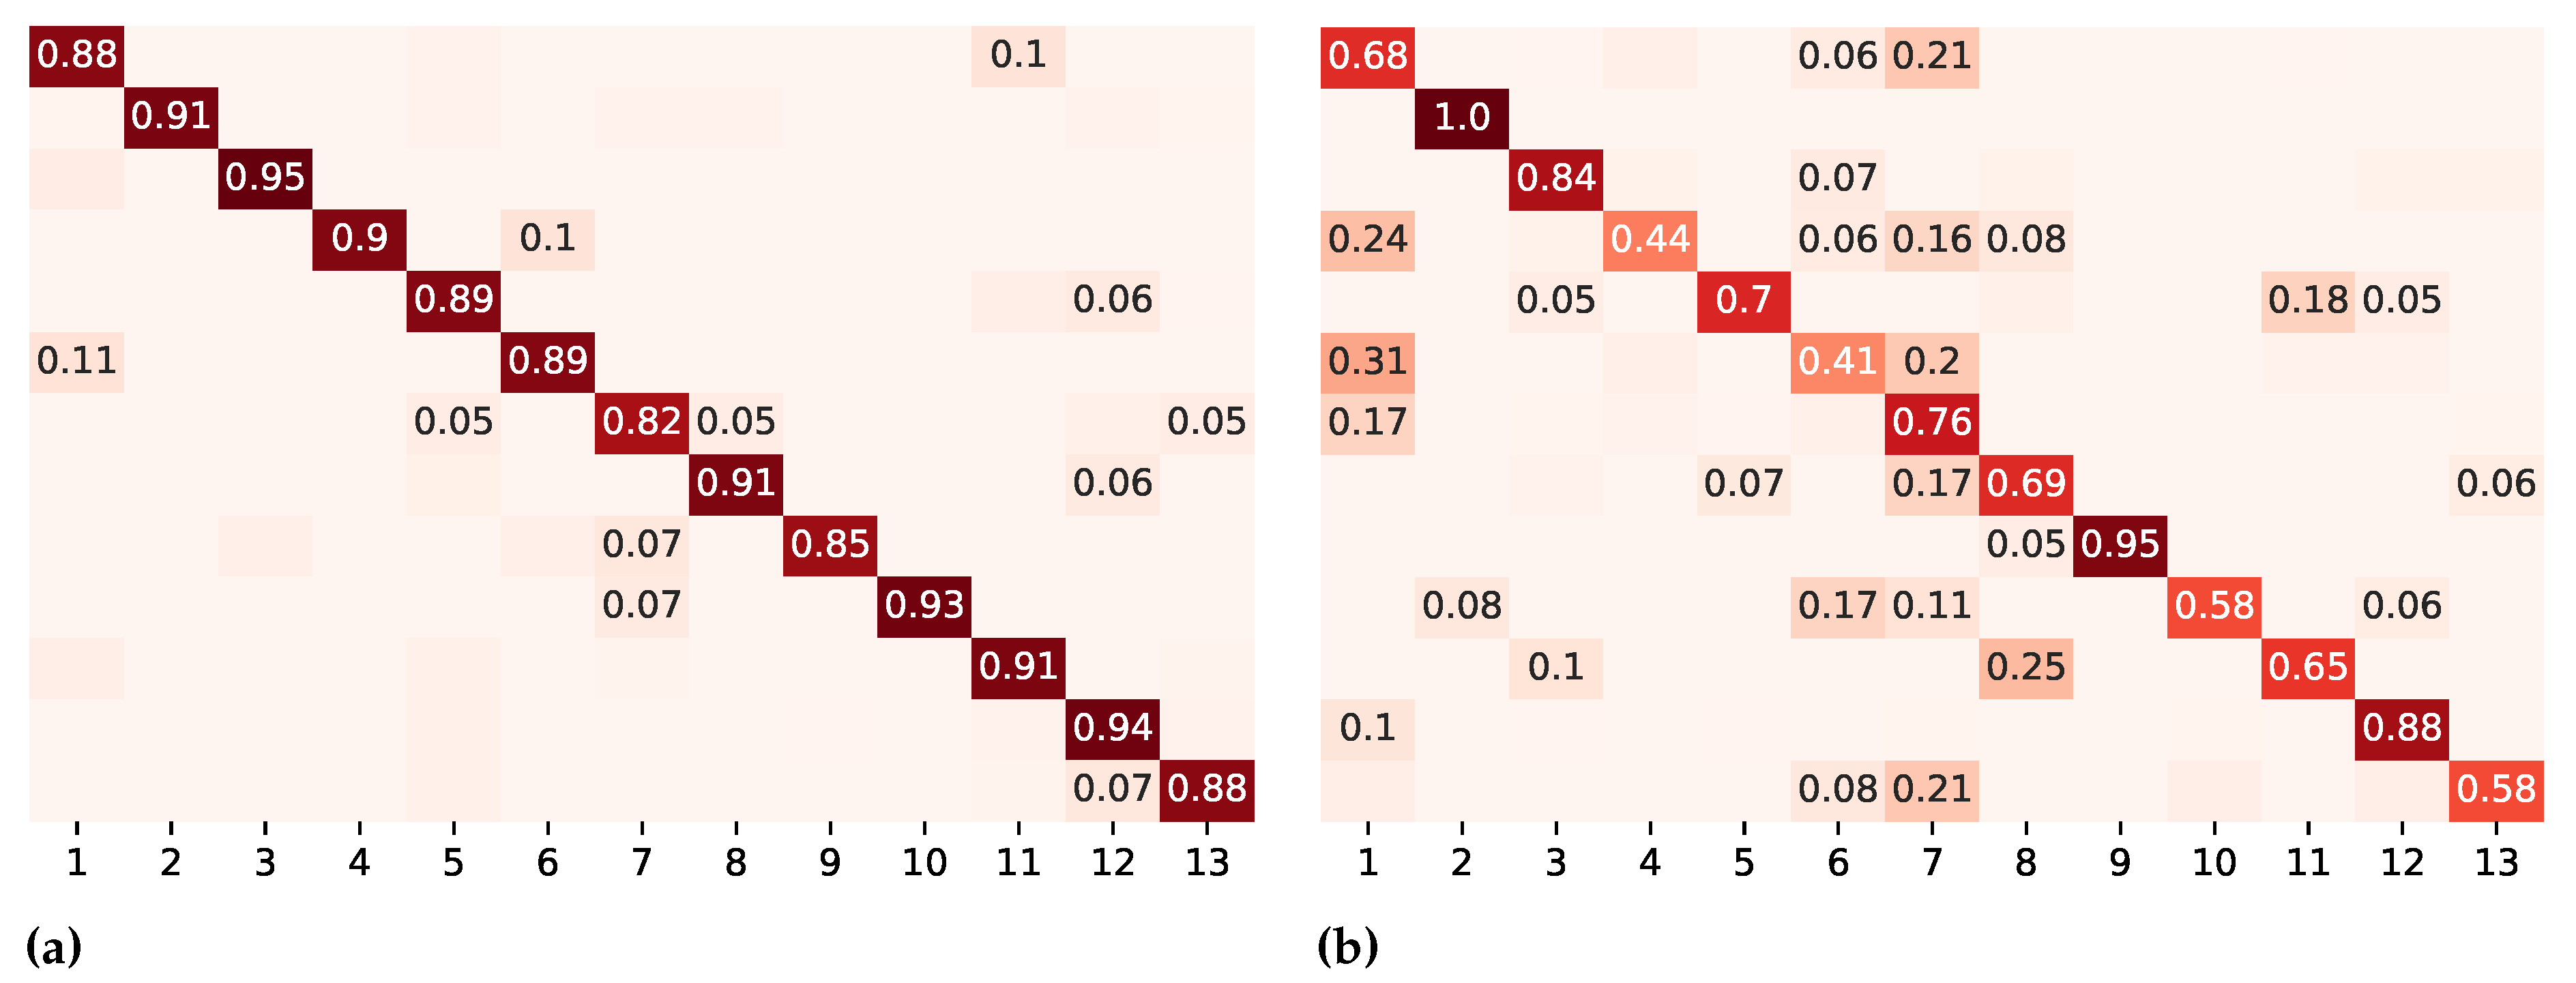
Figure 5.
Confusion matrices on different evaluation metrics for DeepConvLSTM. Numbers below 0.05 are left out. The color intensity represents the degree of similarity between predicted and actual values: darker colors along the diagonal represent accurate predictions (values closer to 1), while lighter colors off the diagonal indicate misclassifications (values closer to 0). The color intensity serves as a visual cue, emphasizing the model’s performance in correctly predicting different classes. (a) k-fold cross-validation. (b) Leave-recordings-out cross-validation. Legend: 1 = assist in getting dressed; 2 = full body washing in bed; 3 = feeding; 4 = make the bed; 5 = clean up; 6 = skin care; 7 = push the wheelchair; 8 = wheelchair transfer; 9 = comb hair; 10 = wipe up; 11 = prepare medication; 12 = serve food; 13 = documentation.
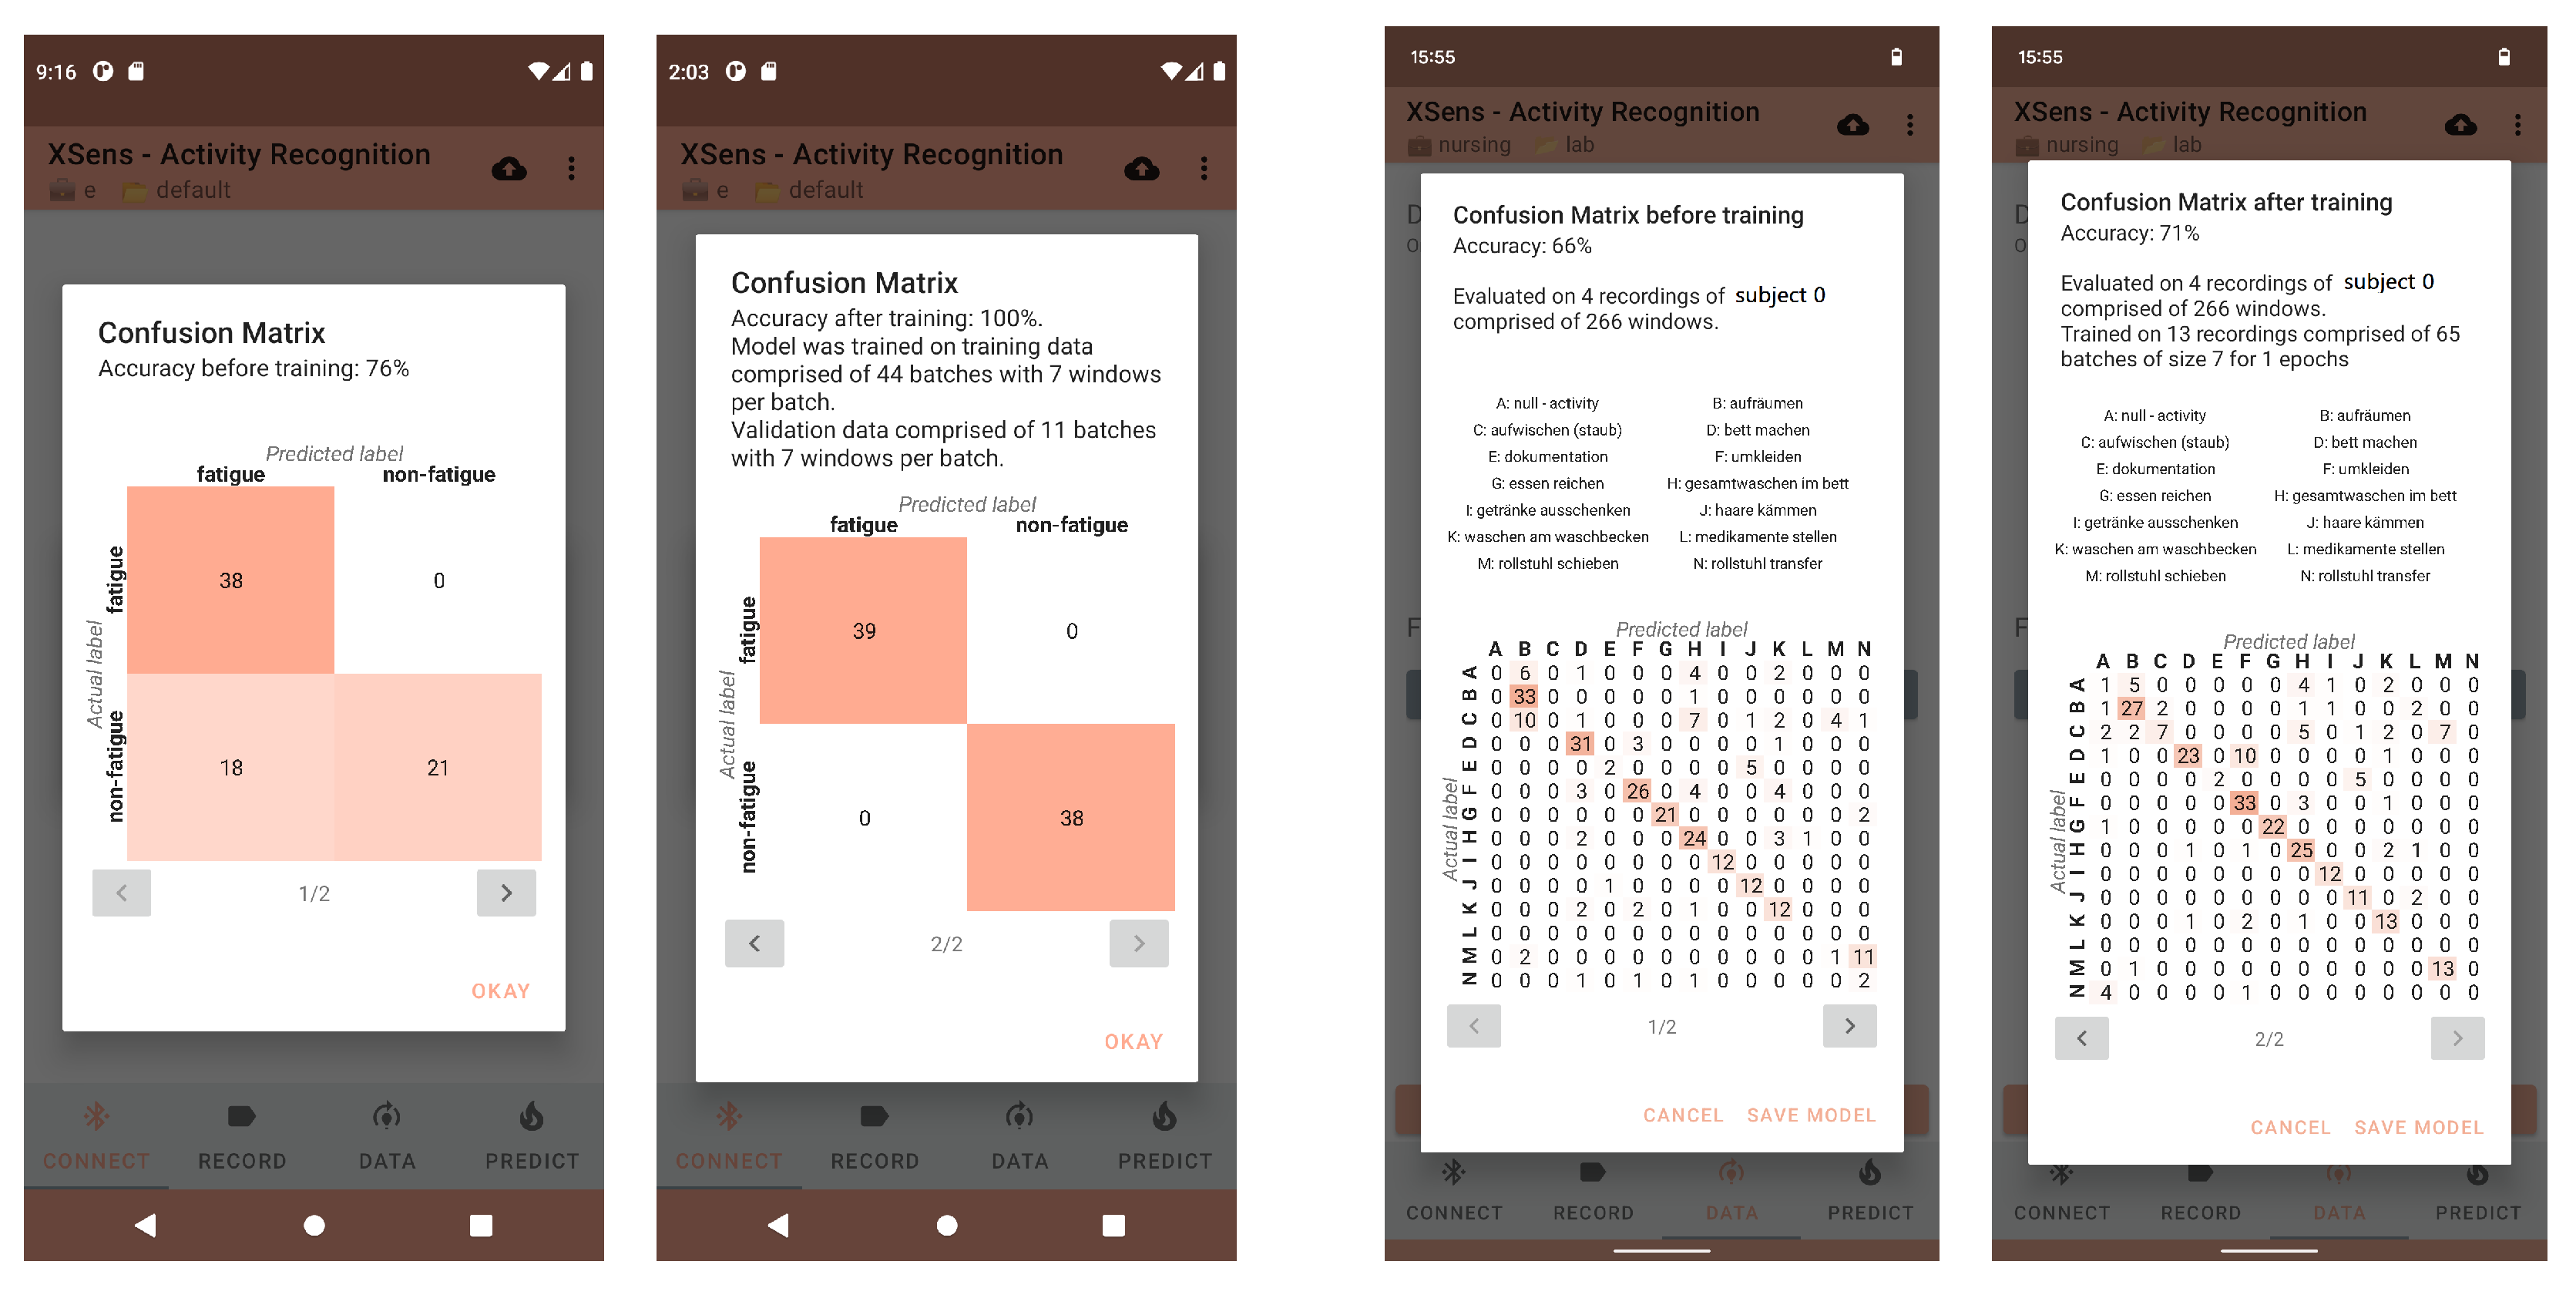
Figure 6.
Comparison of the classification results before (first and third picture) and after (second and last picture) on-device transfer learning for two different datasets depicted in a confusion matrix within HARE. The first two images show the gait analysis dataset, whereas the last two illustrate the results for the nursing dataset.
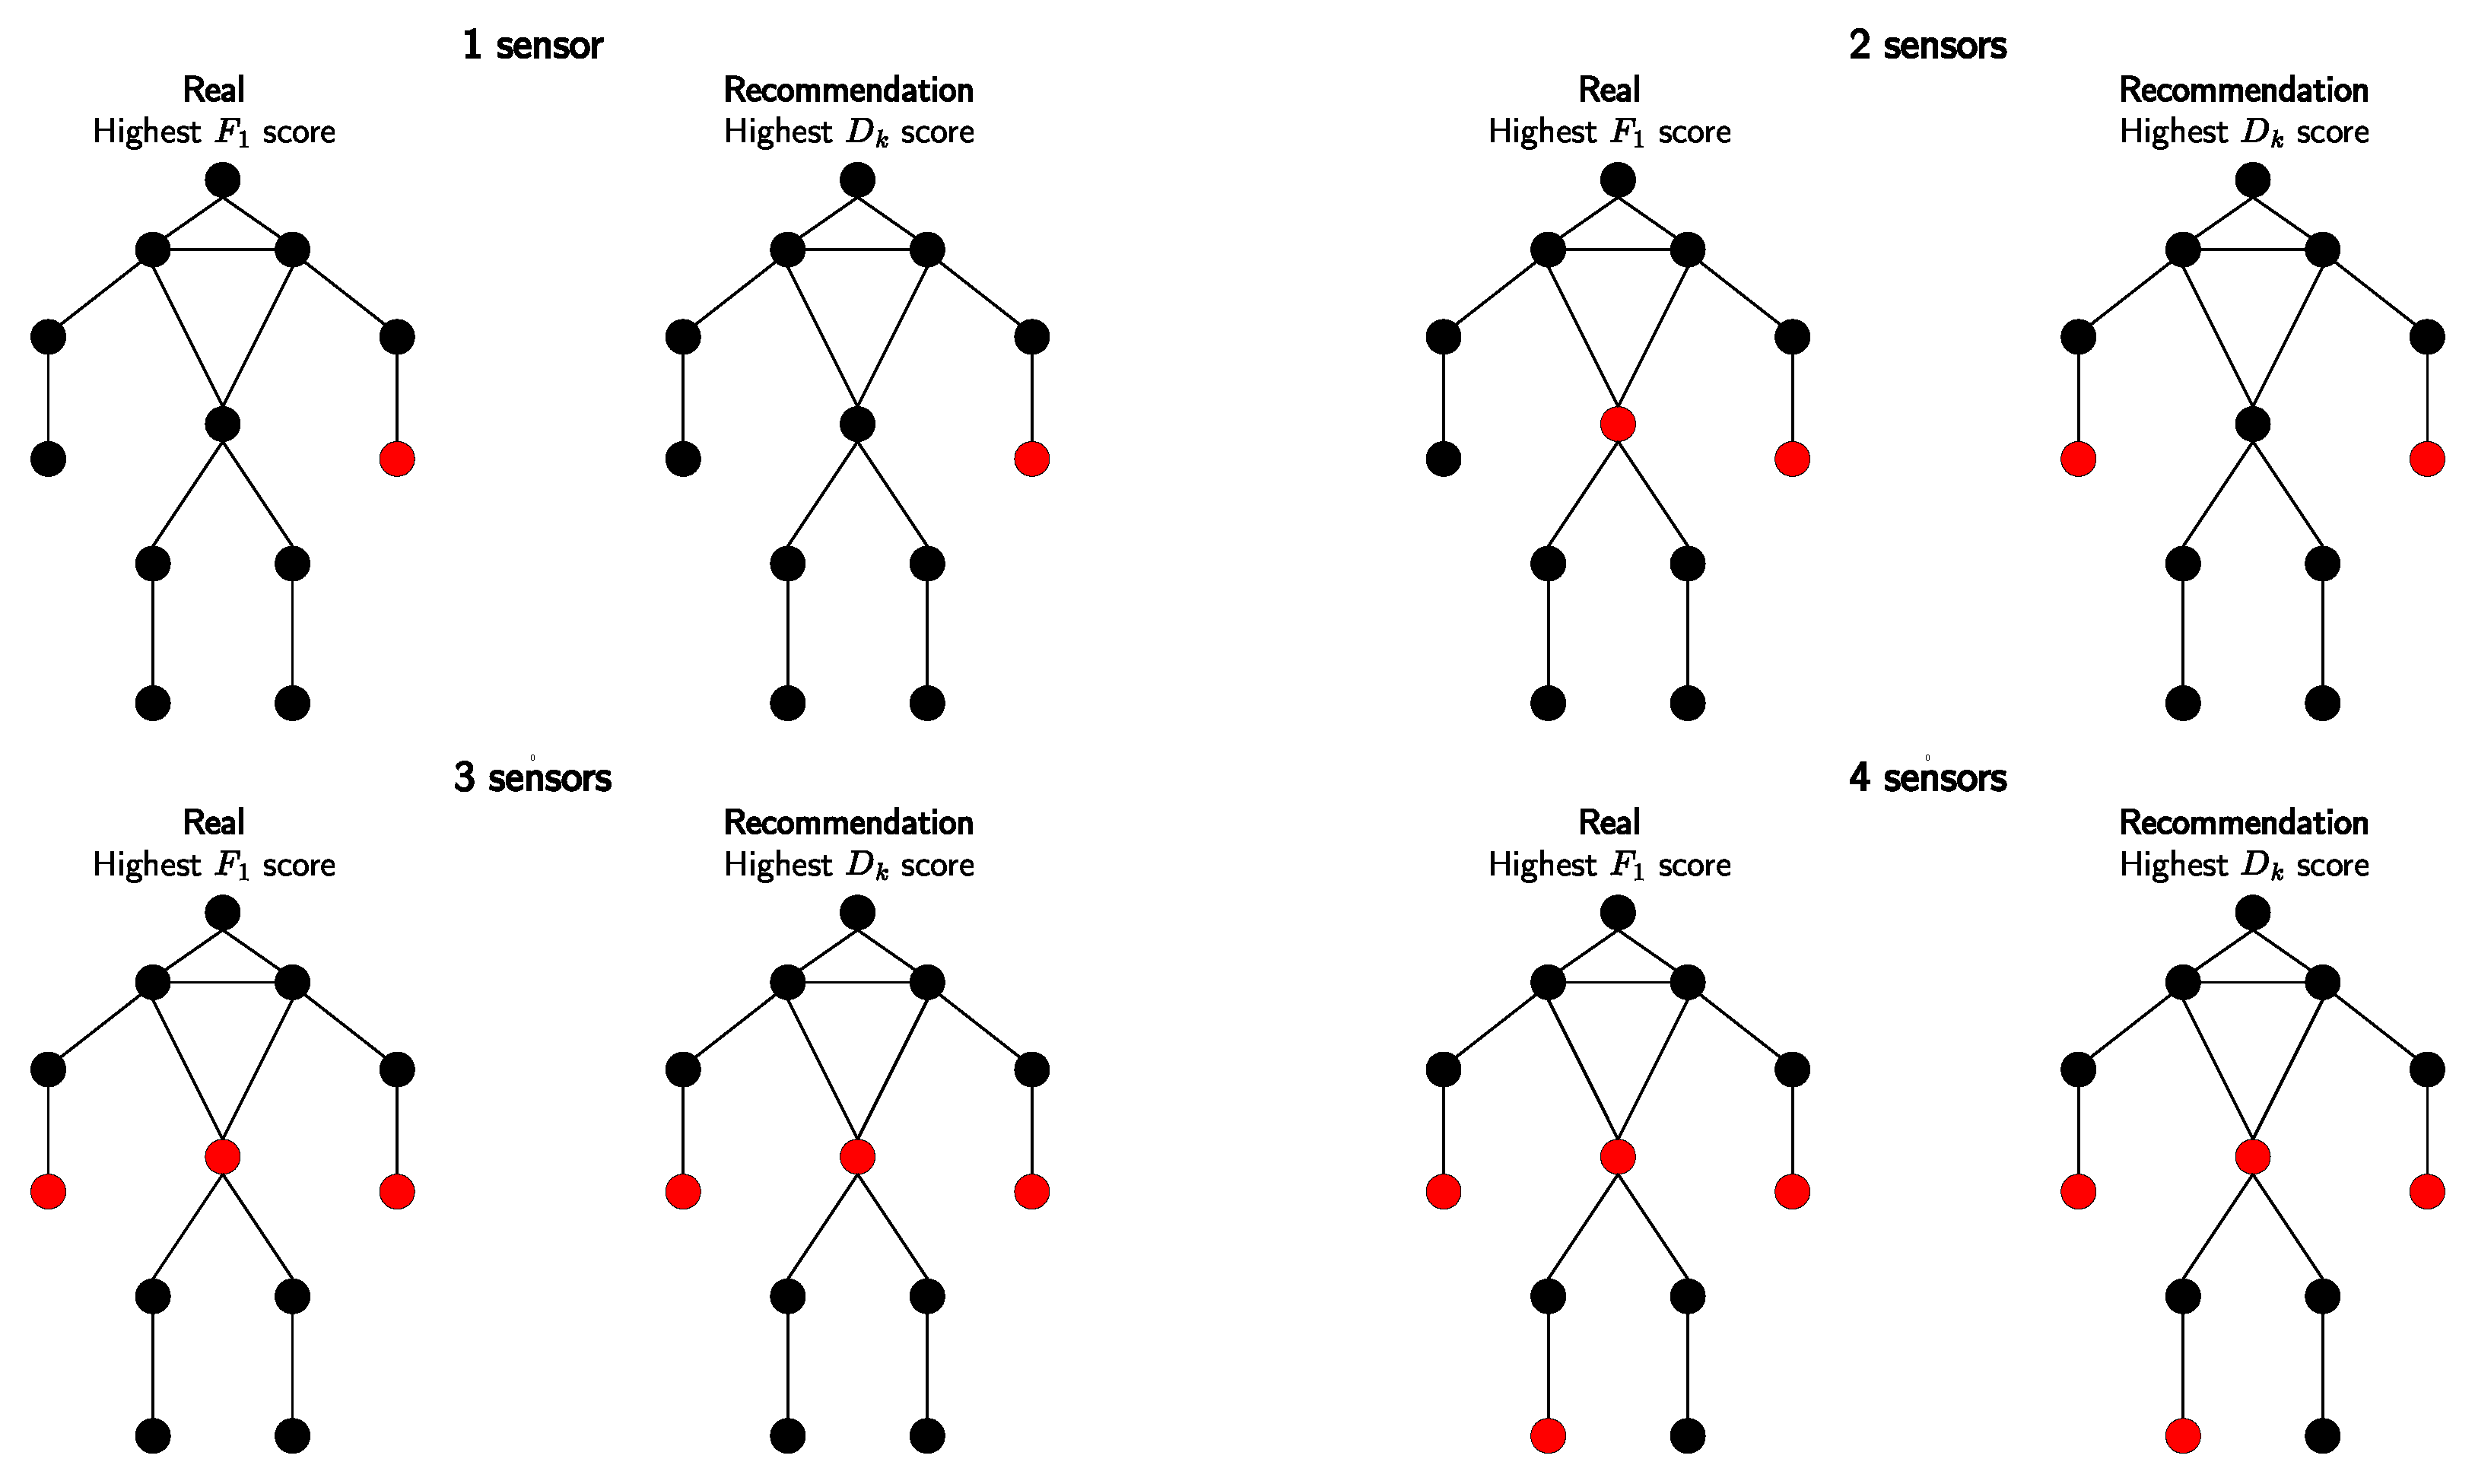
Figure 7.
Comparing sensor placements for nursing activity monitoring: F1 (left) vs. analysis (right). Optimal positions are highlighted in red. Each image reveals the best placement corresponding to the number of sensors available.
Figure 7.
Comparing sensor placements for nursing activity monitoring: F1 (left) vs. analysis (right). Optimal positions are highlighted in red. Each image reveals the best placement corresponding to the number of sensors available.
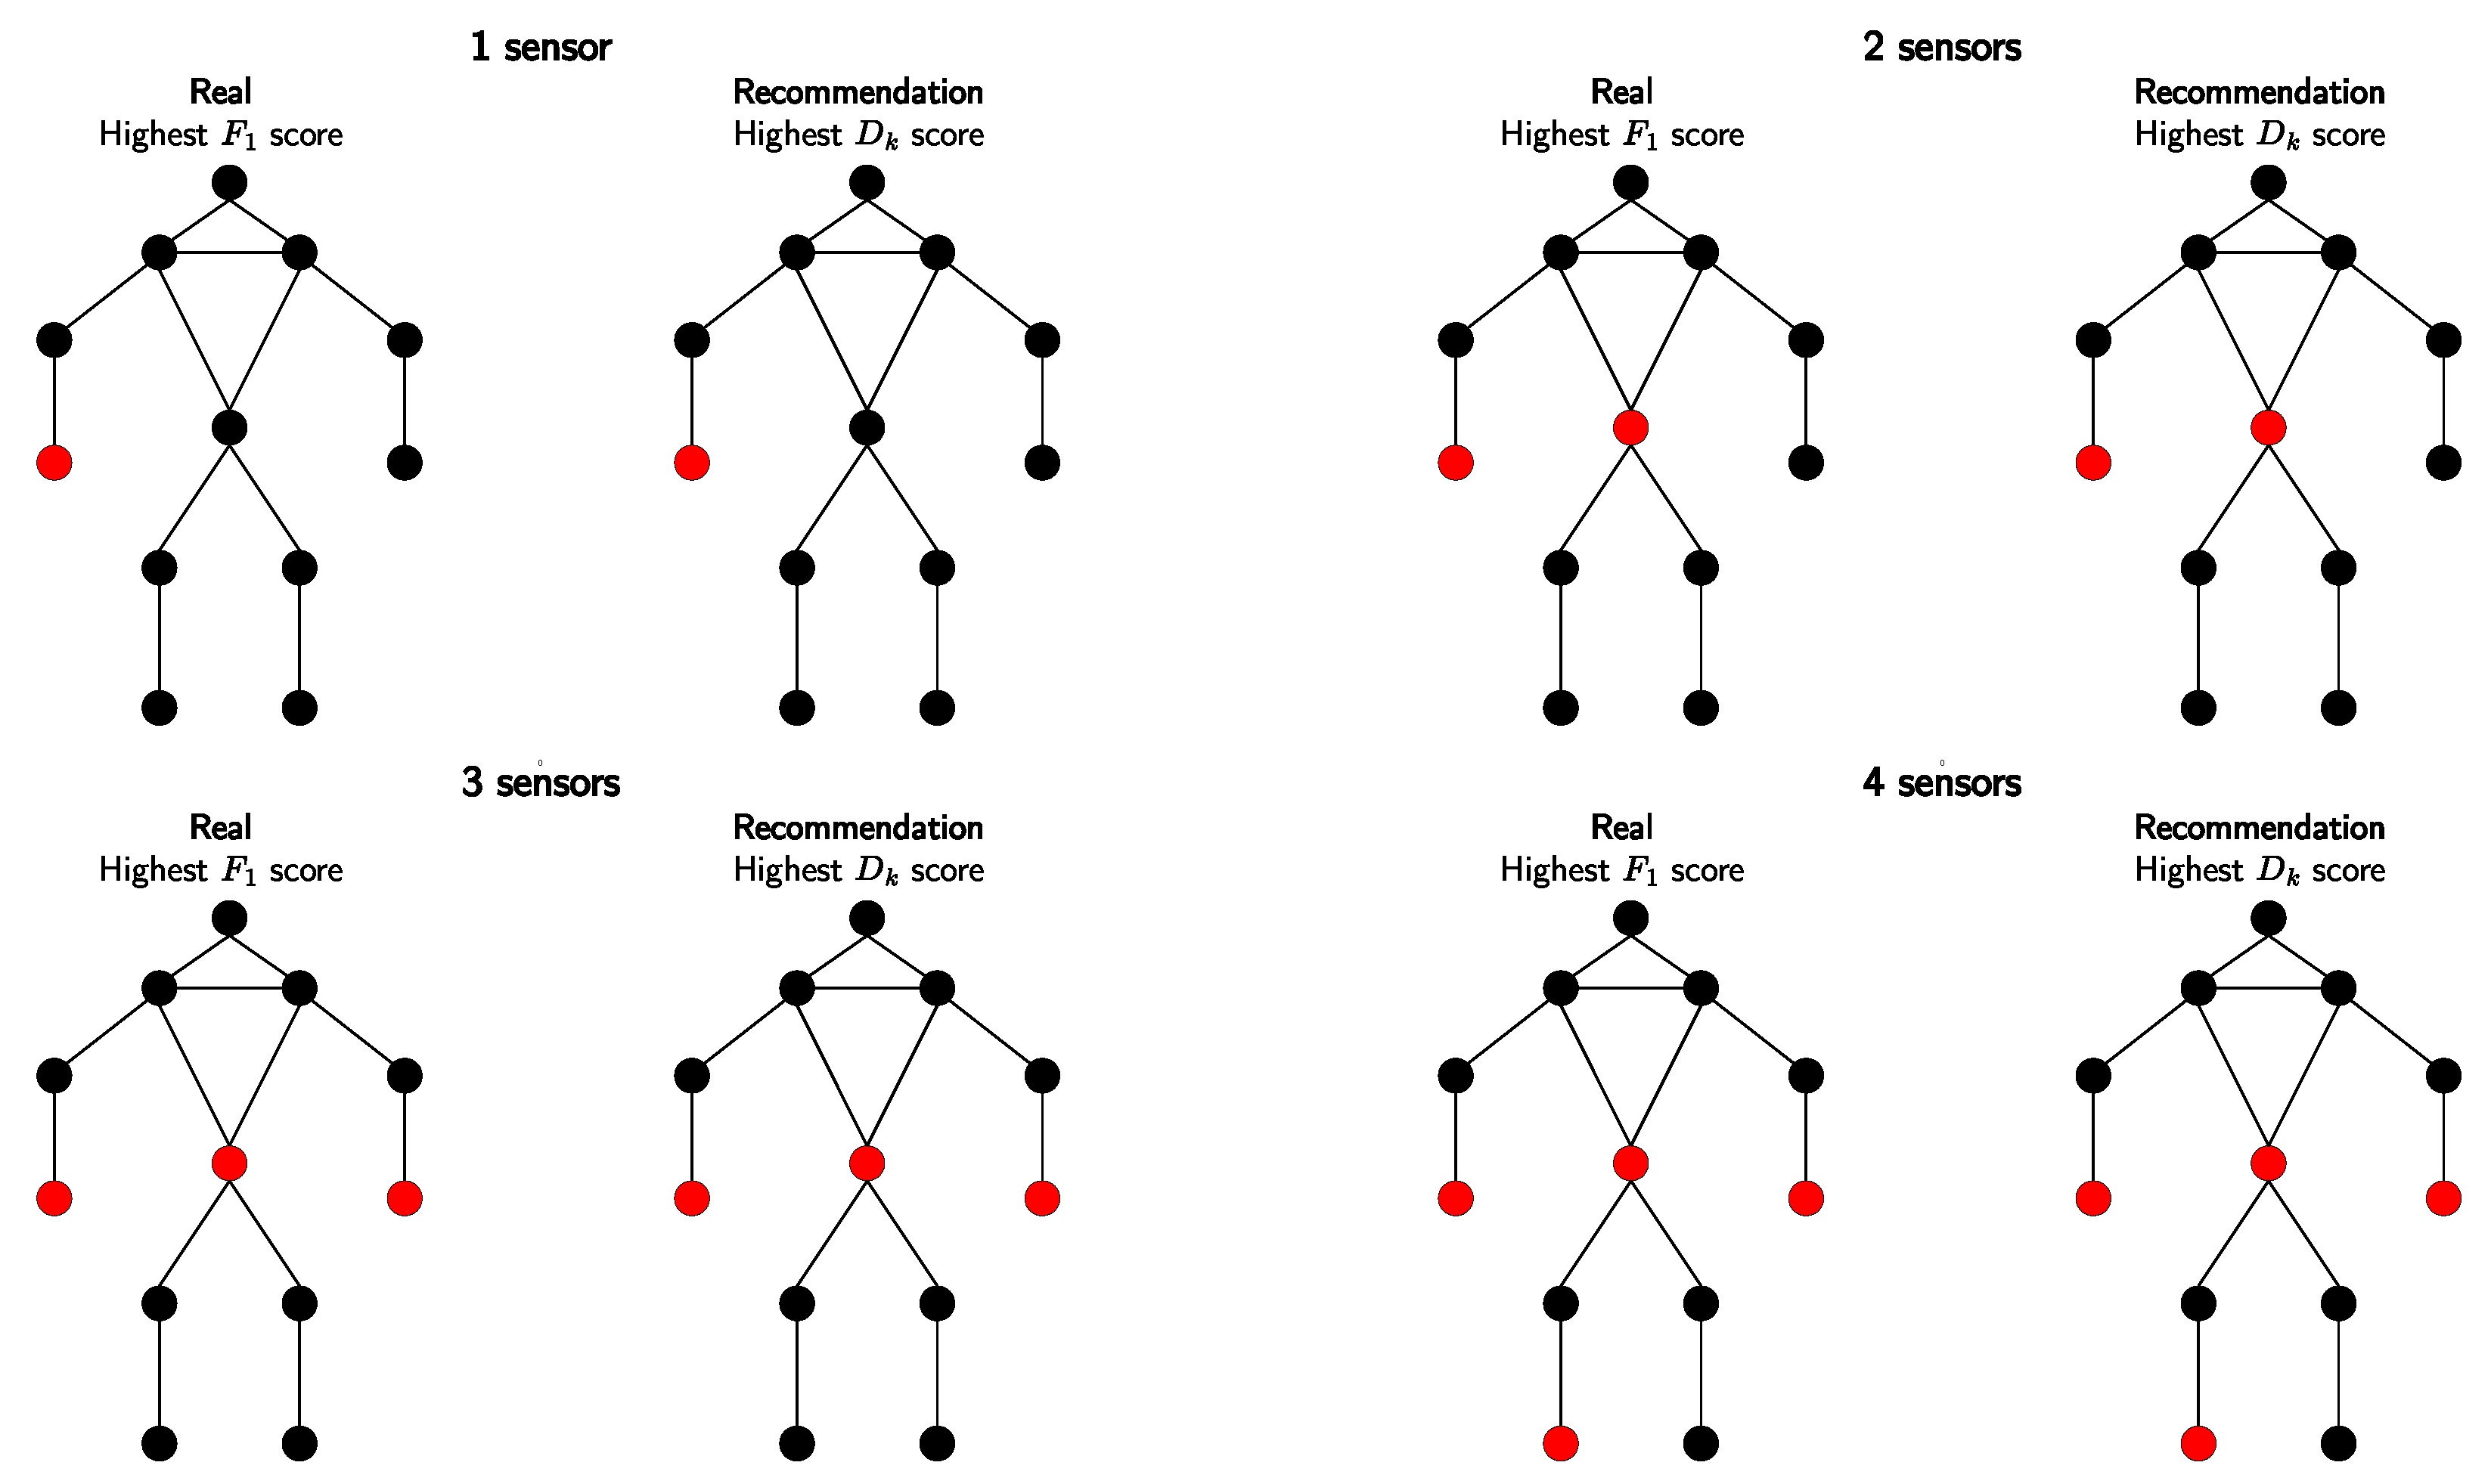
Figure 8.
Comparing sensor placements for DIP-IMU: F1 (left) vs. analysis (right). Optimal positions are highlighted in red. Each image reveals the best placement corresponding to the number of sensors available.
Figure 8.
Comparing sensor placements for DIP-IMU: F1 (left) vs. analysis (right). Optimal positions are highlighted in red. Each image reveals the best placement corresponding to the number of sensors available.
Table 1.
Comparison of sensor-based HAR frameworks and methods.
Table 1.
Comparison of sensor-based HAR frameworks and methods.
| | Helmy and Helmy [45] | Añazco et al. [46] | Köping et al. [47] | Mairittha et al. [48] | Gudur et al. [38] | Xia and Sugiura [25] | Kim et al. [49] | Ijaz et al. [50] | Google AR API [51] | Apple Motion [52] | Microsoft Kinect [53] | HARE (Ours)
|
|---|
| Data Collection | External Sensor Connectivity | ✗ | ✓ | ✓ | ✗ | ✗ | ✗ | ✗ | ✗ | ✗ | ✗ | ✗ | ✓ |
| Multimodal Recording | ✗ | ✗ | ✓ | ∼ | ✗ | ✗ | ✗ | ✓ | ✗ | ✗ | ✗ | ✓ |
| Extendability * | ∼ | ✗ | ✓ | ✓ | ✓ | ✗ | ✗ | ✗ | ✗ | ✗ | ✗ | ✓ |
| Classification | Real-time | ✓ | ✓ | ✓ | ∼ | ✗ | ✗ | ✗ | ✗ | ✗ | ✗ | ✓ | ✓ |
| Multimodality | ✗ | ✗ | ✓ | ✗ | ✗ | ✗ | ✗ | ✓ | ✗ | ✗ | ✗ | ✓ |
| Labeling | Refinement | ✗ | ✗ | ✗ | ✓ | ✗ | ✗ | ✗ | ✗ | ✓ | ✓ | ✗ | ✓ |
| Anonymization | ✗ | ✗ | ✗ | ✗ | ✗ | ✗ | ✓ | ✗ | ✓ | ✓ | ✓ | ✓ |
| Sensor Placement | Pose Estimation | ✗ | ✗ | ✗ | ✗ | ✗ | ✗ | ✗ | ✗ | ✓ | ✓ | ✗ | ✓ |
| Optimal Position | ✗ | ✗ | ✗ | ✗ | ✗ | ✓ | ✗ | ✗ | ✗ | ✗ | ✗ | ✓ |
| ML-based Feedback | On-Device Training | ✗ | ✗ | ✗ | ✗ | ✓ | ✗ | ✗ | ✗ | ✗ | ✗ | ✗ | ✓ |
| Human-in-the-Loop | ✗ | ✗ | ✗ | ✓ | ✓ | ✗ | ✗ | ✗ | ✗ | ✗ | ✗ | ✓ |
| Extended Logging | ✗ | ✗ | ✗ | ✗ | ✗ | ✗ | ✗ | ✗ | ✗ | ✓ | ✗ | ✓ |
Table 2.
We compare the baseline results of three deep learning models (CNN-LSTM, ResNet, and DeepConvLSTM) with Accuracy (higher is better) and F1 score (higher is better) using three cross-validation methods (k-fold, leave-recordings-out, and leave-one-subject-out) with five sensors. The standard deviation is reported with the ± symbol. We embolden the model per column.
| Model | k-Fold | Leave-Recordings-Out | Leave-One-Subject-Out |
|---|
| Accuracy | F1 | Accuracy | F1 | Accuracy | F1 |
|---|
| CNN-LSTM | 0.832 | 0.830 | 0.632 | 0.630 | 0.565 | 0.556 |
| ResNet | 0.864 | 0.864 | 0.600 | 0.603 | 0.531 | 0.527 |
| DeepConvLSTM | 0.735 | 0.730 | 0.563 | 0.565 | 0.525 | 0.515 |
Table 3.
Classification results obtained for three different input data modalities: IMU, pose estimation, and the combination of IMU and pose estimation (IMU+pose estimation), using three evaluation methods: k-fold, leave-recordings-out, and leave-one-subject-out. The experiments were conducted to classify high-level activities constituting complex activities in nursing. We report the same metrics for each combination of input data and evaluation methods. We embolden the model per column.
| Input Data | k-Fold | Leave-Recordings-Out | Leave-One-Subject-Out |
|---|
| Accuracy | F1 | Accuracy | F1 | Accuracy | F1 |
|---|
| IMU | 0.823 | 0.822 | 0.615 | 0.611 | 0.489 | 0.474 |
| Pose Estimation | 0.421 | 0.361 | 0.424 | 0.410 | 0.359 | 0.281 |
| IMU + Pose Estimation | 0.838 | 0.836 | 0.641 | 0.638 | 0.501 | 0.478 |
Table 4.
Classification results obtained for three different input data modalities: IMU, Pose Estimation, and the combination of IMU and Pose Estimation (IMU+pose estimation), using three evaluation methods: k-fold, leave-recordings-out, and leave-one-subject-out. The experiments were conducted to classify low-level activities constituting simple activities of daily living. We embolden the best model per column.
| Input Data | k-Fold | Leave-Recordings-Out | Leave-One-Subject-Out |
|---|
| Accuracy | F1 | Accuracy | F1 | Accuracy | F1 |
|---|
| IMU | 0.912 | 0.912 | 0.895 | 0.893 | 0.860 | 0.854 |
| Pose Estimation | 0.533 | 0.465 | 0.550 | 0.532 | 0.569 | 0.511 |
| IMU + Pose Estimation | 0.920 | 0.917 | 0.902 | 0.898 | 0.887 | 0.871 |
Table 5.
The classification results for different models with offline and on-device training are compared. We show three different models (CNN-LSTM, ResNet, and DeepConvLSTM) with both offline and on-device training for the nursing activity dataset. The best scores are emboldened row-wise per metric. We report the same metrics for each combination of input data and evaluation methods. We embolden the best model per column.
| Model | Offline Training | On-Device Training |
|---|
| Accuracy | F1 | Accuracy | F1 |
|---|
| CNN-LSTM | 0.352 | 0.310 | 0.527 | 0.492 |
| ResNet | 0.487 | 0.473 | 0.489 | 0.495 |
| DeepConvLSTM | 0.320 | 0.193 | 0.416 | 0.237 |
Table 6.
The classification results for different models with offline and on-device training are compared. We show three different models (CNN-LSTM, ResNet, and DeepConvLSTM) with both offline and on-device training for the OPPORTUNITY dataset. The best scores are emboldened row-wise per metric.
Table 6.
The classification results for different models with offline and on-device training are compared. We show three different models (CNN-LSTM, ResNet, and DeepConvLSTM) with both offline and on-device training for the OPPORTUNITY dataset. The best scores are emboldened row-wise per metric.
| Model | Offline Training | On-Device Training |
|---|
| Accuracy | F1 | Accuracy | F1 |
|---|
| CNN-LSTM | 0.644 | 0.612 | 0.745 | 0.703 |
| ResNet | 0.493 | 0.487 | 0.727 | 0.671 |
| DeepConvLSTM | 0.598 | 0.599 | 0.654 | 0.615 |
Table 7.
The classification results for different models with offline and on-device training are compared. We show three different models (CNN-LSTM, ResNet, and DeepConvLSTM) with both offline and on-device training for the gait analysis dataset. The best scores are emboldened row-wise per metric.
Table 7.
The classification results for different models with offline and on-device training are compared. We show three different models (CNN-LSTM, ResNet, and DeepConvLSTM) with both offline and on-device training for the gait analysis dataset. The best scores are emboldened row-wise per metric.
| Model | Offline Training | On-Device Training |
|---|
| Accuracy | F1 | Accuracy | F1 |
|---|
| CNN-LSTM | 0.607 | 0.598 | 0.832 | 0.821 |
| ResNet | 0.580 | 0.576 | 0.863 | 0.847 |
| DeepConvLSTM | 0.578 | 0.530 | 0.817 | 0.813 |


 ,
, 


