
Structural Health Monitoring Design and Performance Evaluation of a Middle-Span Bridge


Abstract
:1. Introduction
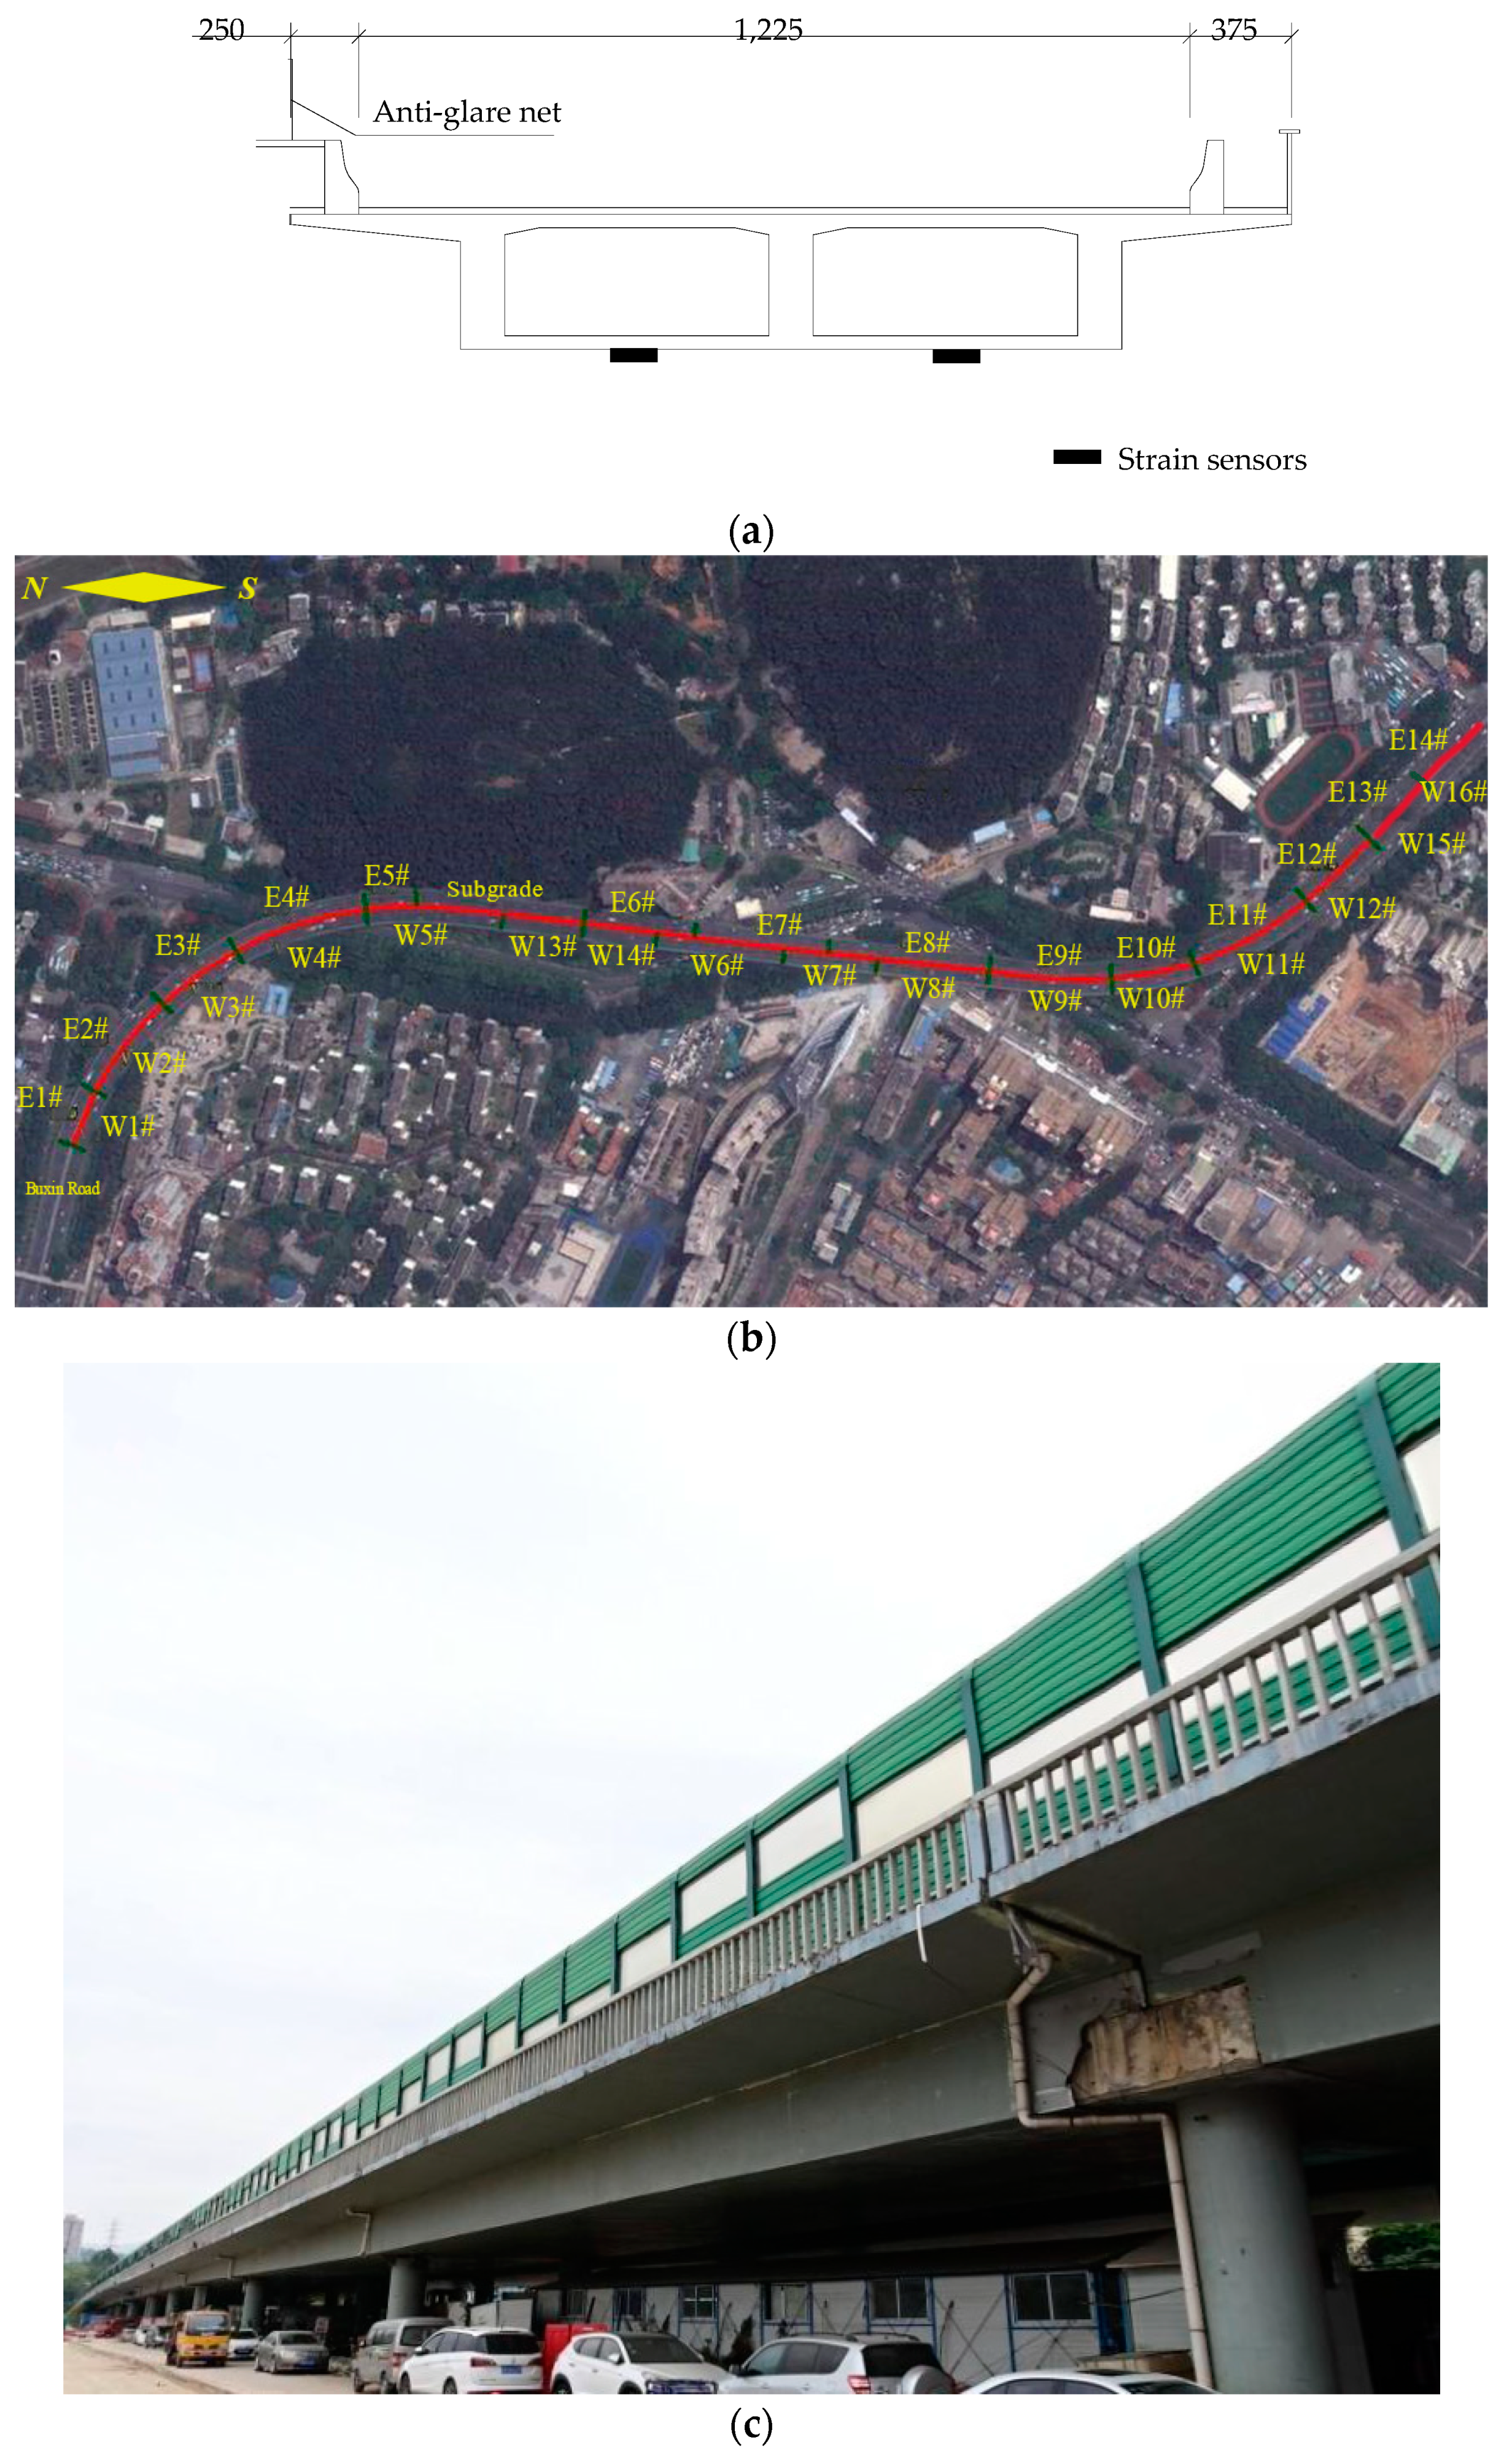
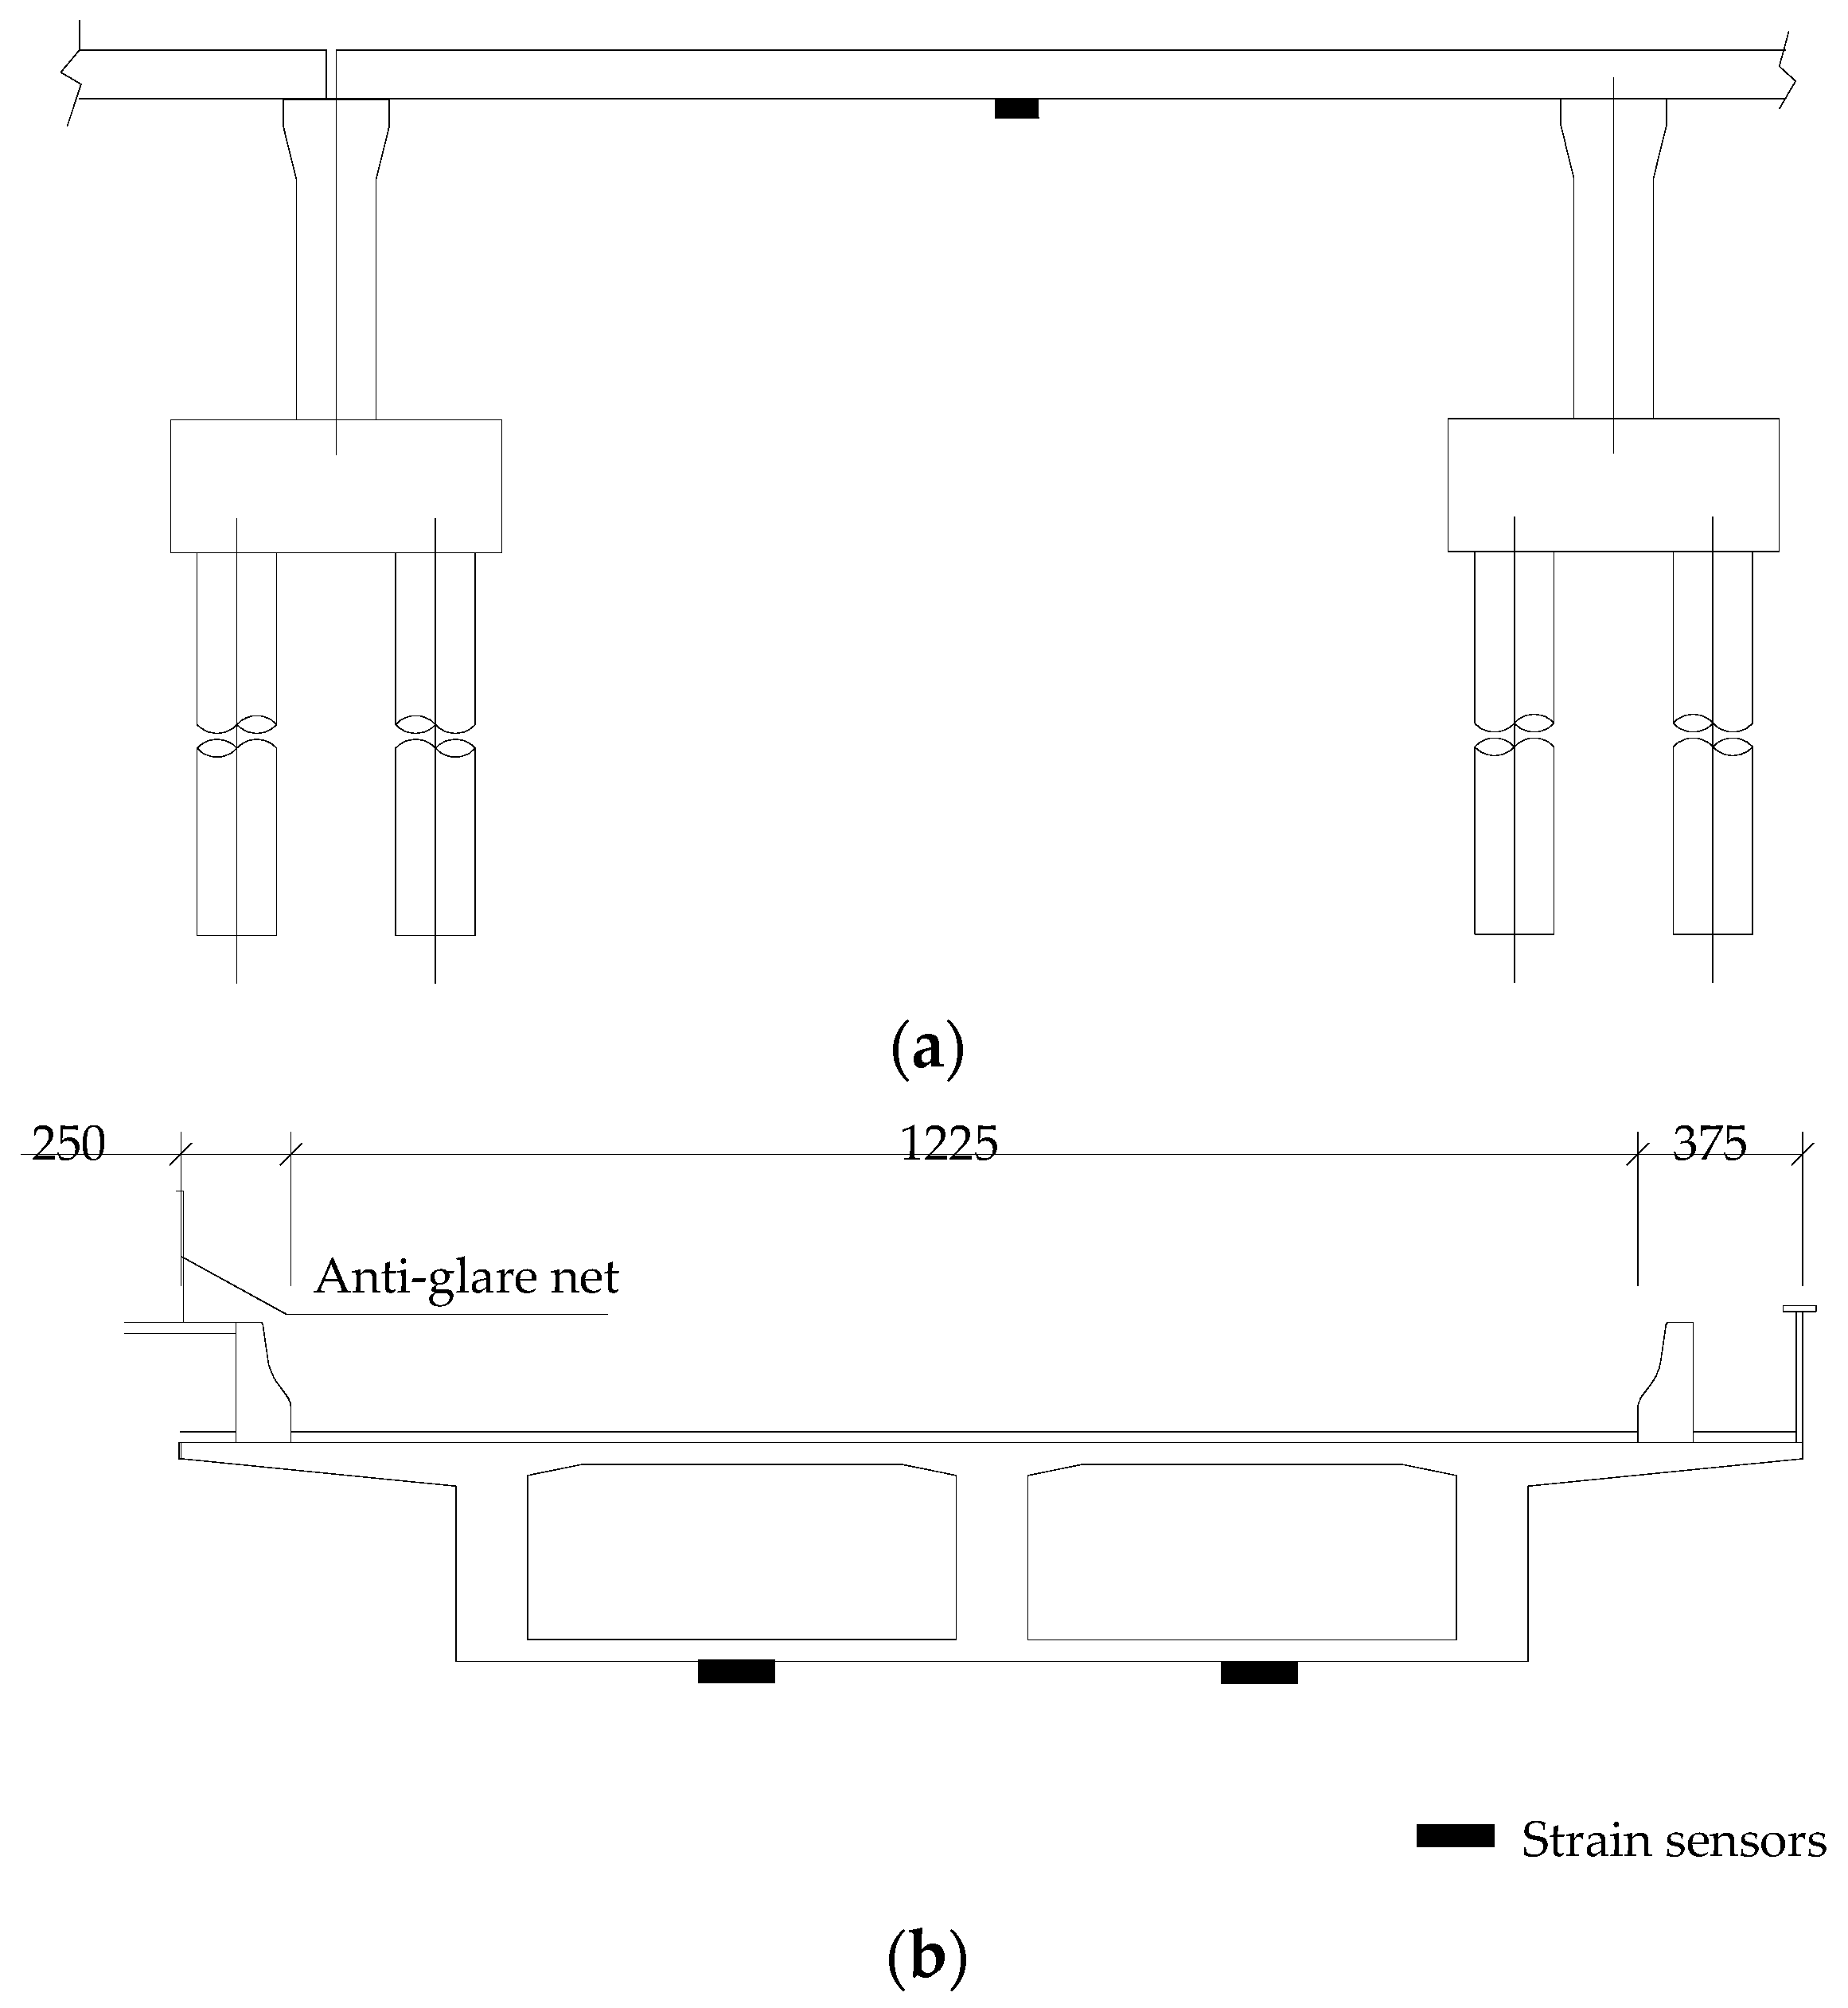
2. Target Bridge
- (1)
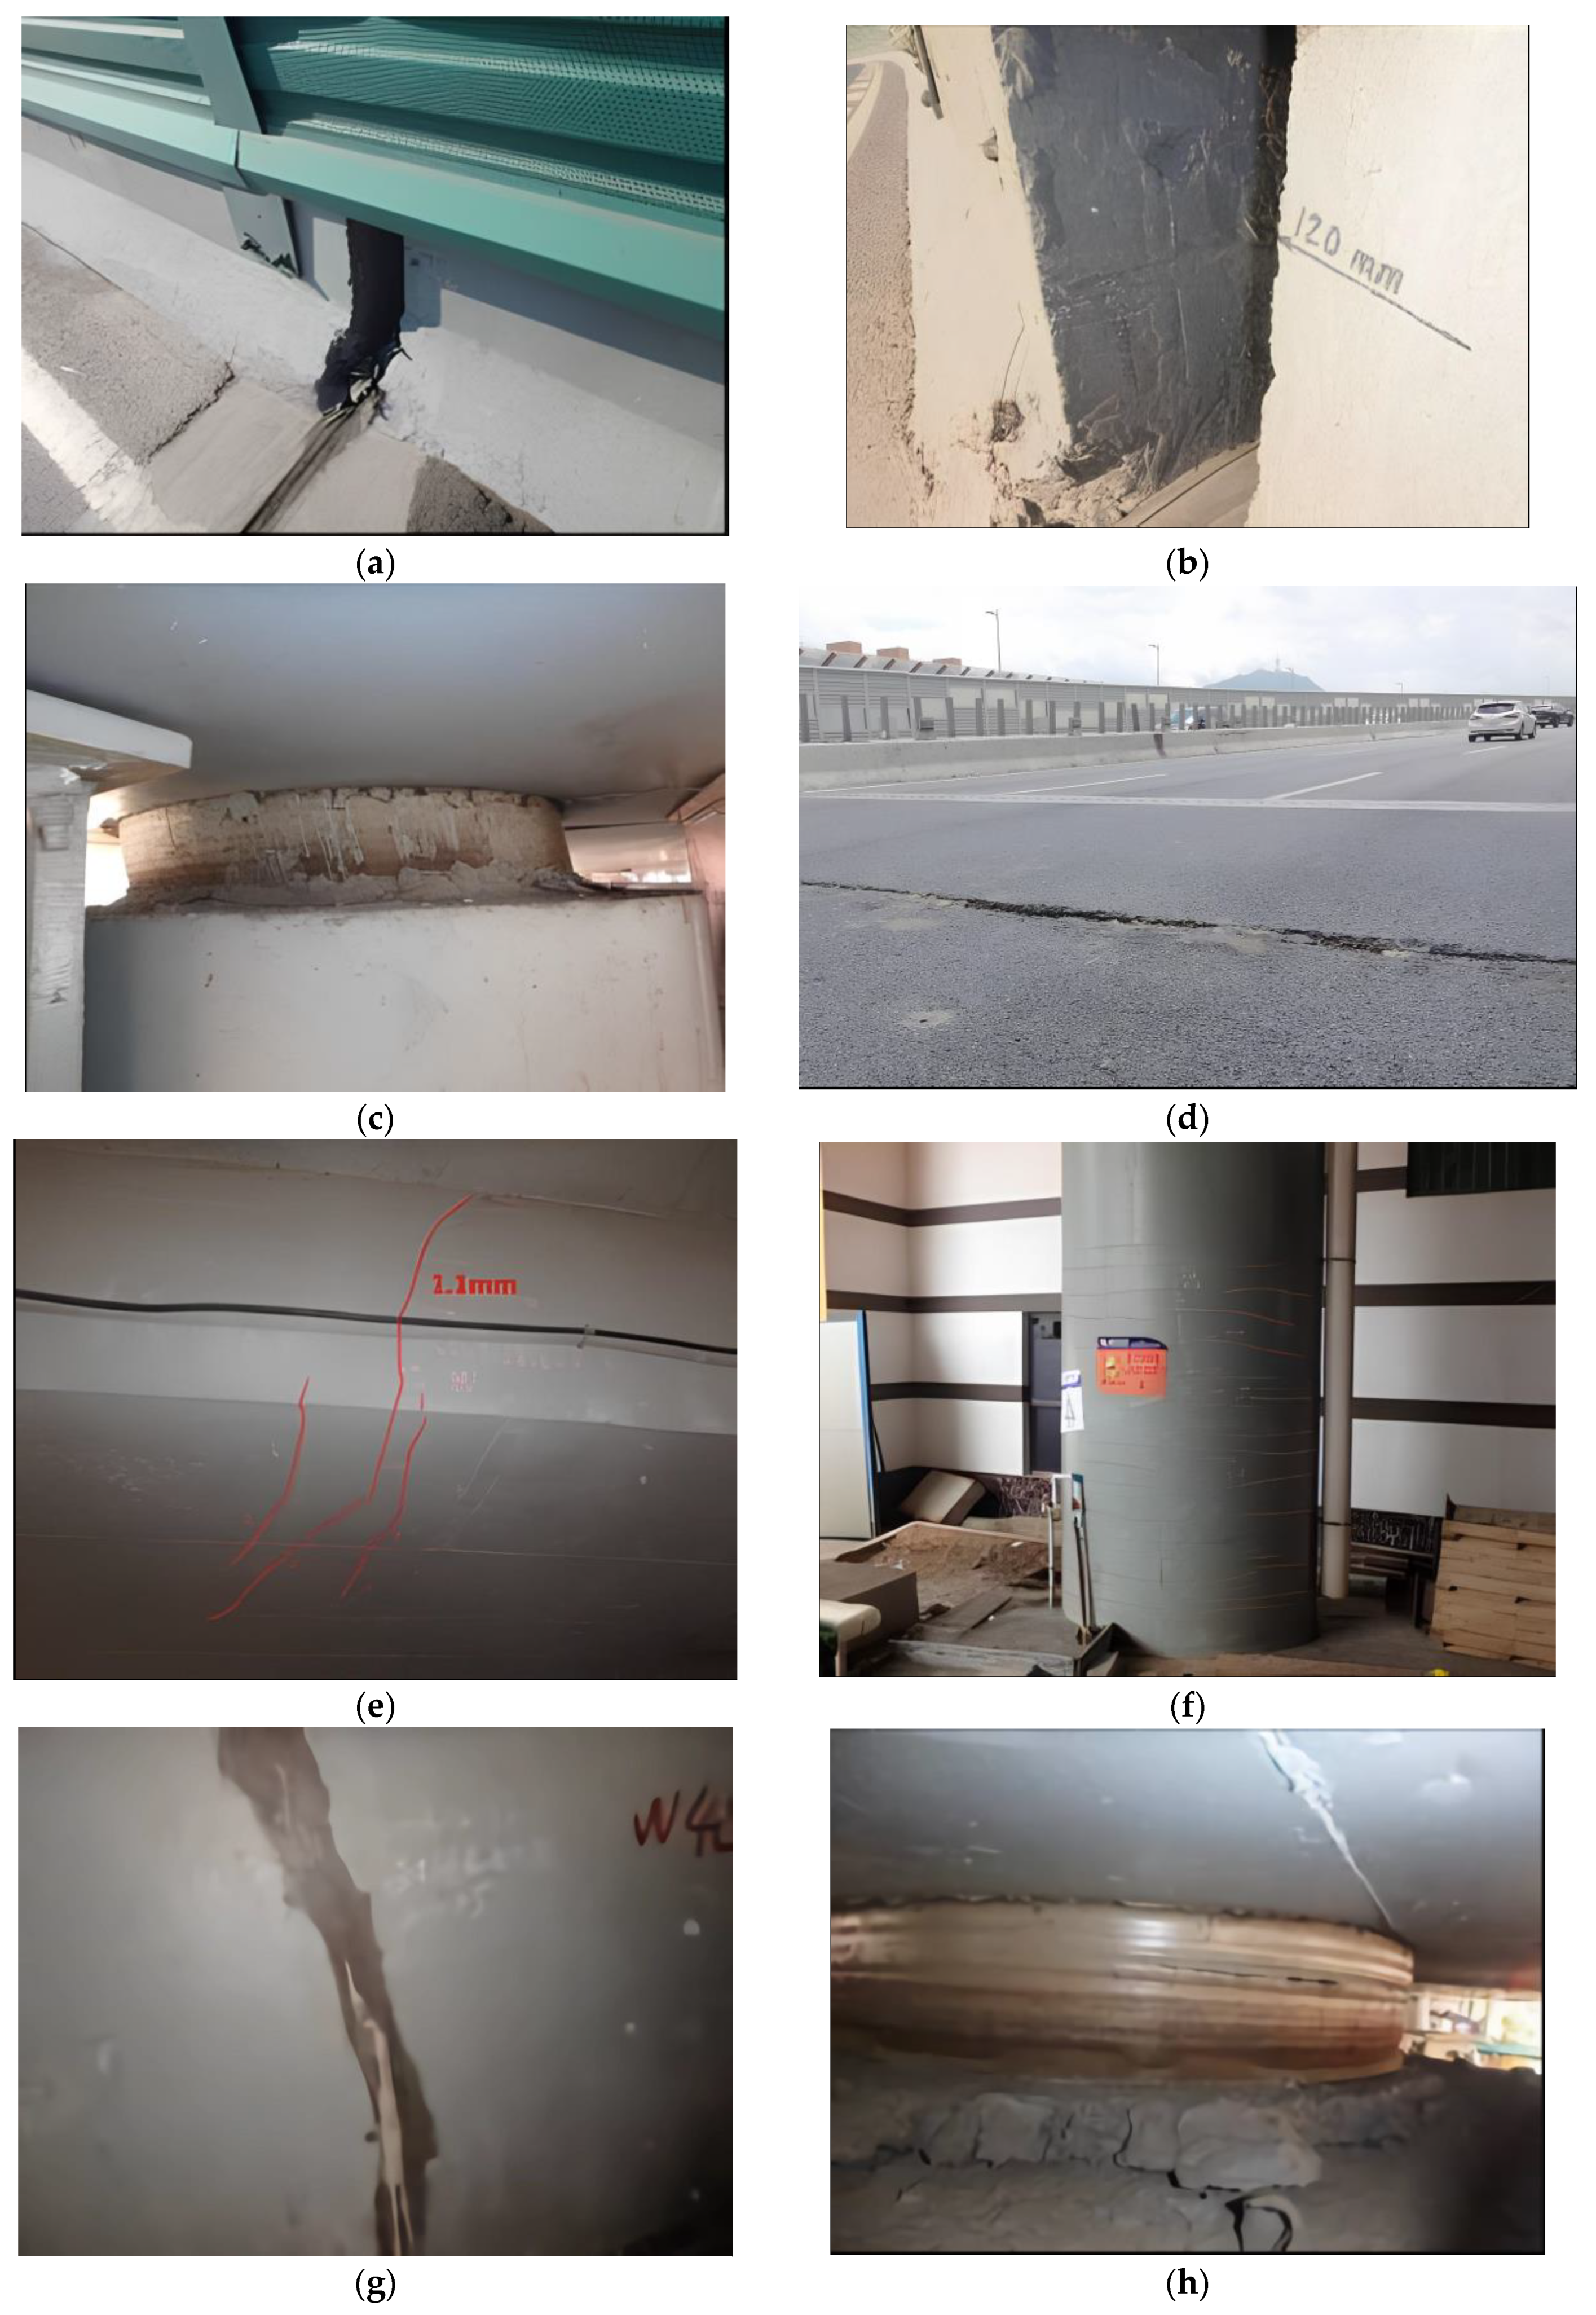
- In August 2011, the phenomenon of relative vertical dislocation was observed between the decks of the middle spans E16#, E17#, E18#, E21#, E23#, and E24#, as well as the corresponding parts of the west bridge, with a vertical height difference of approximately 6–9 cm.
- (2)
- In November 2012, bridges 2#, 3#, and 4# were found to be displaced to the outside of the curve to varying degrees, with bridge 3# being the most serious, with an average value of 8.0 cm and a maximum value of 10.0 cm. At the same time, varying degrees of cracking were found in the webs and bottom plates of prestressed concrete box girders in the east and west bridges 2#, 3#, and 4#.
- (3)
- In June 2013, it was observed that bridge 3# in the east had a tendency of creeping to the outside again.
- (4)
- In August 2013, an emergency inspection of the bridge was conducted, and the inspection results showed that the bridge had the following main issues:
- (a)
- The results of the beam inspection indicated that vertical cracks were present in the webs of all bridges, except for the extension section of the target bridge. Furthermore, horizontal cracks were observed in the bottom plate, particularly in the curved bridge section.
- (b)
- Circumferential cracking was detected on the inner side of the root curve or the outer side of the upper curve of some curved-beam split piers.
- (c)
- The longitudinal movable support mainly exhibited the phenomenon of the upper steel plate sliding longitudinally relative to the lower steel basin.
- (5)
- In July 2014, the corresponding repair and reinforcement measures for the detected bridge faults were completed. Minor cracks measuring less than 0.2 mm were sealed with grouting, while larger cracks exceeding 0.2 mm were reinforced by wrapping steel plates. As for the lateral slip issue of the curved beam, a combination of pier beam consolidation and installation of steel plate anchor bolt limit devices was employed for reinforcement treatment.
- (6)
- In December 2016 to January 2017, upon conducting several subsequent inspections of the bridge, it was discovered that the lateral slip problem of the curved beam, which had been a concern prior to the reinforcement work, had been effectively resolved. However it was also identified that several other problems still persisted:
- (a)
- The cracks in the corbel of the beam body and the circumferential cracking of the piers at the split pier of W10 and W11 spans still existed.
- (b)
- The newly discovered oblique cracks in the outer web of E11 and E12 span were of significant concern due to their severity.
- (c)
- The common pier column of the E27–W31 east-west bridge exhibited the most serious cracking, with oblique cracks present at both the root and upper portions of the column. In addition, circumferential cracks were observed to be expanding at the top of the No.1 pier of W40 in the straight section. Furthermore, 20, 12, and 8 circumferential cracks were identified in piers W34#, W36-2#, and W40-2#, respectively, with the maximum width of these cracks measuring 0.15 mm.
- (d)
- The cracks in the inner and outer webs of the E12# pier, which are about 4 m away from the E12# pier, had developed significantly, with the maximum width of the crack in the middle web being 1.1 mm and the maximum width of the crack in the oblique bottom slab being 0.32 mm.
3. SHM Design of the Bridge
3.1. Monitoring Items
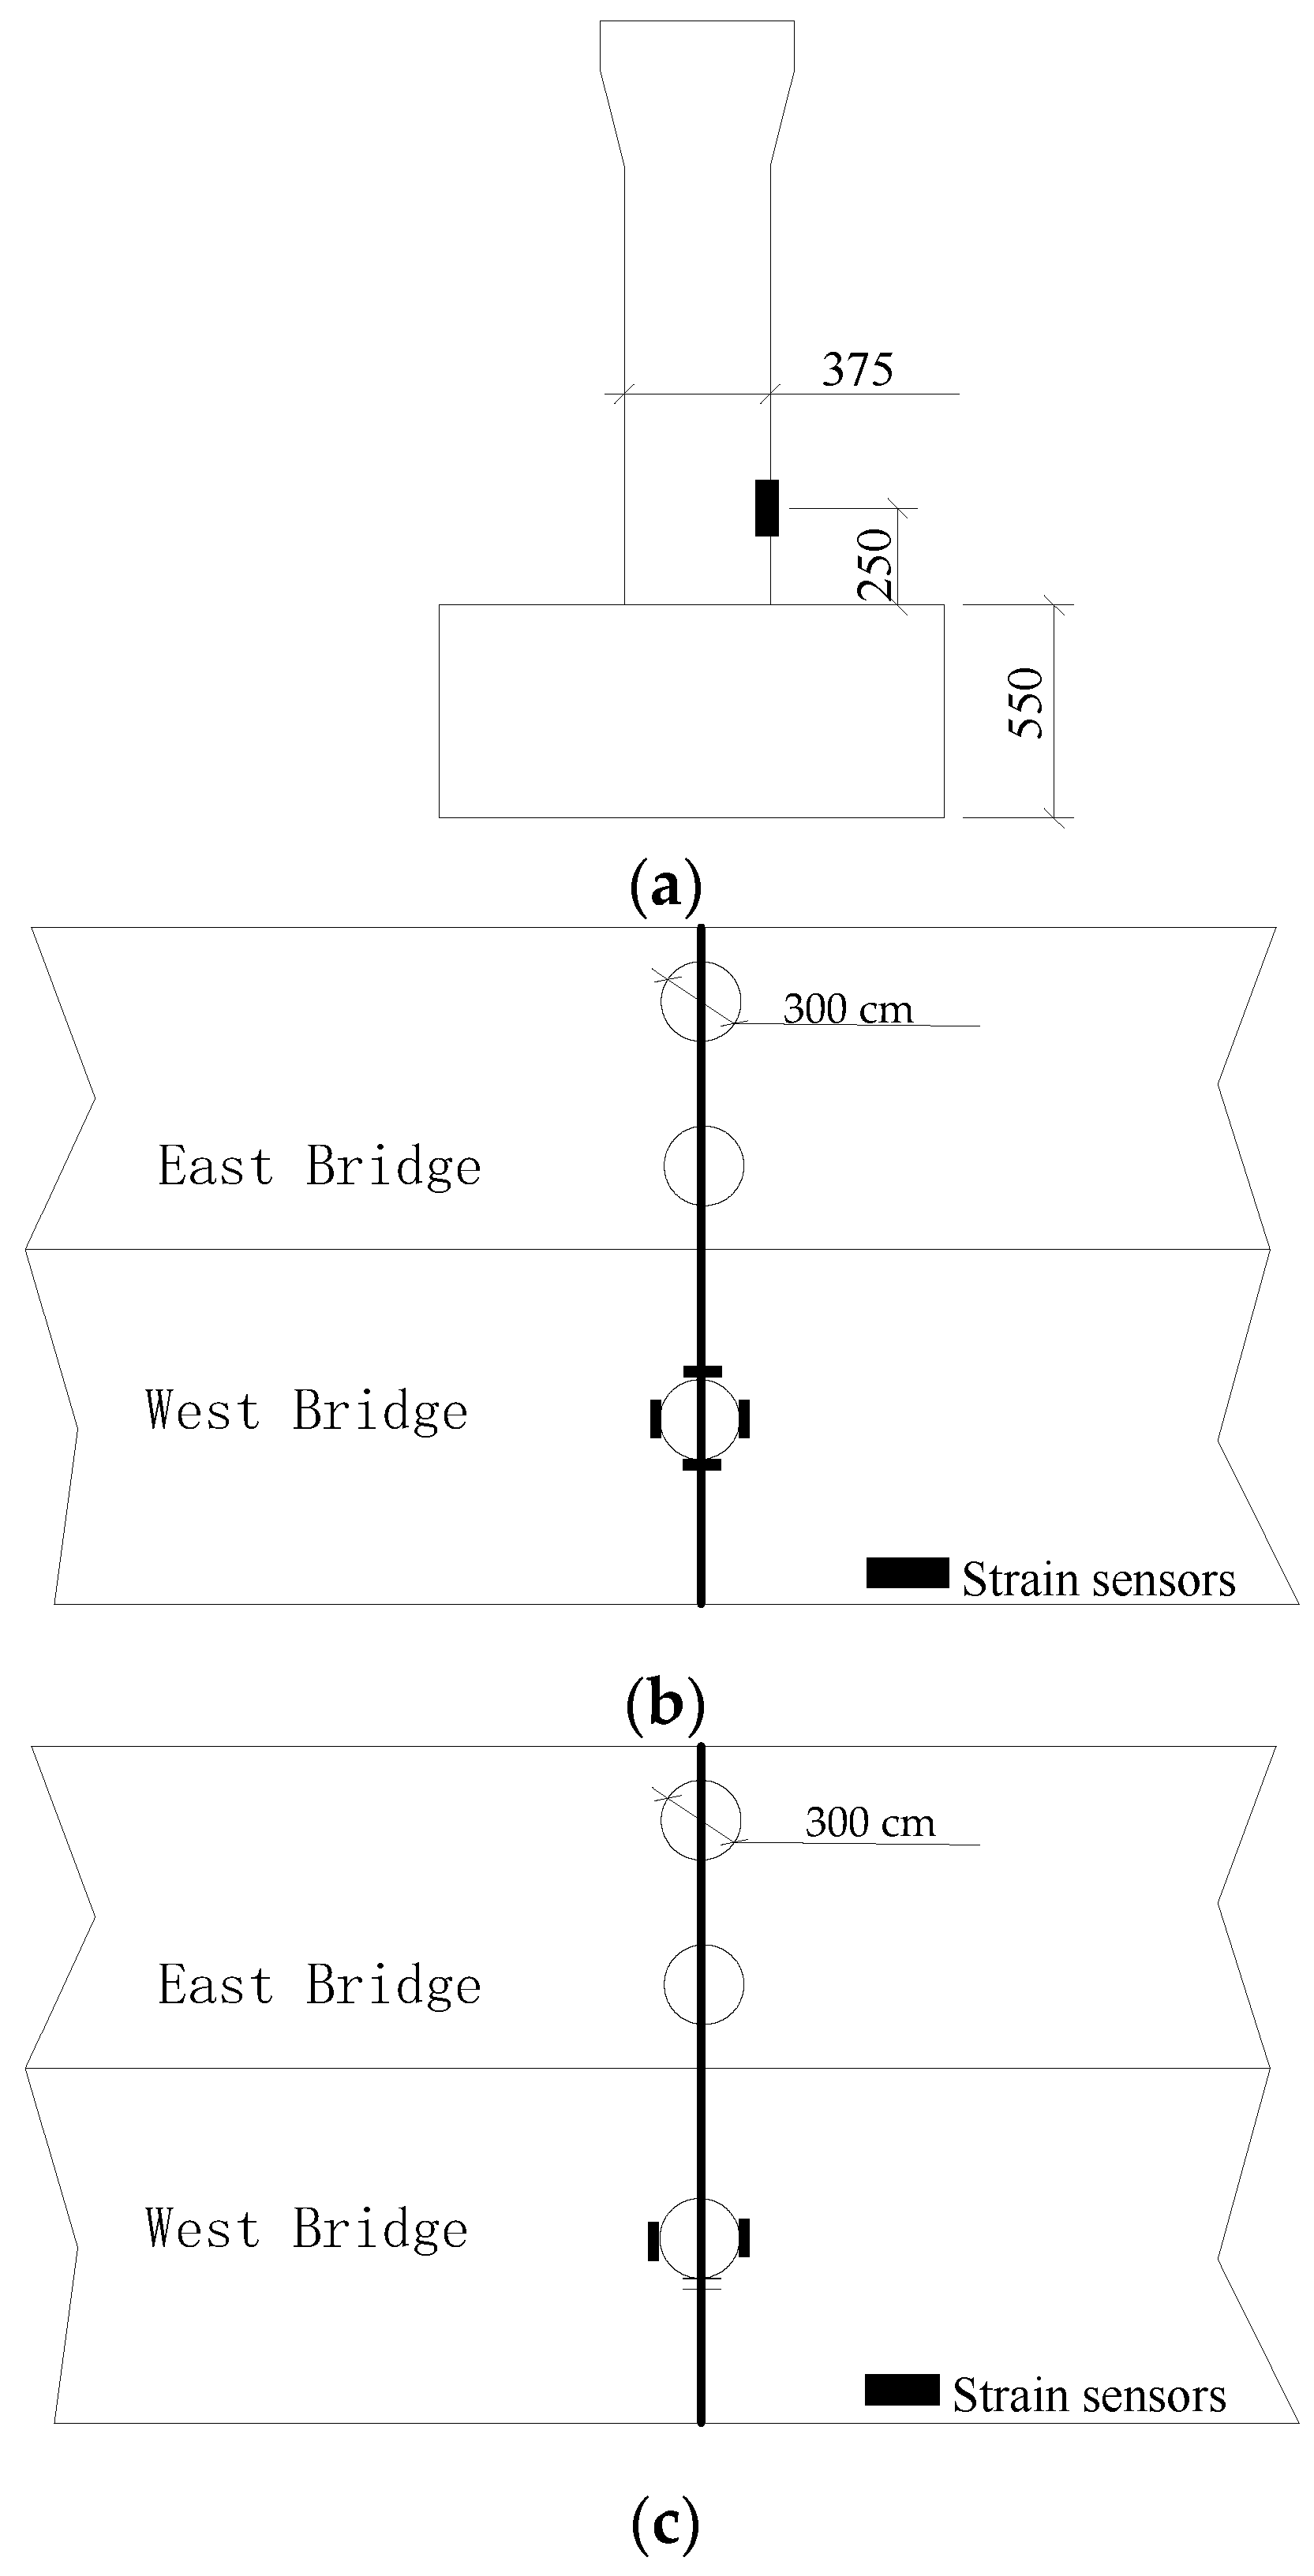
- (1)
- Strain monitoring of the main girder: strain sensors are installed to monitor the strain of critical sections and high-risk points of the main girder (See Figure 3a).
- (2)
- Bridge pier strain monitoring: strain sensors are installed to monitor the strain (stress) of key sections of bridge piers (See Figure 3a).
- (3)
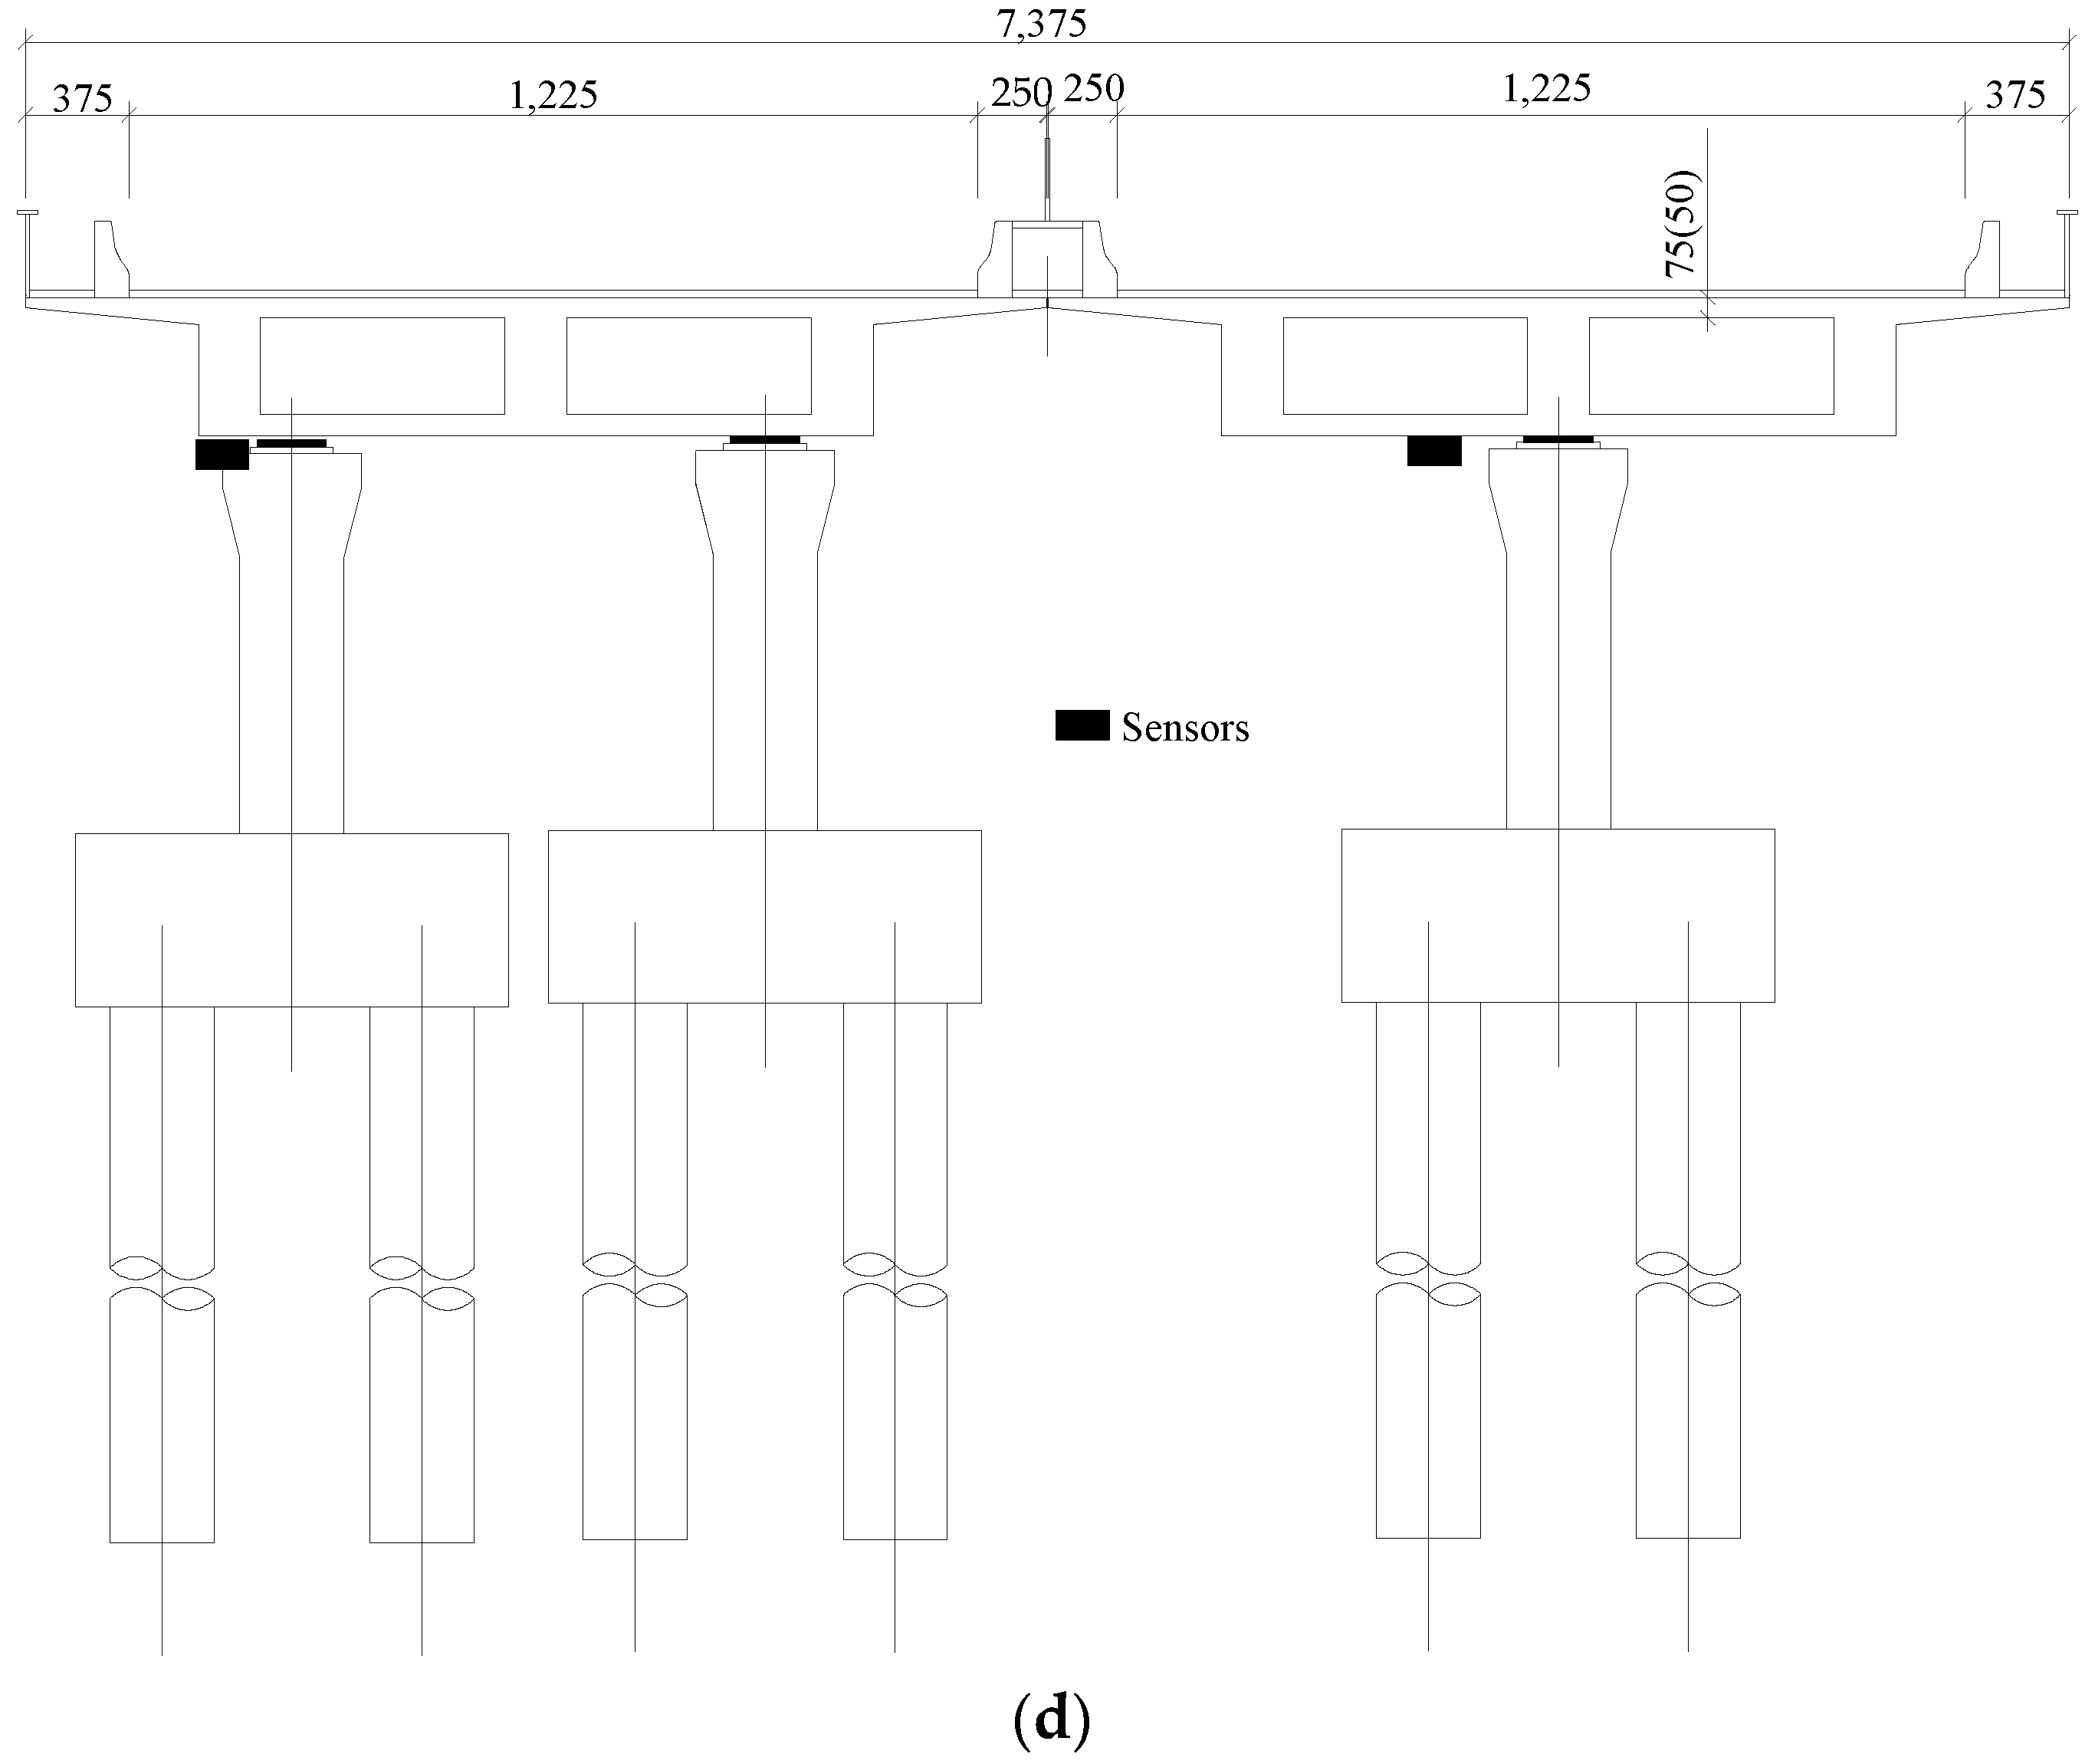
- Monitoring of main beam creep: the magnetostrictive displacement sensors are installed to monitor the relative displacement between the beam body and the pier structure (including the status of supports and limiting devices) in the area where main beam creep may occur (See Figure 3b).
- (4)
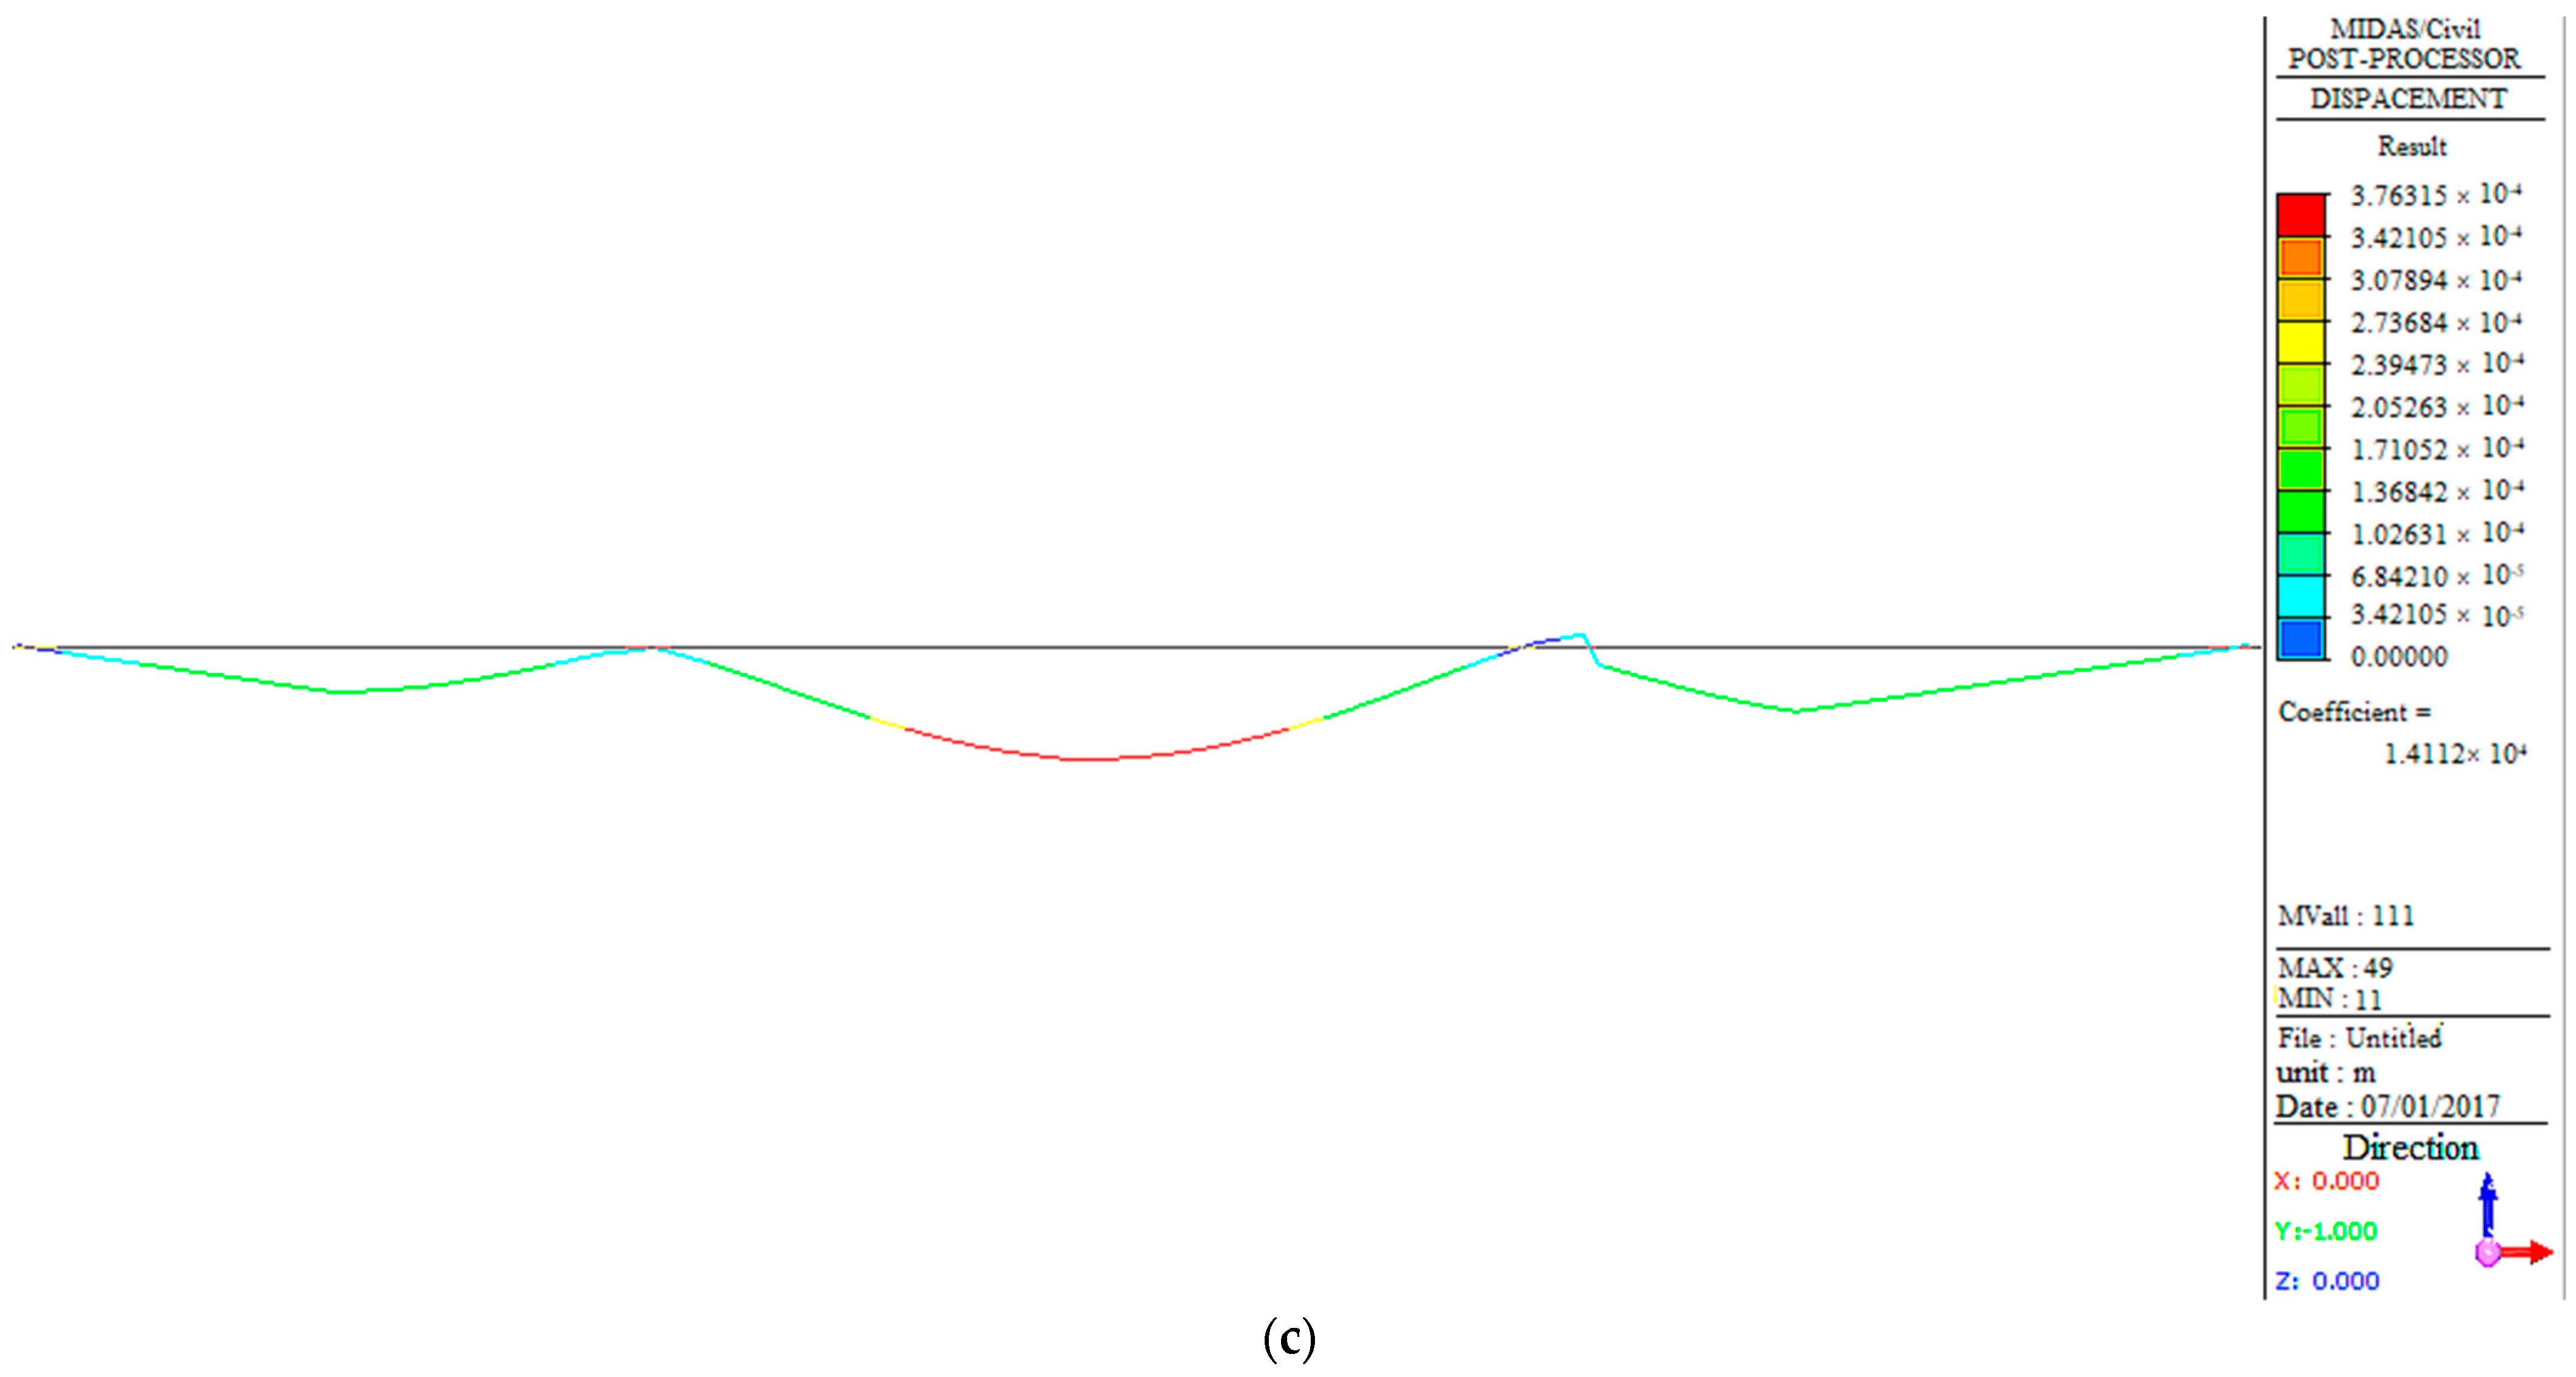
- Crack width monitoring: crack width changes are monitored using a seam gauge for critical cracks at the bottom of the main beam and the pier (See Figure 3c).
- (5)
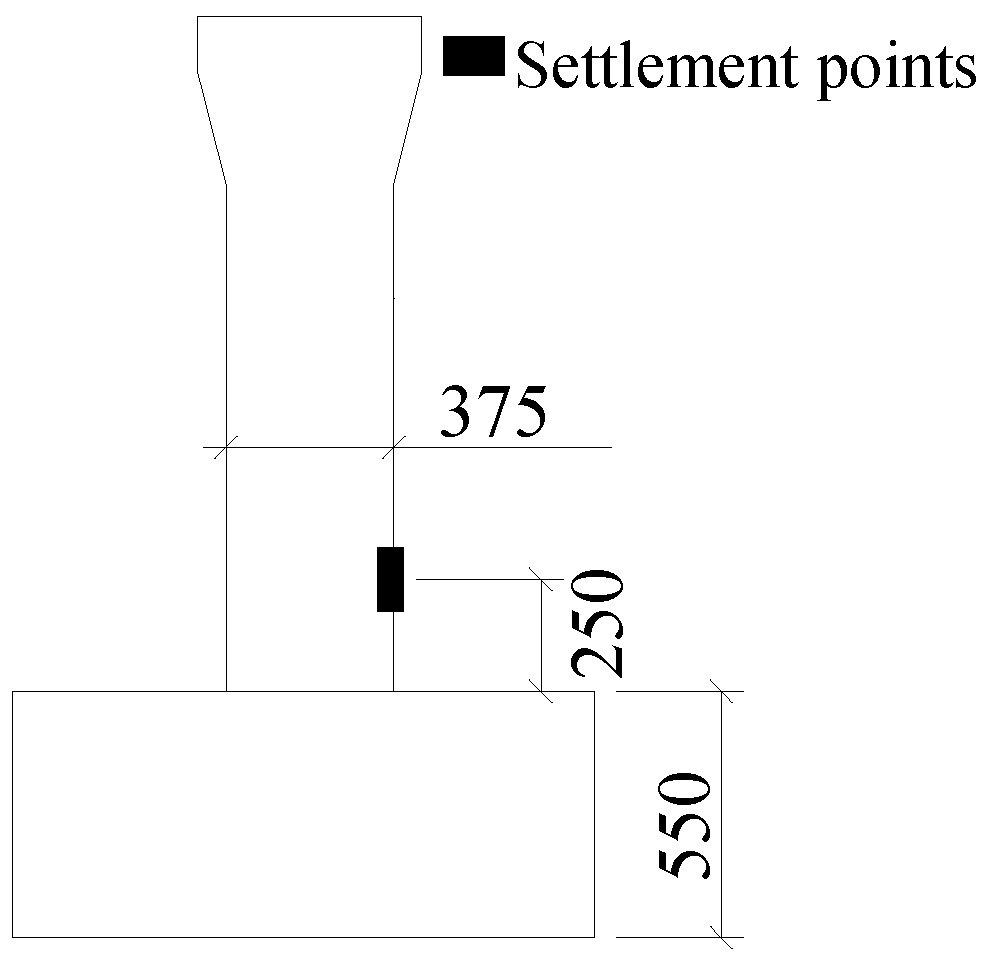
- Pier settlement monitoring: static level measurements are taken to monitor the settlement of selected piers (See Figure 3d).
3.2. Measuring-Point Arrangement
3.2.1. The Strain of the Main Girder
3.2.2. The Strain of Bridge Piers
3.2.3. The Creep of the Main Girder
3.2.4. Crack Width Monitoring
3.2.5. Settlement of Piers
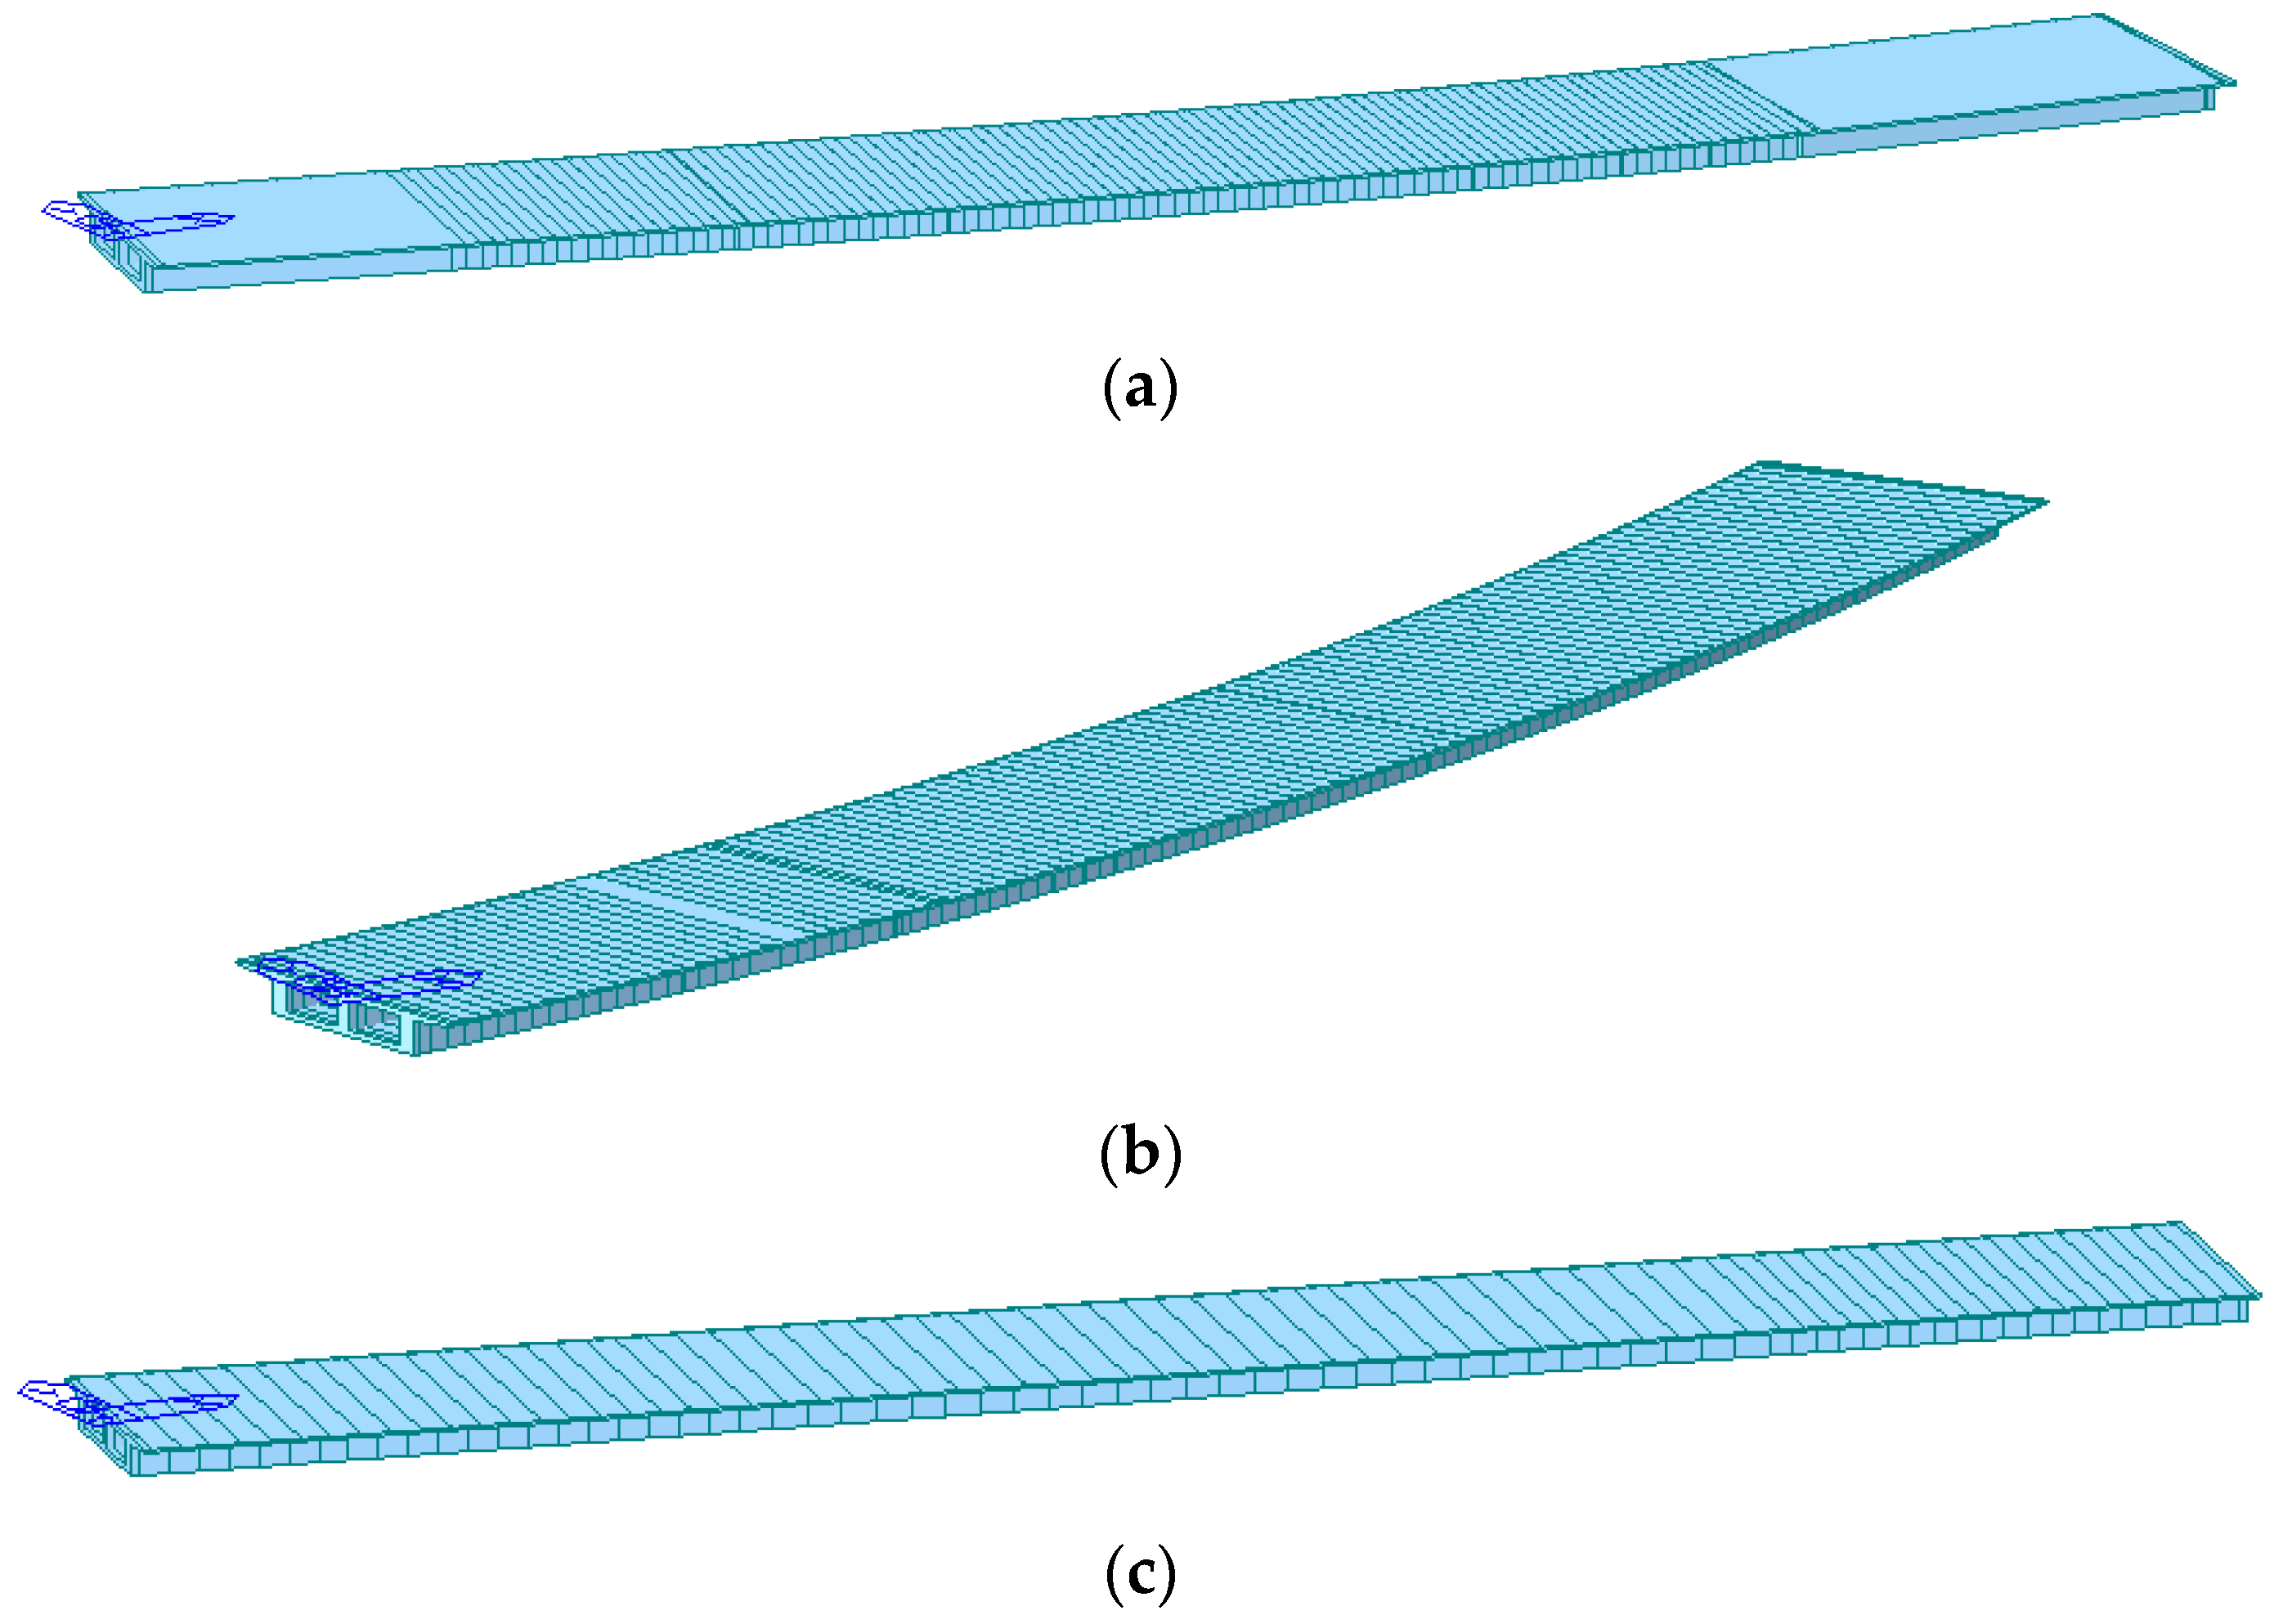
3.3. Finite Element Model Analysis
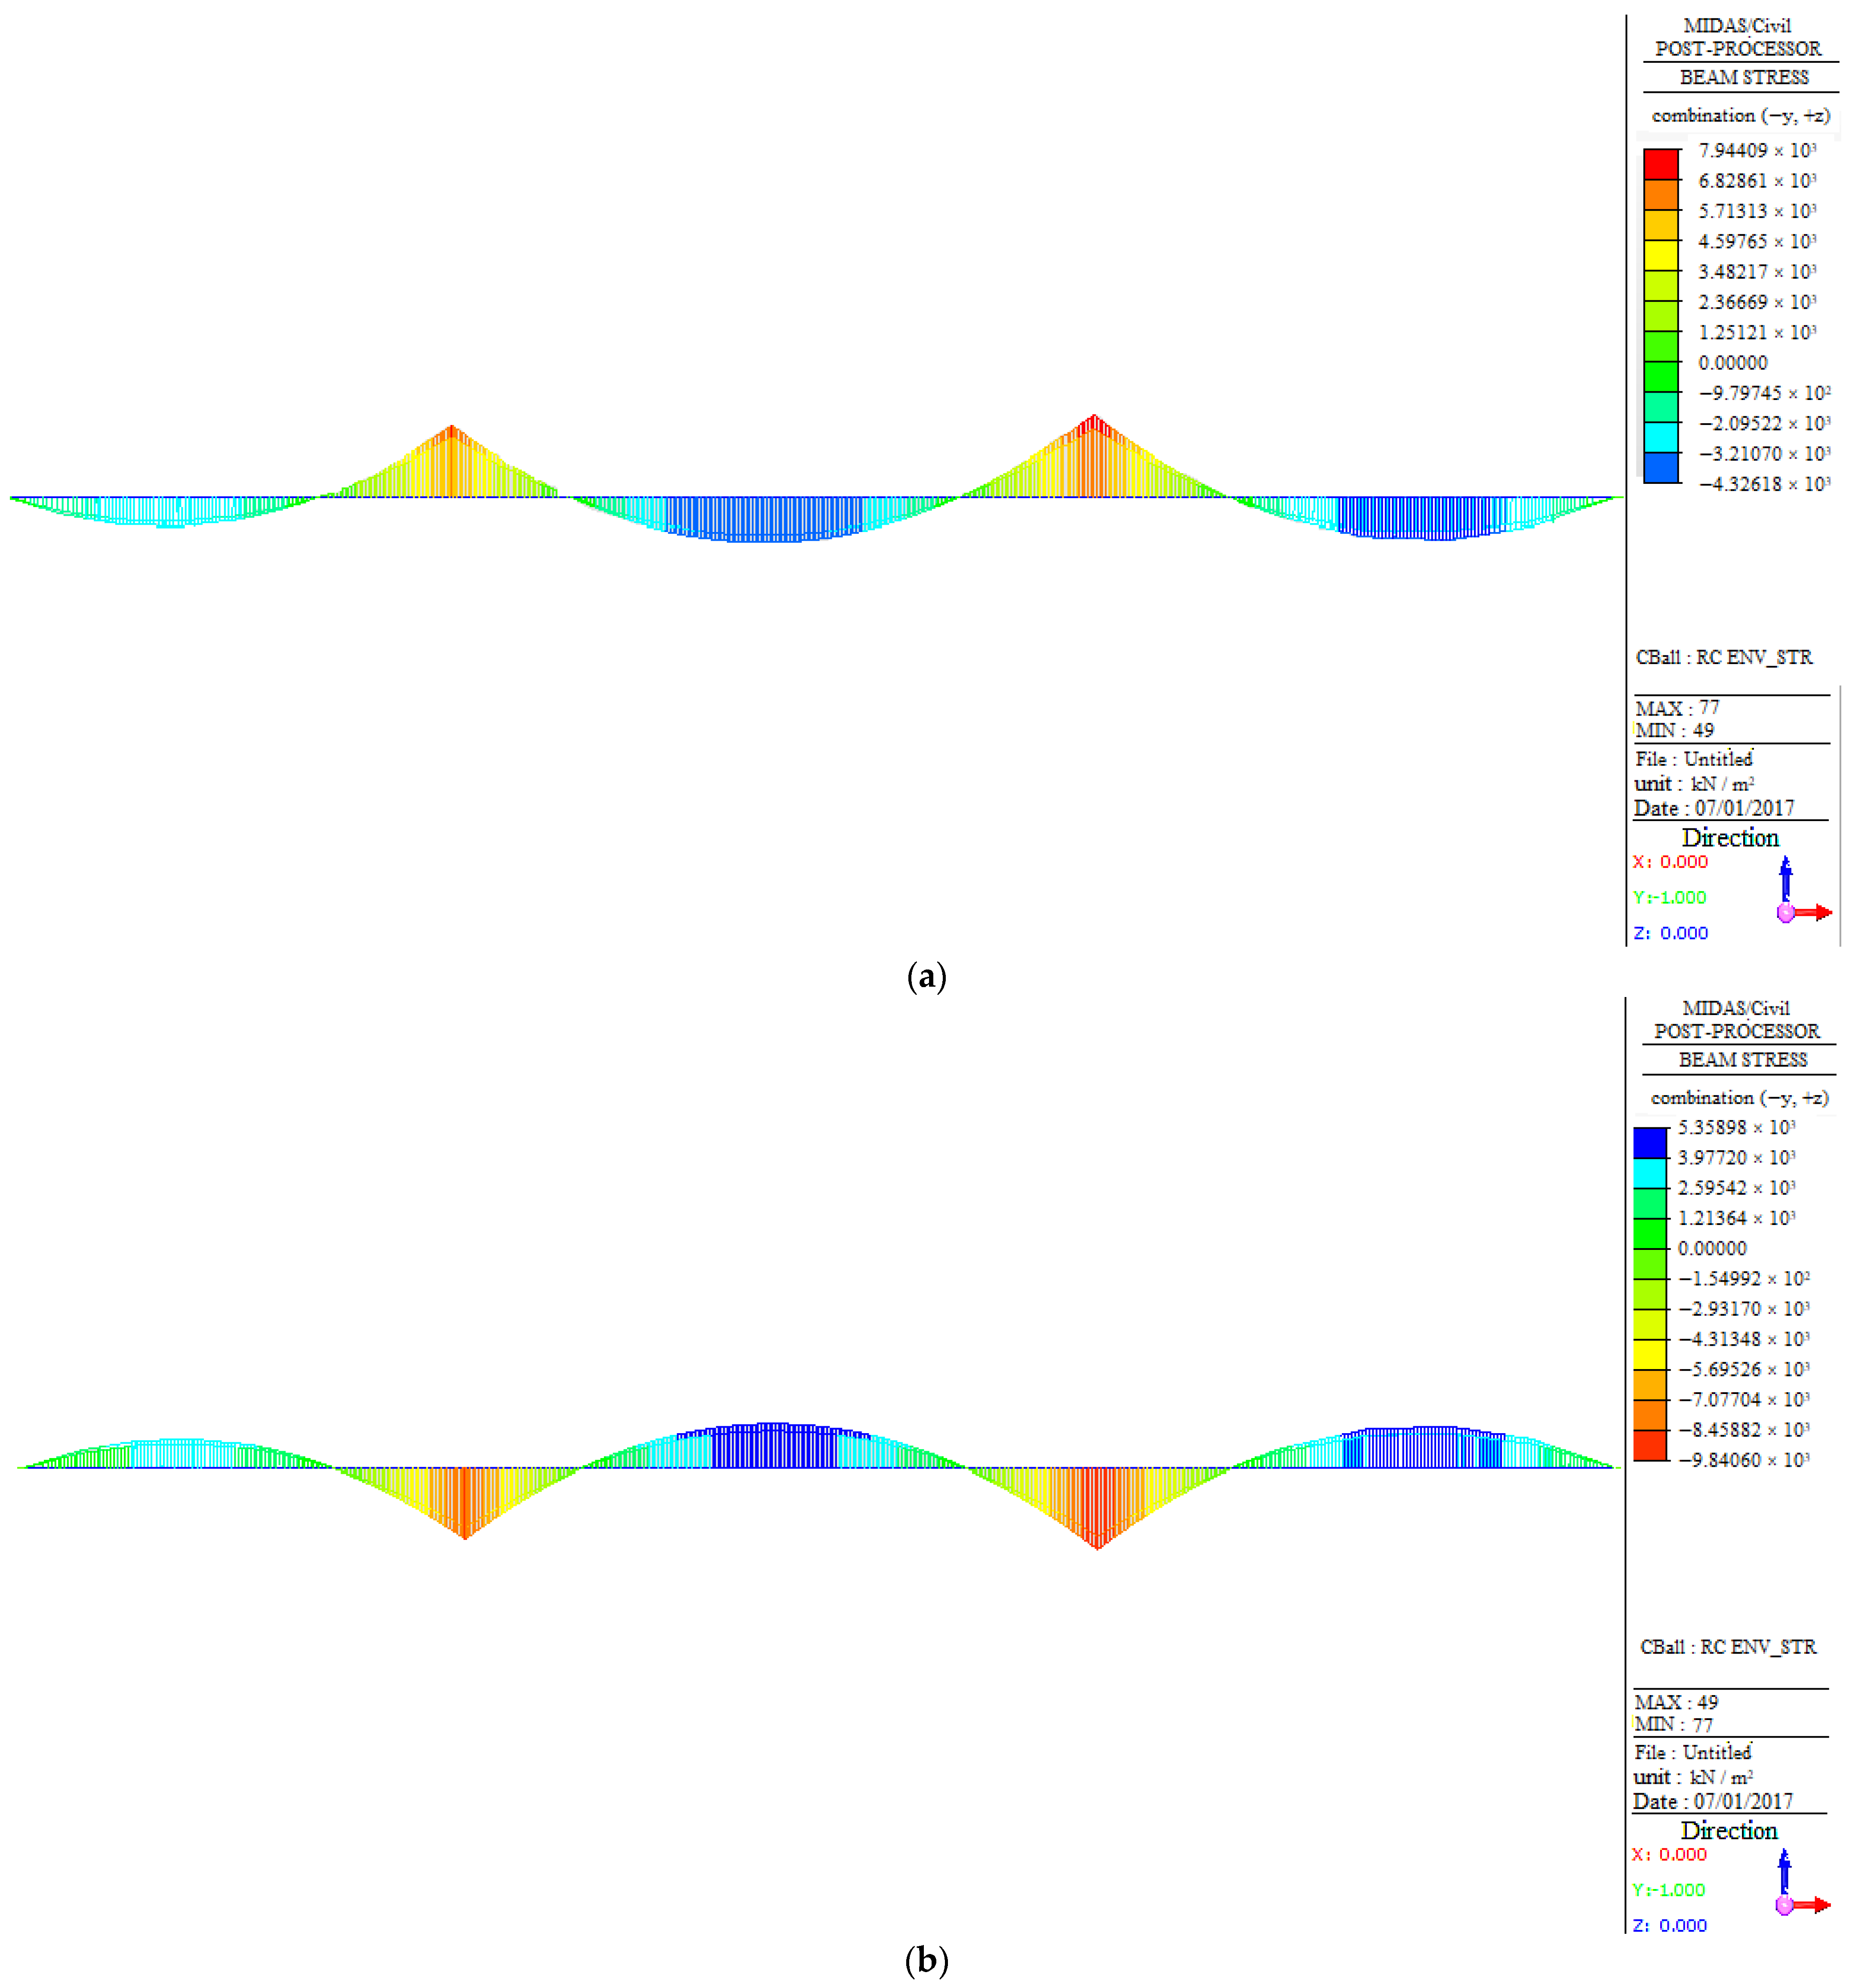
3.3.1. Internal Force Analysis under Constant Load
3.3.2. Internal Force Analysis under a Live Load
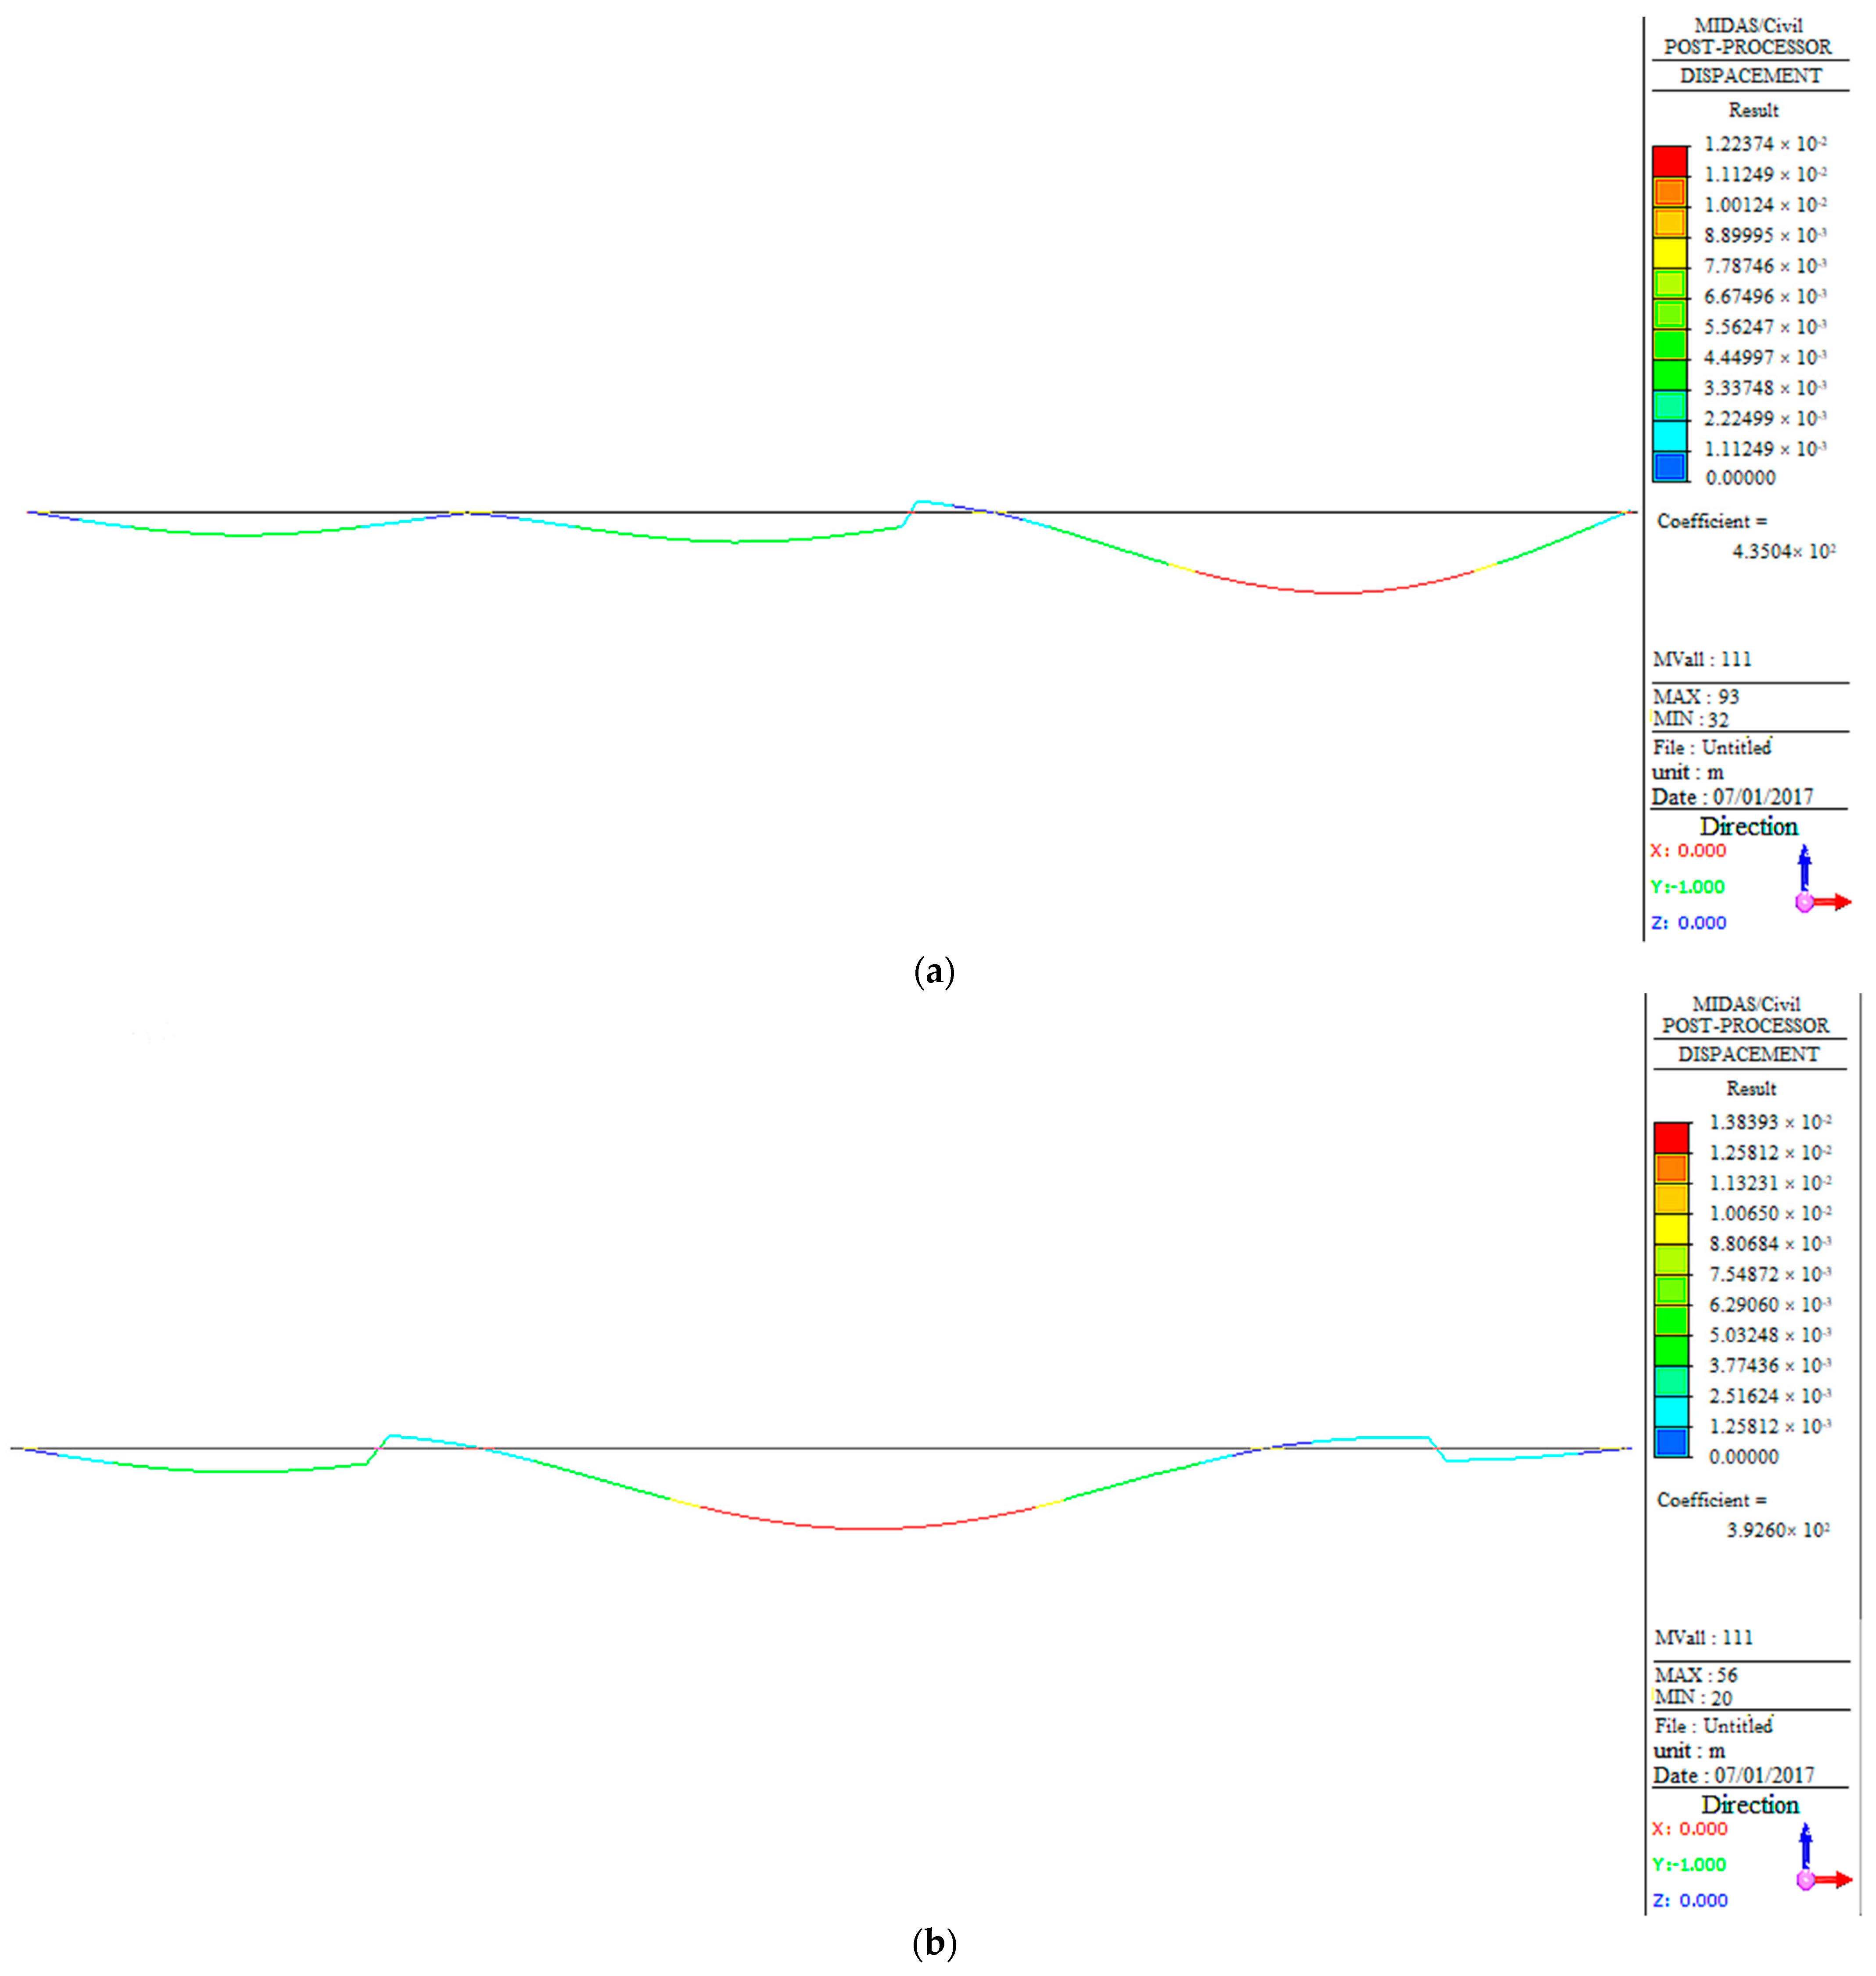
3.3.3. Deflection and Stress Analysis
3.4. Warning Values Based on FEM Analysis
4. Monitoring Results
- (1)
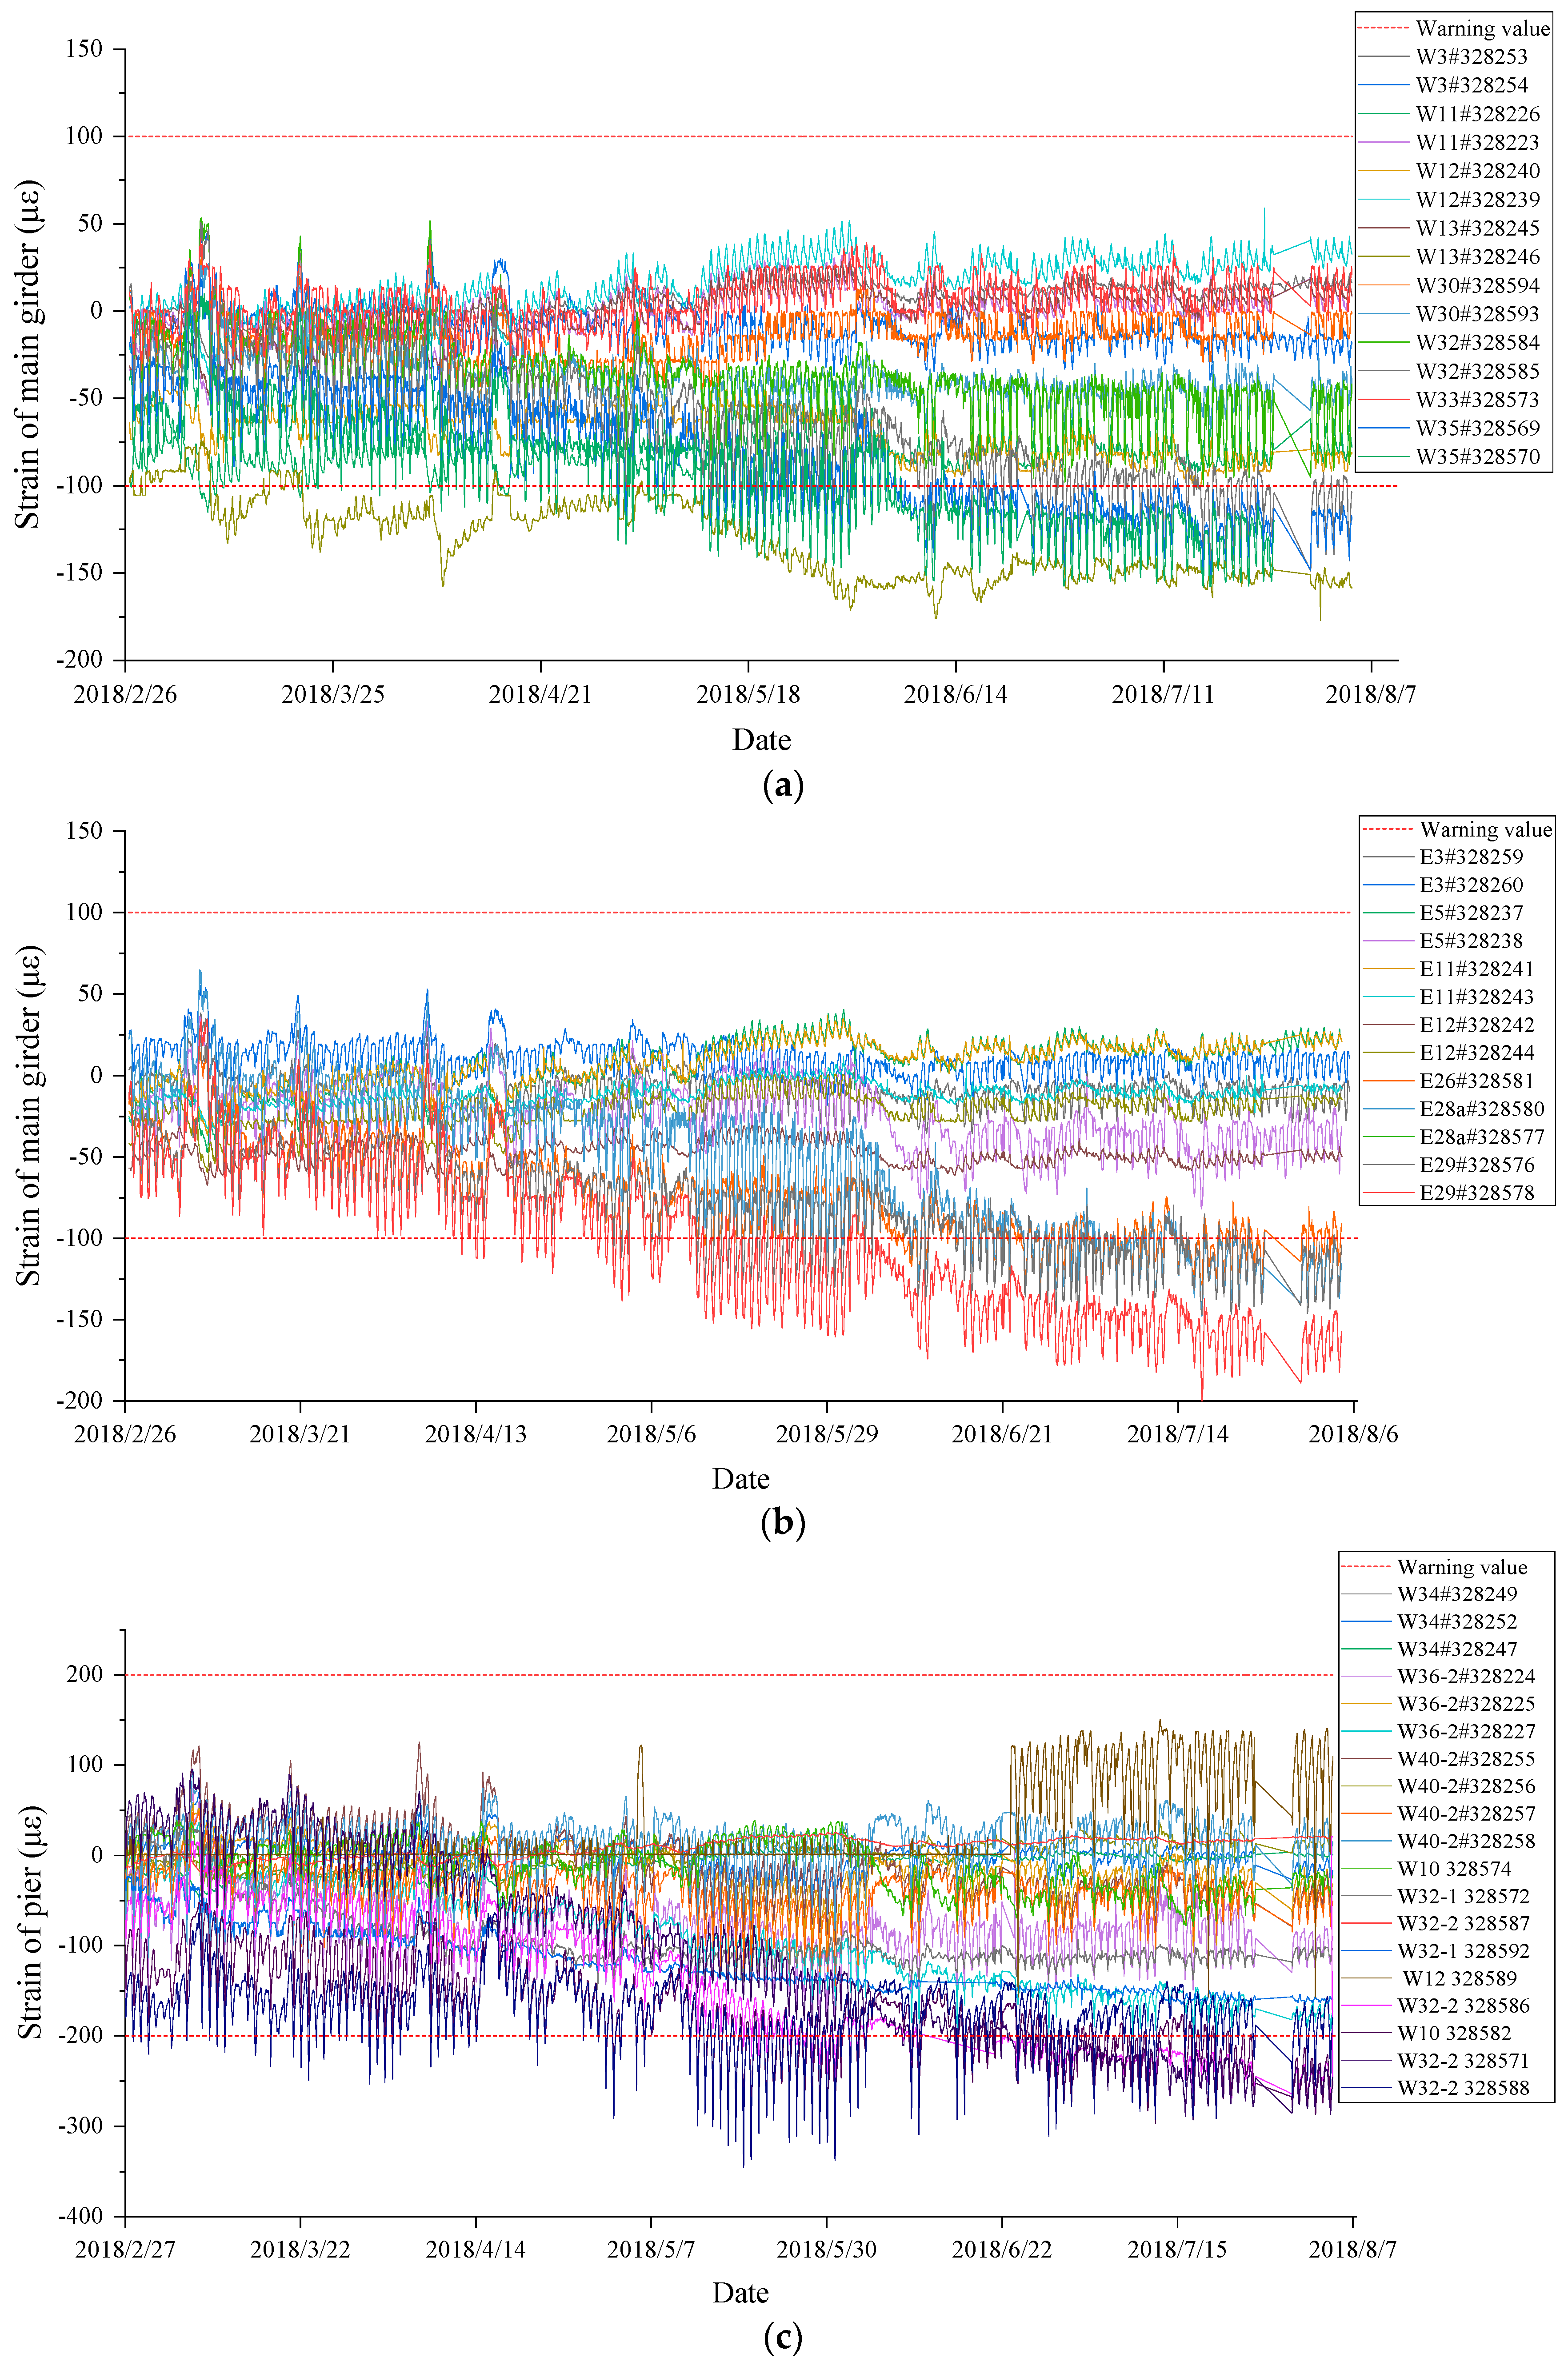
- Strain of the main girder
- (2)
- Strain of the bridge piers
- (3)
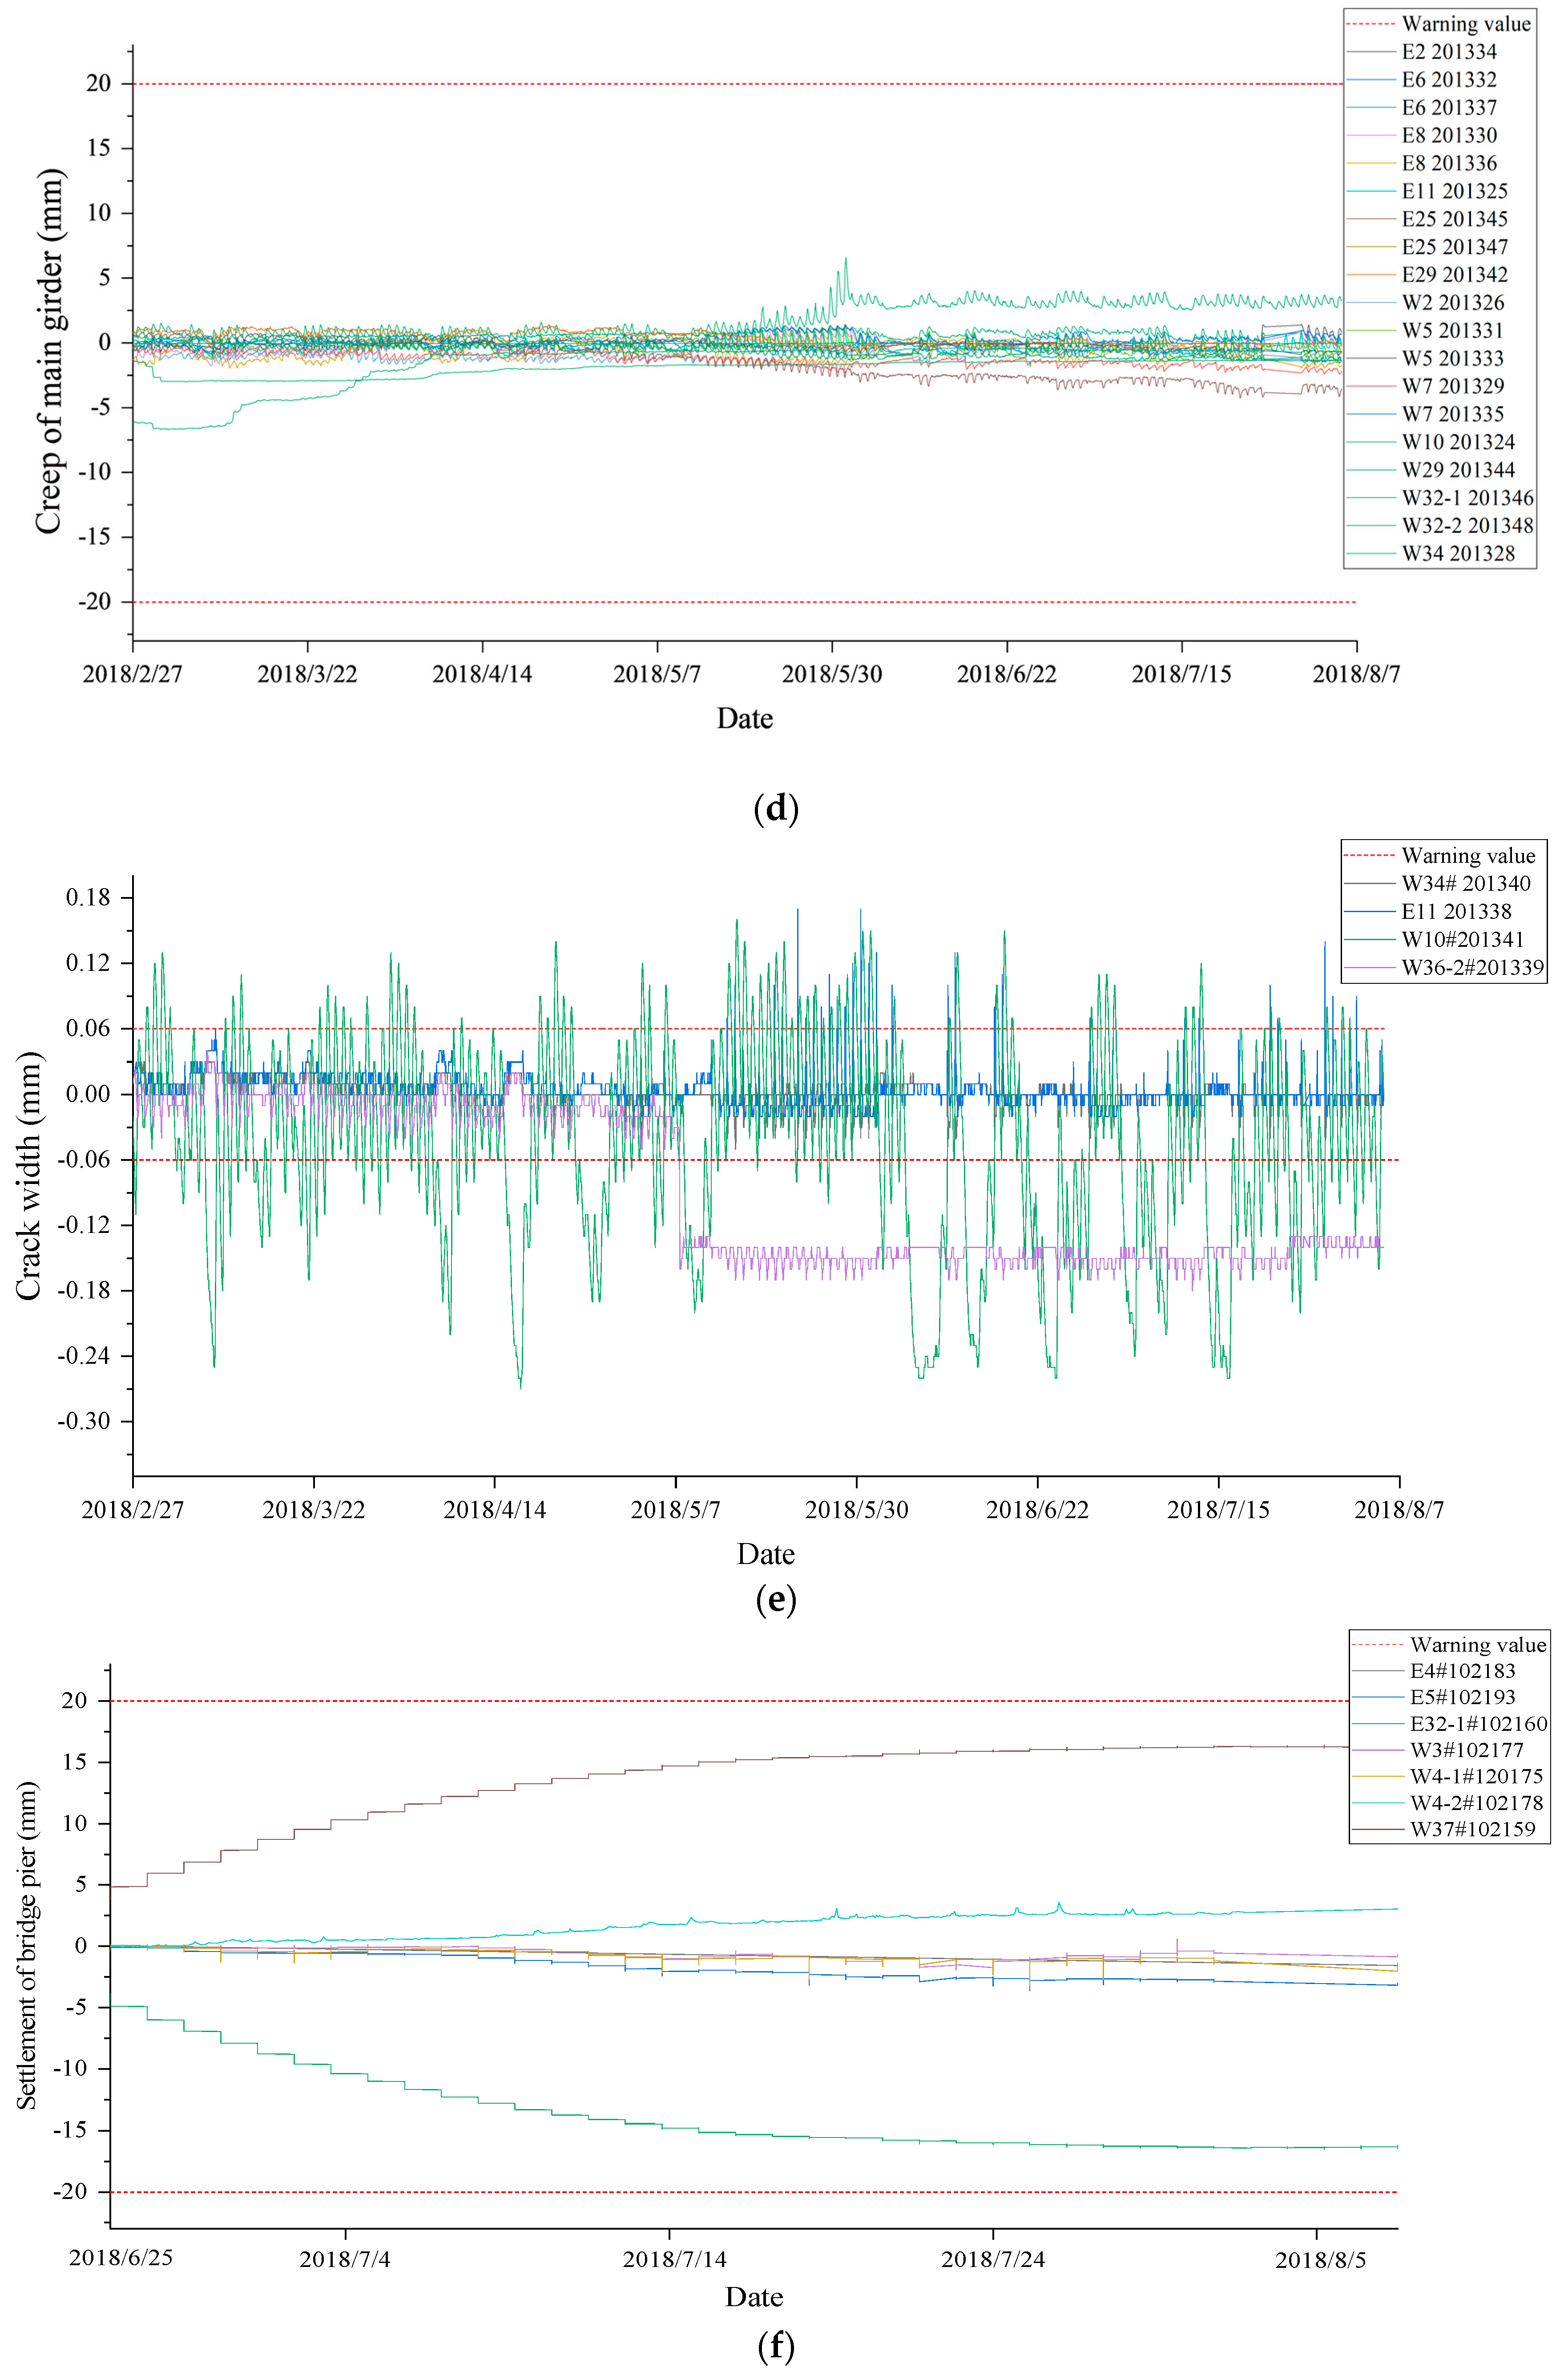
- Creep of the main girder
- (4)
- Crack width
- (5)
- Settlement of the bridge piers
- (1)
- As the strain levels of the W32# girder as well as W32-2# piers exceeded the limit and tended to increase gradually, as demonstrated in Figure 13a,c, respectively, it is recommended that the pier of W32-2# undergoes an appearance quality inspection, and that the damaged and exposed sections of the girder be repaired and the pier reinforced to ensure the structural integrity of the bridge.
- (2)
- Due to the aging of the bridge and the occurrence of numerous subtle issues, it is suggested that continuous monitoring of the bridge be implemented to prevent the escalation of these problems. Particular attention should be paid to areas that slightly exceeded their limits and to the two piers (E32# and W37#) that are expected to exceed their limits soon.
5. Conclusions
Author Contributions
Funding
Institutional Review Board Statement
Informed Consent Statement
Data Availability Statement
Acknowledgments
Conflicts of Interest
References
- Ni, Y.Q.; Chen, R. Strain monitoring based bridge reliability assessment using parametric Bayesian mixture model. Eng. Struct. 2021, 226, 111406. [Google Scholar] [CrossRef]
- Wang, Y.W.; Ni, Y.Q. Bayesian dynamic forecasting of structural strain response using structural health monitoring data. Struct. Control Health Monit. 2020, 27, e2575. [Google Scholar] [CrossRef]
- Sloan, T.D.; Thompson, A.; Kirkpatrick, J.; Boyd, J.W. Monitoring the in-service behavior of the Foyle Bridge. Struct. Eng. 1992, 70, 130–134. [Google Scholar] [CrossRef]
- Shahawy, M.A.; Arockiasamy, M. Field Instrumentation to study the time-dependent behavior in Sunshine Skyway Bridge. J. Bridge Eng. 1996, 1, 76–86. [Google Scholar] [CrossRef]
- Muria, V.D.; Comez, R.; King, C. Dynamic Structural properties of cable stayed Tampico Bridge. J. Struct. Eng. 1991, 117, 3396–3416. [Google Scholar] [CrossRef]
- Mufti, A.A. Structural health monitoring of innovative Canadian civil engineering structures. Struct. Health Monit. 2002, 1, 89–103. [Google Scholar] [CrossRef]
- Ko, J.M.; Ni, Y.Q. Technology developments in structural health monitoring of largescale bridges. Eng. Struct. 2005, 27, 1715–1725. [Google Scholar] [CrossRef]
- Brownjohn, J.M.W. Structural health monitoring of civil infrastructure. Philos. Trans. R. Soc. A Math. Phys. Eng. Sci. 2007, 1851, 589–622. [Google Scholar] [CrossRef]
- Ou, J.P.; Li, H. Structural health monitoring in mainland China: Review and future trends. Struct. Health Monit. 2010, 9, 219–231. [Google Scholar] [CrossRef]
- Ni, Y.Q.; Hua, X.G.; Ko, J.M. Reliability–based assessment of bridges using long–term monitoring data. Key Eng. Mater. 2006, 321–323, 217–222. [Google Scholar] [CrossRef]
- Mobaraki, B.; Lozano-Galant, F.; Soriano, R.P.; Castilla Pascual, F.J. Application of Low-Cost Sensors for Building Monitoring: A Systematic Literature Review. Buildings 2021, 11, 336. [Google Scholar] [CrossRef]
- Petti, L.; Lupo, C.; DeGaetano, C.M. A Methodological Framework for Bridge Surveillance. Appl. Sci. 2023, 13, 4975. [Google Scholar] [CrossRef]
- Wong, K.Y. Design of a Structural Health Monitoring System for Long-Span Bridges. Struct. Infrastruct. Eng. 2007, 3, 169–185. [Google Scholar] [CrossRef]
- Fei, Q.G.; Li, A.Q.; Han, X.L. Modal identification of long-span Runyang Bridge using ambient responses recorded by SHMS. Sci. China Ser. E 2009, 52, 3632–3639. [Google Scholar] [CrossRef]
- Li, S.; Li, H.; Ou, L. Reliability assessment of Yonghe Bridge based on structural health monitoring. In Bridge Maintenance, Safety, Management and Life-Cycle Optimization, Proceedings of the 5th International Conference on Bridge Maintenance, Safety and Management (IABMAS), Philadelphia, PA, USA, 11–15 July 2010; CRC Press-Taylor & Francis Group: Philadelphia, PA, USA, 2010; pp. 1965–1971. [Google Scholar]
- Zhang, J.; Zhu, S.; Xu, Y.; Chen, Z. SHM-Based Correlation Study of Trainload-Induced Response in Tsing Ma Bridge. In Proceedings of the 14th Asia Pacific Vibration Conference (APVC) on Dynamics for Sustainable Engineering, Hong Kong, China, 5–8 December 2011; pp. 113–122. [Google Scholar]
- Zhu, Y.F.; Ren, W.X.; Wang, Y.F. Structural health monitoring on Yangluo Yangtze River Bridge: Implementation and demonstration. Adv. Struct. Eng. 2022, 25, 1431–1448. [Google Scholar] [CrossRef]
- Peeters, B.; Couvreur, G.; Razinkov, O.; Kündig, C.; Van der Auweraer, H.; De Roeck, G. Continuous Monitoring of the Øresund Bridge: System and Data Analysis. Struct. Infrastruct. Eng. 2009, 5, 395–405. [Google Scholar] [CrossRef]
- Magalhães, F.; Cunha, A.; Caetano, E. Vibration based structural health monitoring of an arch bridge: From automated OMA to damage detection. Mech. Syst. Signal Process. 2012, 28, 212–228. [Google Scholar] [CrossRef]
- Soman, R.; Kyriakides, M.; Onoufriou, T. Numerical evaluation of multi-metric data fusion based structural health monitoring of long span bridge structures. Struct. Infrastruct. Eng. 2018, 14, 673–684. [Google Scholar] [CrossRef]
- Liu, M.; Frangopol, D.M.; Kim, S. Bridge System Performance Assessment from Structural Health Monitoring: A Case Study. J. Struct. Eng. 2009, 135, 733–742. [Google Scholar] [CrossRef]
- Ni, Y.Q.; Xia, Y.X. Strain–based condition assessment of a suspension bridge instrumented with structural health monitoring system. Int. J. Struct. Stab. Dyn. 2016, 16, 1640027. [Google Scholar] [CrossRef]
- Colford, B.R.; Zhou, E.; Pape, T. Structural health monitoring—A risk-based approach. Proc. Inst. Civ. Eng. Bridge Eng. 2022. ahead of print. [Google Scholar] [CrossRef]
- Catbas, F.N.; Susoy, M.; Frangopol, D.M. Structural health monitoring and reliability estimation: Long span truss bridge application with environmental monitoring data. Eng. Struct. 2008, 30, 2347–2359. [Google Scholar] [CrossRef]
- Frangopol, D.M.; Strauss, A.; Kim, S.Y. Bridge reliability assessment based on monitoring. J. Bridge Eng. 2008, 13, 258–270. [Google Scholar] [CrossRef]
- Yi, Y.H.; Li, H.N.; Gu, M. Experimental assessment of high–rate GPS receivers for deformation monitoring of bridge. Measurement 2013, 46, 420–432. [Google Scholar] [CrossRef]
- Yi, T.H.; Li, H.N.; Gu, M.; Zhang, X.D. Sensor placement optimization in structural health monitoring using niching monkey algorithm. Int. J. Struct. Stab. Dyn. 2014, 14, 1440012. [Google Scholar] [CrossRef]
- Cardini, A.J.; DeWolf, J.T. Long–term structural health monitoring of a multi–girder steel composite bridge using strain data. Struct. Health Monit. 2008, 8, 47–58. [Google Scholar] [CrossRef]
- CJJ 99-2003; Technical Code of Maintenance for City Bridge. People’s Republic of China Ministry of Construction, China Architectural Engineering Publishing House: Beijing, China, 2003.
- Lin, H. Construction of emergency health monitoring system for Shenzhen Aiguo road viaduct. Fujian Archit. Constr. 2019, 254, 68–71. [Google Scholar]
- JTG D60-2015; General Code for Design of Highway Bridges and Culverts. Ministry of Transport of the People’s Republic of China, People’s Communications Press: Beijing, China, 2015.


| No. | Location |
|---|---|
| 1 | Main girder: The outer web of bracket at the top of E11 split pier |
| 2 | Main girder: The outer web of bracket at top of W10# split pier |
| 3 | Pier: W34# pier column |
| 4 | Pier: W36-2# pier column |
| No. | Location (Pier) |
|---|---|
| 1 | E4# |
| 2 | E5# |
| 3 | W3# |
| 4 | W4-1# |
| 5 | W37# |
| Datum Point 1 | W4-2# |
| Datum Point 2 | E32-1# |
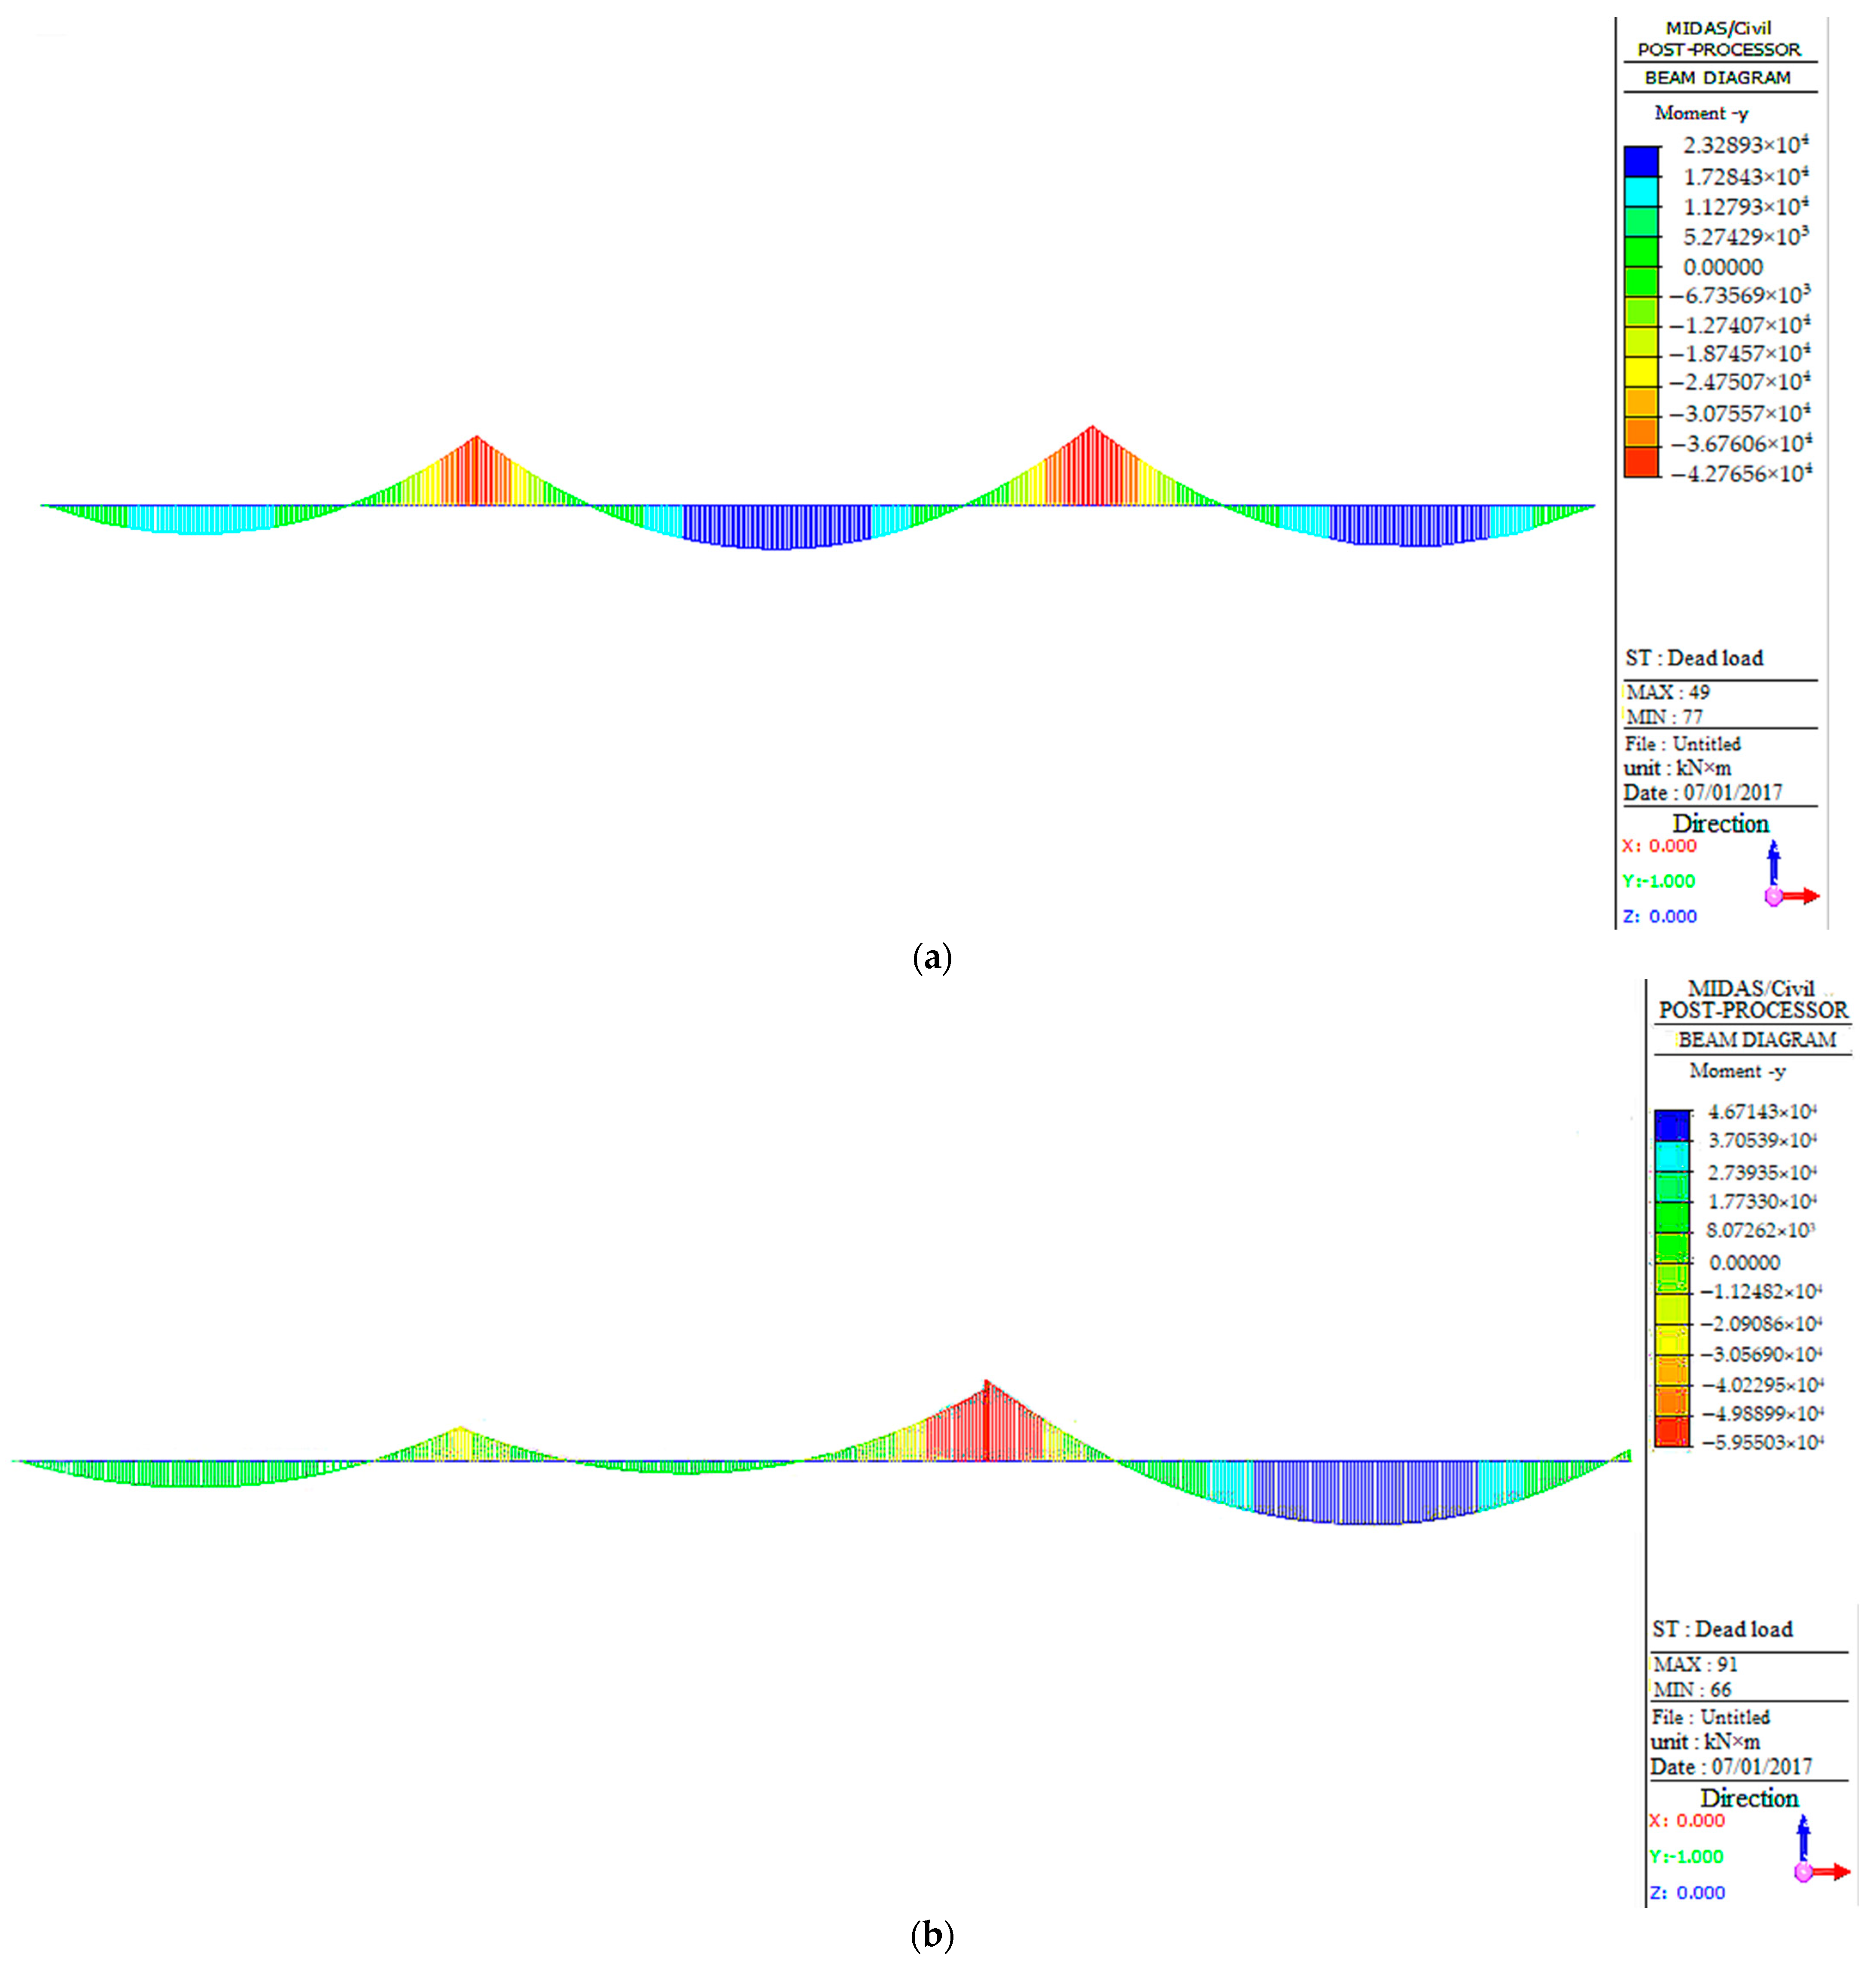
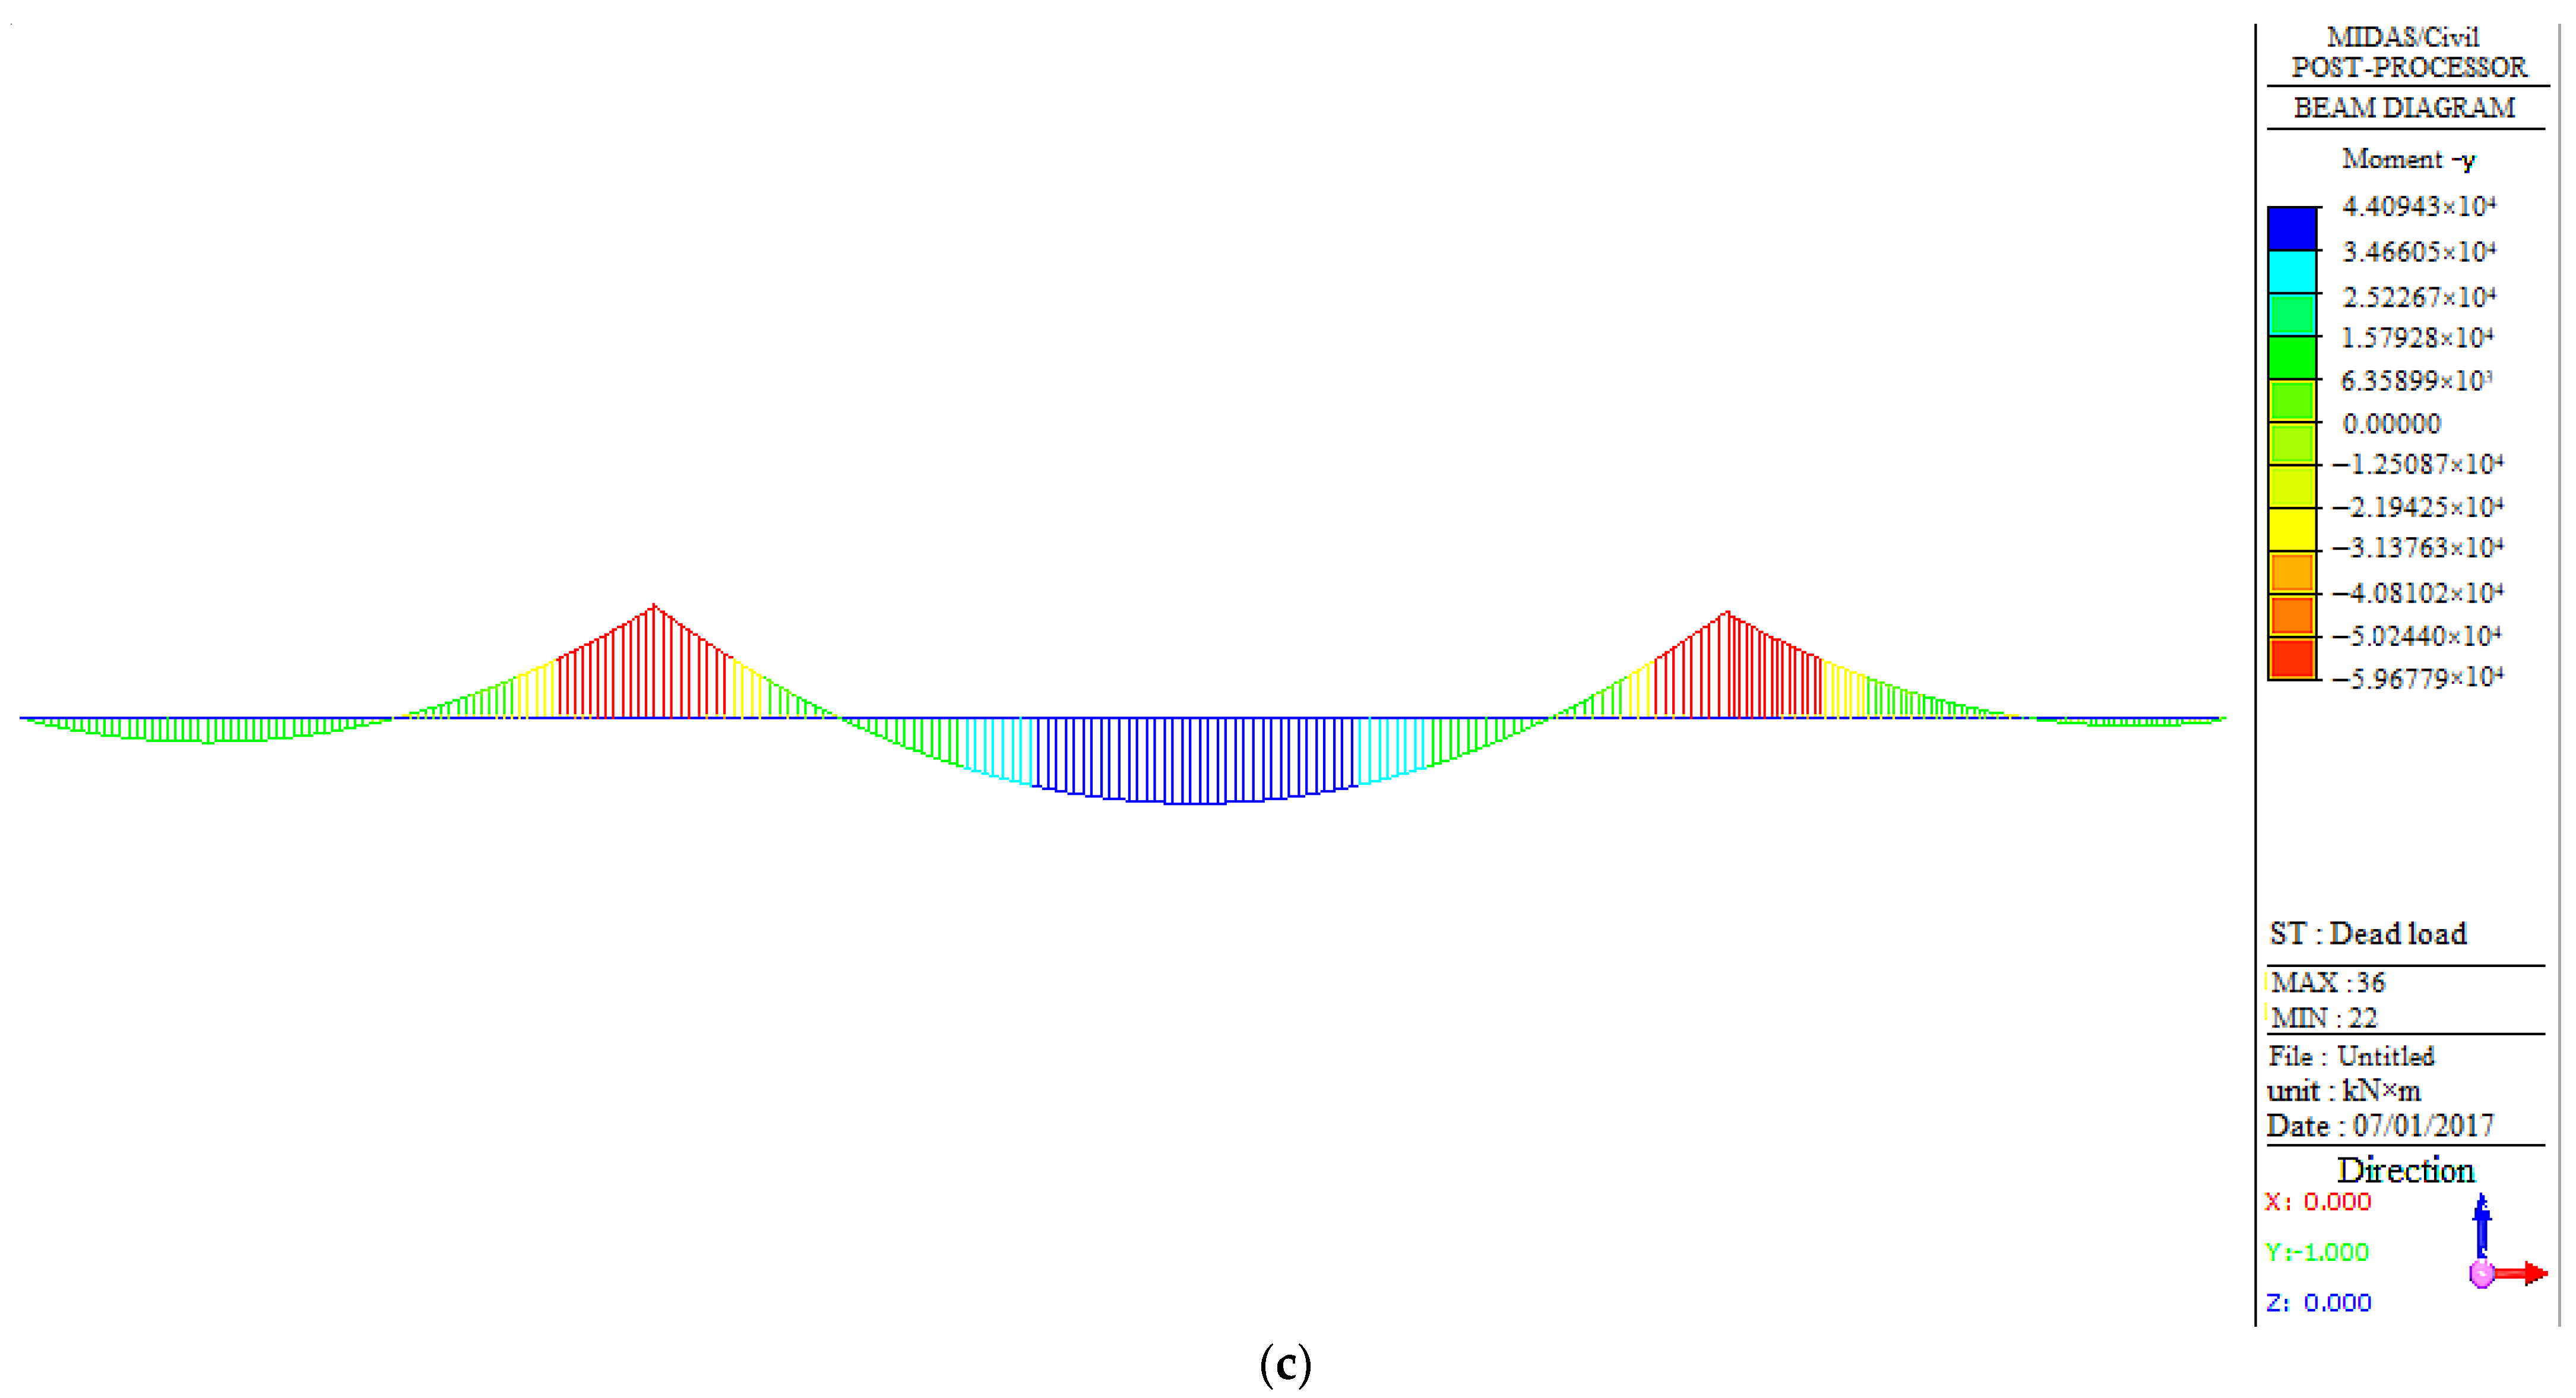
| Bridge Section | Maximum Moment (KN·m) | Minimum Moment (KN·m) |
|---|---|---|
| West No.9# | 2.32893 × 10⁴ | −4.27656 × 10⁴ |
| West No.11# | 4.67143 × 10⁴ | −5.95503 × 10⁴ |
| West No.6# | 4.40943 × 10⁴ | −5.96779 × 10⁴ |
| Bridge Section | Maximum Moment (KN·m) | Minimum Moment (KN·m) |
|---|---|---|
| West No.9# | 8.15062 × 10³ | −6.80009 × 10³ |
| West No.11# | 1.27369 × 10⁴ | −1.094710 × 10⁴ |
| West No.6# | 1.22862 × 10⁴ | −1.104110 × 10⁴ |
| Monitoring Items | Warning Values | Unit | Location |
|---|---|---|---|
| Strain of the main girder | 100 | με | W3#, W11#, W12#, W13#, W30#, W32#, W33#, W35#, E3#, E5#, E11#, E12#, E26#, E28a#, E29# |
| Strain of bridge piers | 200 | με | W32-2#, W34#, W2, W34#, W40-2#, W32-1, W32-2, W10, W12 |
| Creep of the main girder | 20 | mm | W10, E11, W2, E29, W34, W7, E8, W5, E6, E2, W2, E25, W32-1,W32-2 |
| Crack width | 0.05 | mm | E11#, W34#, W36-2#, W10# |
| Settlement of bridge piers | 20 | mm | W37#, E32-1#, W4-1#, W4-2#, W3#, E4#, E5# |
| Monitoring Items | Monitoring Results |
|---|---|
| Strain of the main girder | W13#, W32#, W35#, E26#, E28a#, E29#: Exceed the limit |
| Strain of bridge piers | W10#, W32-2#: Exceed the limit |
| Creep of the main girder | No abnormality |
| Crack width | W10#, W36-2#: Existing cracks show obvious expansion |
| Settlement of bridge piers | No abnormality |
Disclaimer/Publisher’s Note: The statements, opinions and data contained in all publications are solely those of the individual author(s) and contributor(s) and not of MDPI and/or the editor(s). MDPI and/or the editor(s) disclaim responsibility for any injury to people or property resulting from any ideas, methods, instructions or products referred to in the content. |
© 2023 by the authors. Licensee MDPI, Basel, Switzerland. This article is an open access article distributed under the terms and conditions of the Creative Commons Attribution (CC BY) license (https://creativecommons.org/licenses/by/4.0/).
Share and Cite
Xiang, W.; Wei, J.; Zhang, F. Structural Health Monitoring Design and Performance Evaluation of a Middle-Span Bridge. Sensors 2023, 23, 8702. https://doi.org/10.3390/s23218702
Xiang W, Wei J, Zhang F. Structural Health Monitoring Design and Performance Evaluation of a Middle-Span Bridge. Sensors. 2023; 23(21):8702. https://doi.org/10.3390/s23218702
Chicago/Turabian StyleXiang, Wei, Jiaoyuan Wei, and Fengliang Zhang. 2023. "Structural Health Monitoring Design and Performance Evaluation of a Middle-Span Bridge" Sensors 23, no. 21: 8702. https://doi.org/10.3390/s23218702
APA StyleXiang, W., Wei, J., & Zhang, F. (2023). Structural Health Monitoring Design and Performance Evaluation of a Middle-Span Bridge. Sensors, 23(21), 8702. https://doi.org/10.3390/s23218702