


Relationship between Repeated Sprint Ability, Countermovement Jump and Thermography in Elite Football Players

 ,
,  , ,
, ,  ,
,  and
and 
Abstract
1. Introduction
2. Materials and Methods
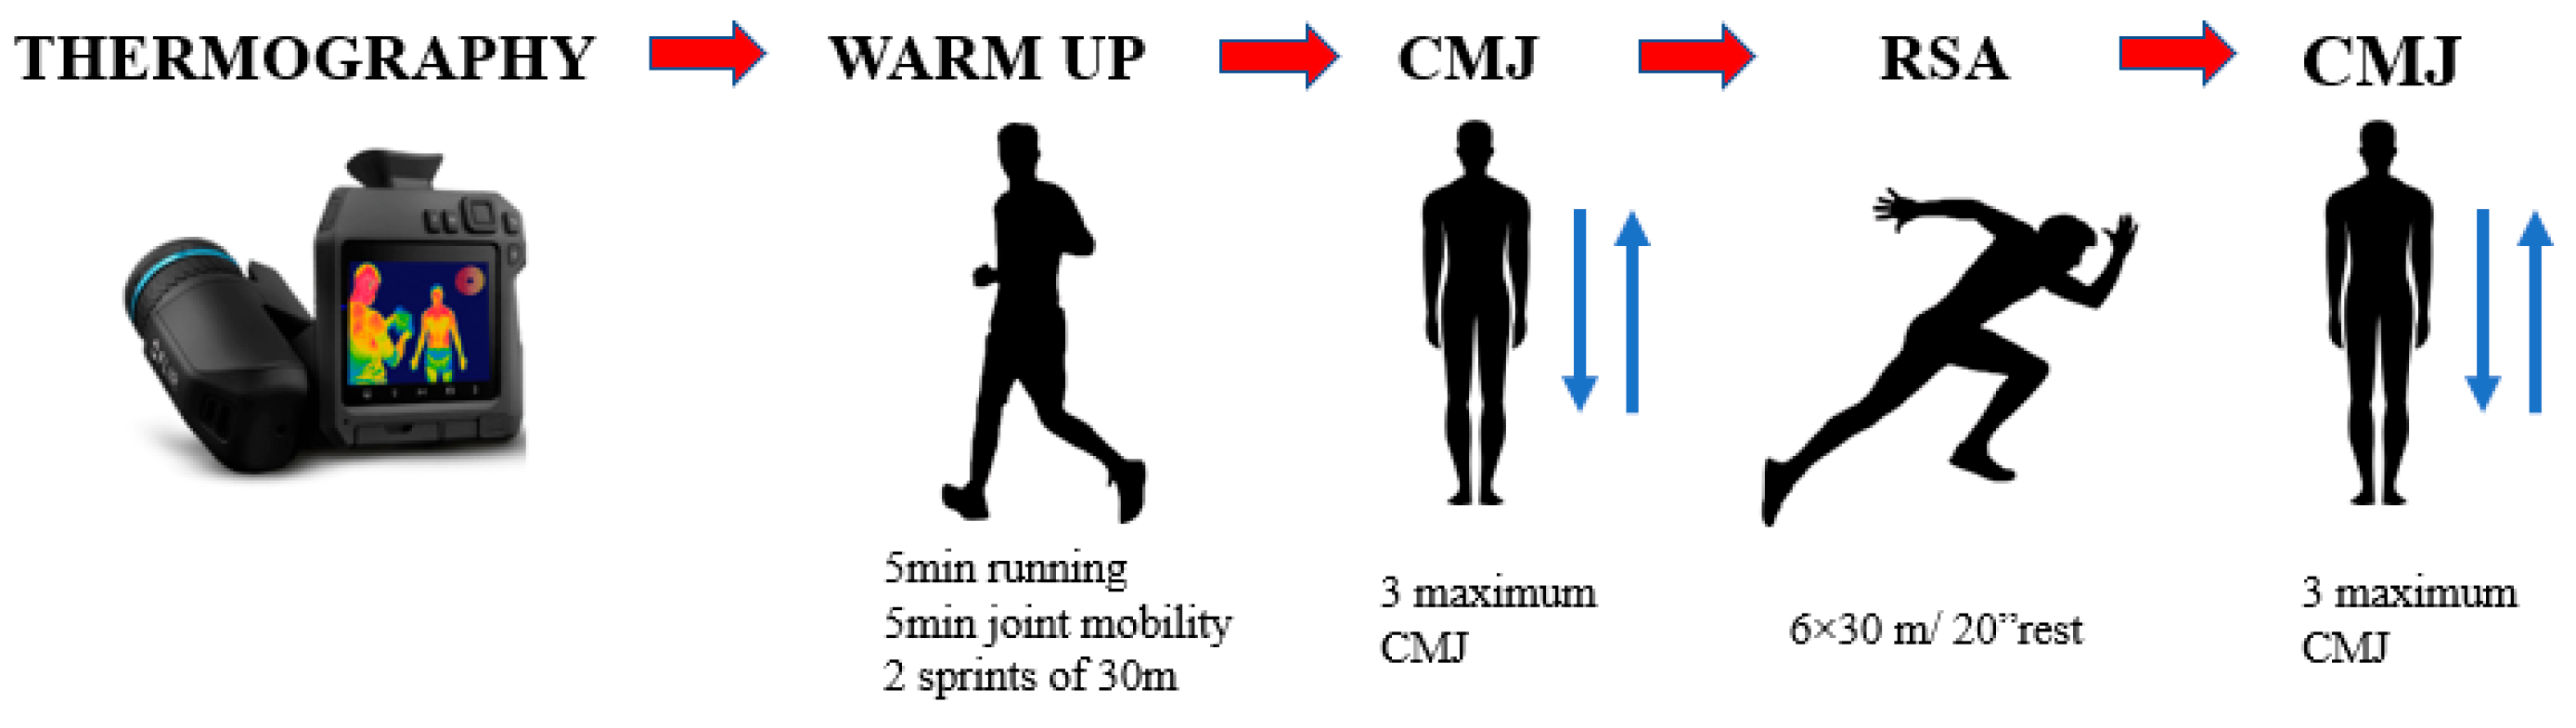
2.1. Experimental Approach to the Problem
2.2. Participants
2.3. Ethical Statement
2.4. Measures
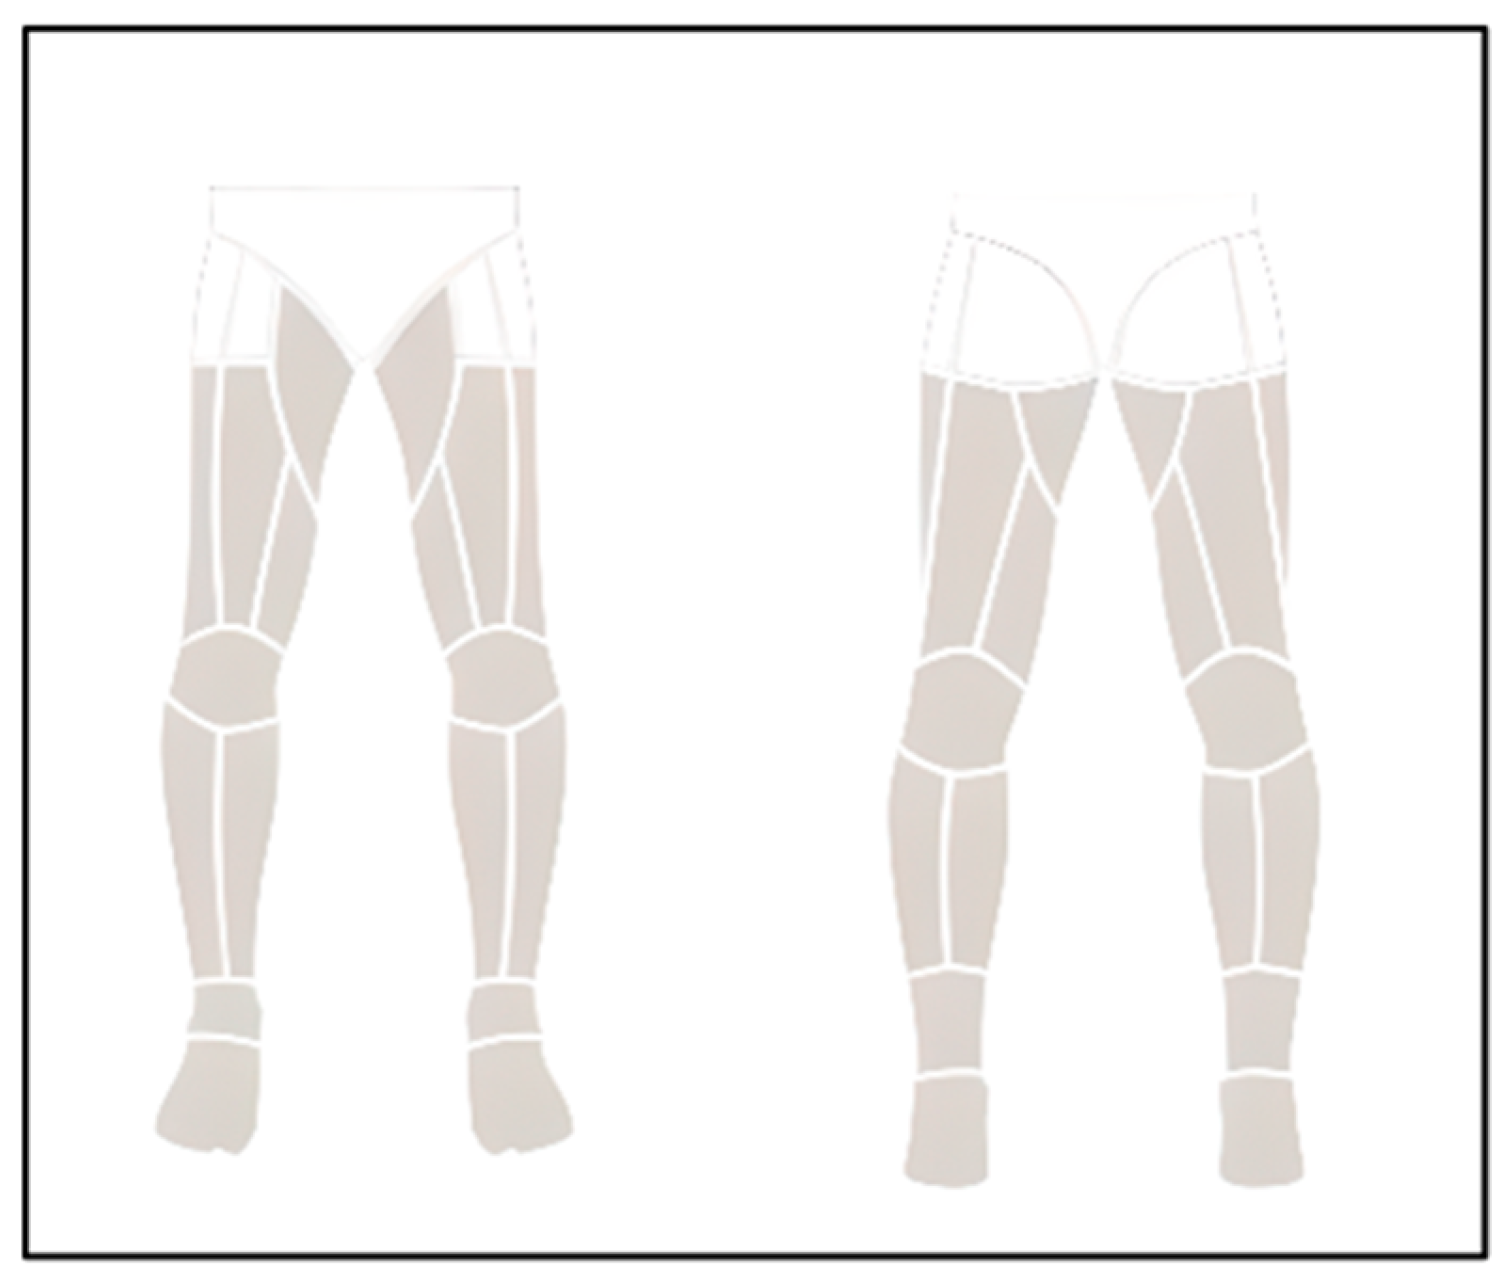
2.4.1. Thermography
2.4.2. Vertical Jumps
2.4.3. Repeated Sprint Ability (RSA)
2.5. Statistical Analysis
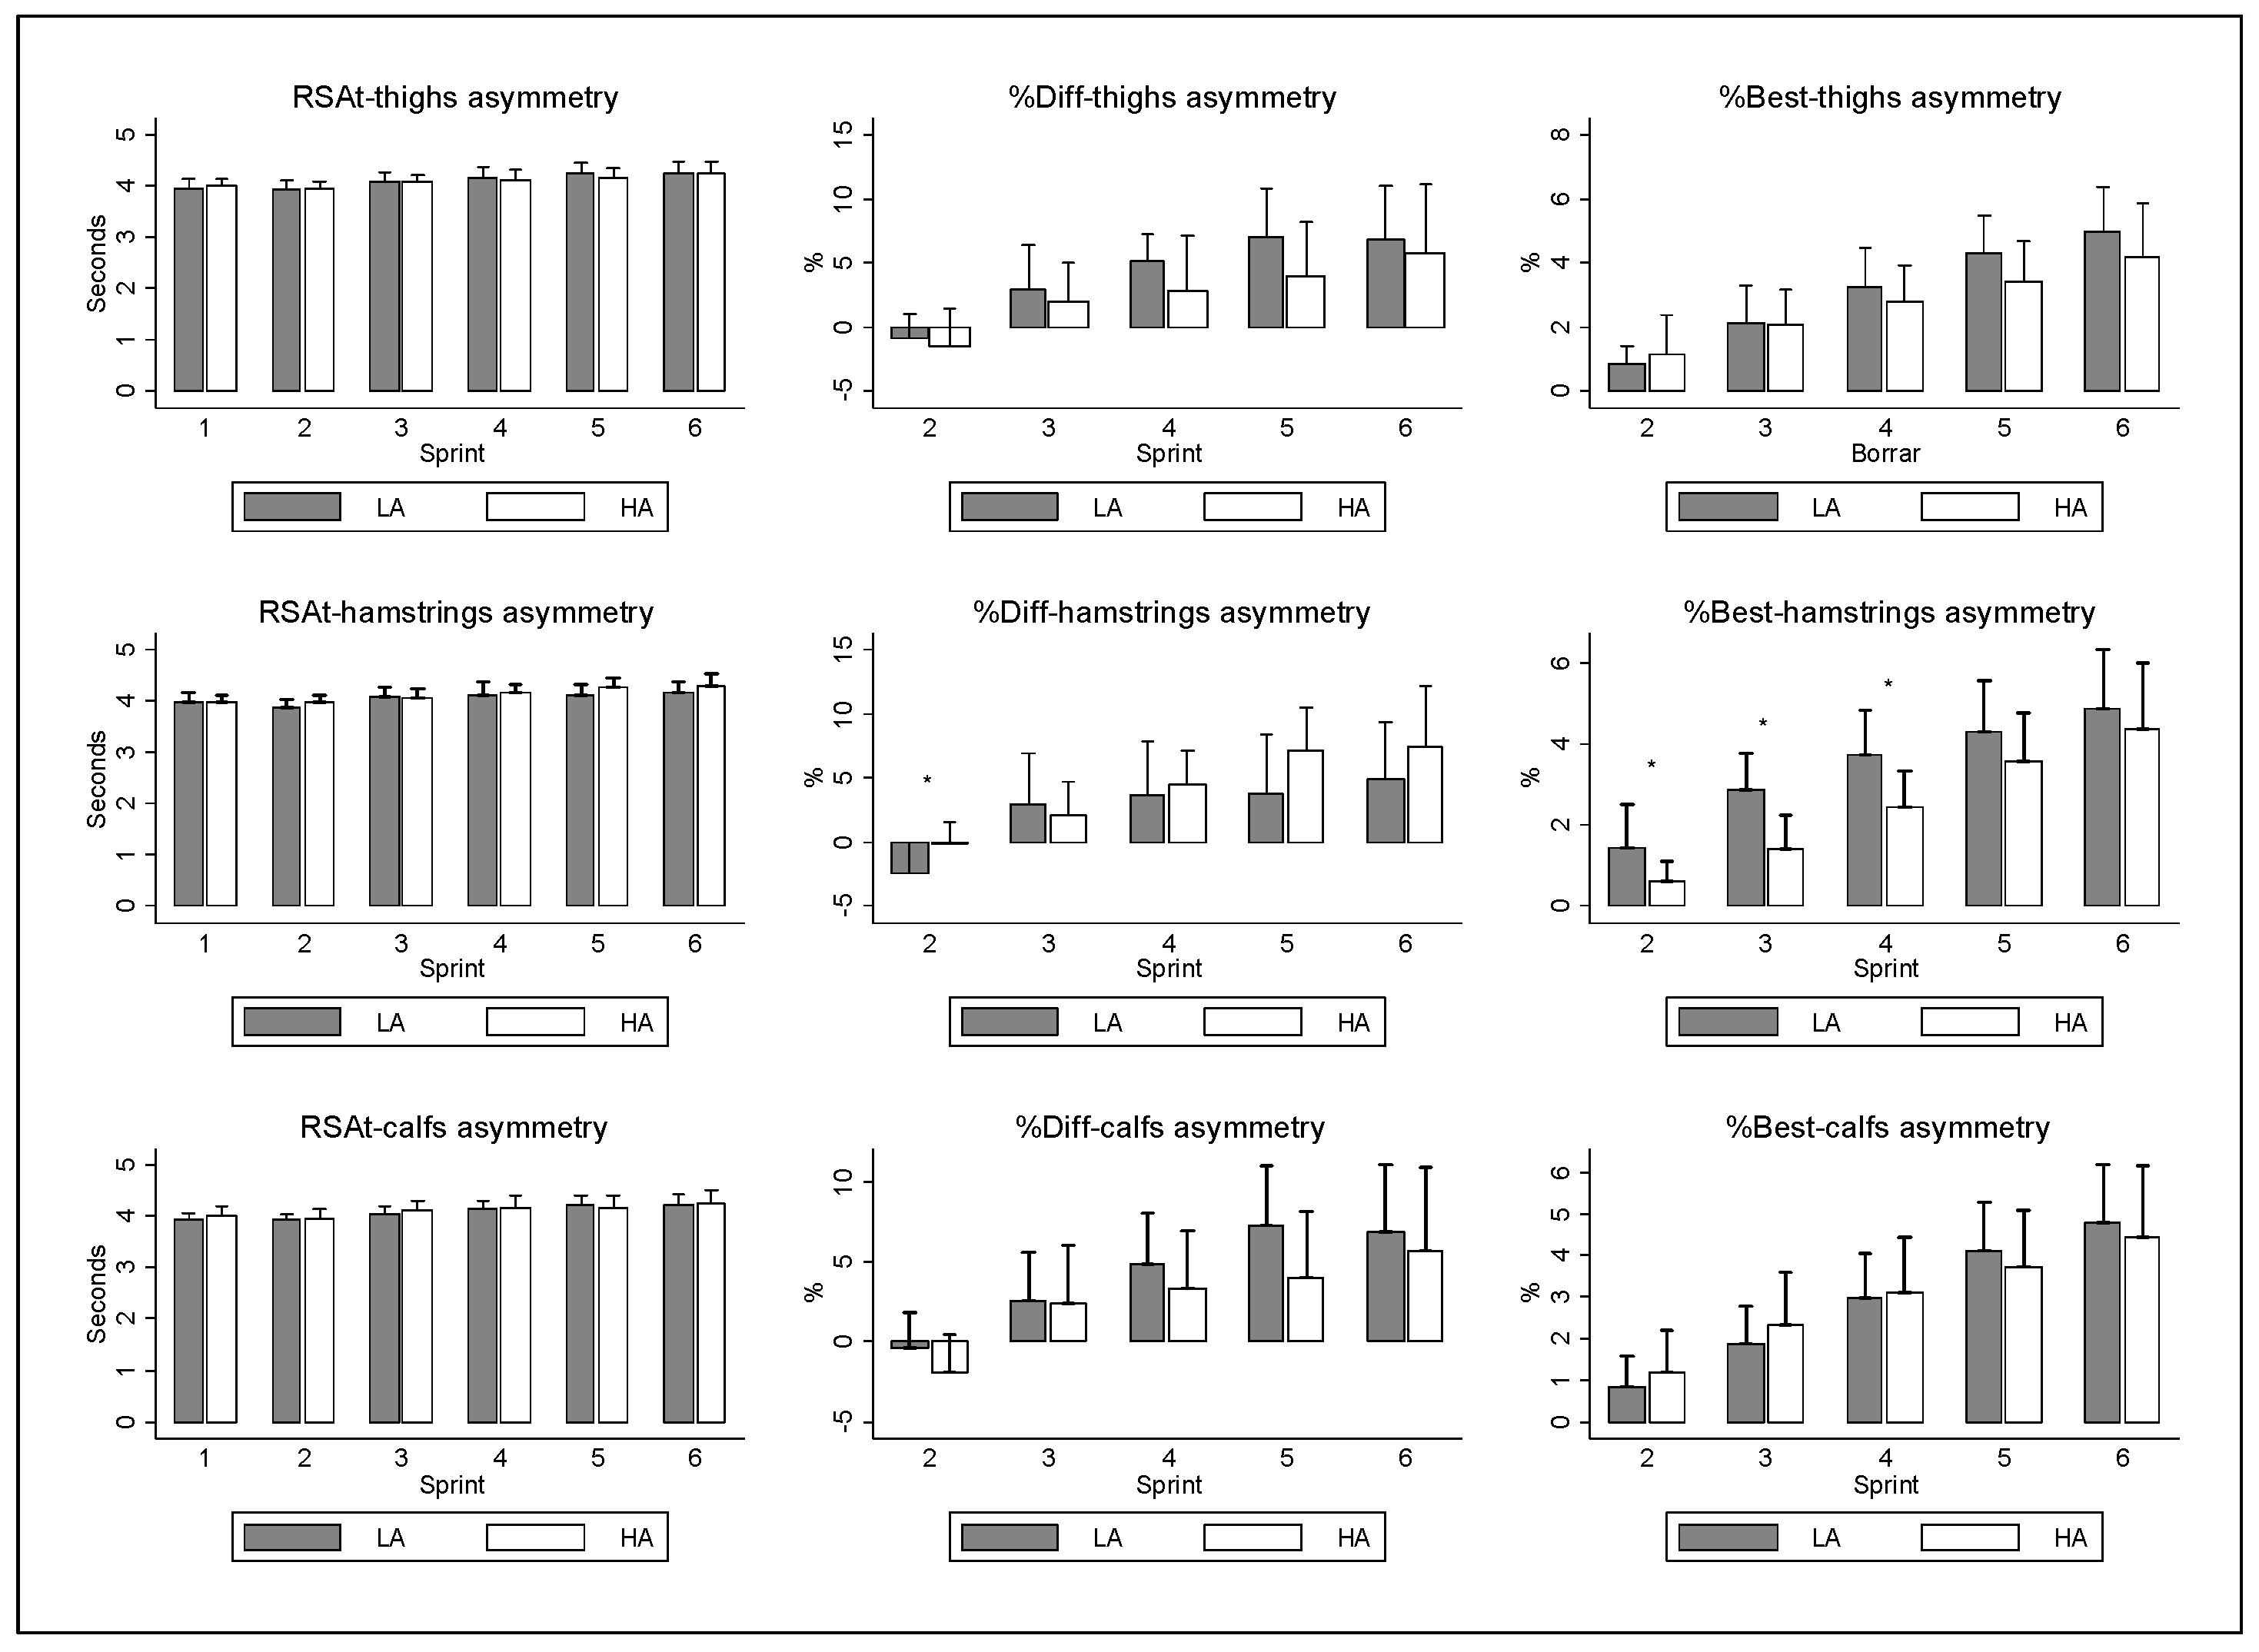
3. Results
4. Discussion
5. Conclusions
Author Contributions
Funding
Institutional Review Board Statement
Informed Consent Statement
Data Availability Statement
Acknowledgments
Conflicts of Interest
References
- Rebelo, A.; Brito, J.; Maia, J.; Coelho-e-Silva, M.; Figueiredo, A.; Bangsbo, J.; Malina, R.M.; Seabra, A. Anthropometric characteristics, physical fitness and technical performance of under-19 soccer players by competitive level and field position. Int. J. Sport. Med. 2013, 34, 312–317. [Google Scholar] [CrossRef] [PubMed]
- Iaia, F.M.; Ermanno, R.; Bangsbo, J. High-intensity training in football. Int. J. Sport. Physiol. Perform. 2009, 4, 291–306. [Google Scholar] [CrossRef] [PubMed]
- López-Valenciano, A.; Ruiz-Pérez, I.; Garcia-Gómez, A.; Vera-Garcia, F.J.; Croix, M.D.S.; Myer, G.D.; Ayala, F. Epidemiology of injuries in professional football: A systematic review and meta-analysis. Br. J. Sport. Med. 2020, 54, 711–718. [Google Scholar] [CrossRef] [PubMed]
- Ekstrand, J.; Hägglund, M.; Waldén, M. Epidemiology of muscle injuries in professional football (soccer). Am. J. Sport. Med. 2011, 39, 1226–1232. [Google Scholar] [CrossRef]
- Halson, S.L. Monitoring training load to understand fatigue in athletes. Sport. Med. 2014, 44, 139–147. [Google Scholar] [CrossRef]
- Ekstrand, J. Epidemiology of football injuries. Sci. Sport. 2008, 23, 73–77. [Google Scholar] [CrossRef]
- Gabbett, T.J.; Jenkins, D.G. Relationship between training load and injury in professional rugby league players. J. Sci. Med. Sport 2011, 14, 204–209. [Google Scholar] [CrossRef]
- Alexiou, H.; Coutts, A.J. A comparison of methods used for quantifying internal training load in women soccer players. Int. J. Sport. Physiol. Perform. 2008, 3, 320–330. [Google Scholar] [CrossRef]
- Buchheit, M.; Racinais, S.; Bilsborough, J.; Bourdon, P.; Voss, S.; Hocking, J.; Cordy, J.; Mendez-Villanueva, A.; Coutts, A. Monitoring fitness, fatigue and running performance during a pre-season training camp in elite football players. J. Sci. Med. Sport 2013, 16, 550–555. [Google Scholar] [CrossRef]
- Coyne, J.O.C.; Gregory Haff, G.; Coutts, A.J.; Newton, R.U.; Nimphius, S. The Current State of Subjective Training Load Monitoring—A Practical Perspective and Call to Action. Sport. Med.—Open 2018, 4, 58. [Google Scholar] [CrossRef]
- Chuckravanen, D.; Bulut, S.; Kürklü, G.; Yapali, G. Review of exercise-induced physiological control models to explain the development of fatigue to improve sports performance and future trend. Sci. Sport. 2019, 34, 131–140. [Google Scholar] [CrossRef]
- Turner, A.N.; Stewart, P.F. Repeat sprint ability. Strength Cond. J. 2013, 35, 37–41. [Google Scholar] [CrossRef]
- Brownstein, C.G.; Dent, J.P.; Parker, P.; Hicks, K.M.; Howatson, G.; Goodall, S.; Thomas, K. Etiology and recovery of neuromuscular fatigue following competitive soccer match-play. Front. Physiol. 2017, 8, 831. [Google Scholar] [CrossRef]
- Morcillo, J.A.; Jiménez-Reyes, P.; Cuadrado-Peñafiel, V.; Lozano, E.; Ortega-Becerra, M.; Párraga, J. Relationships between repeated sprint ability, mechanical parameters, and blood metabolites in professional soccer players. J. Strength Cond. Res. 2015, 29, 1673–1682. [Google Scholar] [CrossRef]
- Watkins, C.M.; Barillas, S.R.; Wong, M.A.; Archer, D.C.; Dobbs, I.J.; Lockie, R.G.; Coburn, J.W.; Tran, T.T.; Brown, L.E. Determination of vertical jump as a measure of neuromuscular readiness and fatigue. J. Strength Cond. Res. 2017, 31, 3305–3310. [Google Scholar] [CrossRef]
- Balsalobre-Fernández, C.; Tejero-González, C.M.; del Campo-Vecino, J. Relationships between training load, salivary cortisol responses and performance during season training in middle and long distance runners. PloS ONE 2014, 9, e106066. [Google Scholar] [CrossRef][Green Version]
- Morin, J.-B.; Dupuy, J.; Samozino, P. Performance and fatigue during repeated sprints: What is the appropriate sprint dose? J. Strength Cond. Res. 2011, 25, 1918–1924. [Google Scholar] [CrossRef]
- Gathercole, R.; Sporer, B.; Stellingwerff, T.; Sleivert, G. Alternative countermovement-jump analysis to quantify acute neuromuscular fatigue. Int. J. Sport. Physiol. Perform. 2015, 10, 84–92. [Google Scholar] [CrossRef]
- Hildebrandt, C.; Zeilberger, K.; Ring, E.F.J.; Raschner, C. The application of medical infrared thermography in sports medicine. Int. Perspect. Top. Sport. Med. Sport. Inj. 2012, 534, 257–274. [Google Scholar]
- Fernández Cuevas, I. Effect of Endurance, Speed and Strength Training on Skin Temperature Measured by Infrared Thermography = Efecto del Entrenamiento de Resistencia, Velocidad y Fuerza en la Temperatura de la Piel a Través de la Termografía Infrarroja. Ph.D. Thesis, Facultad de Ciencias de la Actividad Física y del Deporte, Madrid, Spain, 2012. [Google Scholar]
- Alfieri, F.M.; Battistella, L.R. Body temperature of healthy men evaluated by thermography: A study of reproducibility. Technol. Health Care 2018, 26, 559–564. [Google Scholar] [CrossRef]
- Fernández-Cuevas, I.; Marins, J.C.B.; Lastras, J.A.; Carmona, P.M.G.; Cano, S.P.; García-Concepción, M.Á.; Sillero-Quintana, M. Classification of factors influencing the use of infrared thermography in humans: A review. Infrared Phys. Technol. 2015, 71, 28–55. [Google Scholar] [CrossRef]
- Fernández-Cuevas, I.; Lastras, J.A.; Galindo, V.E.; Carmona, P.G. Infrared thermography for the detection of injury in sports medicine. In Application of Infrared Thermography in Sports Science; Springer: Berlin, Germany, 2017; pp. 81–109. [Google Scholar]
- Barcelos, E.Z.; Caminhas, W.M.; Ribeiro, E.; Pimenta, E.M.; Palhares, R.M. A combined method for segmentation and registration for an advanced and progressive evaluation of thermal images. Sensors 2014, 14, 21950–21967. [Google Scholar] [CrossRef] [PubMed]
- Gómez-Carmona, P.; Fernández-Cuevas, I.; Sillero-Quintana, M.; Arnaiz-Lastras, J.; Navandar, A. Infrared thermography protocol on reducing the incidence of soccer injuries. J. Sport Rehabil. 2020, 29, 1222–1227. [Google Scholar] [CrossRef] [PubMed]
- Côrte, A.C.; Pedrinelli, A.; Marttos, A.; Souza, I.F.G.; Grava, J.; Hernandez, A.J. Infrared thermography study as a complementary method of screening and prevention of muscle injuries: Pilot study. BMJ Open Sport Exerc. Med. 2019, 5, e000431. [Google Scholar] [CrossRef] [PubMed]
- Moreira, D.G.; Costello, J.T.; Brito, C.J.; Adamczyk, J.G.; Ammer, K.; Bach, A.J.; Costa, C.M.; Eglin, C.; Fernandes, A.A.; Fernández-Cuevas, I. Thermographic imaging in sports and exercise medicine: A Delphi study and consensus statement on the measurement of human skin temperature. J. Therm. Biol. 2017, 69, 155–162. [Google Scholar] [CrossRef]
- Howard, R.M.; Conway, R.; Harrison, A.J. Muscle activity in sprinting: A review. Sport. Biomech. 2018, 17, 1–17. [Google Scholar] [CrossRef]
- Schache, A.G.; Dorn, T.W.; Blanch, P.D.; Brown, N.A.; Pandy, M.G. Mechanics of the human hamstring muscles during sprinting. Med. Sci. Sport. Exerc. 2012, 44, 647–658. [Google Scholar] [CrossRef]
- Higashihara, A.; Ono, T.; Kubota, J.; Okuwaki, T.; Fukubayashi, T. Functional differences in the activity of the hamstring muscles with increasing running speed. J. Sport. Sci. 2010, 28, 1085–1092. [Google Scholar] [CrossRef]
- Kyröläinen, H.; Avela, J.; Komi, P.V. Changes in muscle activity with increasing running speed. J. Sport. Sci. 2005, 23, 1101–1109. [Google Scholar] [CrossRef]
- Chumanov, E.S.; Heiderscheit, B.C.; Thelen, D.G. The effect of speed and influence of individual muscles on hamstring mechanics during the swing phase of sprinting. J. Biomech. 2007, 40, 3555–3562. [Google Scholar] [CrossRef]
- Colino, E.; Felipe, J.L.; Van Hooren, B.; Gallardo, L.; Meijer, K.; Lucia, A.; Lopez-Fernandez, J.; Garcia-Unanue, J. Mechanical properties of treadmill surfaces compared to other overground sport surfaces. Sensors 2020, 20, 3822. [Google Scholar] [CrossRef]
- Claudino, J.G.; Cronin, J.; Mezêncio, B.; McMaster, D.T.; McGuigan, M.; Tricoli, V.; Amadio, A.C.; Serrão, J.C. The countermovement jump to monitor neuromuscular status: A meta-analysis. J. Sci. Med. Sport 2017, 20, 397–402. [Google Scholar] [CrossRef]


| Low Asymmetry | High Asymmetry | ||
|---|---|---|---|
| Thigh asymmetry | CMJ Pre | 39.30 ± 3.59 | 38.78 ± 4.74 |
| CMJ Post | 34.35 ± 4.07 | 35.13 ± 4.64 | |
| Diff CMJ | −4.96 ± 3.12 | −3.65 ± 3.17 | |
| Hamstring asymmetry | CMJ Pre | 40.80 ± 3.62 | 37.79 ± 3.95 |
| CMJ Post | 37.23 ± 3.78 | 32.78 ± 3.59 * | |
| Diff CMJ | −3.58 ± 3.28 | −5.01 ± 3.01 | |
| Calf asymmetry | CMJ Pre | 38.98 ± 4.41 | 39.19 ± 3.77 |
| CMJ Post | 34.15 ± 3.97 | 35.27 ± 4.64 | |
| Diff CMJ | −4.83 ± 2.53 | −3.92 ± 3.77 |
Disclaimer/Publisher’s Note: The statements, opinions and data contained in all publications are solely those of the individual author(s) and contributor(s) and not of MDPI and/or the editor(s). MDPI and/or the editor(s) disclaim responsibility for any injury to people or property resulting from any ideas, methods, instructions or products referred to in the content. |
© 2023 by the authors. Licensee MDPI, Basel, Switzerland. This article is an open access article distributed under the terms and conditions of the Creative Commons Attribution (CC BY) license (https://creativecommons.org/licenses/by/4.0/).
Share and Cite
Majano, C.; García-Unanue, J.; Hernandez-Martin, A.; Sánchez-Sánchez, J.; Gallardo, L.; Felipe, J.L. Relationship between Repeated Sprint Ability, Countermovement Jump and Thermography in Elite Football Players. Sensors 2023, 23, 631. https://doi.org/10.3390/s23020631
Majano C, García-Unanue J, Hernandez-Martin A, Sánchez-Sánchez J, Gallardo L, Felipe JL. Relationship between Repeated Sprint Ability, Countermovement Jump and Thermography in Elite Football Players. Sensors. 2023; 23(2):631. https://doi.org/10.3390/s23020631
Chicago/Turabian StyleMajano, Carlos, Jorge García-Unanue, Antonio Hernandez-Martin, Javier Sánchez-Sánchez, Leonor Gallardo, and Jose Luis Felipe. 2023. "Relationship between Repeated Sprint Ability, Countermovement Jump and Thermography in Elite Football Players" Sensors 23, no. 2: 631. https://doi.org/10.3390/s23020631
APA StyleMajano, C., García-Unanue, J., Hernandez-Martin, A., Sánchez-Sánchez, J., Gallardo, L., & Felipe, J. L. (2023). Relationship between Repeated Sprint Ability, Countermovement Jump and Thermography in Elite Football Players. Sensors, 23(2), 631. https://doi.org/10.3390/s23020631