
Automated Arrhythmia Classification Using Farmland Fertility Algorithm with Hybrid Deep Learning Model on Internet of Things Environment

 , ,
, ,
Abstract
:1. Introduction
- Presentation of an automated AAC-FFAHDL technique comprising pre-processing, HDL-based classification, and FFA-based hyperparameter tuning for arrhythmia classification. To the best of the authors’ knowledge, the AAC-FFAHDL model has never been presented in the literature.
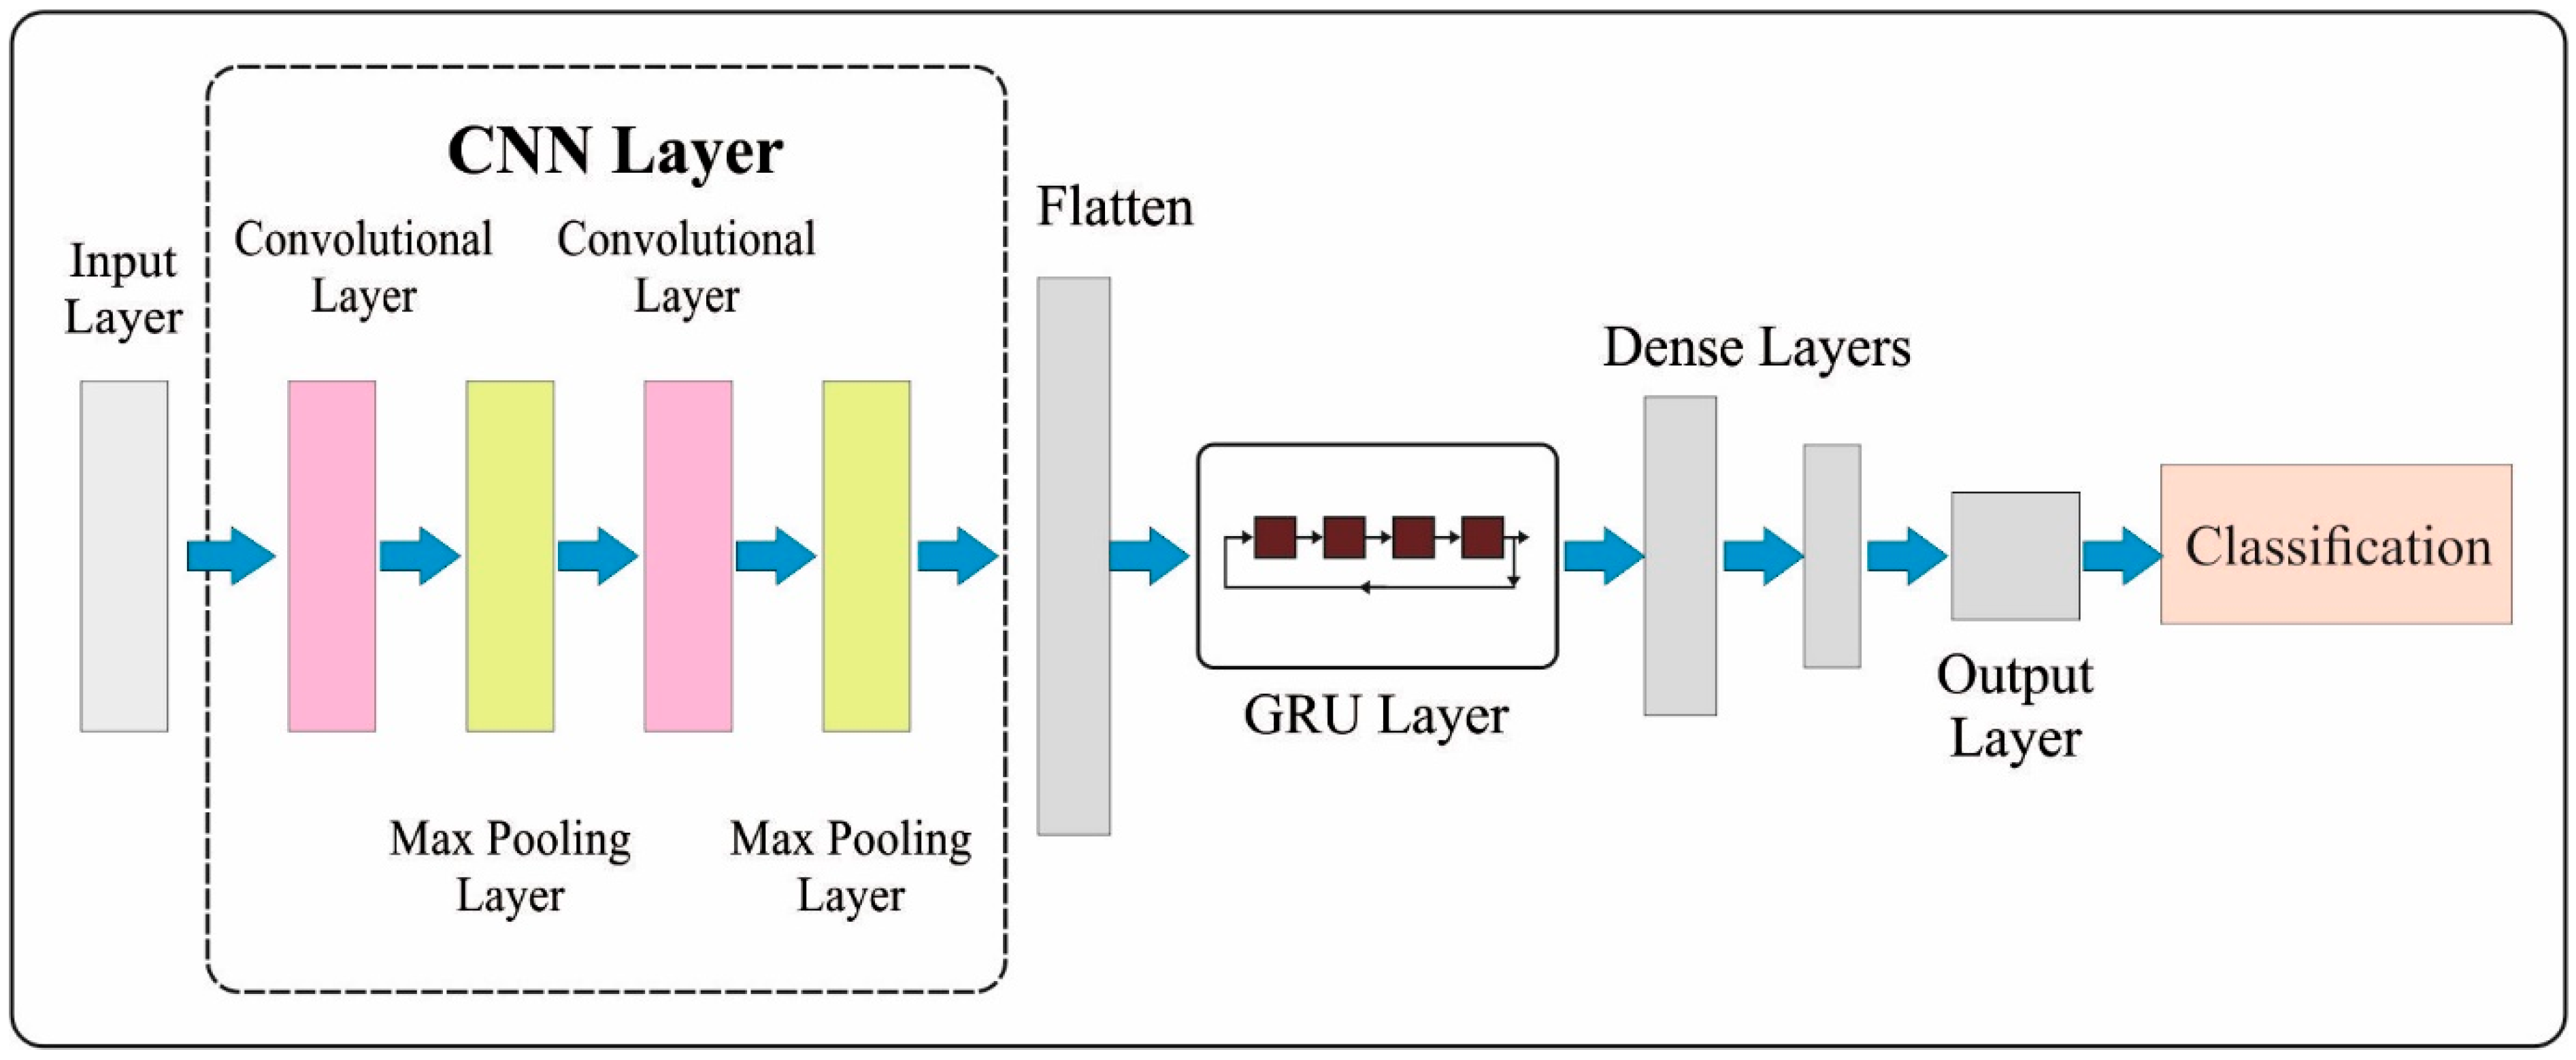
- Employment of the HDL model for the classification process, which leverages the benefits of both CNN and GRU models.
- Hyperparameter optimization of the HDL model using the FFA algorithm through a cross-validation method helps in boosting the predictive outcomes of the AAC-FFAHDL model for unseen data.
2. Related Works
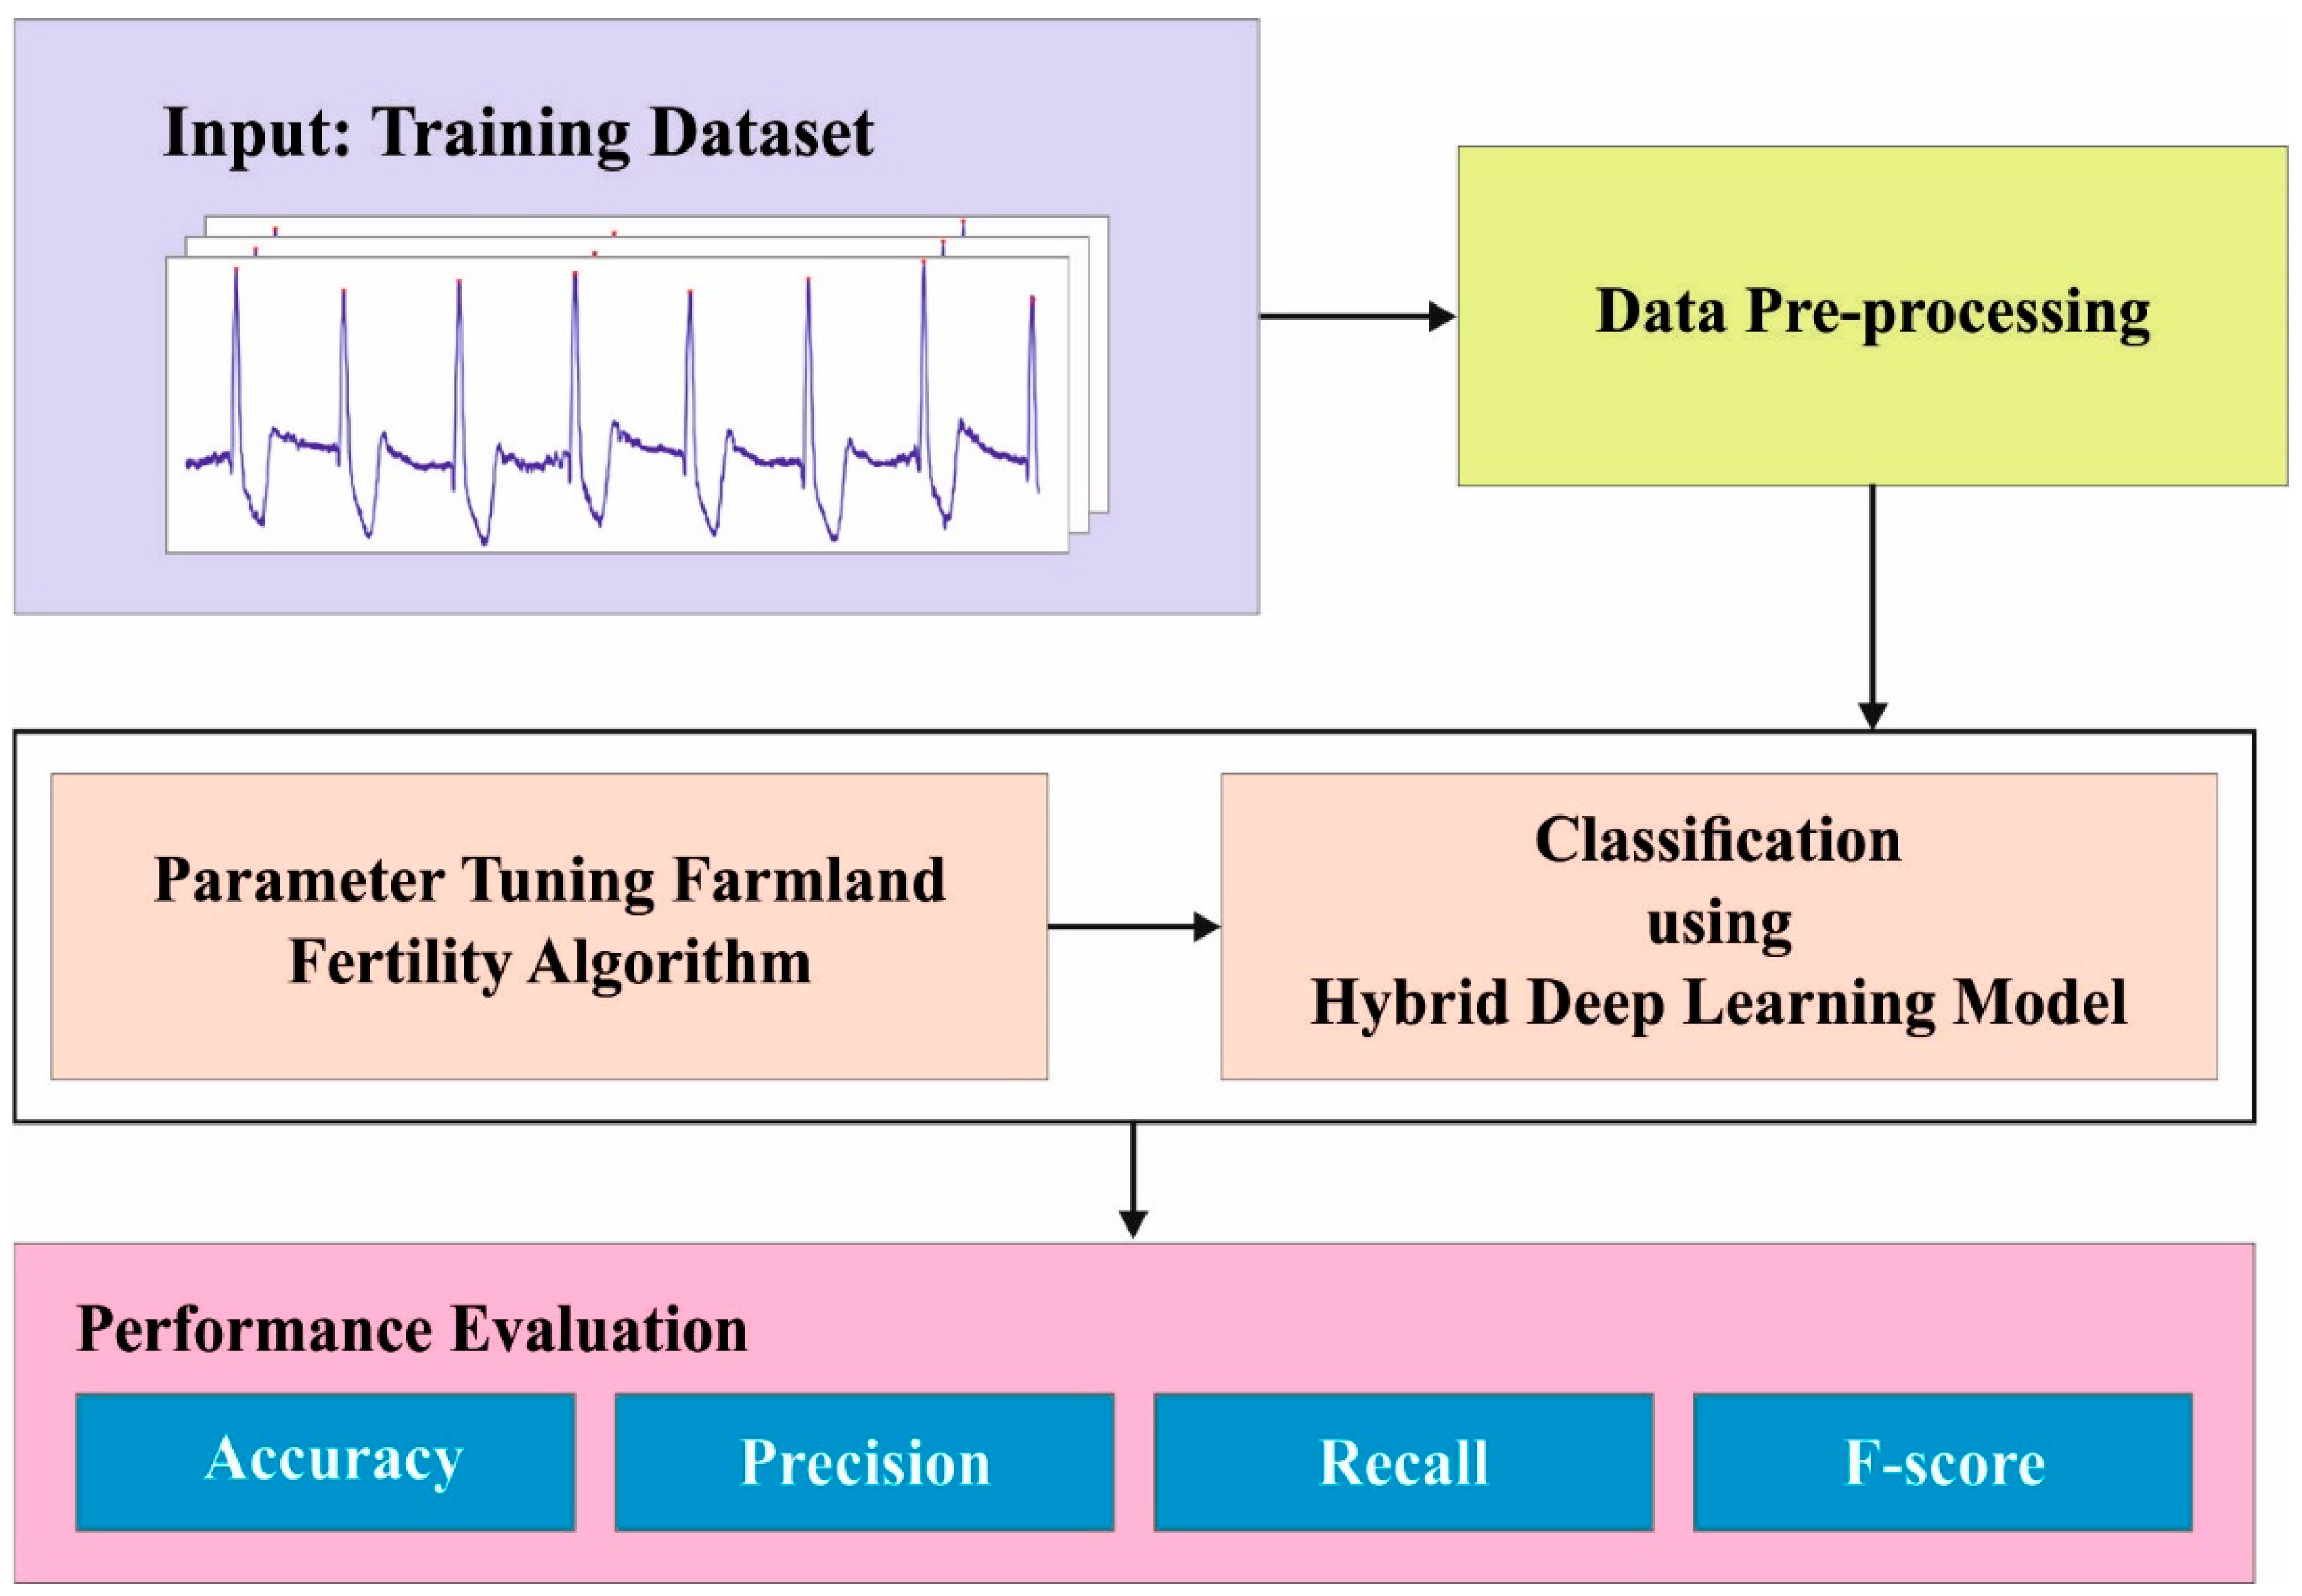
3. The Proposed Model
3.1. Data Pre-Processing
3.2. Arrhythmia Detection Using HDL Model
3.3. Parameter Tuning using FFA
4. Results and Discussion
5. Conclusions
Author Contributions
Funding
Institutional Review Board Statement
Informed Consent Statement
Data Availability Statement
Conflicts of Interest
References
- Kumar, A.; Kumar, S.A.; Dutt, V.; Shitharth, S.; Tripathi, E. IoT based arrhythmia classification using the enhanced hunt optimization-based deep learning. Expert Syst. 2023, 40, e13298. [Google Scholar] [CrossRef]
- Kodati, S.; Reddy, K.P.; Ravi, G.; Sreekanth, N. IoT-based System for Health Monitoring of Arrhythmia Patients Using Machine Learning Classification Techniques. In Proceedings of the International Conference on Soft Computing and Signal Processing, Hyderabad, India, 22–24 June 2021; pp. 283–293. [Google Scholar]
- Bechinia, H.; Benmerzoug, D. A deep learning approach for arrhythmia detection and classification based on IoT wearable technology. In Proceedings of the 2022 First International Conference on Big Data, IoT, Web Intelligence and Applications (BIWA), Sidi Bel Abbes, Algeria, 11–12 December 2022; pp. 7–12. [Google Scholar]
- KA, A.N.; Jeena, R.S.; Niyas, P. Deep Neural Network Based Real Time Multi-Class Arrhythmia Classification in IoT-Cloud Platform. 2021. Available online: https://assets.researchsquare.com/files/rs-603991/v1_covered.pdf?c=1631869570 (accessed on 12 September 2023).
- Alnaggar, M.; Handosa, M.; Medhat, T.; Rashad, M.Z. An IoT-based Framework for Detecting Heart Conditions using Machine Learning. Int. J. Adv. Comput. Sci. Appl. 2023, 14. [Google Scholar] [CrossRef]
- Yathish, D.P. Early Detection of Cardiac Arrhythmia Disease using Machine Learning and IoT Technologies. In Proceedings of the 2021 2nd International Conference on Smart Electronics and Communication (ICOSEC), Trichy, India, 7–9 October 2021; pp. 1658–1661. [Google Scholar]
- Varghese, A.; Muraleedharan Sylaja, M.; Kurian, J. Conception and realization of an IoT-enabled deep CNN decision support system for automated arrhythmia classification. J. Intell. Syst. 2022, 31, 407–419. [Google Scholar] [CrossRef]
- Sakib, S.; Fouda, M.M.; Fadlullah, Z.M. A rigorous analysis of biomedical edge computing: An arrhythmia classification use-case leveraging deep learning. In Proceedings of the 2020 IEEE International Conference on Internet of Things and Intelligence System (IoTaIS), Bali, Indonesia, 27–28 January 2021; pp. 136–141. [Google Scholar]
- Rath, A.; Mishra, D.; Panda, G.; Satapathy, S.C.; Xia, K. Improved heart disease detection from ECG signal using deep learning based ensemble model. Sustain. Comput. Inform. Syst. 2022, 35, 100732. [Google Scholar] [CrossRef]
- Kumar, A.; Kumar, M.; Mahapatra, R.P.; Bhattacharya, P.; Le, T.T.H.; Verma, S.; Kavita; Mohiuddin, K. Flamingo-Optimization-Based Deep Convolutional Neural Network for IoT-Based Arrhythmia Classification. Sensors 2023, 23, 4353. [Google Scholar] [CrossRef] [PubMed]
- Kumar, A.; Kumar, S.; Dutt, V.; Dubey, A.K.; García-Díaz, V. IoT-based ECG monitoring for arrhythmia classification using Coyote Grey Wolf optimization-based deep learning CNN classifier. Biomed. Signal Process. Control 2022, 76, 103638. [Google Scholar] [CrossRef]
- Jagadeesh, S.; Shrimali, M.; Prasad, P.S.; Maheswari, K.; Narendrakumar, A.; Reddy, K. Automated Arrhythmia Classification using Harris Hawks Optimization with Deep Learning Model on IoT Environment. In Proceedings of the 2023 Third International Conference on Artificial Intelligence and Smart Energy (ICAIS), Coimbatore, India, 2–4 February 2023; pp. 30–35. [Google Scholar]
- Karthiga, S.; Abirami, A.M. Deep Learning Convolutional Neural Network for ECG Signal Classification Aggregated Using IoT. Comput. Syst. Sci. Eng. 2022, 42. [Google Scholar] [CrossRef]
- Panda, R.; Jain, S.; Tripathy, R.K.; Acharya, U.R. Detection of shockable ventricular cardiac arrhythmias from ECG signals using FFREWT filter-bank and deep convolutional neural network. Comput. Biol. Med. 2020, 124, 103939. [Google Scholar] [CrossRef] [PubMed]
- Kumar, S.S.; Rinku, D.R.; Kumar, A.P.; Maddula, R. An IOT framework for detecting cardiac arrhythmias in real-time using deep learning resnet model. Meas. Sens. 2023, 29, 100866. [Google Scholar] [CrossRef]
- Cañón-Clavijo, R.E.; Montenegro-Marin, C.E.; Gaona-Garcia, P.A.; Ortiz-Guzmán, J. IoT Based System for Heart Monitoring and Arrhythmia Detection Using Machine Learning. J. Healthc. Eng. 2023, 2023, 6401673. [Google Scholar] [CrossRef] [PubMed]
- Hemalatha, M. Optimal AdaBoost kernel support vector machine for monitoring arrhythmia patients utilizing Internet of Things-cloud environment. Concurr. Comput. Pract. Exp. 2022, 34, e7298. [Google Scholar] [CrossRef]
- Prajitha, C.; Sridhar, K.P.; Baskar, S. ECG diagnosis for arrhythmia detection with a cloud-based service and a wearable sensor network in a smart city environment. Front. Sustain. Cities 2022, 4, 1073486. [Google Scholar] [CrossRef]
- Cheikhrouhou, O.; Mahmud, R.; Zouari, R.; Ibrahim, M.; Zaguia, A.; Gia, T.N. One-dimensional CNN approach for ECG arrhythmia analysis in fog-cloud environments. IEEE Access 2021, 9, 103513–103523. [Google Scholar] [CrossRef]
- Lu, W.; Jiang, J.; Ma, L.; Chen, H.; Wu, H.; Gong, M.; Jiang, X.; Fan, M. An arrhythmia classification algorithm using C-LSTM in physiological parameters monitoring system under internet of health things environment. J. Ambient Intell. Humaniz. Comput. 2021, 1–11. [Google Scholar] [CrossRef]
- Zhang, P.; Hang, Y.; Ye, X.; Guan, P.; Jiang, J.; Tan, J.; Hu, W. A United CNN-LSTM algorithm combining RR wave signals to detect arrhythmia in the 5G-enabled medical internet of things. IEEE Internet Things J. 2021, 9, 14563–14571. [Google Scholar] [CrossRef]
- Yadav, S.; Kadam, V.; Jadhav, S. Machine learning algorithms for the diagnosis of cardiac arrhythmia in IoT environment. In Proceedings of the International Conference on Recent Trends in Image Processing and Pattern Recognition, Aurangabad, India, 3–4 January 2020; Springer: Singapore; pp. 95–107. [Google Scholar]
- Henry, A.; Gautam, S.; Khanna, S.; Rabie, K.; Shongwe, T.; Bhattacharya, P.; Sharma, B.; Chowdhury, S. Composition of hybrid deep learning model and feature optimization for intrusion detection system. Sensors 2023, 23, 890. [Google Scholar] [CrossRef] [PubMed]
- Gharehchopogh, F.S.; Nadimi-Shahraki, M.H.; Barshandeh, S.; Abdollahzadeh, B.; Zamani, H. Cqffa: A chaotic quasi-oppositional farmland fertility algorithm for solving engineering optimization problems. J. Bionic Eng. 2023, 20, 158–183. [Google Scholar] [CrossRef]
- Goldberger, A.L.; Amaral, L.A.N.; Glass, L.; Hausdorff, J.M.; Ivanov, P.C.; Mark, R.G.; Mietus, J.E.; Moody, G.B.; Peng, C.-K.; Stanley, H.E. Physiobank, physiotoolkit, and physionet: Components of a new research resource for complex physiologic signals. Circulation 2000, 101, 215–220. [Google Scholar] [CrossRef] [PubMed]


| Accuracy (%) | ||||||
|---|---|---|---|---|---|---|
| Training Percentage (%) | Logistic Regression | NN Model | DCNN Model | LSTM Model | Flamingo-Based Deep CNN | AAC-FFAHD |
| 40 | 93.30 | 95.98 | 96.46 | 97.37 | 98.20 | 98.63 |
| 50 | 93.42 | 95.95 | 96.61 | 97.57 | 98.62 | 98.96 |
| 60 | 93.48 | 96.15 | 96.61 | 97.59 | 98.65 | 98.98 |
| 70 | 93.52 | 96.25 | 96.60 | 97.99 | 98.73 | 98.95 |
| 80 | 93.68 | 96.38 | 96.70 | 98.12 | 98.73 | 98.98 |
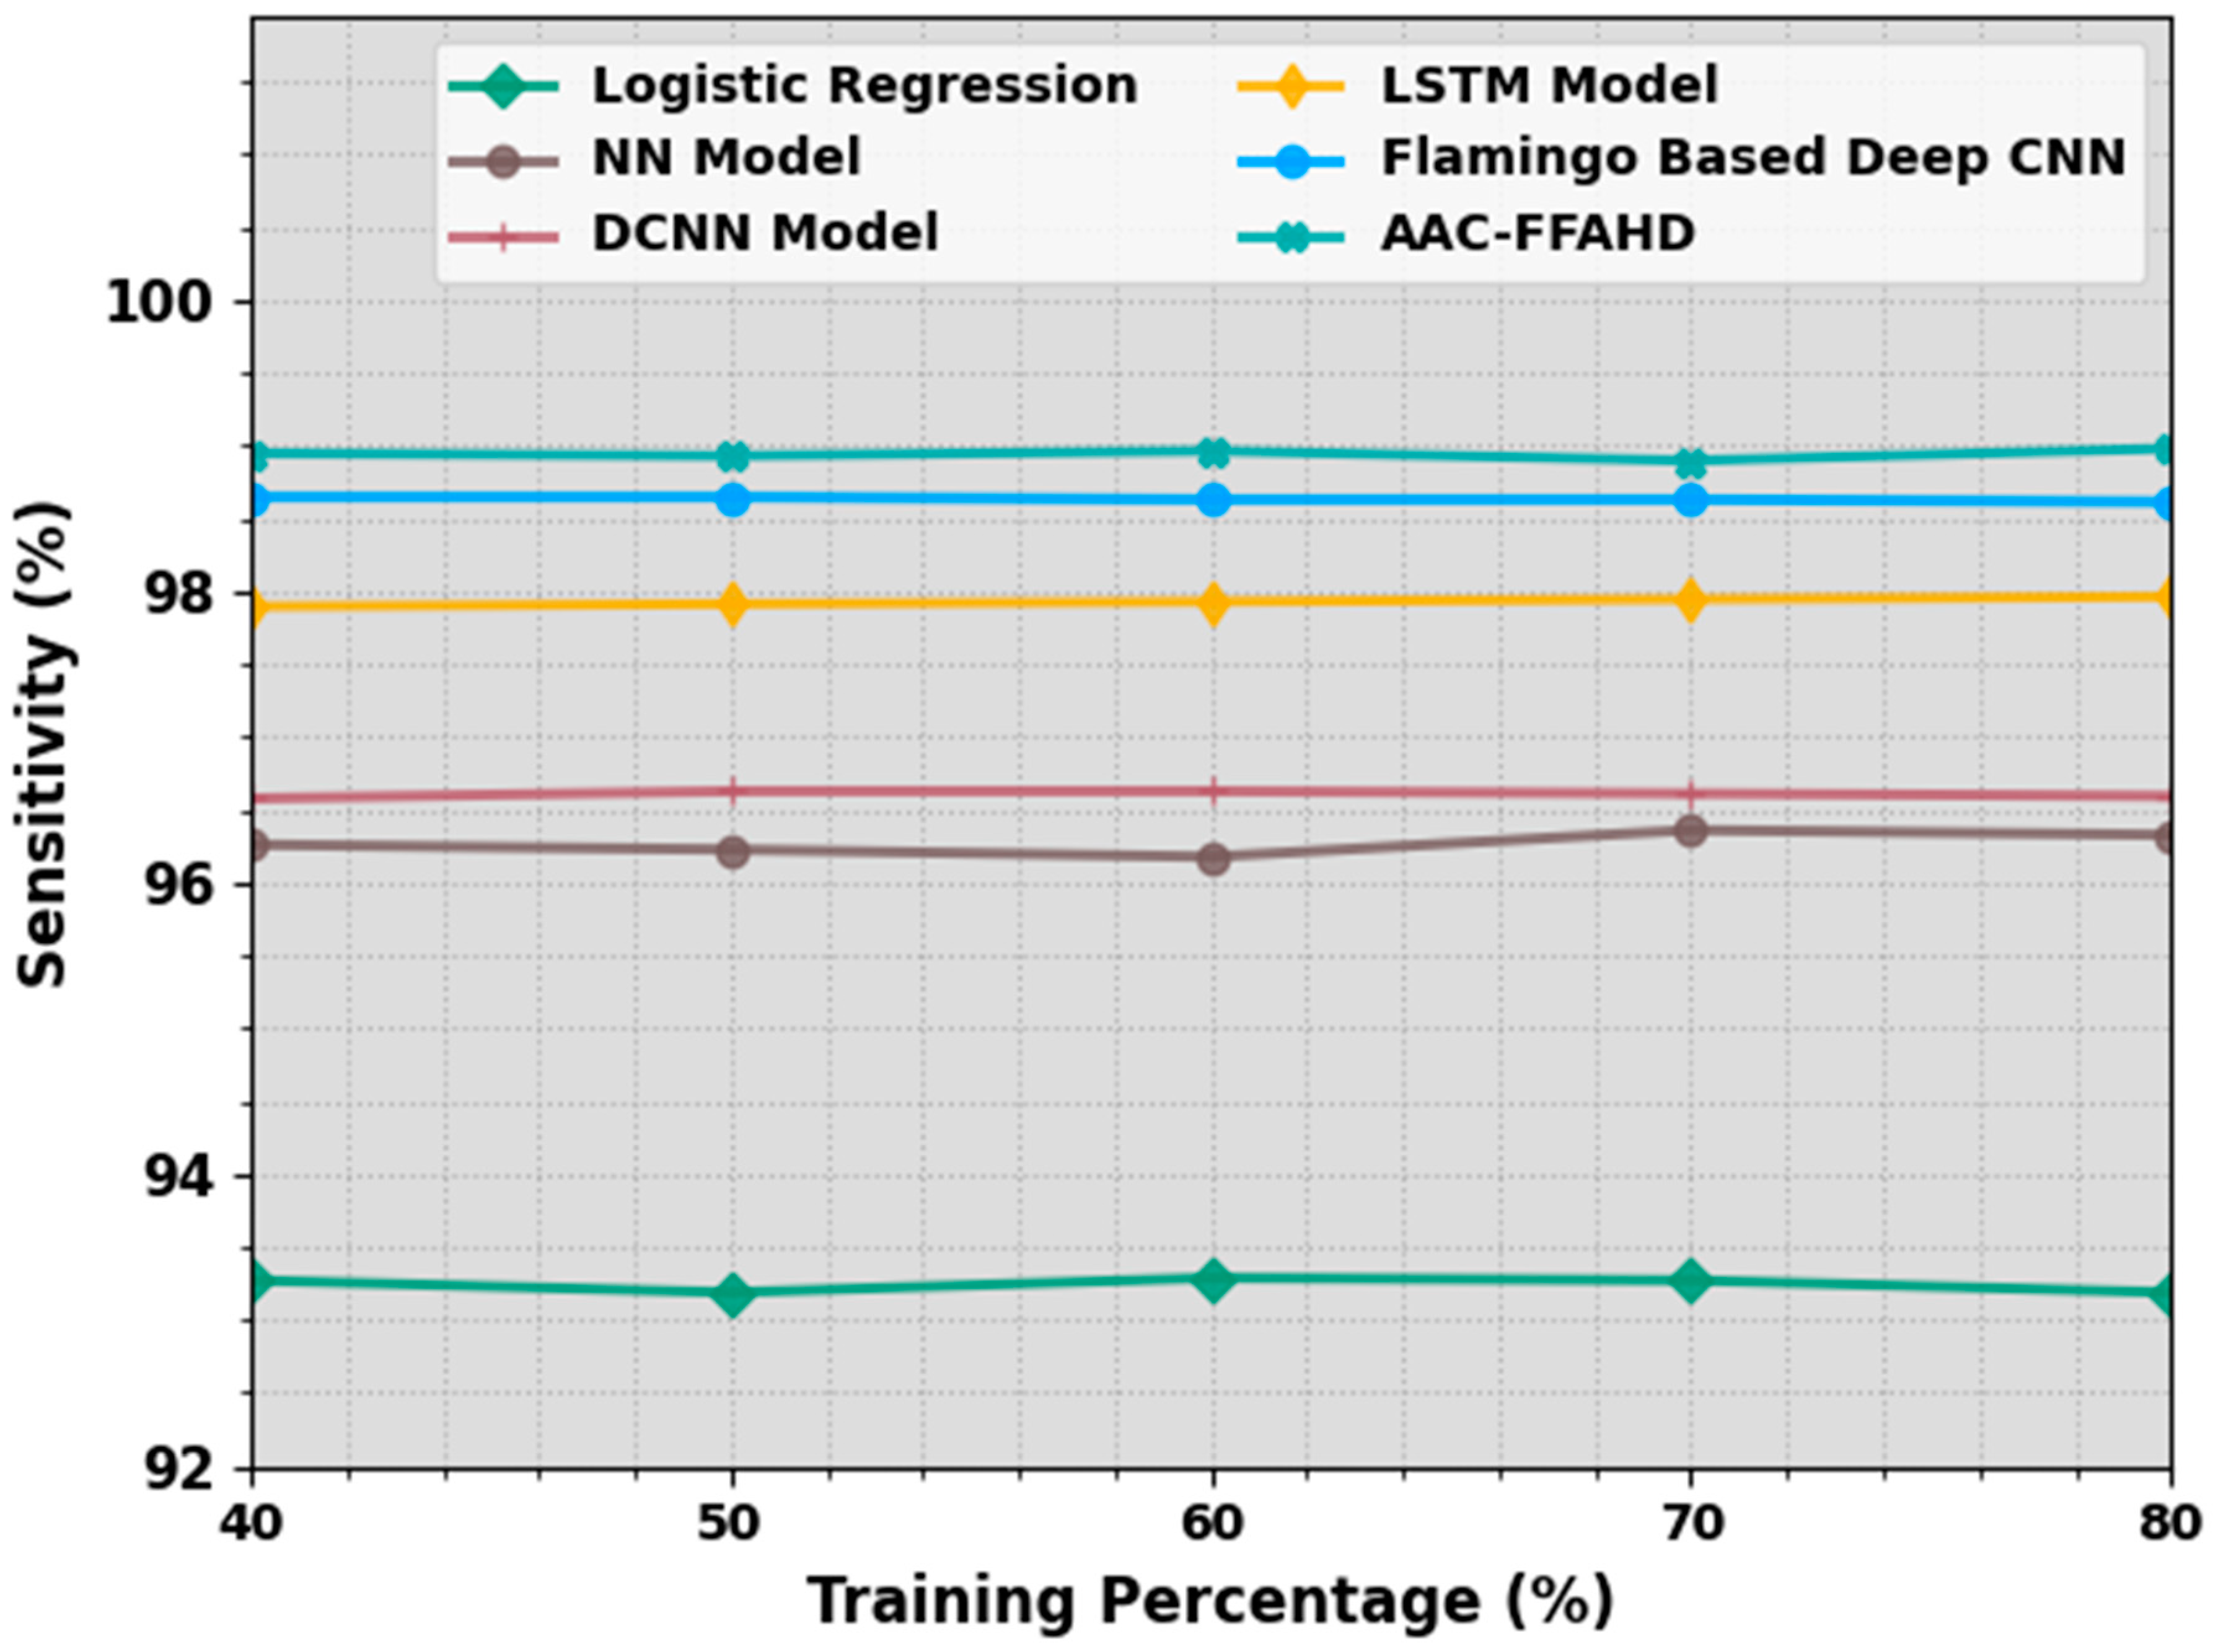
| Sensitivity (%) | ||||||
|---|---|---|---|---|---|---|
| Training Percentage (%) | Logistic Regression | NN Model | DCNN Model | LSTM Model | Flamingo-Based Deep CNN | AAC-FFAHD |
| 40 | 93.27 | 96.26 | 96.58 | 97.90 | 98.65 | 98.95 |
| 50 | 93.19 | 96.23 | 96.63 | 97.91 | 98.65 | 98.93 |
| 60 | 93.29 | 96.18 | 96.63 | 97.93 | 98.63 | 98.96 |
| 70 | 93.27 | 96.36 | 96.61 | 97.95 | 98.63 | 98.90 |
| 80 | 93.19 | 96.33 | 96.59 | 97.96 | 98.61 | 98.98 |
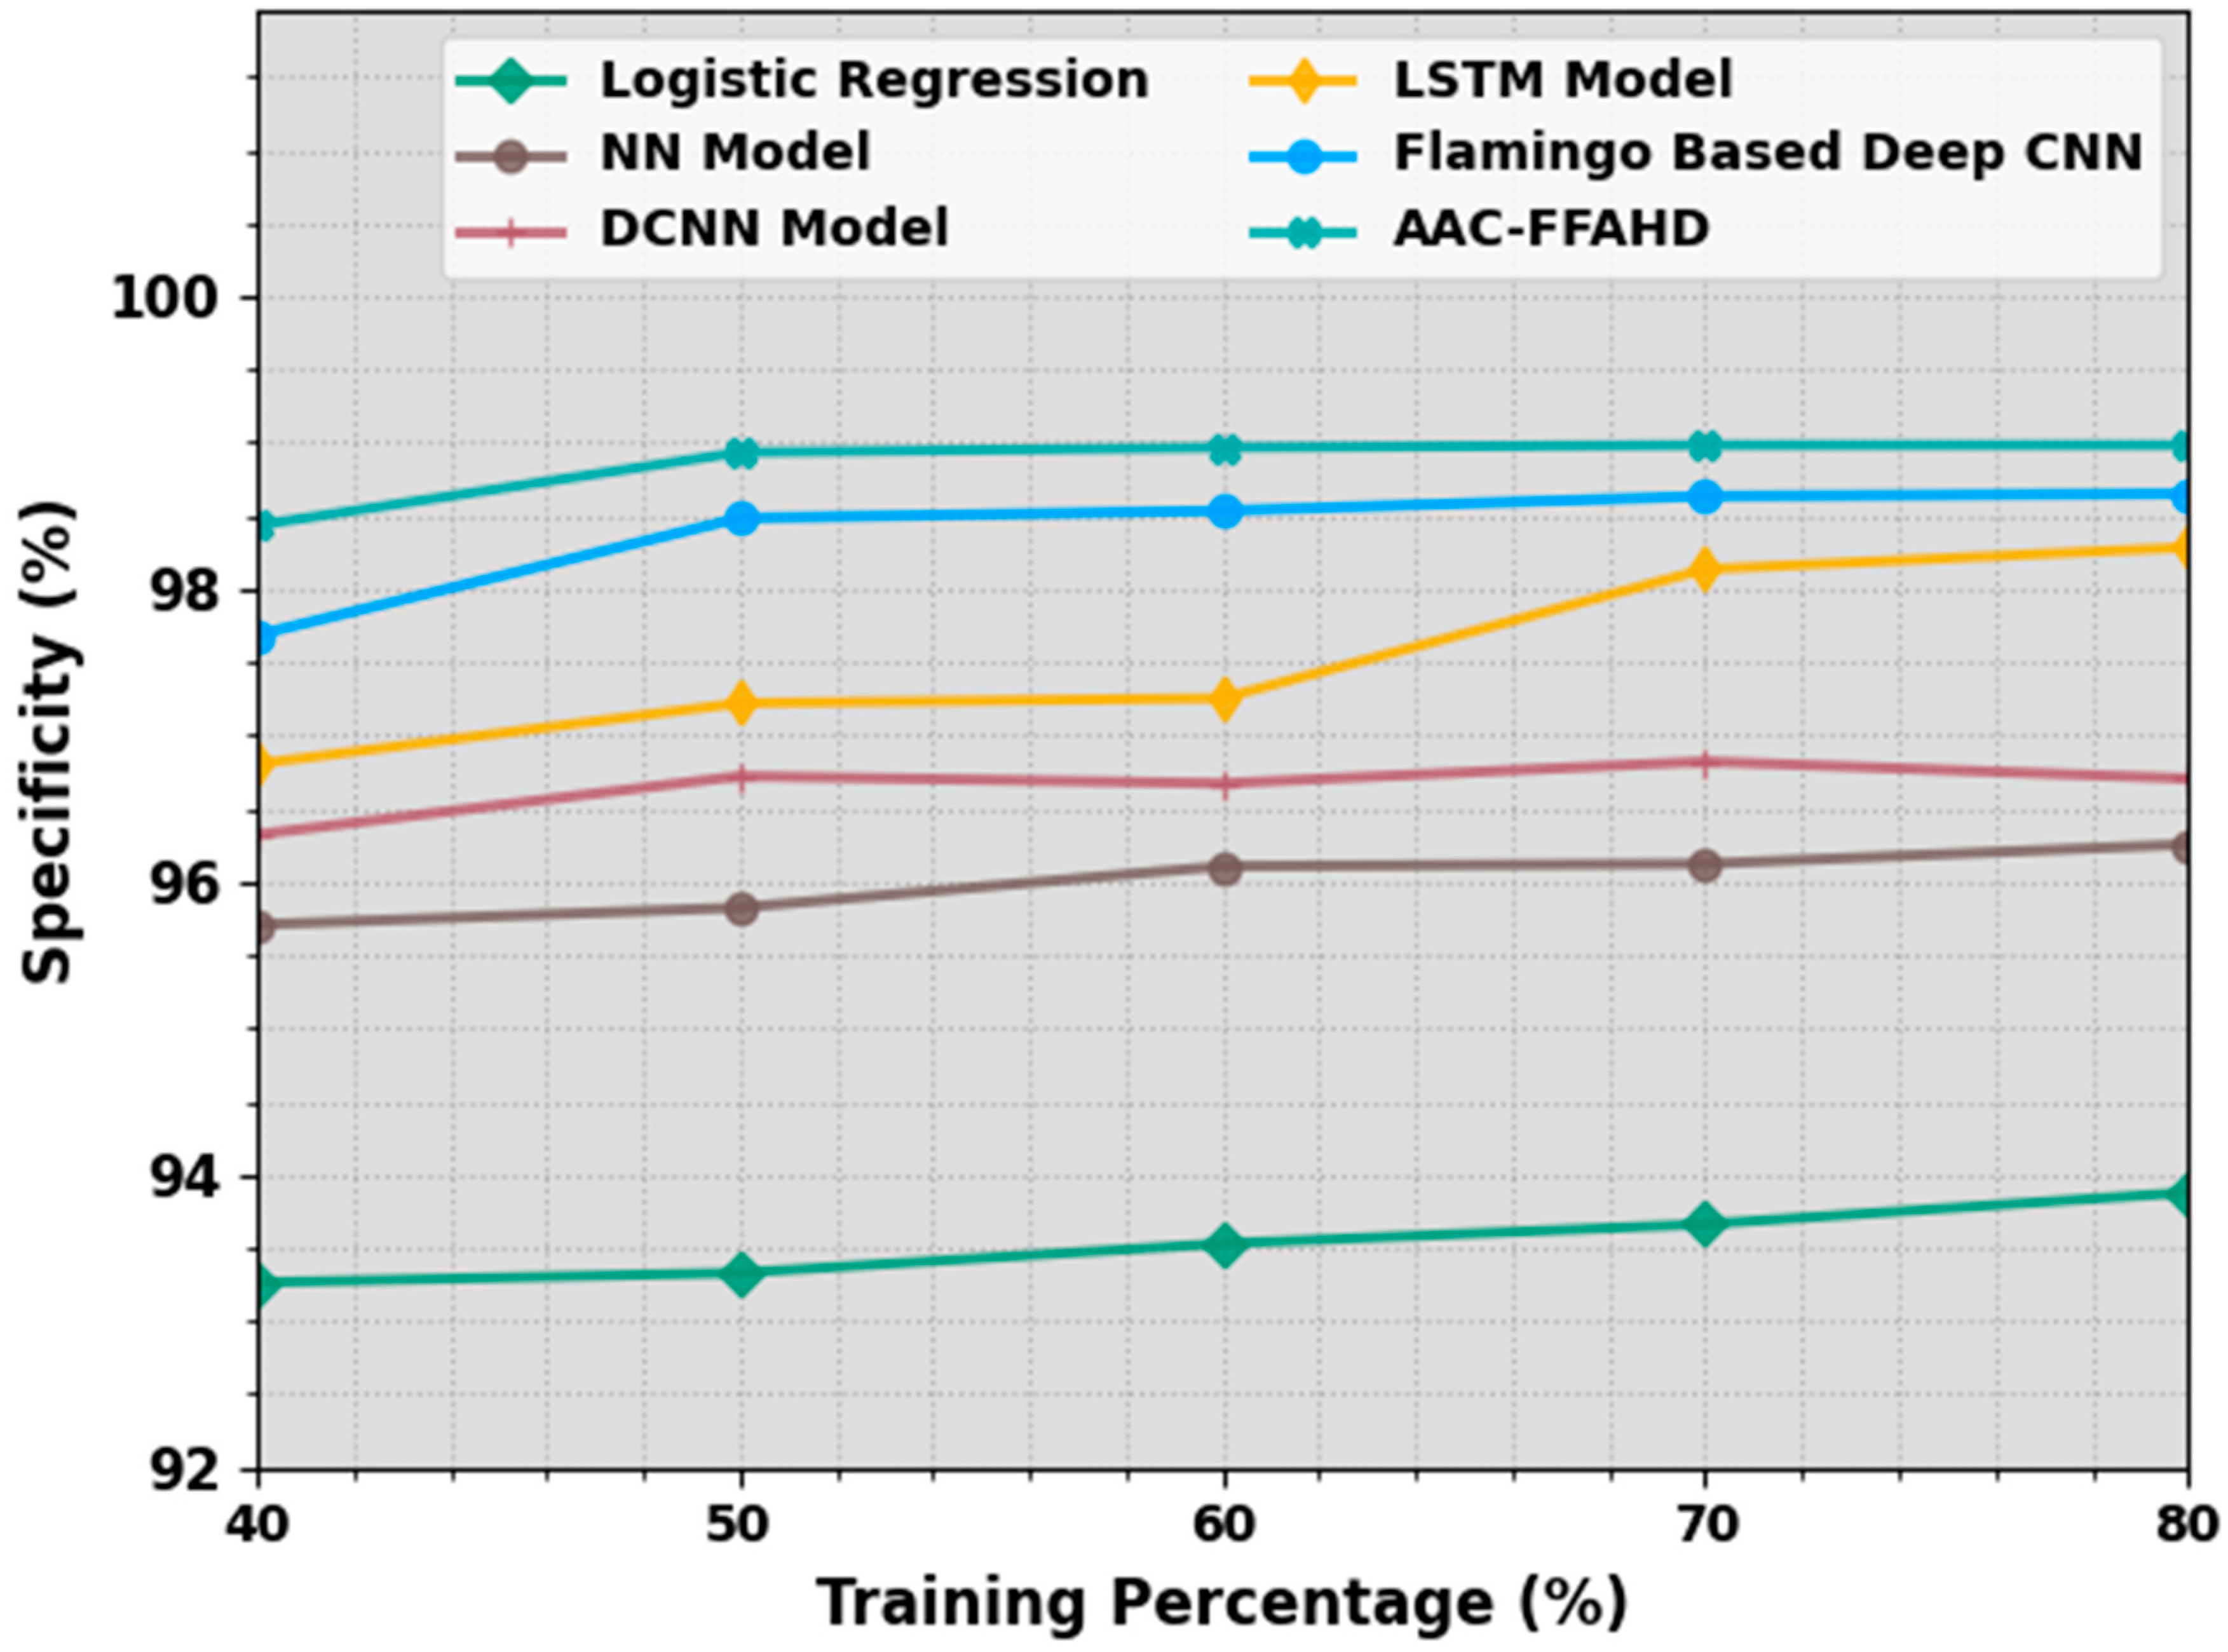
| Specificity (%) | ||||||
|---|---|---|---|---|---|---|
| Training Percentage (%) | Logistic Regression | NN Model | DCNN Model | LSTM Model | Flamingo-Based Deep CNN | AAC-FFAHD |
| 40 | 93.26 | 95.71 | 96.32 | 96.80 | 97.69 | 98.43 |
| 50 | 93.33 | 95.82 | 96.72 | 97.22 | 98.48 | 98.93 |
| 60 | 93.53 | 96.11 | 96.67 | 97.25 | 98.53 | 98.97 |
| 70 | 93.66 | 96.12 | 96.82 | 98.13 | 98.63 | 98.98 |
| 80 | 93.88 | 96.26 | 96.70 | 98.28 | 98.65 | 98.98 |
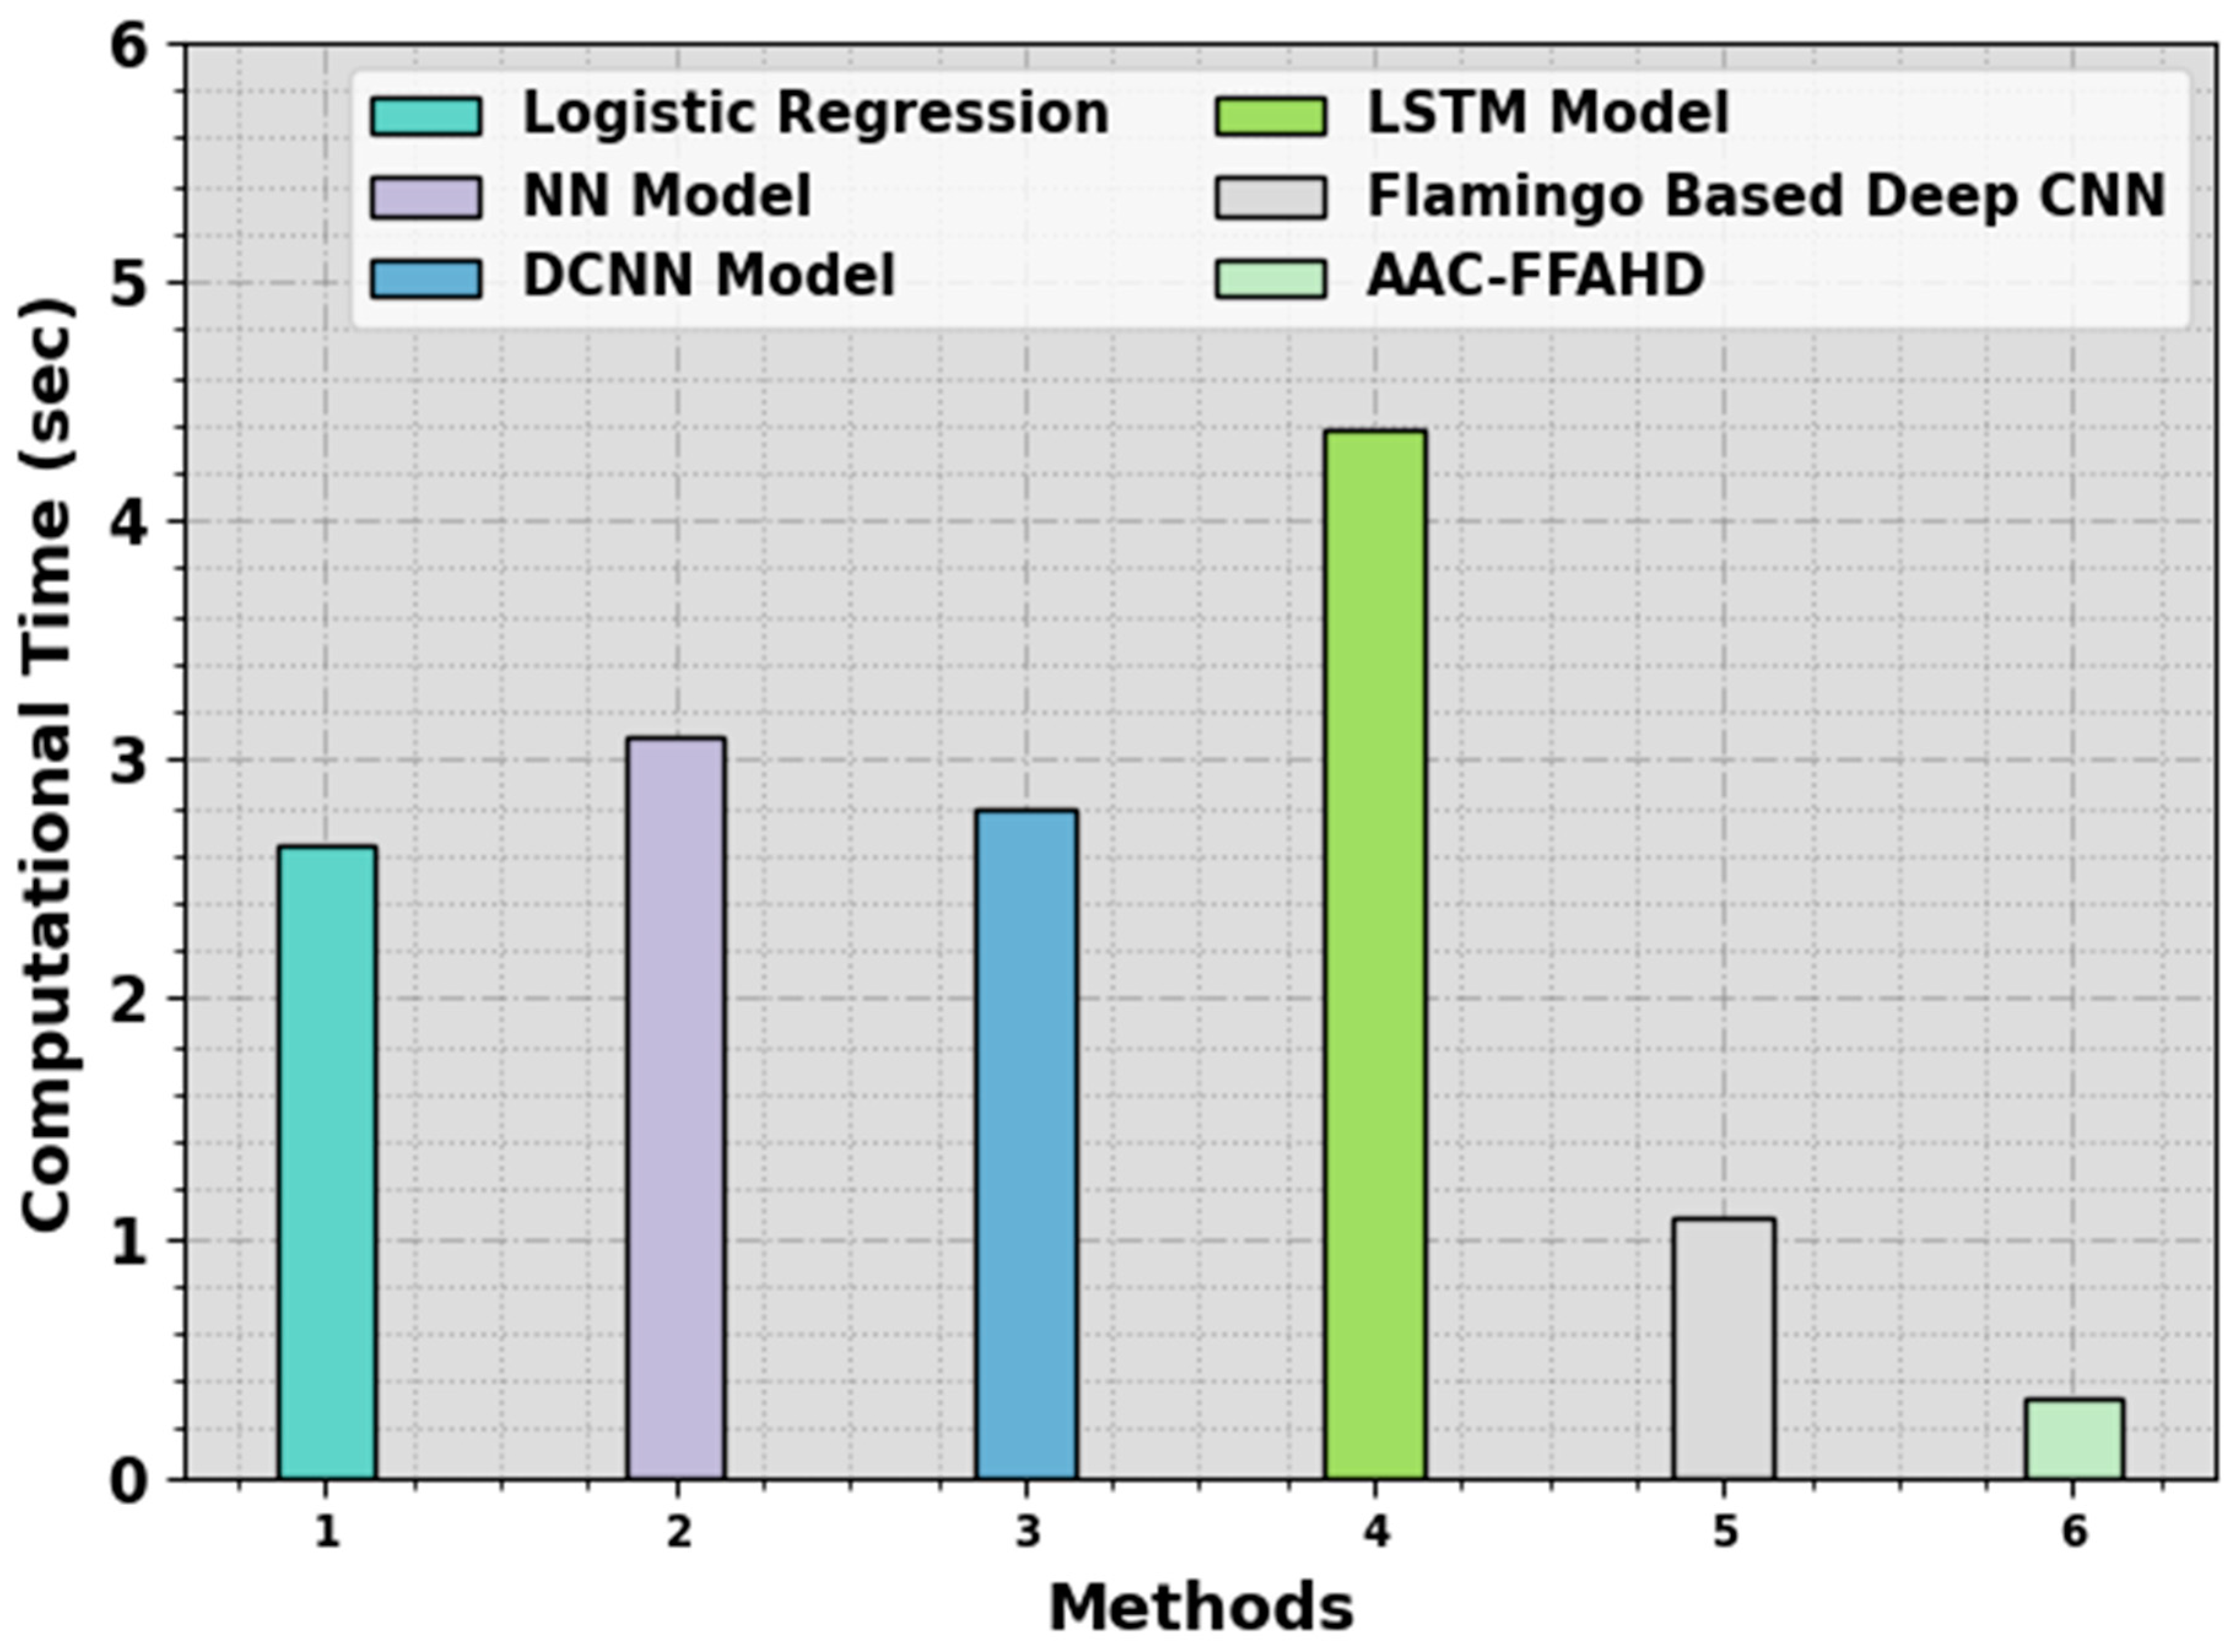
| Methods | Computational Time (sec) |
|---|---|
| Logistic Regression | 2.64 |
| NN Model | 3.09 |
| DCNN Model | 2.80 |
| LSTM Model | 4.38 |
| Flamingo-Based Deep CNN | 1.08 |
| AAC-FFAHD | 0.33 |
| Method | Accuracy | Sensitivity | Specificity |
|---|---|---|---|
| SVM Model | 95.46 | 93.87 | 95.56 |
| CNN Algorithm | 92.50 | 98.09 | 93.13 |
| Decision Tree | 97.19 | 94.83 | 95.78 |
| Random Forest | 95.46 | 97.99 | 94.27 |
| LSTM Model | 97.99 | 94.40 | 94.60 |
| Logistic Regression | 97.03 | 97.83 | 97.17 |
| AAC-FFAHD | 98.76 | 98.50 | 97.90 |
Disclaimer/Publisher’s Note: The statements, opinions and data contained in all publications are solely those of the individual author(s) and contributor(s) and not of MDPI and/or the editor(s). MDPI and/or the editor(s) disclaim responsibility for any injury to people or property resulting from any ideas, methods, instructions or products referred to in the content. |
© 2023 by the authors. Licensee MDPI, Basel, Switzerland. This article is an open access article distributed under the terms and conditions of the Creative Commons Attribution (CC BY) license (https://creativecommons.org/licenses/by/4.0/).
Share and Cite
Almasoud, A.S.; Mengash, H.A.; Eltahir, M.M.; Almalki, N.S.; Alnfiai, M.M.; Salama, A.S. Automated Arrhythmia Classification Using Farmland Fertility Algorithm with Hybrid Deep Learning Model on Internet of Things Environment. Sensors 2023, 23, 8265. https://doi.org/10.3390/s23198265
Almasoud AS, Mengash HA, Eltahir MM, Almalki NS, Alnfiai MM, Salama AS. Automated Arrhythmia Classification Using Farmland Fertility Algorithm with Hybrid Deep Learning Model on Internet of Things Environment. Sensors. 2023; 23(19):8265. https://doi.org/10.3390/s23198265
Chicago/Turabian StyleAlmasoud, Ahmed S., Hanan Abdullah Mengash, Majdy M. Eltahir, Nabil Sharaf Almalki, Mrim M. Alnfiai, and Ahmed S. Salama. 2023. "Automated Arrhythmia Classification Using Farmland Fertility Algorithm with Hybrid Deep Learning Model on Internet of Things Environment" Sensors 23, no. 19: 8265. https://doi.org/10.3390/s23198265
APA StyleAlmasoud, A. S., Mengash, H. A., Eltahir, M. M., Almalki, N. S., Alnfiai, M. M., & Salama, A. S. (2023). Automated Arrhythmia Classification Using Farmland Fertility Algorithm with Hybrid Deep Learning Model on Internet of Things Environment. Sensors, 23(19), 8265. https://doi.org/10.3390/s23198265