
Epileptic EEG Signal Detection Using Variational Modal Decomposition and Improved Grey Wolf Algorithm

Abstract
:1. Introduction
2. State of the Art
2.1. Automatic Detection Process of Epilepsy
2.1.1. Data Collection and Input
2.1.2. Data Preprocessing
2.1.3. Feature Extraction and Selection
2.1.4. Classification Model Learning and Evaluation
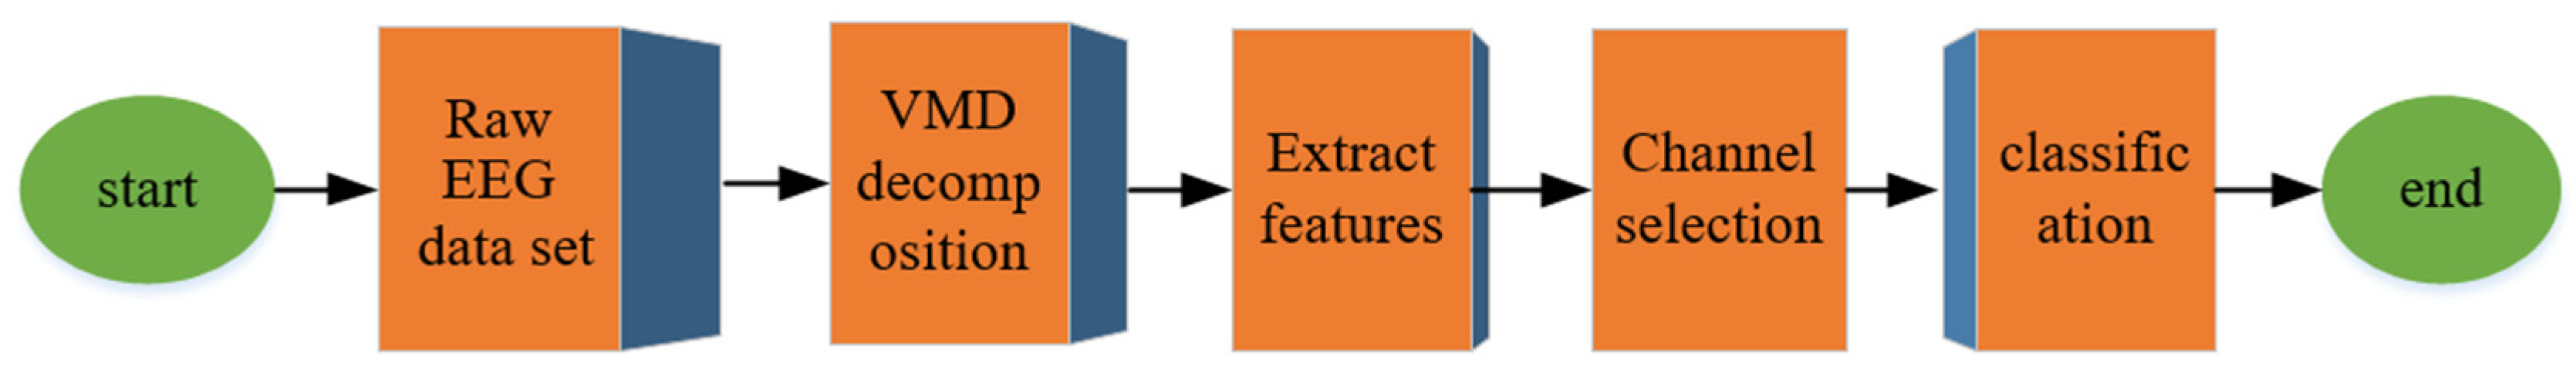
3. Methodology
3.1. Dataset
3.2. Feature Extraction
3.2.1. Variational Mode Decomposition (VMD)
3.2.2. Features
- (1)
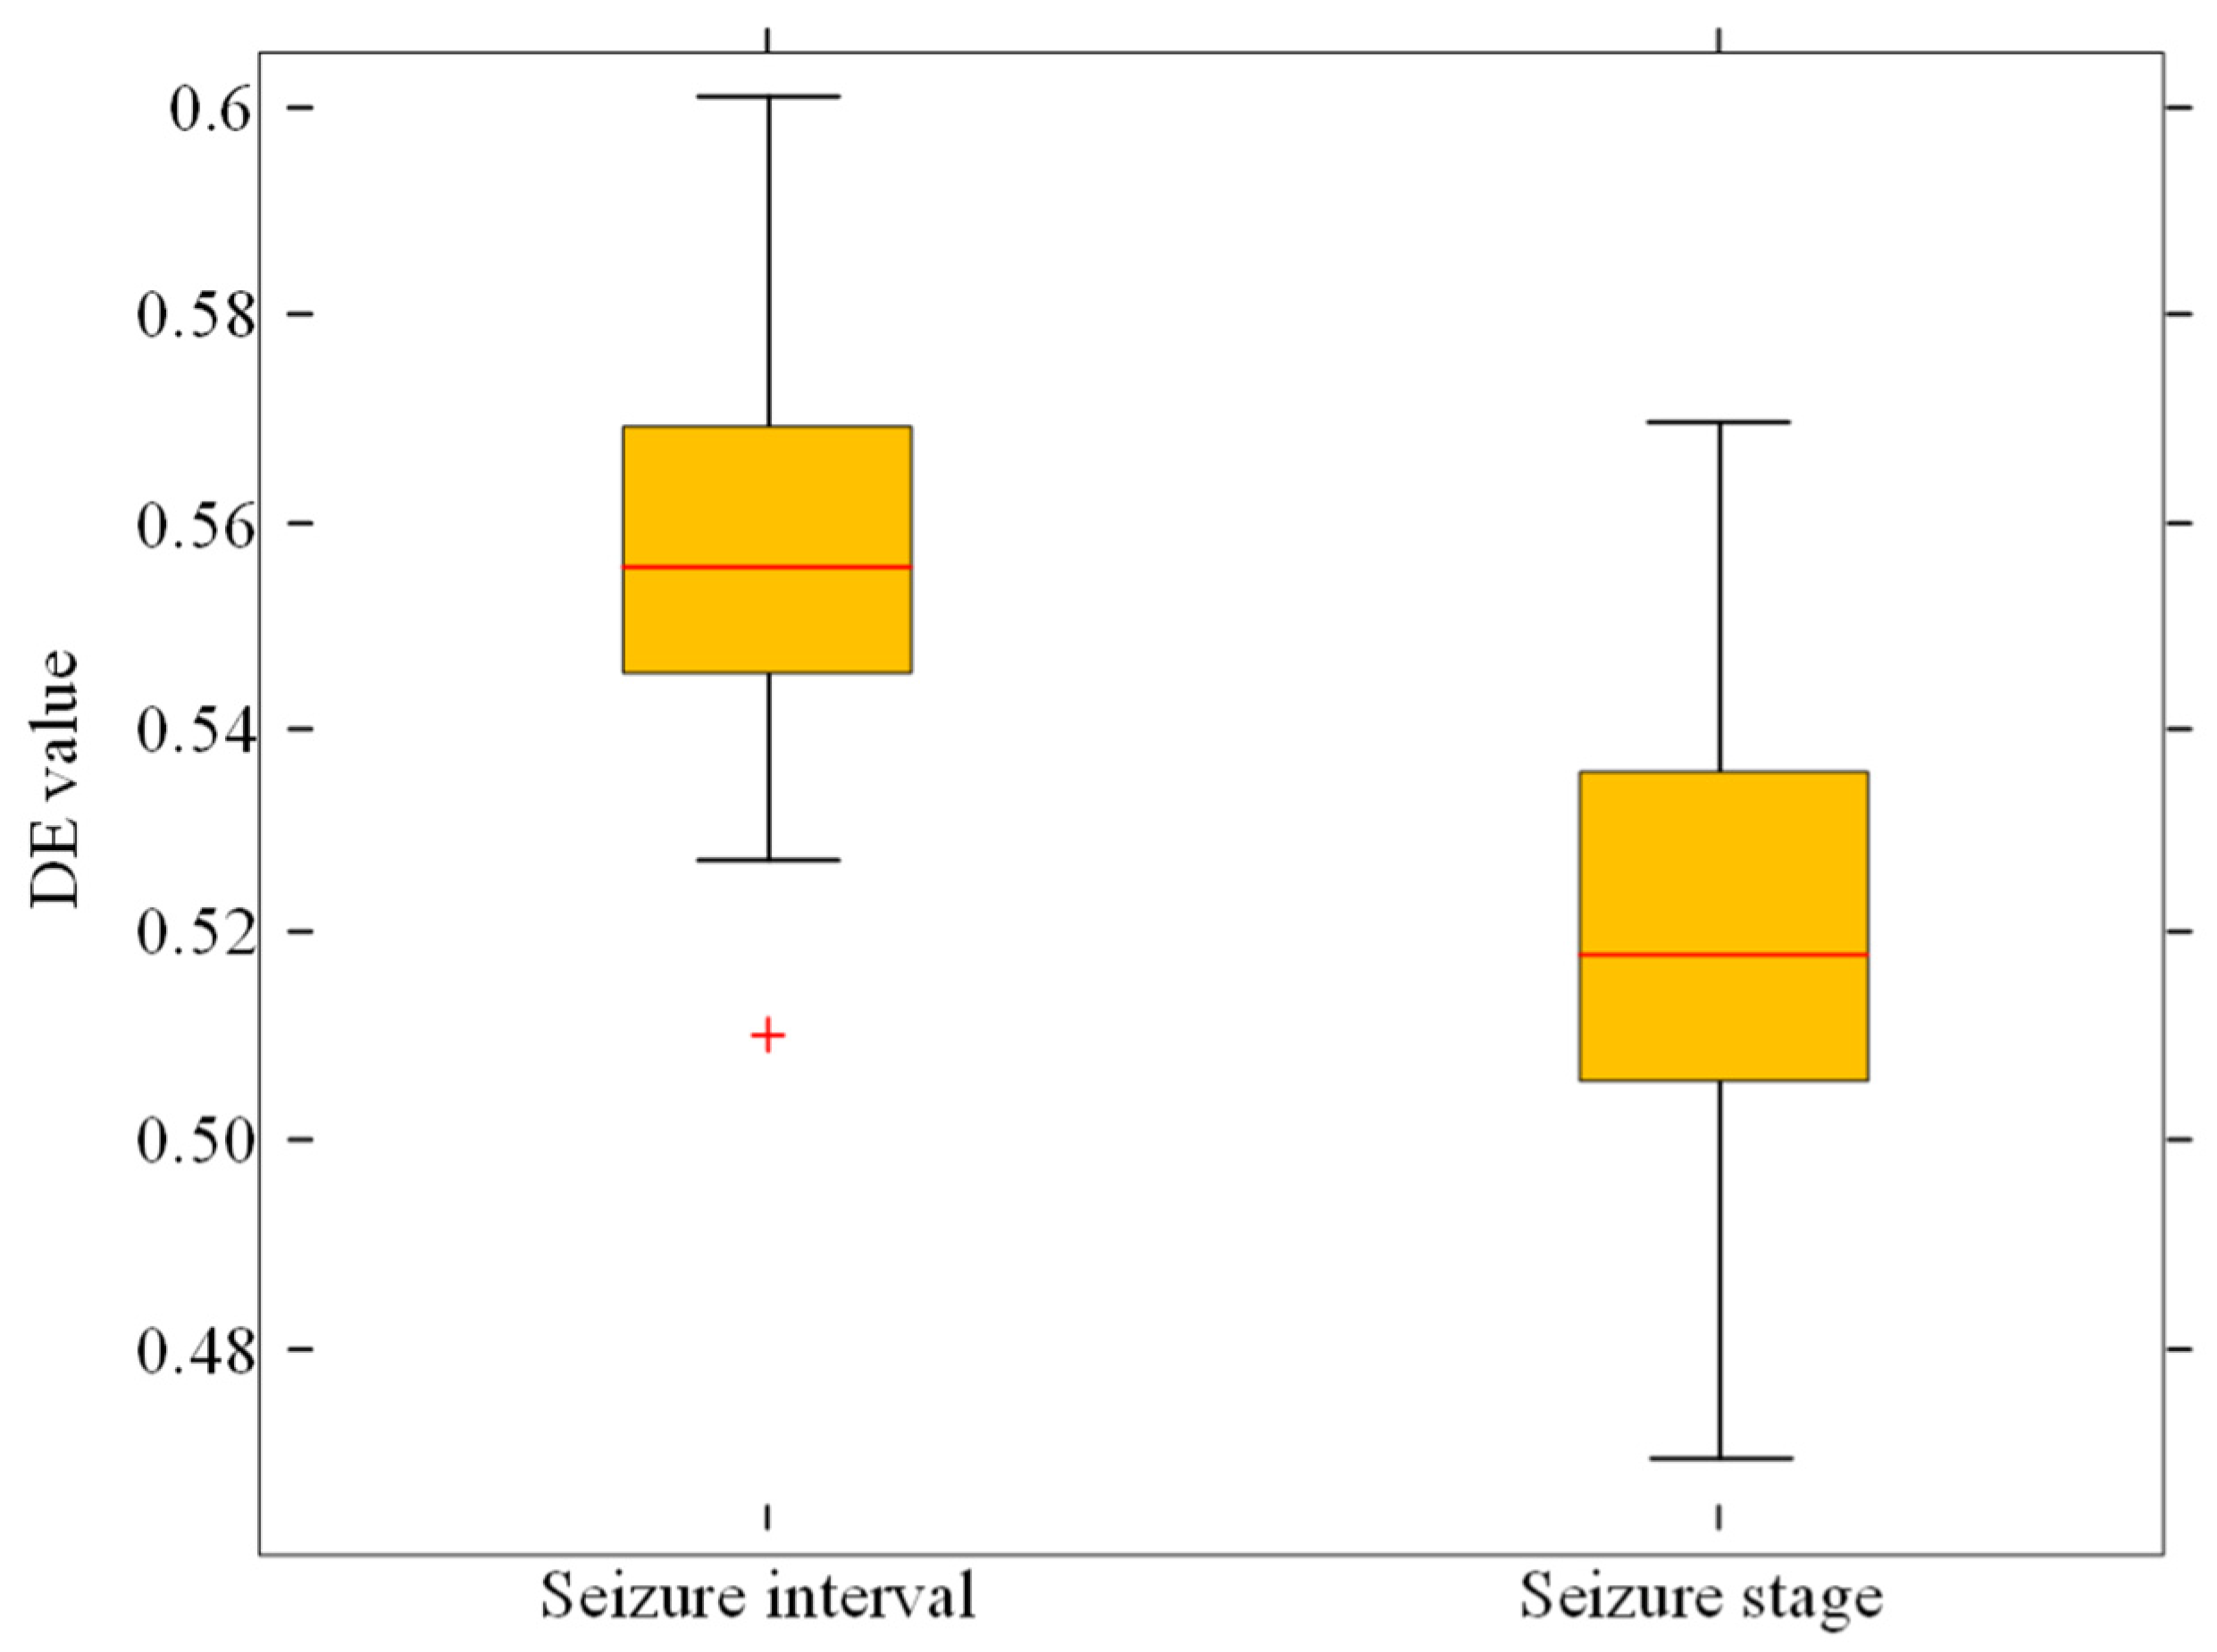
- The differential entropy (DE)
- (2)
- The Higuchi fractal dimension (HFD)
3.3. Classification
3.4. EEG Channel Selection
4. Result Analysis and Discussion
5. Conclusions
Author Contributions
Funding
Institutional Review Board Statement
Informed Consent Statement
Data Availability Statement
Conflicts of Interest
References
- Karatoprak, E.; Sözen, G.; Saltık, S. Risk factors associated with epilepsy development in children with cerebral palsy. Child’s Nerv. Syst. 2019, 35, 1181–1187. [Google Scholar] [CrossRef] [PubMed]
- Mauri, G.; Hegedüs, L.; Bandula, S.; Cazzato, R.L.; Czarniecka, A.; Dudeck, O.; Fugazzola, L.; Netea-Maier, R.; Russ, G.; Wallin, G.; et al. European thyroid association and cardiovascular and interventional radiological society of Europe 2021 clinical practice guideline for the use of minimally invasive treatments in malignant thyroid lesions. Eur. Thyroid J. 2021, 10, 185–197. [Google Scholar] [CrossRef] [PubMed]
- Karoly, P.J.; Rao, V.R.; Gregg, N.M.; Worrell, G.A.; Bernard, C.; Cook, M.J.; Baud, M.O. Cycles in epilepsy. Nat. Rev. Neurol. 2021, 17, 267–284. [Google Scholar] [CrossRef] [PubMed]
- Chen, X.; Liu, Q.; Tao, W.; Li, L.; Lee, S.; Liu, A.; Chen, Q.; Cheng, J.; McKeown, M.J.; Wang, Z.J.; et al. ReMAE: User-friendly toolbox for removing muscle artifacts from EEG. IEEE Trans. Instrum. Meas. 2019, 69, 2105–2119. [Google Scholar] [CrossRef]
- Siddiqui, M.K.; Morales-Menendez, R.; Huang, X.; Hussain, N. A review of epileptic seizure detection using machine learning classifiers. Brain Inform. 2020, 7, 5. [Google Scholar] [CrossRef]
- Wan, Z.; Yang, R.; Huang, M.; Zeng, N.; Liu, X. A review on transfer learning in EEG signal analysis. Neurocomputing 2021, 421, 1–14. [Google Scholar] [CrossRef]
- Yuan, Q.; Zhou, W.; Zhang, L.; Zhang, F.; Xu, F.; Leng, Y.; Wei, D.; Chen, M. Epileptic seizure detection based on imbalanced classification and wavelet packet transform. Seizure 2017, 50, 99–108. [Google Scholar] [CrossRef]
- Kim, J.; André, E. Emotion recognition based on physiological changes in music listening. IEEE Trans. Pattern Anal. Mach. Intell. 2008, 30, 2067–2083. [Google Scholar] [CrossRef]
- Zheng, J.; Pan, H. Mean-optimized mode decomposition: An improved EMD approach for non-stationary signal processing. ISA Trans. 2020, 106, 392–401. [Google Scholar] [CrossRef]
- Song, Y.; Zhang, J. Discriminating preictal and interictal brain states in intracranial EEG by sample entropy and extreme learning machine. J. Neurosci. Methods 2016, 257, 45–54. [Google Scholar] [CrossRef]
- Udhayakumar, R.K.; Karmakar, C.; Palaniswami, M. Approximate entropy profile: A novel approach to comprehend irregularity of short-term HRV signal. Nonlinear Dyn. 2017, 88, 823–837. [Google Scholar] [CrossRef]
- Follis, J.L.; Lai, D. Modeling Volatility Characteristics of Epileptic EEGs using GARCH Models. Signals 2020, 1, 3. [Google Scholar] [CrossRef]
- Supriya, S.; Siuly, S.; Wang, H.; Zhang, Y. Automated epilepsy detection techniques from electroencephalogram signals: A review study. Health Inf. Sci. Syst. 2020, 8, 33. [Google Scholar] [CrossRef] [PubMed]
- Chen, Z.; Brodie, M.J.; Liew, D.; Kwan, P. Treatment outcomes in patients with newly diagnosed epilepsy treated with established and new antiepileptic drugs: A 30-year longitudinal cohort study. JAMA Neurol. 2018, 75, 279–286. [Google Scholar] [CrossRef] [PubMed]
- Juhász, C.; John, F. Utility of MRI, PET, and ictal SPECT in presurgical evaluation of non-lesional pediatric epilepsy. Seizure 2020, 77, 15–28. [Google Scholar] [CrossRef] [PubMed]
- Beneke, J.; de Sousa, S.; Mbuyu, M.; Wickham, B. The effect of negative online customer reviews on brand equity and purchase intention of consumer electronics in South Africa. Int. Rev. Retail. Distrib. Consum. Res. 2016, 26, 171–201. [Google Scholar] [CrossRef]
- Huffman, J.A.; Perring, A.E.; Savage, N.J.; Clot, B.; Crouzy, B.; Tummon, F.; Shoshanim, O.; Damit, B.; Schneider, J.; Sivaprakasam, V.; et al. Real-time sensing of bioaerosols: Review and current perspectives. Aerosol Sci. Technol. 2020, 54, 465–495. [Google Scholar] [CrossRef]
- Wang, B.; Meng, L. Functional brain network alterations in epilepsy: A magnetoencephalography study. Epilepsy Res. 2016, 126, 62–69. [Google Scholar] [CrossRef]
- Murali, L.; Chitra, D.; Manigandan, T.; Priyanga, P. Epileptic Seizure Detection using SVM Classifier based on Temporal and Spectral Features. Asian J. Res. Soc. Sci. Humanit. 2016, 6, 489–502. [Google Scholar] [CrossRef]
- Savadkoohi, M.; Oladunni, T.; Thompson, L. A machine learning approach to epileptic seizure prediction using Electroencephalogram (EEG) Signal. Biocybern. Biomed. Eng. 2020, 40, 1328–1341. [Google Scholar] [CrossRef]
- Varanis, M.; Silva, A.L.; Balthazar, J.M.; Pederiva, R. A tutorial review on time-frequency analysis of non-stationary vibration signals with nonlinear dynamics applications. Braz. J. Phys. 2021, 51, 859–877. [Google Scholar] [CrossRef]
- Ghosh, R.; Phadikar, S.; Deb, N.; Sinha, N.; Das, P.; Ghaderpour, E. Automatic Eyeblink and Muscular Artifact Detection and Removal From EEG Signals Using k-Nearest Neighbor Classifier and Long Short-Term Memory Networks. IEEE Sens. J. 2023, 23, 5422–5436. [Google Scholar] [CrossRef]
- Mandhouj, B.; Cherni, M.A.; Sayadi, M. An automated classification of EEG signals based on spectrogram and CNN for epilepsy diagnosis. Analog Integr. Circuits Signal Process. 2021, 108, 101–110. [Google Scholar] [CrossRef]
- Thangavel, P.; Thomas, J.; Sinha, N.; Peh, W.Y.; Yuvaraj, R.; Cash, S.S.; Chaudhari, R.; Karia, S.; Jing, J.; Rathakrishnan, R.; et al. Improving automated diagnosis of epilepsy from EEGs beyond IEDs. J. Neural Eng. 2022, 19, 066017. [Google Scholar] [CrossRef] [PubMed]
- Ein Shoka, A.A.; Alkinani, M.H.; El-Sherbeny, A.S.; El-Sayed, A.; Dessouky, M.M. Automated seizure diagnosis system based on feature extraction and channel selection using EEG signals. Brain Inform. 2021, 8, 1. [Google Scholar] [CrossRef]
- Tu, Q.; Chen, X.; Liu, X. Hierarchy strengthened grey wolf optimizer for numerical optimization and feature selection. IEEE Access 2019, 7, 78012–78028. [Google Scholar] [CrossRef]
- Dritsas, E.; Trigka, M. Stroke risk prediction with machine learning techniques. Sensors 2022, 22, 4670. [Google Scholar] [CrossRef]


| Data | Number of Subjects | Total Number of Attacks | Signal Types | Sampling Frequency (Hz) | Total Time (h) |
|---|---|---|---|---|---|
| Freiburg | 21 | 87 | Intracranial EEG | 256 | 708 |
| CHB-MIT | 22 | 163 | The scalp EEG | 256 | 844 |
| Bonn | 10 | 100 | Intracranial EEG | 256 | 708 |
| Kaggle | 2 (people) | 48 | Intracranial EEG | 400 | 627 |
| 5 (dog) | 5000 | ||||
| Barcelona | 5 | 3750 | Intracranial EEG | 512 | 83 |
| Indicators | DE | HFD | DE + HFD (Proposed) |
|---|---|---|---|
| Accuracy/% | 97.9 | 98.1 | 98.3 |
| Sensitivity/% | 98.3 | 98.4 | 98.9 |
| Specificity/% | 98.5 | 98.4 | 98.5 |
| AUC | 0.987 | 0.988 | 0.991 |
| Indicators | Full Channels | Five Channels Selected by GWO (Proposed) |
|---|---|---|
| Accuracy/% | 98.4 | 98.3 |
| Sensitivity/% | 99.0 | 98.9 |
| Specificity/% | 98.6 | 98.5 |
| AUC | 0.993 | 0.991 |
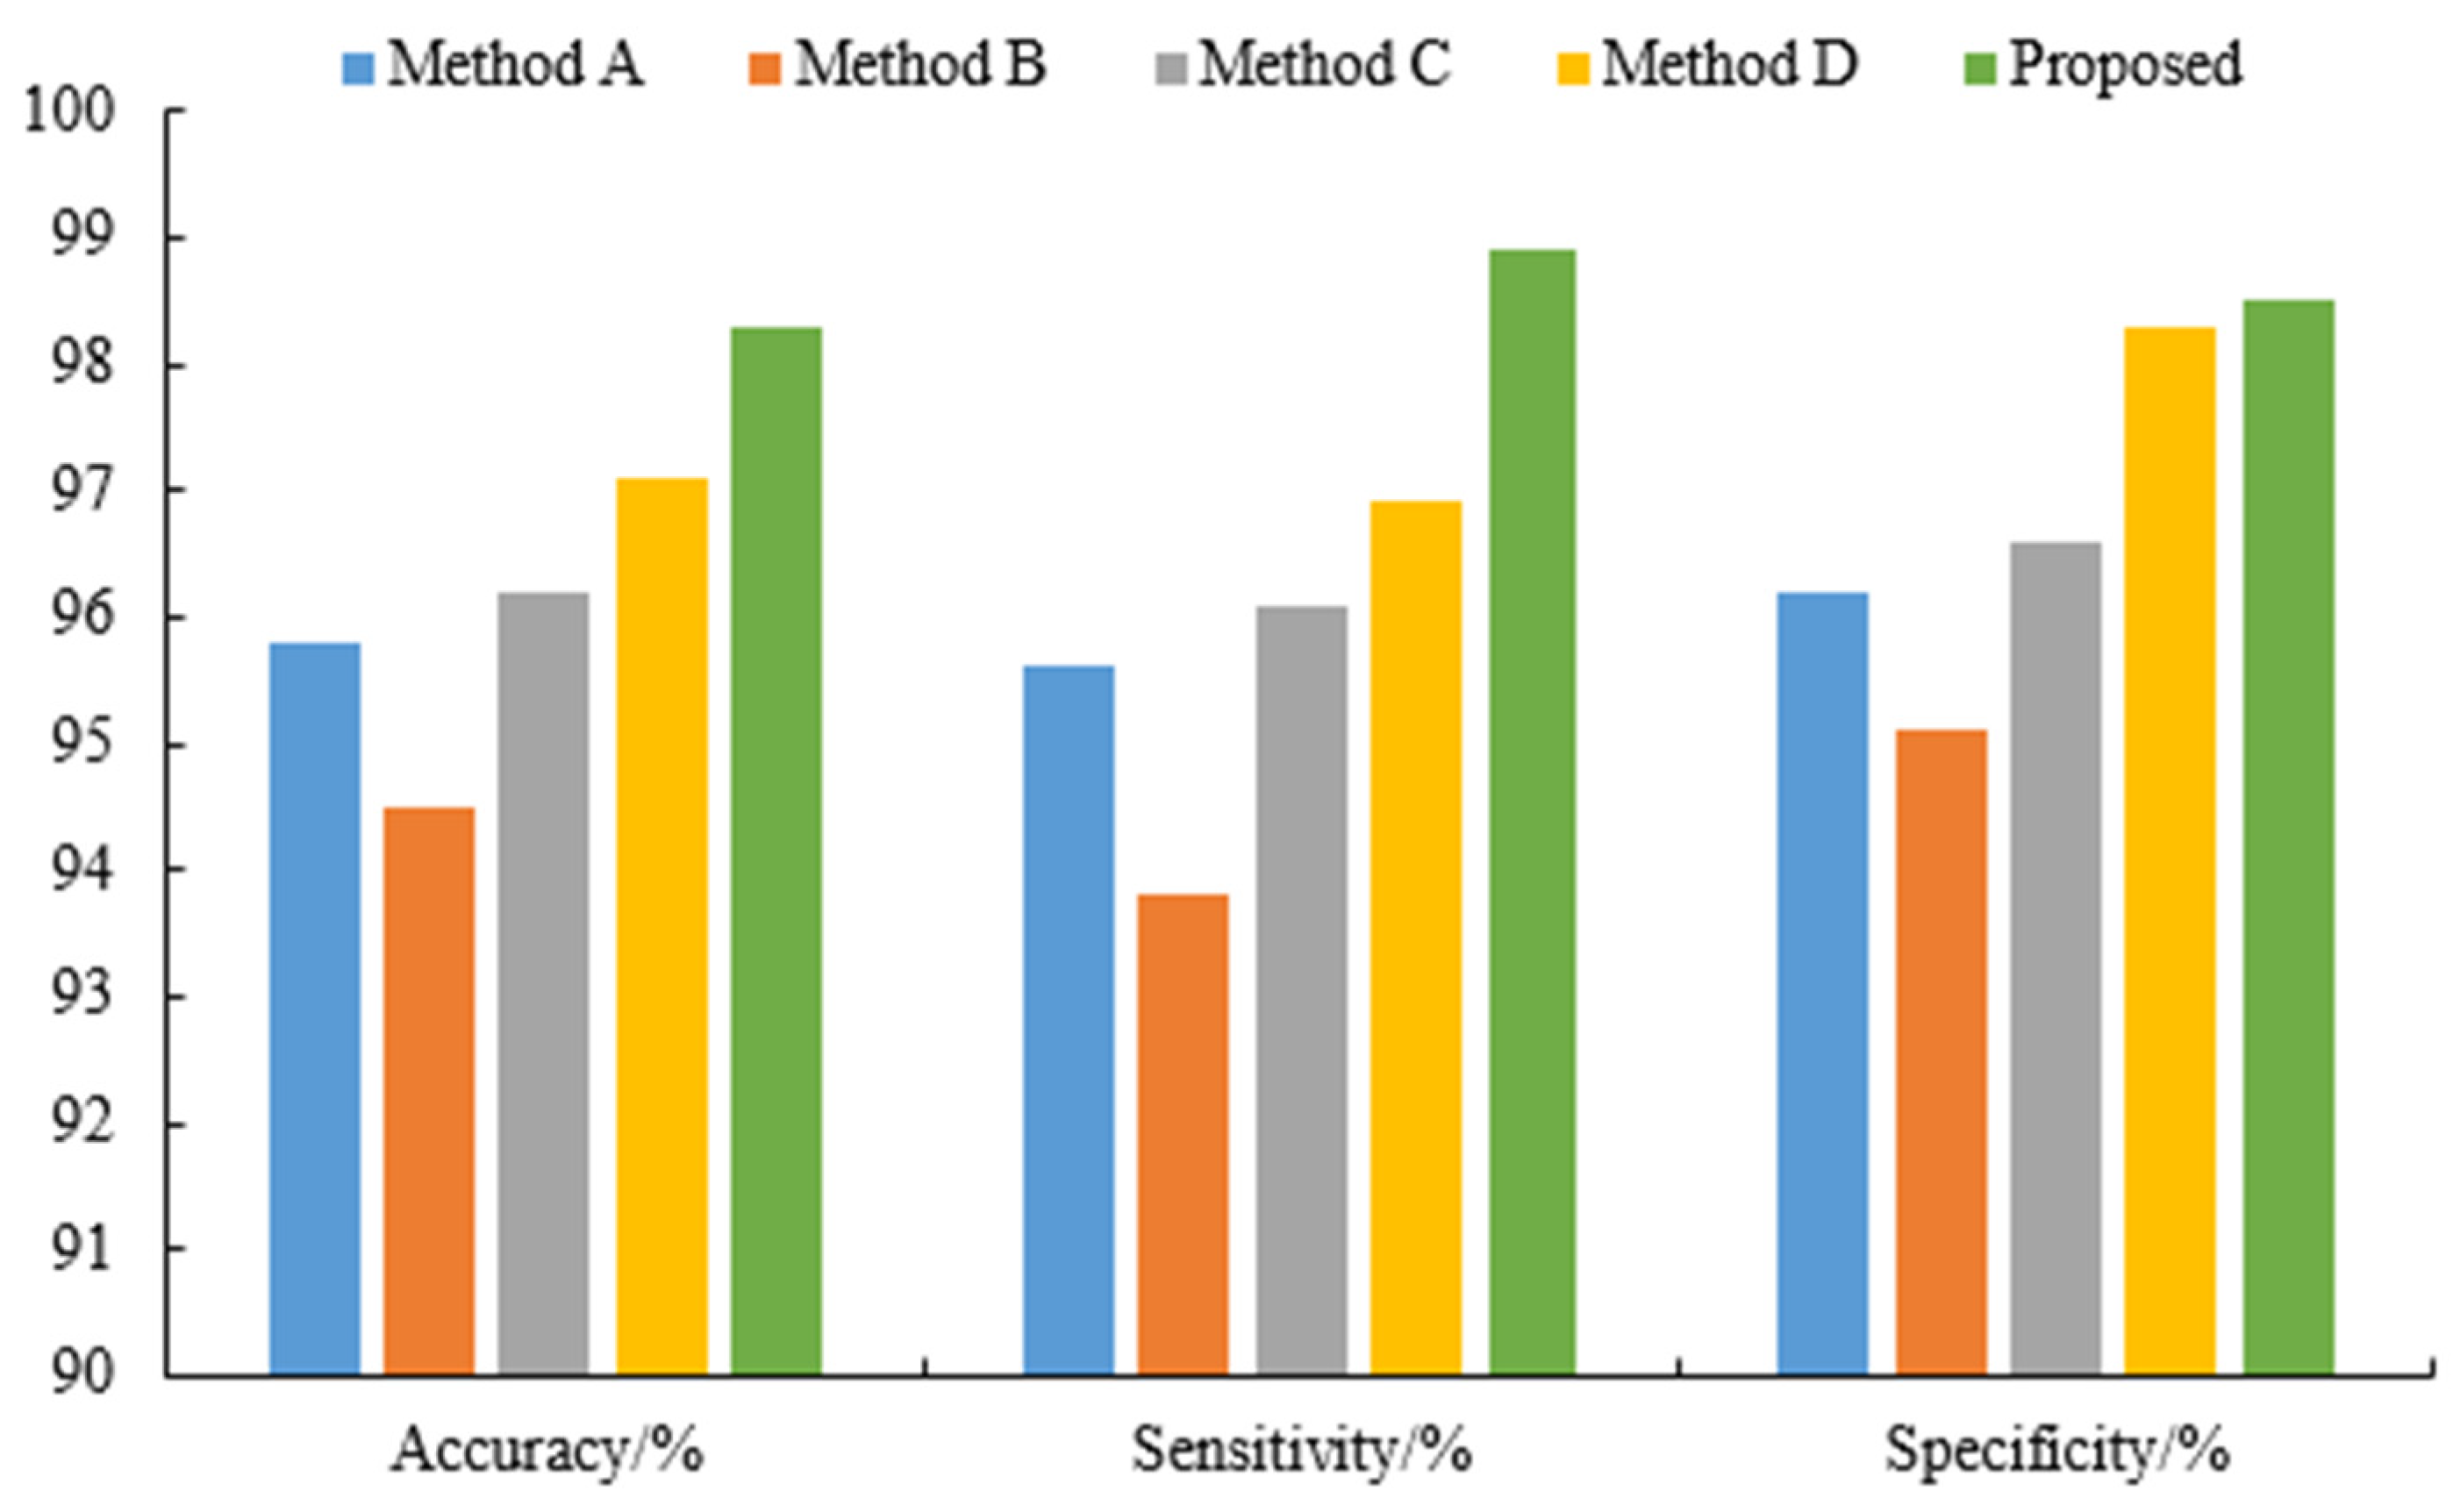
| Methods | Accuracy/% | Sensitivity/% | Specificity/% |
|---|---|---|---|
| A | 95.8 | 95.6 | 96.2 |
| B | 94.5 | 93.8 | 95.1 |
| C | 96.2 | 96.1 | 96.6 |
| D | 97.1 | 96.9 | 98.3 |
| Proposed | 98.3 | 98.9 | 98.5 |
Disclaimer/Publisher’s Note: The statements, opinions and data contained in all publications are solely those of the individual author(s) and contributor(s) and not of MDPI and/or the editor(s). MDPI and/or the editor(s) disclaim responsibility for any injury to people or property resulting from any ideas, methods, instructions or products referred to in the content. |
© 2023 by the authors. Licensee MDPI, Basel, Switzerland. This article is an open access article distributed under the terms and conditions of the Creative Commons Attribution (CC BY) license (https://creativecommons.org/licenses/by/4.0/).
Share and Cite
Sun, Y.; Chen, X. Epileptic EEG Signal Detection Using Variational Modal Decomposition and Improved Grey Wolf Algorithm. Sensors 2023, 23, 8078. https://doi.org/10.3390/s23198078
Sun Y, Chen X. Epileptic EEG Signal Detection Using Variational Modal Decomposition and Improved Grey Wolf Algorithm. Sensors. 2023; 23(19):8078. https://doi.org/10.3390/s23198078
Chicago/Turabian StyleSun, Yongxin, and Xiaojuan Chen. 2023. "Epileptic EEG Signal Detection Using Variational Modal Decomposition and Improved Grey Wolf Algorithm" Sensors 23, no. 19: 8078. https://doi.org/10.3390/s23198078
APA StyleSun, Y., & Chen, X. (2023). Epileptic EEG Signal Detection Using Variational Modal Decomposition and Improved Grey Wolf Algorithm. Sensors, 23(19), 8078. https://doi.org/10.3390/s23198078