1. Introduction
The proliferation of devices at the edge of the network, year-on-year increments in computing power, more energy-saving devices, and small form-factor devices are creating new kinds of technological challenges and are generating a significant volume of data that were not anticipated when the cloud-based computing paradigm was developed. The volume of data being processed, the prioritization of processes, and the requirements for a low response critical for some applications have led to shifting computing resources as close as possible to the sources of these data. Edge devices may be consuming as well as producing data, so it is necessary to move some aspects of the infrastructure closer. Edge computing and cloud computing are not mutually exclusive. The issue is about extending and offloading demand from remote servers and reducing the load on the global network [
1].
The Internet of Things (IoT) plays a significant role in this computing paradigm. Efficient data processing has become a critical aspect of IoT applications, enabling better monitoring, analysis, decision-making, and automation of various applications [
2]. However, efficiently processing and managing vast amounts of data poses significant challenges, particularly regarding latency, bandwidth, and privacy. Edge computing is an emerging paradigm that aims to address these challenges by processing data closer to their source, reducing the need for data to travel long distances to centralized data centers [
3]. This approach results in lower latency, reduced bandwidth and consumption, and improved data protection. However, efficiently deploying and managing applications at the edge remains a complex task [
4].
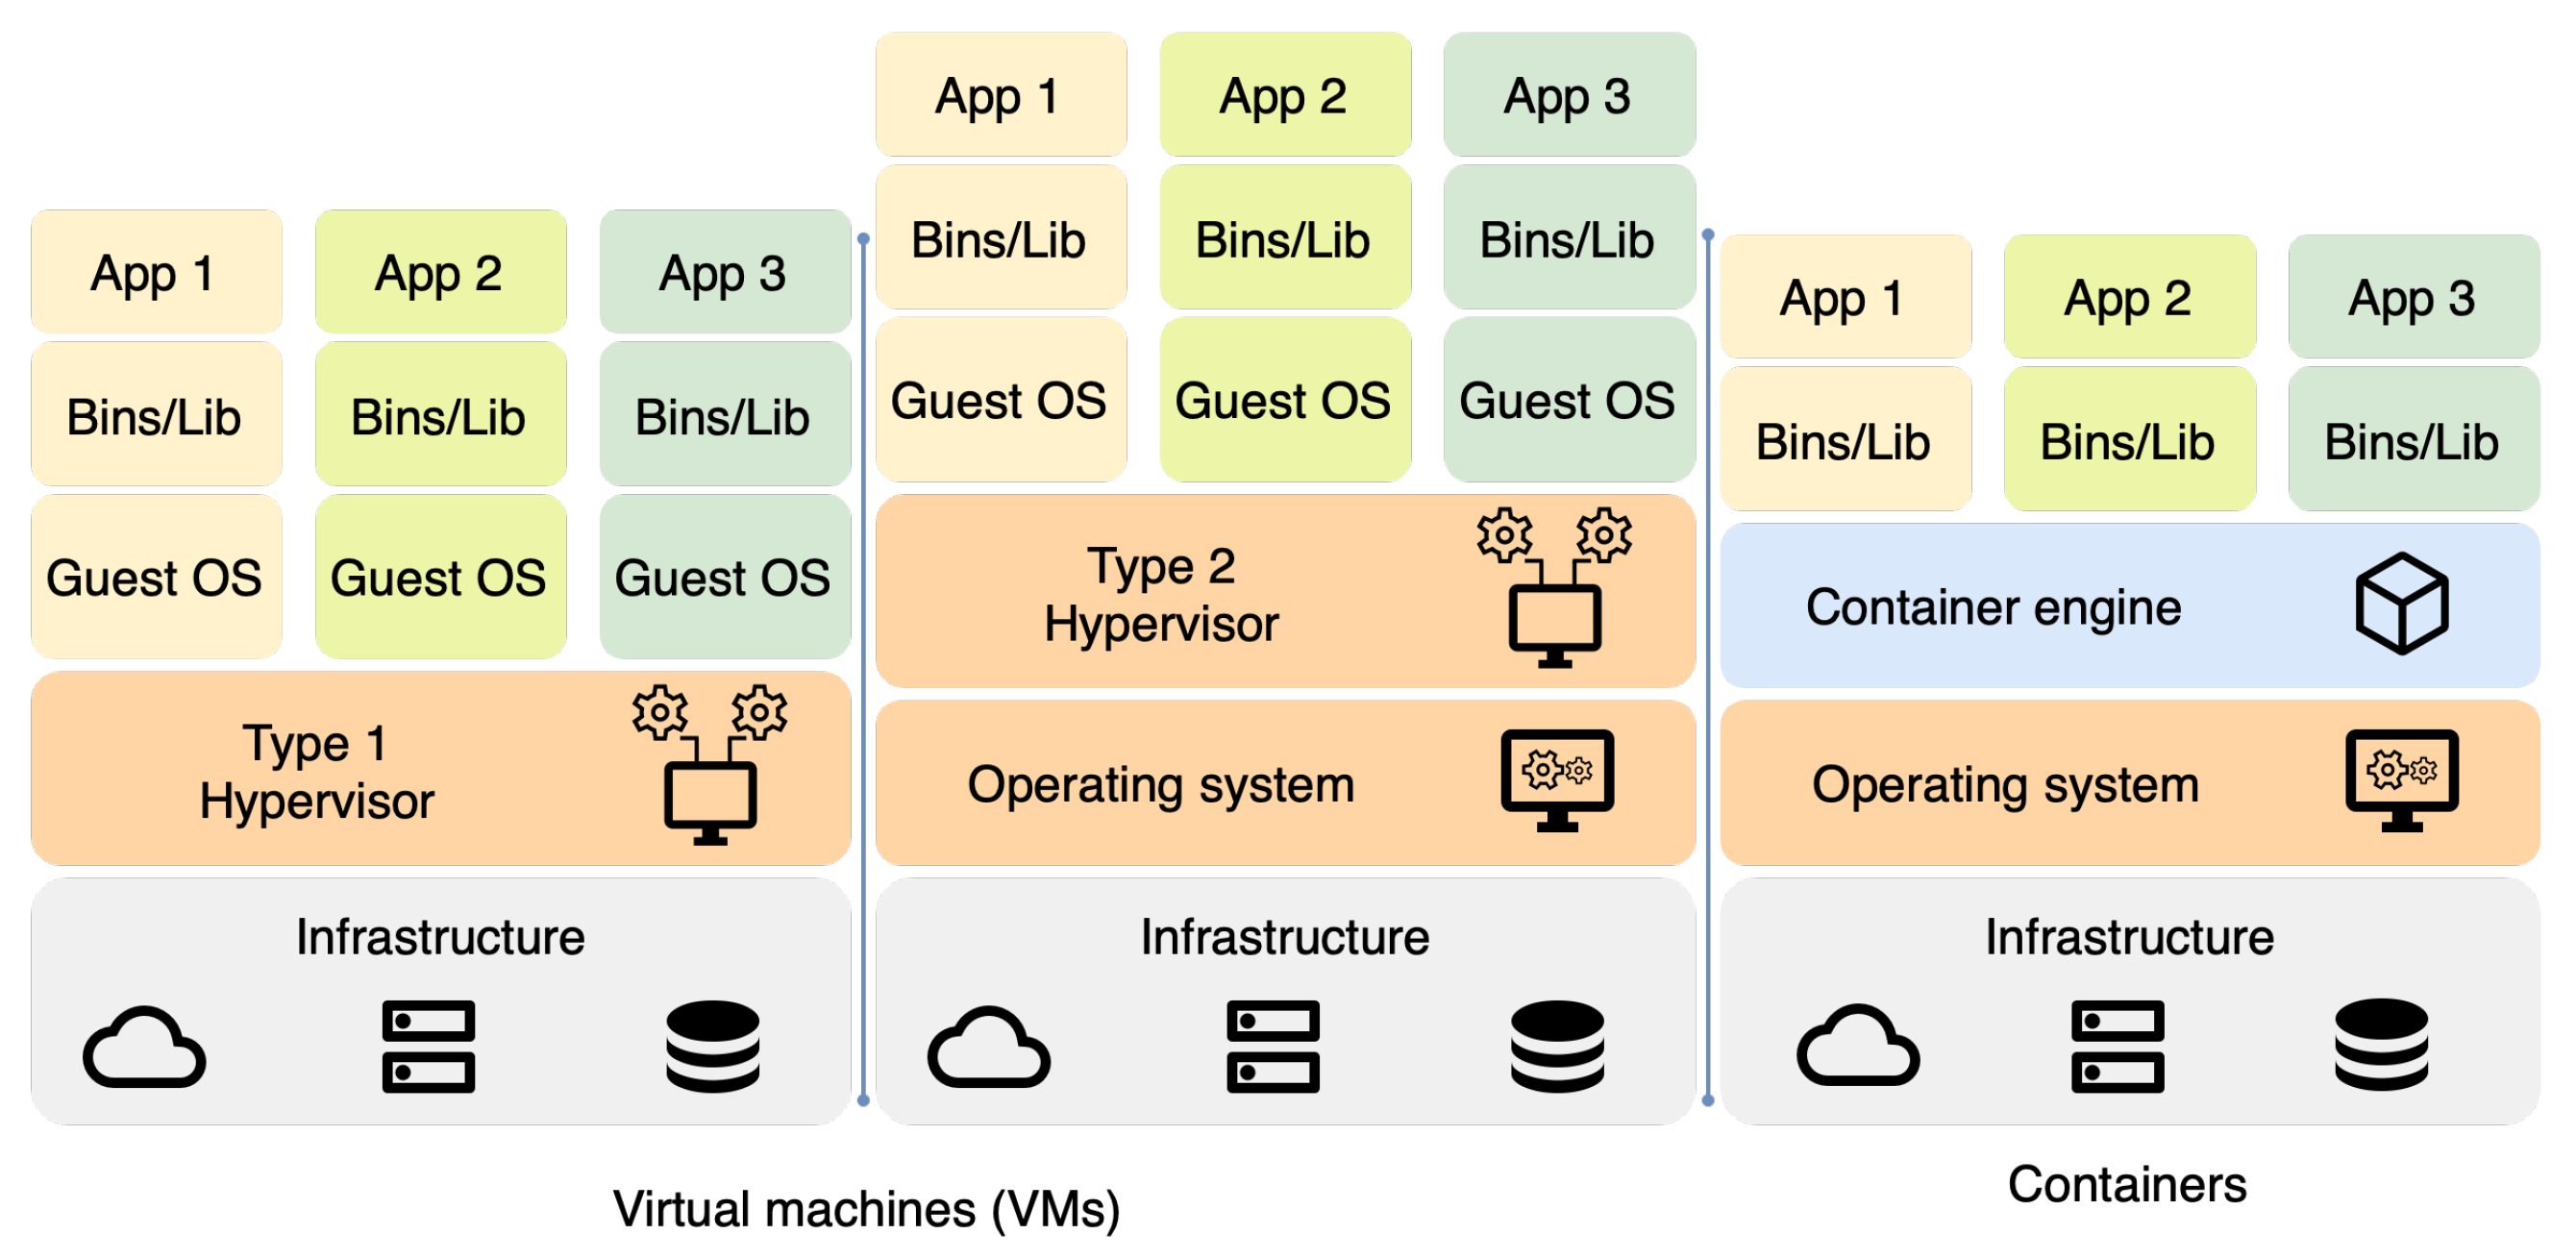
Containerization has proven to be a powerful technology for deploying and managing applications. It offers improved scalability, portability, and resource utilization. Containers enable lightweight, isolated environments for running applications, making it easier to manage and scale applications across heterogeneous edge computing infrastructures [
5,
6,
7].
In addition, Infrastructure as Code (IaC) allows for the streamlined management of infrastructure resources, enabling consistent and repeatable deployments. Using IaC, developers and operators can automate the provisioning and management of infrastructure resources, reducing the likelihood of human error and increasing the efficiency of the deployment process [
8].
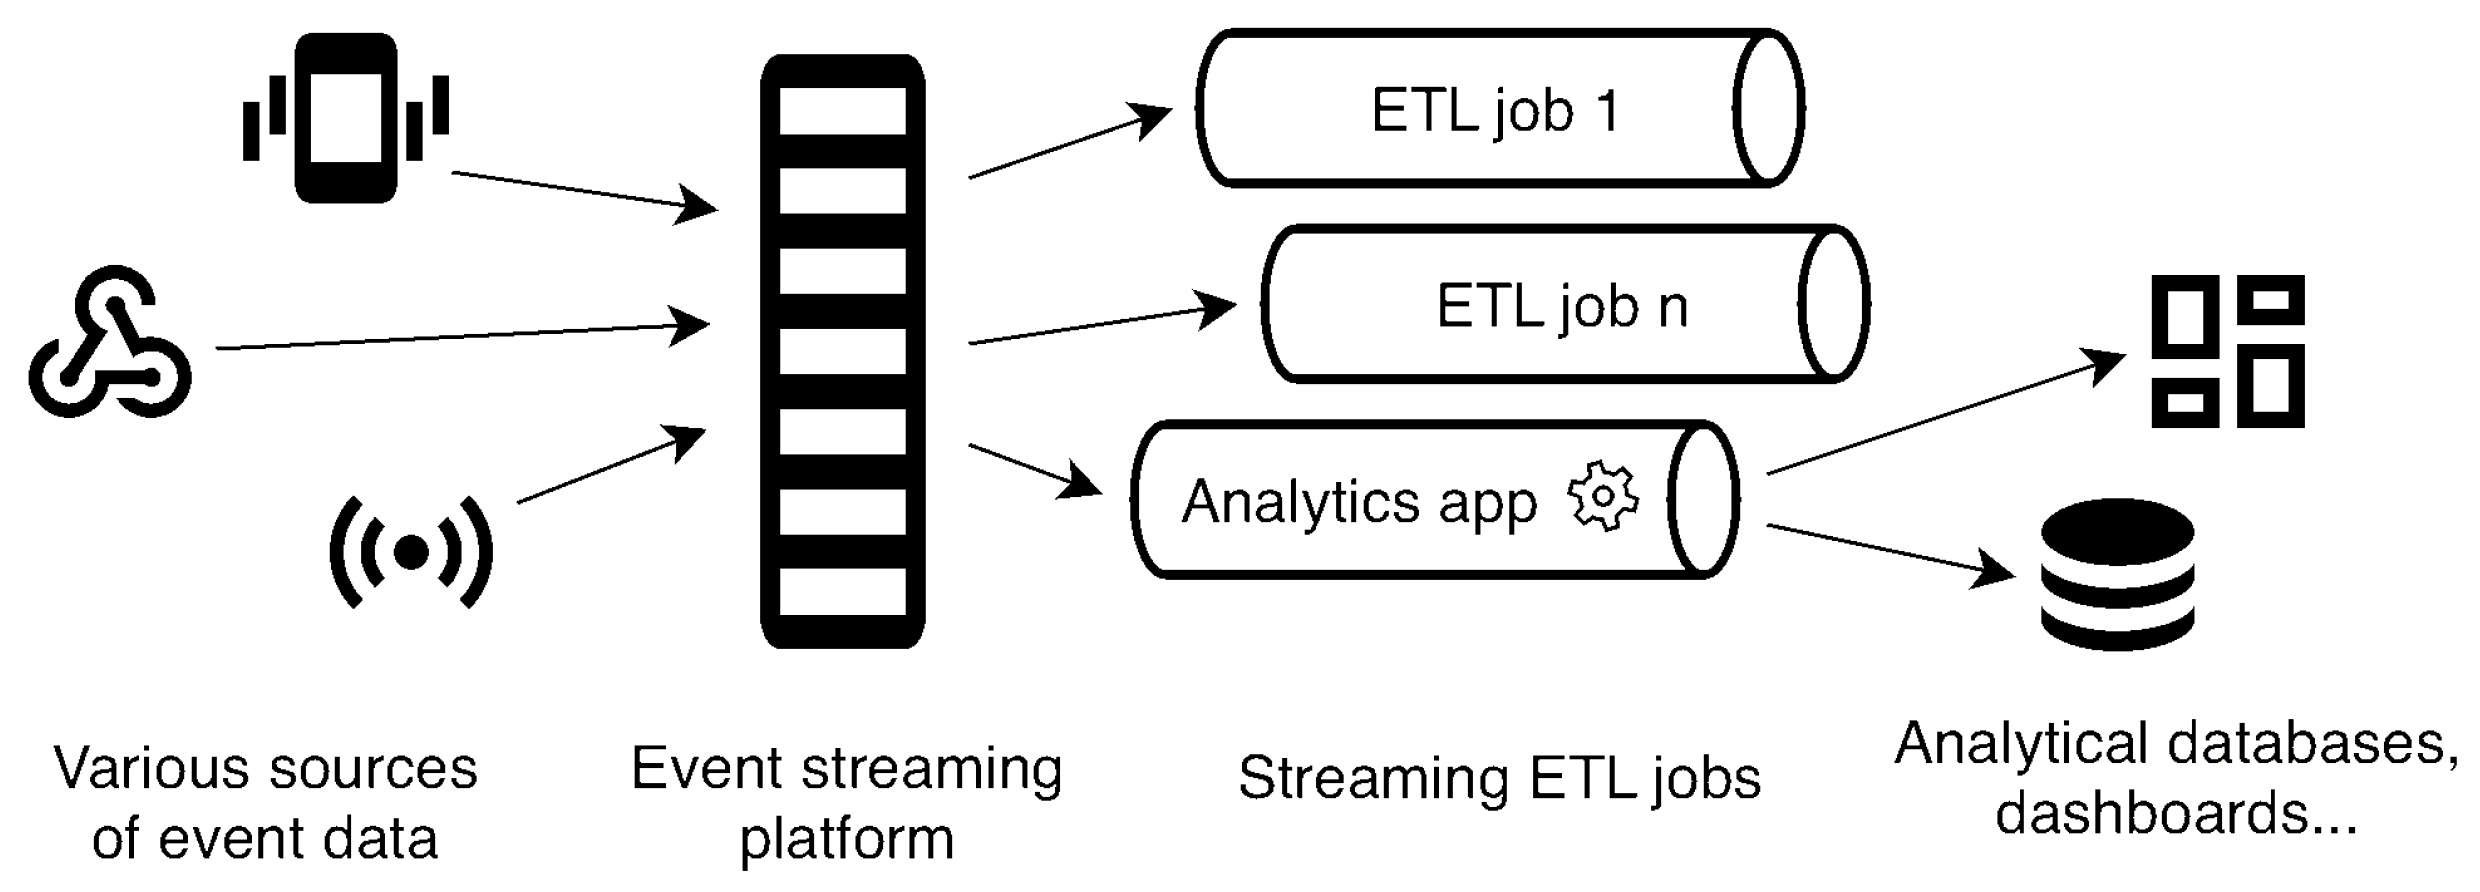
The rapid development of dedicated edge devices brings new opportunities as the performance of the devices increases. The variety in architectures, platforms, performance, and power of these devices presents a challenge in ensuring the compatibility of created solutions. The lack of standardized communication between parts of the solutions also poses a problem. To ensure the reusability of created solutions and compatibility with as many devices as possible, we propose a novel framework based on Docker containers. The framework employs a pipeline approach to data processing while providing an easy way to modify the pipeline steps.
This work describes the implementation of the framework using a few custom-built services. By employing the pipeline approach, the framework allows for easy modification and extension of the services offered, providing a foundation for other solutions.
3. Proposed Streaming ETL Framework
To address the challenges of real-time data processing in IoT applications, we present a comprehensive Streaming ETL framework. The design incorporates partially decentralized communication using the ZMQ event bus, an approach similar to [
31], and MQTT broker, facilitating communication between the Streaming ETL services and the IoT devices. The modular system can be easily scaled thanks to a partially decentralized architecture.
Containerization technology, which provides a consistent environment for the application and its dependencies, plays a key role in ensuring the modularity and portability of the framework [
41]. While simplifying deployment and management, this feature allows for smooth integration with infrastructure. As a result, the proposed framework can be easily adapted to different use cases and requirements, demonstrating its versatility in the face of diverse IoT application needs.
Furthermore, combining ZMQ and MQTT communication technologies enables efficient data transfer and processing even in high-volume or limited networked scenarios. The lightweight nature of MQTT makes it well-suited for constrained environments and low-bandwidth networks [
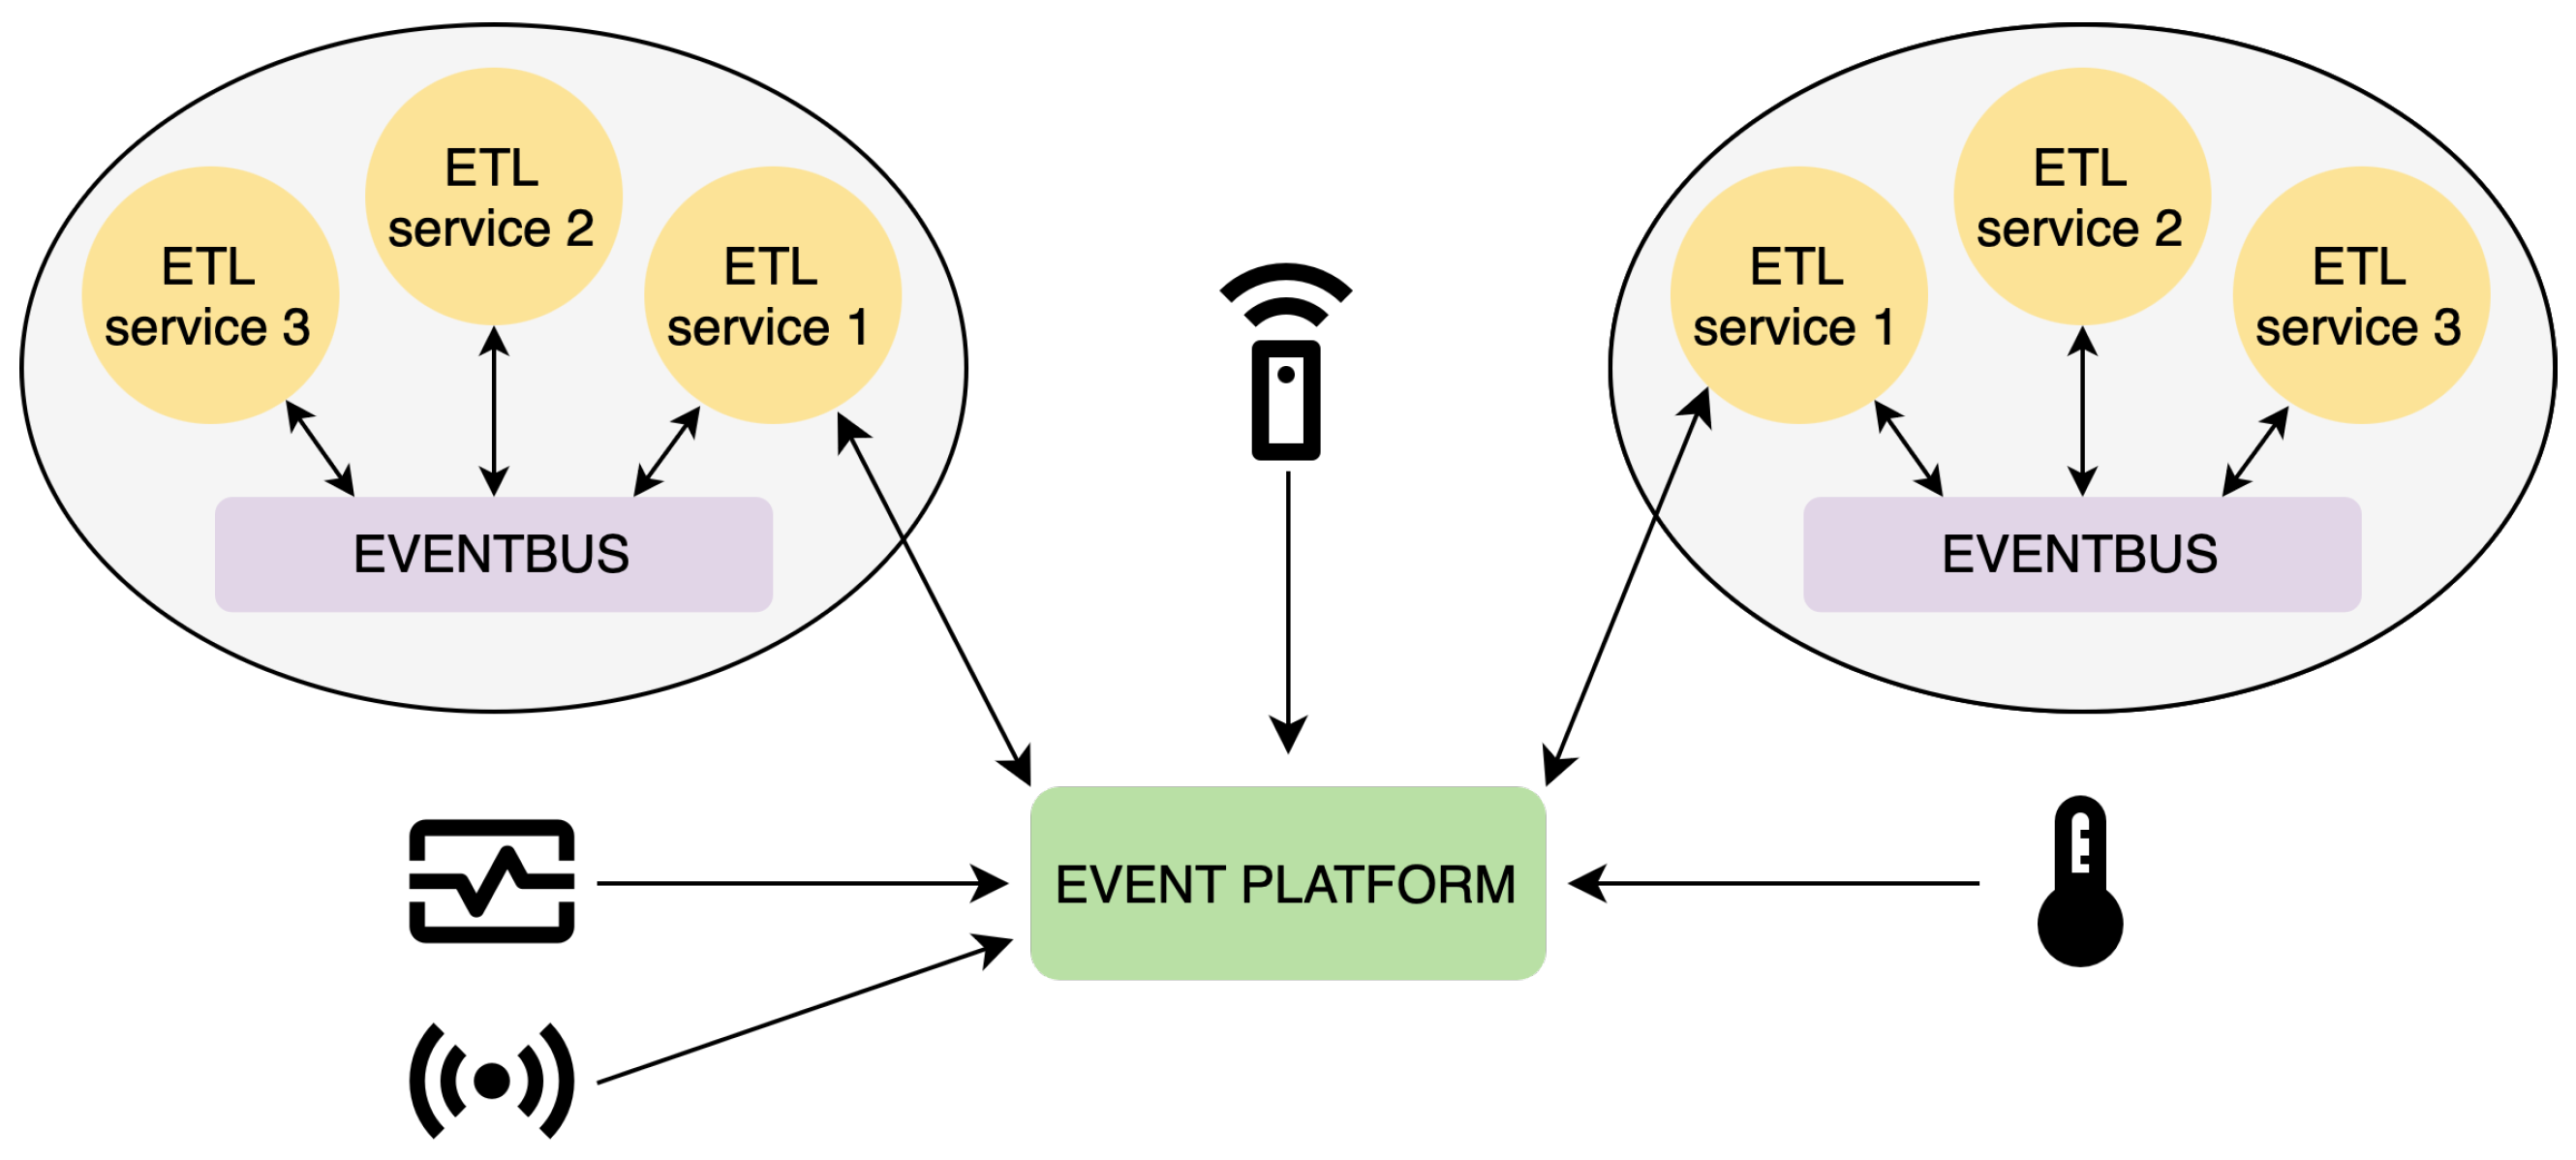
38], while ZMQ’s asynchronous messaging capabilities provide reliable and high-performance communication between ETL services. Both chosen communication technologies use publish-subscribe architecture, contributing to the system’s modularity. The proposed architecture design with the event bus and event platform can be seen in
Figure 3.
A robust and flexible infrastructure that can adapt to the dynamic demands of IoT applications can be achieved by combining Kubernetes and Terraform. With its declarative approach, Terraform enables seamless infrastructure management and versioning, paving the way for rapid development and deployment of the solution. Using Terraform with Kubernetes ensures that infrastructure changes can be applied consistently and reliably across environments, simplifying the transition from development to production [
21].
This combination of technologies also promotes more manageable and maintainable infrastructure by encouraging the adoption of IaC practices. By treating infrastructure as code, the system’s configuration can be versioned and tested, increasing confidence in the stability of the deployed solution. Overall, the integration of Kubernetes and Terraform provides a solid foundation for the Streaming ETL framework, ensuring its adaptability, reliability, and efficiency in meeting the diverse needs of IoT applications.
Our programming language of choice for the Streaming ETL services’ development was Python. However, using the ZMQ event bus in our framework adds an extra layer of modularity, allowing the integration of components to be written in different programming languages such as C, C++, Java, JavaScript, Go, C#, and many others. This language-agnostic approach allows future researchers and developers to leverage the strengths of different programming languages when building individual components, increasing the flexibility and adaptability of the overall system.
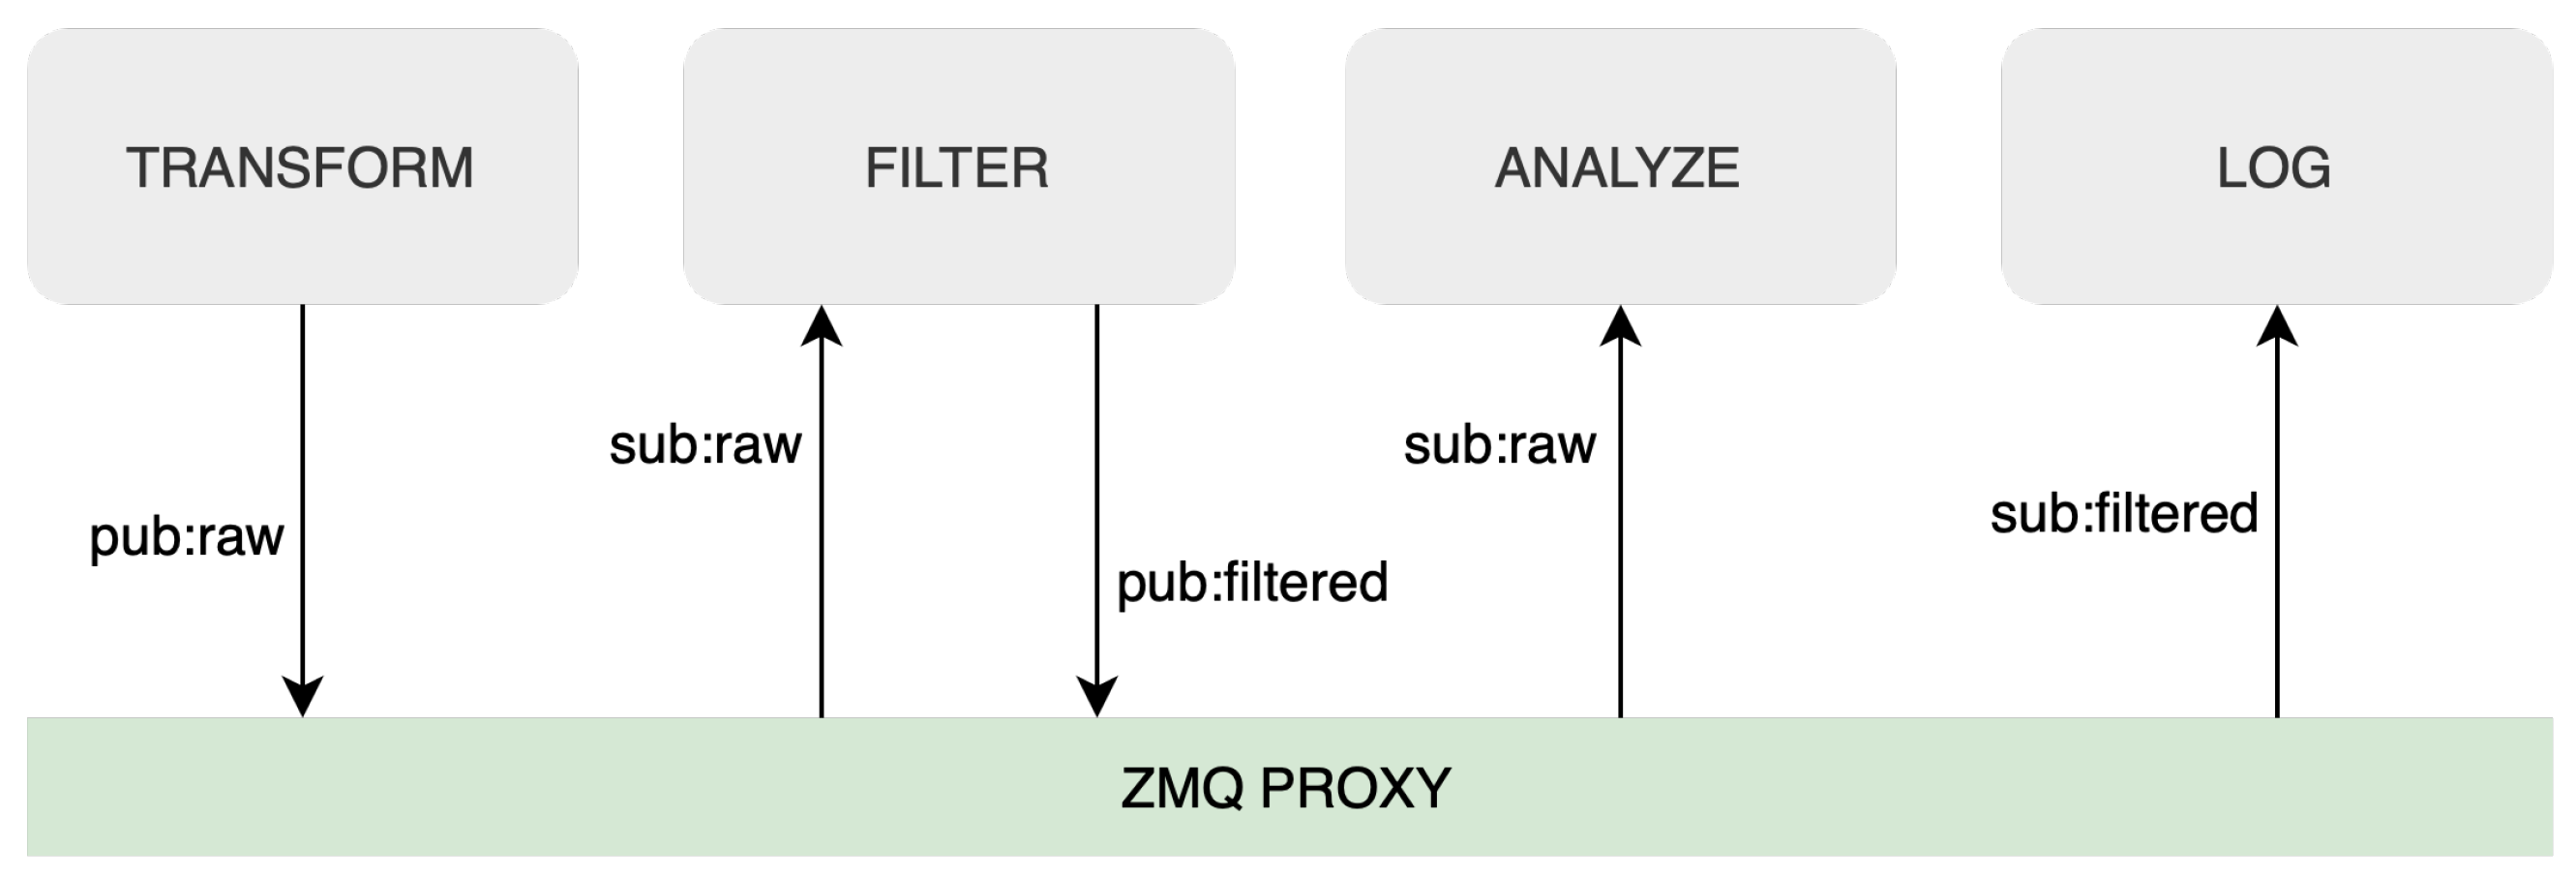
As a result, the system can be easily extended by adding more services (subscribers and/or publishers) into the ETL ZMQ event bus, as can be seen in
Figure 4, or can be customized to meet the unique requirements of different IoT applications and environments. By incorporating this level of modularity and versatility into the implementation, our framework becomes more robust and capable of handling the complex and evolving challenges associated with IoT data processing.
In the following sections, we will look at the details of each service we have implemented as part of our Streaming ETL framework. We will discuss their functionalities, used technologies, and how they work together to provide efficient real-time data processing tools for not only IoT applications. In this project, we have developed a standardized framework for real-time data processing that can be customized for different applications. By following this framework, the user can create a data processing pipeline tailored to their specific needs, taking advantage of containerization, edge computing, automated infrastructure on Kubernetes, and efficient communication protocols.
3.1. Input Data Transformation Service
The input data transformation service is an essential part of this framework. The data formats most commonly used in IoT solutions include JSON, raw values in either numerical or string form, and binary data. To ensure that all these types are usable in our framework, they must first be transformed into a unified format. The transformer processes raw data that are collected from various IoT devices. The service takes incoming data, applies transformation rules, and converts them into a standardized JSON format that can be easily consumed by subsequent components in the system, such as filtering and data analysis services. Data fields are standardized to general names during the transformation process, and measured values are rounded to two decimal places. After transformation, data are sent to the ZMQ event bus, making them available for other services. Standardization is the first step toward an autonomous AI algorithm capable of selecting and managing processing tasks to be applied to the data.
This service can receive data from MQTT devices via the MQTT broker, which we call push devices, or from REST API clients, which we call fetch devices. For REST API clients, we implemented a modular client that fetches data from the endpoint every n seconds, where n is configured in the environment variables of this service. By standardizing data, the input data transformation service increases the overall efficiency and interoperability of the system, ensuring a seamless integration with other back-end services.
3.2. Filtering Mechanism
Reducing the volume of data stored in the database is the responsibility of the filtering service. This is performed by applying pre-defined filters to the transformed data, ensuring that only relevant and necessary information is forwarded to subsequent components in the system.
By filtering data, the service helps optimize storage and processing requirements and reduce network bandwidth consumption. This efficiency is particularly important in IoT applications, where devices can generate massive amounts of data, but not all may be relevant or useful.
In addition, the service integrates modular filtering algorithms. Implemented filters include a value change filter that only sends data to the ZMQ event bus for further processing when a new value differs from the previous one. Another filter deals with numerical values with a set precision. In this case, data are only passed to the ZMQ event bus for further processing if a new value has changed by more than the set precision. These filters can be easily extended and adapted to suit different data processing requirements and scenarios.
3.3. Analyzing Service
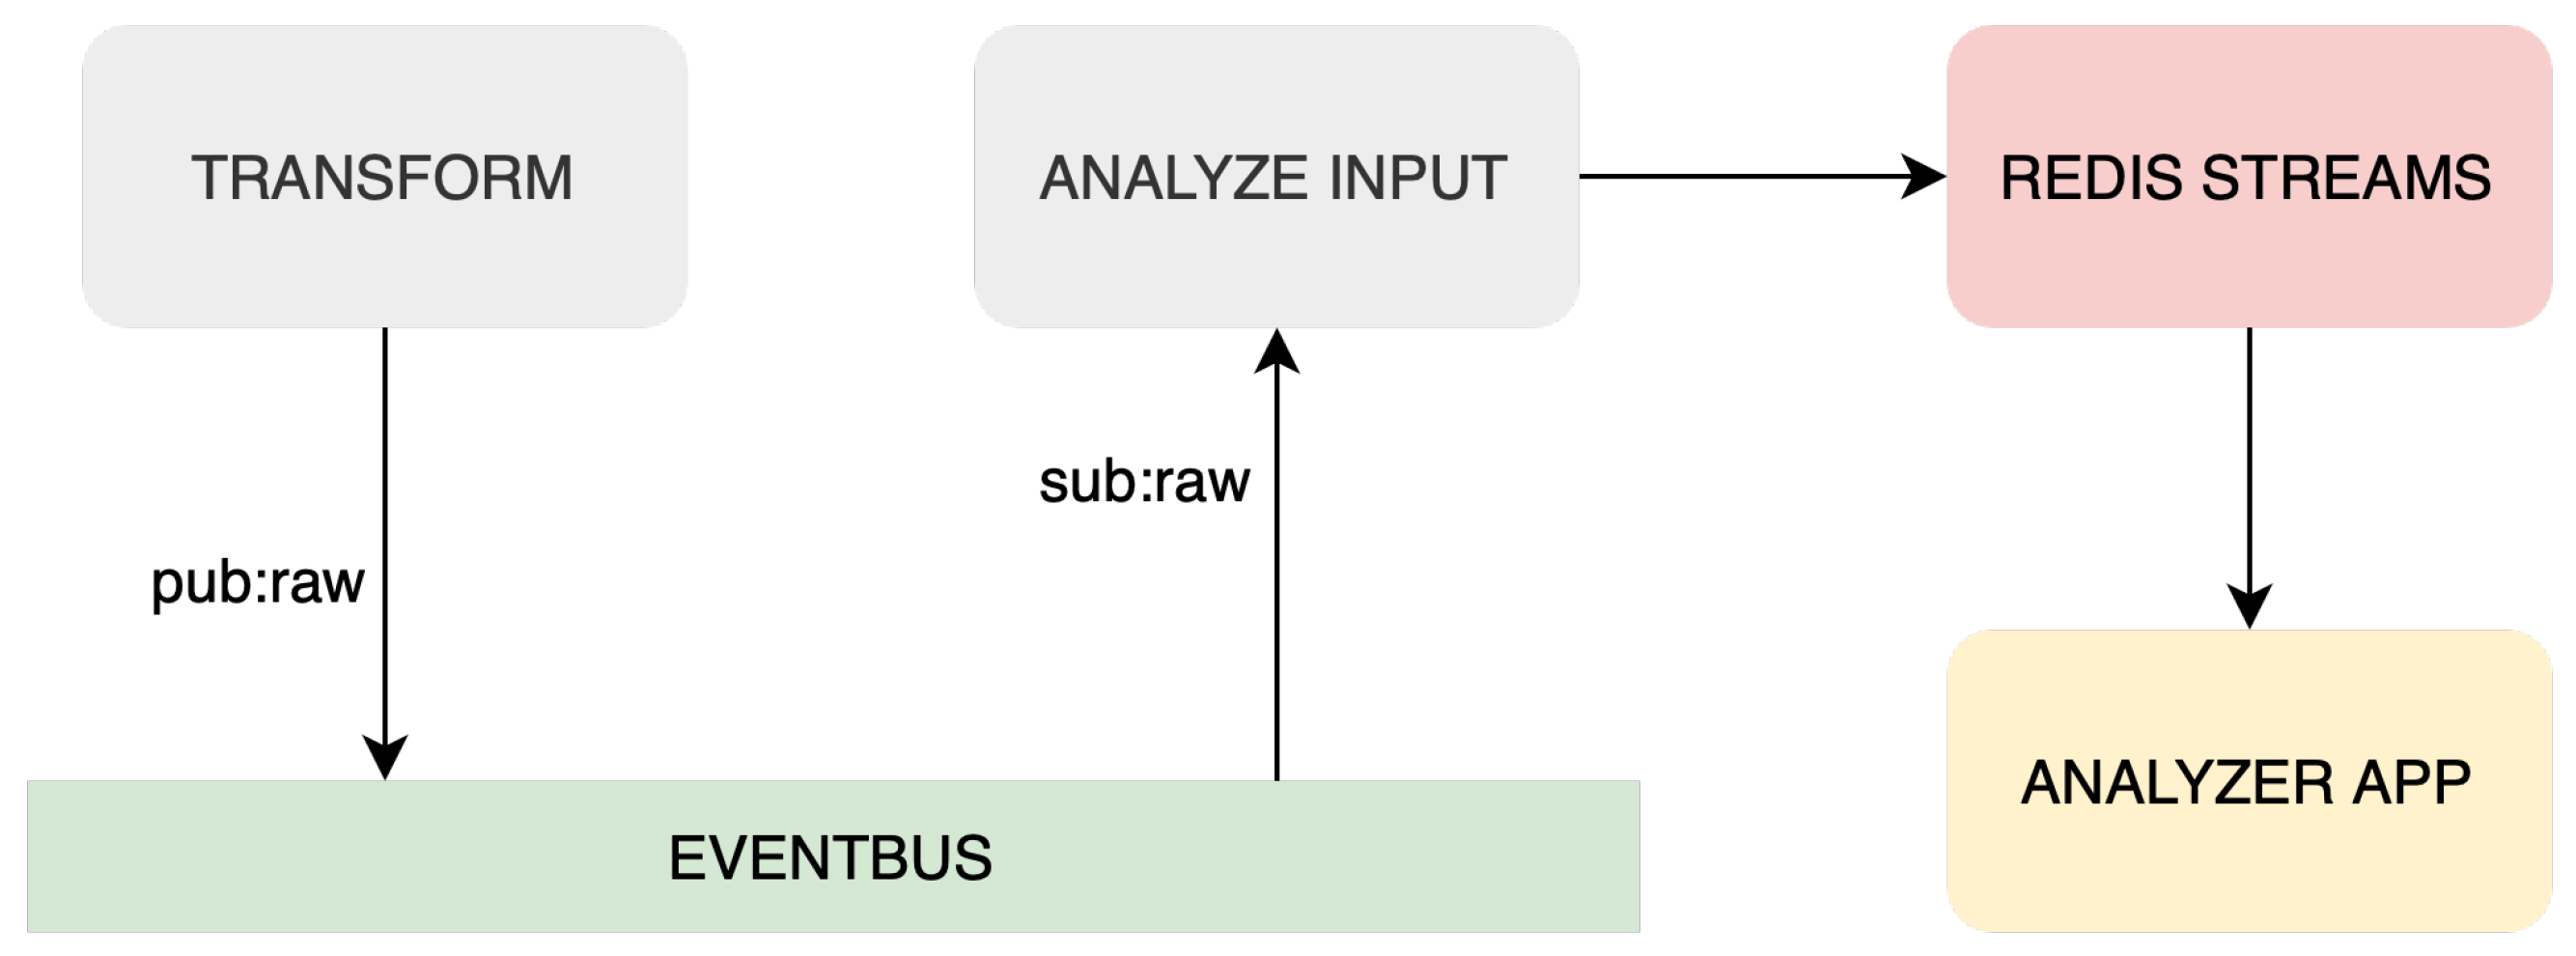
Analyzing service is the next component in the Streaming ETL system, designed to perform analysis on transformed data to extract valuable insights. This service has three components: Redis Logger, Redis Consumer, and Redis Streams. These elements and dataflow can be seen in
Figure 5.
Redis Logger reads transformed data from the ZMQ event bus and sends them to Redis Streams, an in-memory data structure for managing and processing real-time data streams. Redis Streams provides efficient stream processing capabilities, making it an ideal choice for IoT applications that require rapid analysis of large volumes of data.
Redis Consumer reads data from Redis Streams and analyzes the last n records. The analysis includes calculating the slope and rate of change of values such as temperature and humidity. These insights can then be used to support decision-making. It is important to state that within the analyzing service, any number of Redis consumers can be incorporated to meet the requirements of each specific application as needed. The service enables faster decision-making based on analyzed data by using Redis Streams for real-time data analysis.
3.4. MongoDB Time Series and Logging Service
MongoDB Time Series and logging service represent the final components of the Streaming ETL system, responsible for storing processed data from IoT devices. This service uses the MongoDB Time Series database, a specialized data storage solution designed to handle time-based data with high ingestion rates and large volumes. By utilizing a time series database, the system can efficiently store, index, and query large volumes of time-stamped data, making it easier to perform historical analysis and identify trends over time. In addition, the MongoDB Time Series provides flexibility to handle different data types commonly found in IoT applications, such as temperature, humidity, and many other sensor readings.
The logging service reads filtered data from the ZMQ event bus and stores them in the MongoDB Time Series database. In addition to transformed and filtered data, the logging service also includes information about the location of the device, the device ID, and metadata about the processes performed on the received data. This additional information provides valuable context for understanding and analyzing IoT data, enabling more informed decision-making and a better understanding of overall system performance.
3.5. Deploying Framework to Kubernetes Cluster
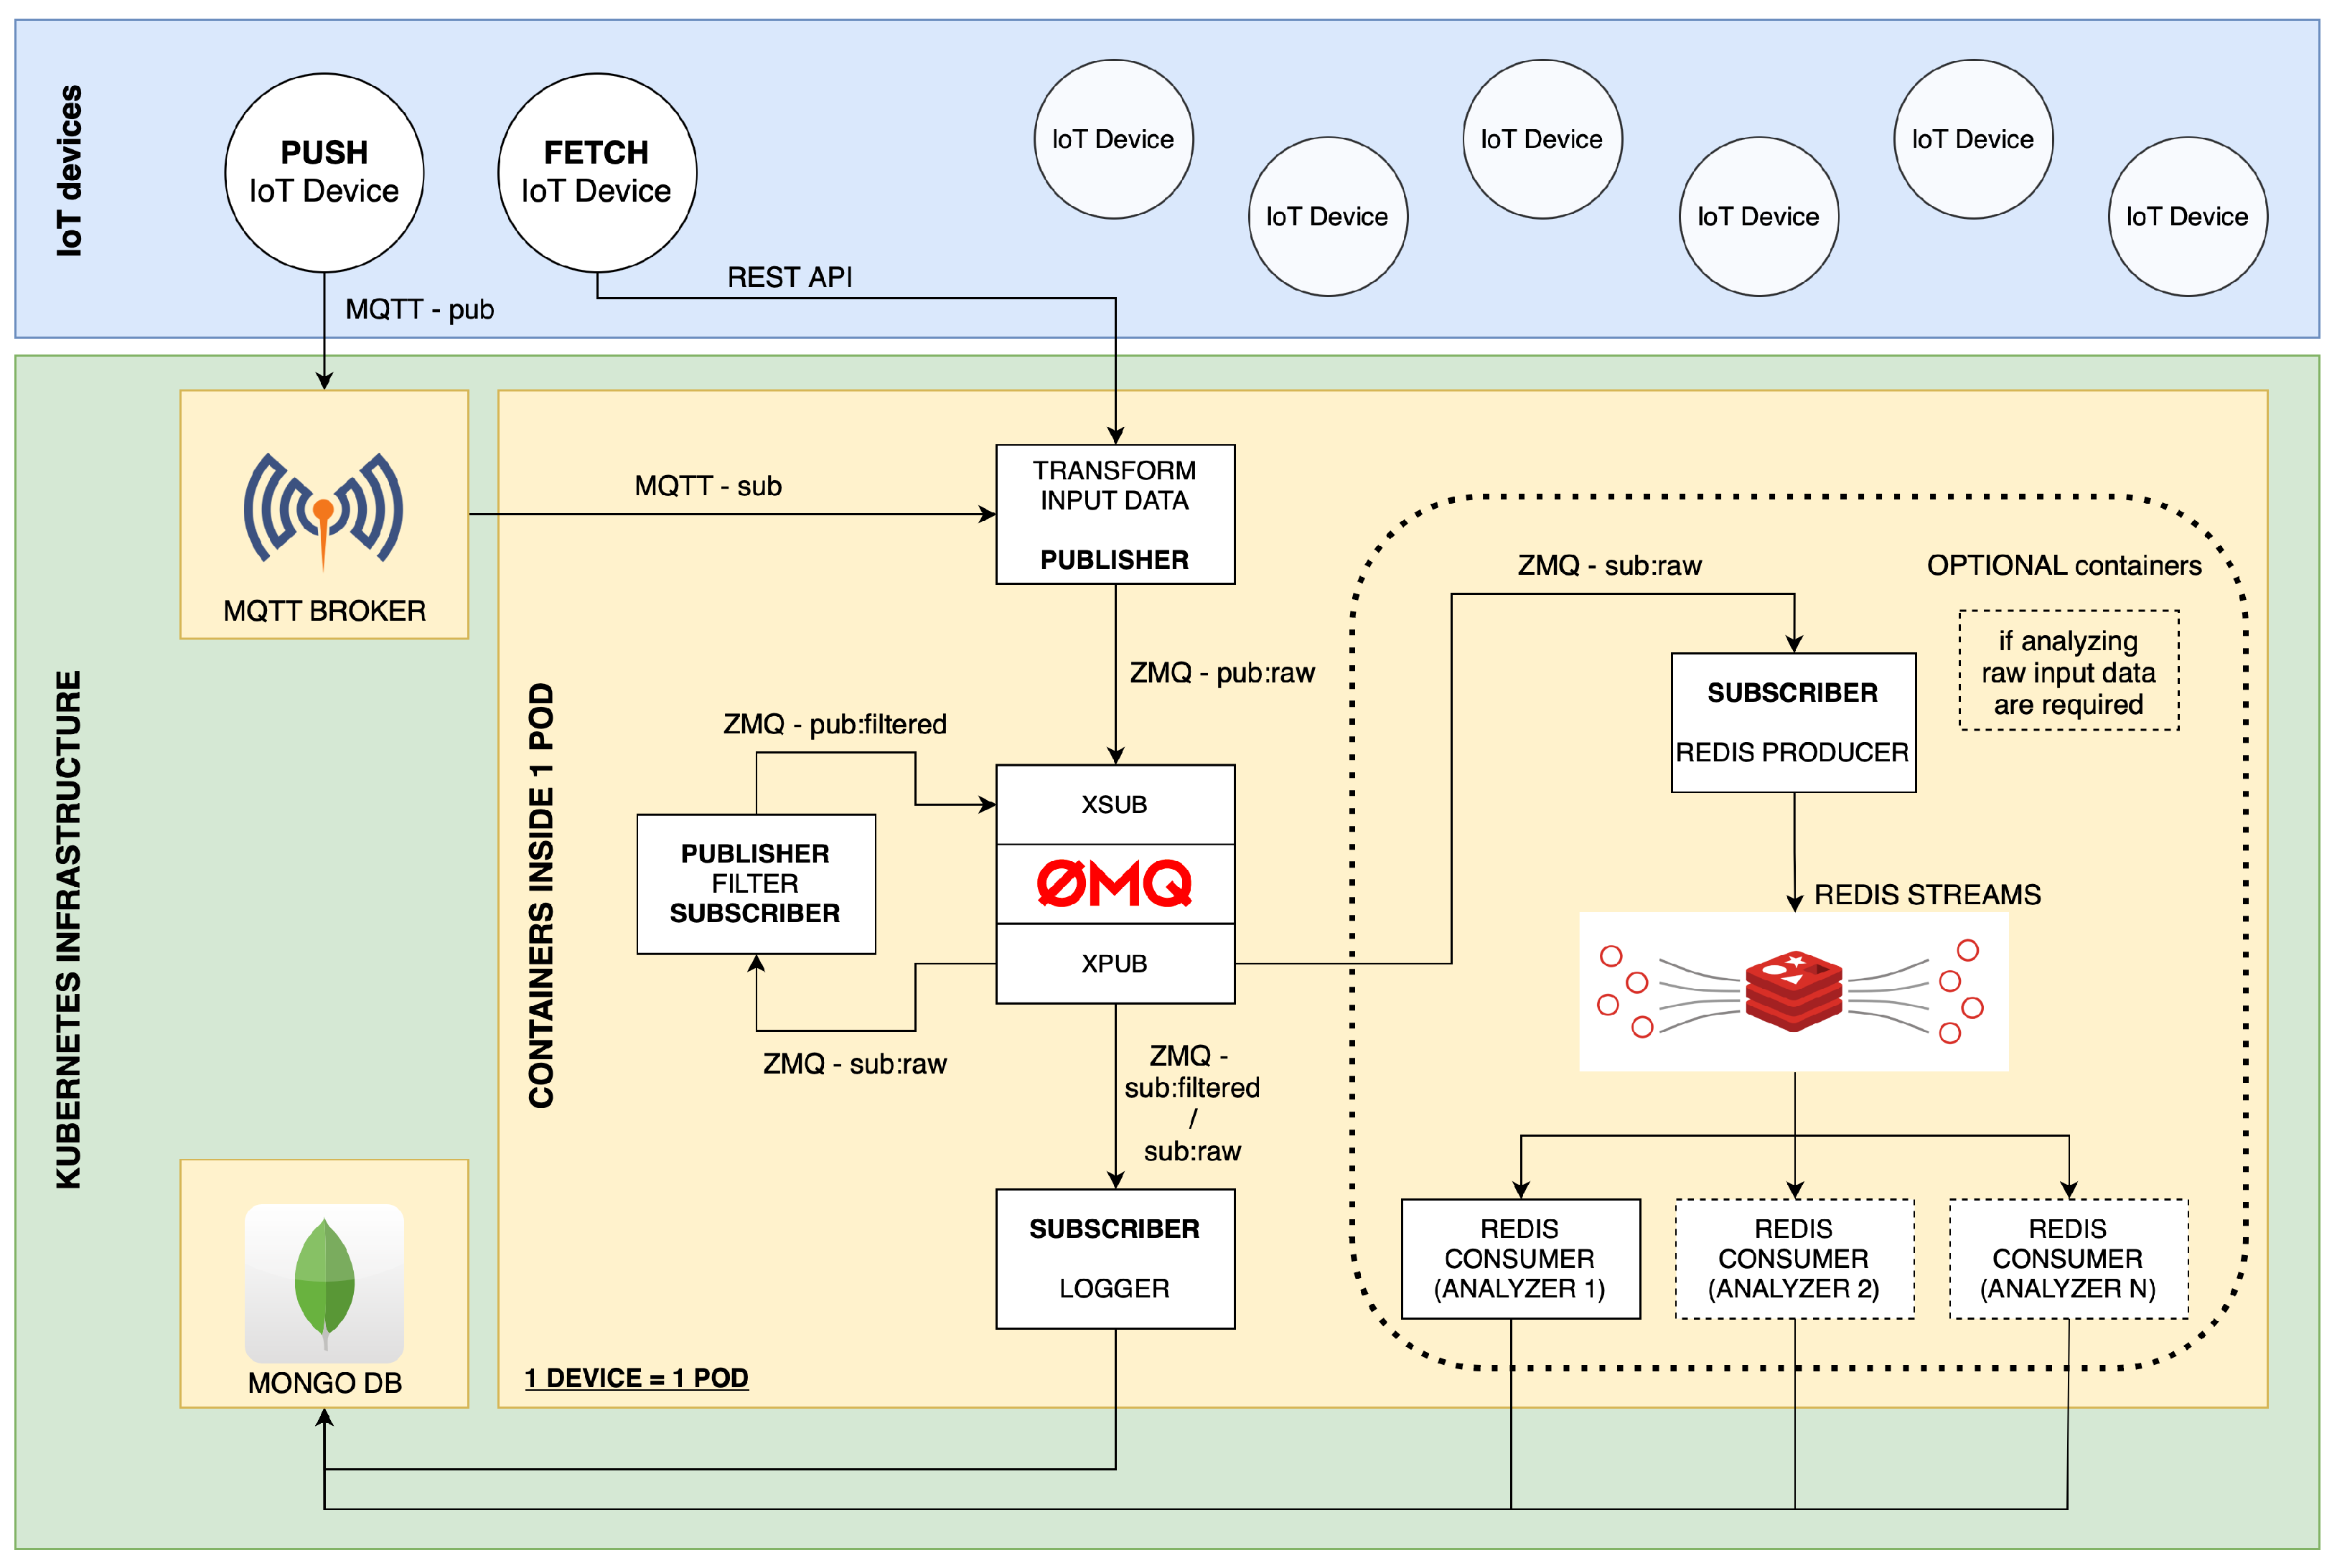
We deployed the containerized framework on a laboratory edge server running the Proxmox hypervisor. This is an open-source virtualization platform based on Debian GNU/Linux. Proxmox uses Kernel-based Virtual Machine (KVM) and Linux Containers (LXC) technologies to manage and create virtual machines and containers. We created two virtual machines that form a Kubernetes cluster consisting of a manager node and a worker node. The manager node is responsible for the management of the cluster and the coordination of its activities. In contrast, the worker node runs containerized ETL services, MongoDB Time Series database, and MQTT broker. Instead of using Dockershim to connect Kubernetes to the Docker container engine, we chose CRI-O, a Kubernetes Container Runtime Interface (CRI) implementation. This was performed because CRI-O is specifically designed and optimized to meet the requirements of Kubernetes. The full architecture of our framework is shown in
Figure 6.
4. Testing of the Framework
To evaluate our framework, we have focused on analyzing the round-trip time (RTT) metric across ETL services within a series of tests. The tests included different numbers of measurements (10, 100, and 1000) and different time delays (1 ms, 10 ms, and 100 ms) between measurements. These parameters were selected to simulate different scenarios, such as a short burst with 10 values and 1 ms time delay or a long burst with 1000 measurements and 1 ms time delay. The burst, 1 ms time delay, can simulate an industrial sensor that requires an instant response to measured values. The longer delay can simulate commercial IoT sensors, such as temperature sensors, where the increased delay does not cause any problems. We expected the RTT to decrease as the time delay decreased due to the dynamic frequency boosting of modern CPUs. To test the framework, we have chosen two different approaches that allowed us to verify the efficiency and performance of our framework on different modern hardware platforms. First, we tested the framework on a 64-bit ARM processor and then on a 64-bit x86 processor. We allocated eight CPU cores and 8192 MB of RAM in both environments for the test environment.
The chosen architecture for testing the framework can be seen in
Figure 7. Since we focused on testing ETL services within our proposed framework, we omitted actual IoT devices from our test environment because of the lack of computing resources and limited control over data transfer rates. For this reason, we designed a test container that could simulate an IoT device and allow us to adjust the speed and volume of the data feed as needed. The test container generates and sends data to the ZMQ event bus and then receives them to calculate RTT. We also omitted the MQTT broker and decided not to include the analysis service in the test as it does not play a primary role in data processing and depends on a required application. This proposed architecture allowed us to perform load tests on the designed services and ZMQ communication while giving us control over parameters we could change for different test scenarios.
4.1. The Test Environment
For our testing, we took two different approaches, which allowed us to compare the effectiveness and performance of two different hardware platforms. The first was a 64-bit ARM CPU, and the second was a 64-bit x86 CPU. This was performed to ensure compatibility of our framework with the two most common CPU architectures used in edge computing. We also wanted to test whether there were measurable differences in the performance of our framework between them. The test scenarios were also selected to see how they dealt with various workloads.
Table 2 shows the different platforms used in our testing. The Apple M1 CPU uses the ARM big.LITTLE architecture [
45], employing high-performance cores (CPU-p), named Firestorm, and energy-efficient cores (CPU-e), named Icestorm. This architecture allowed a seamless switching of tasks between these different cores.
4.2. Tests on ARM64 with 100 ms Delay
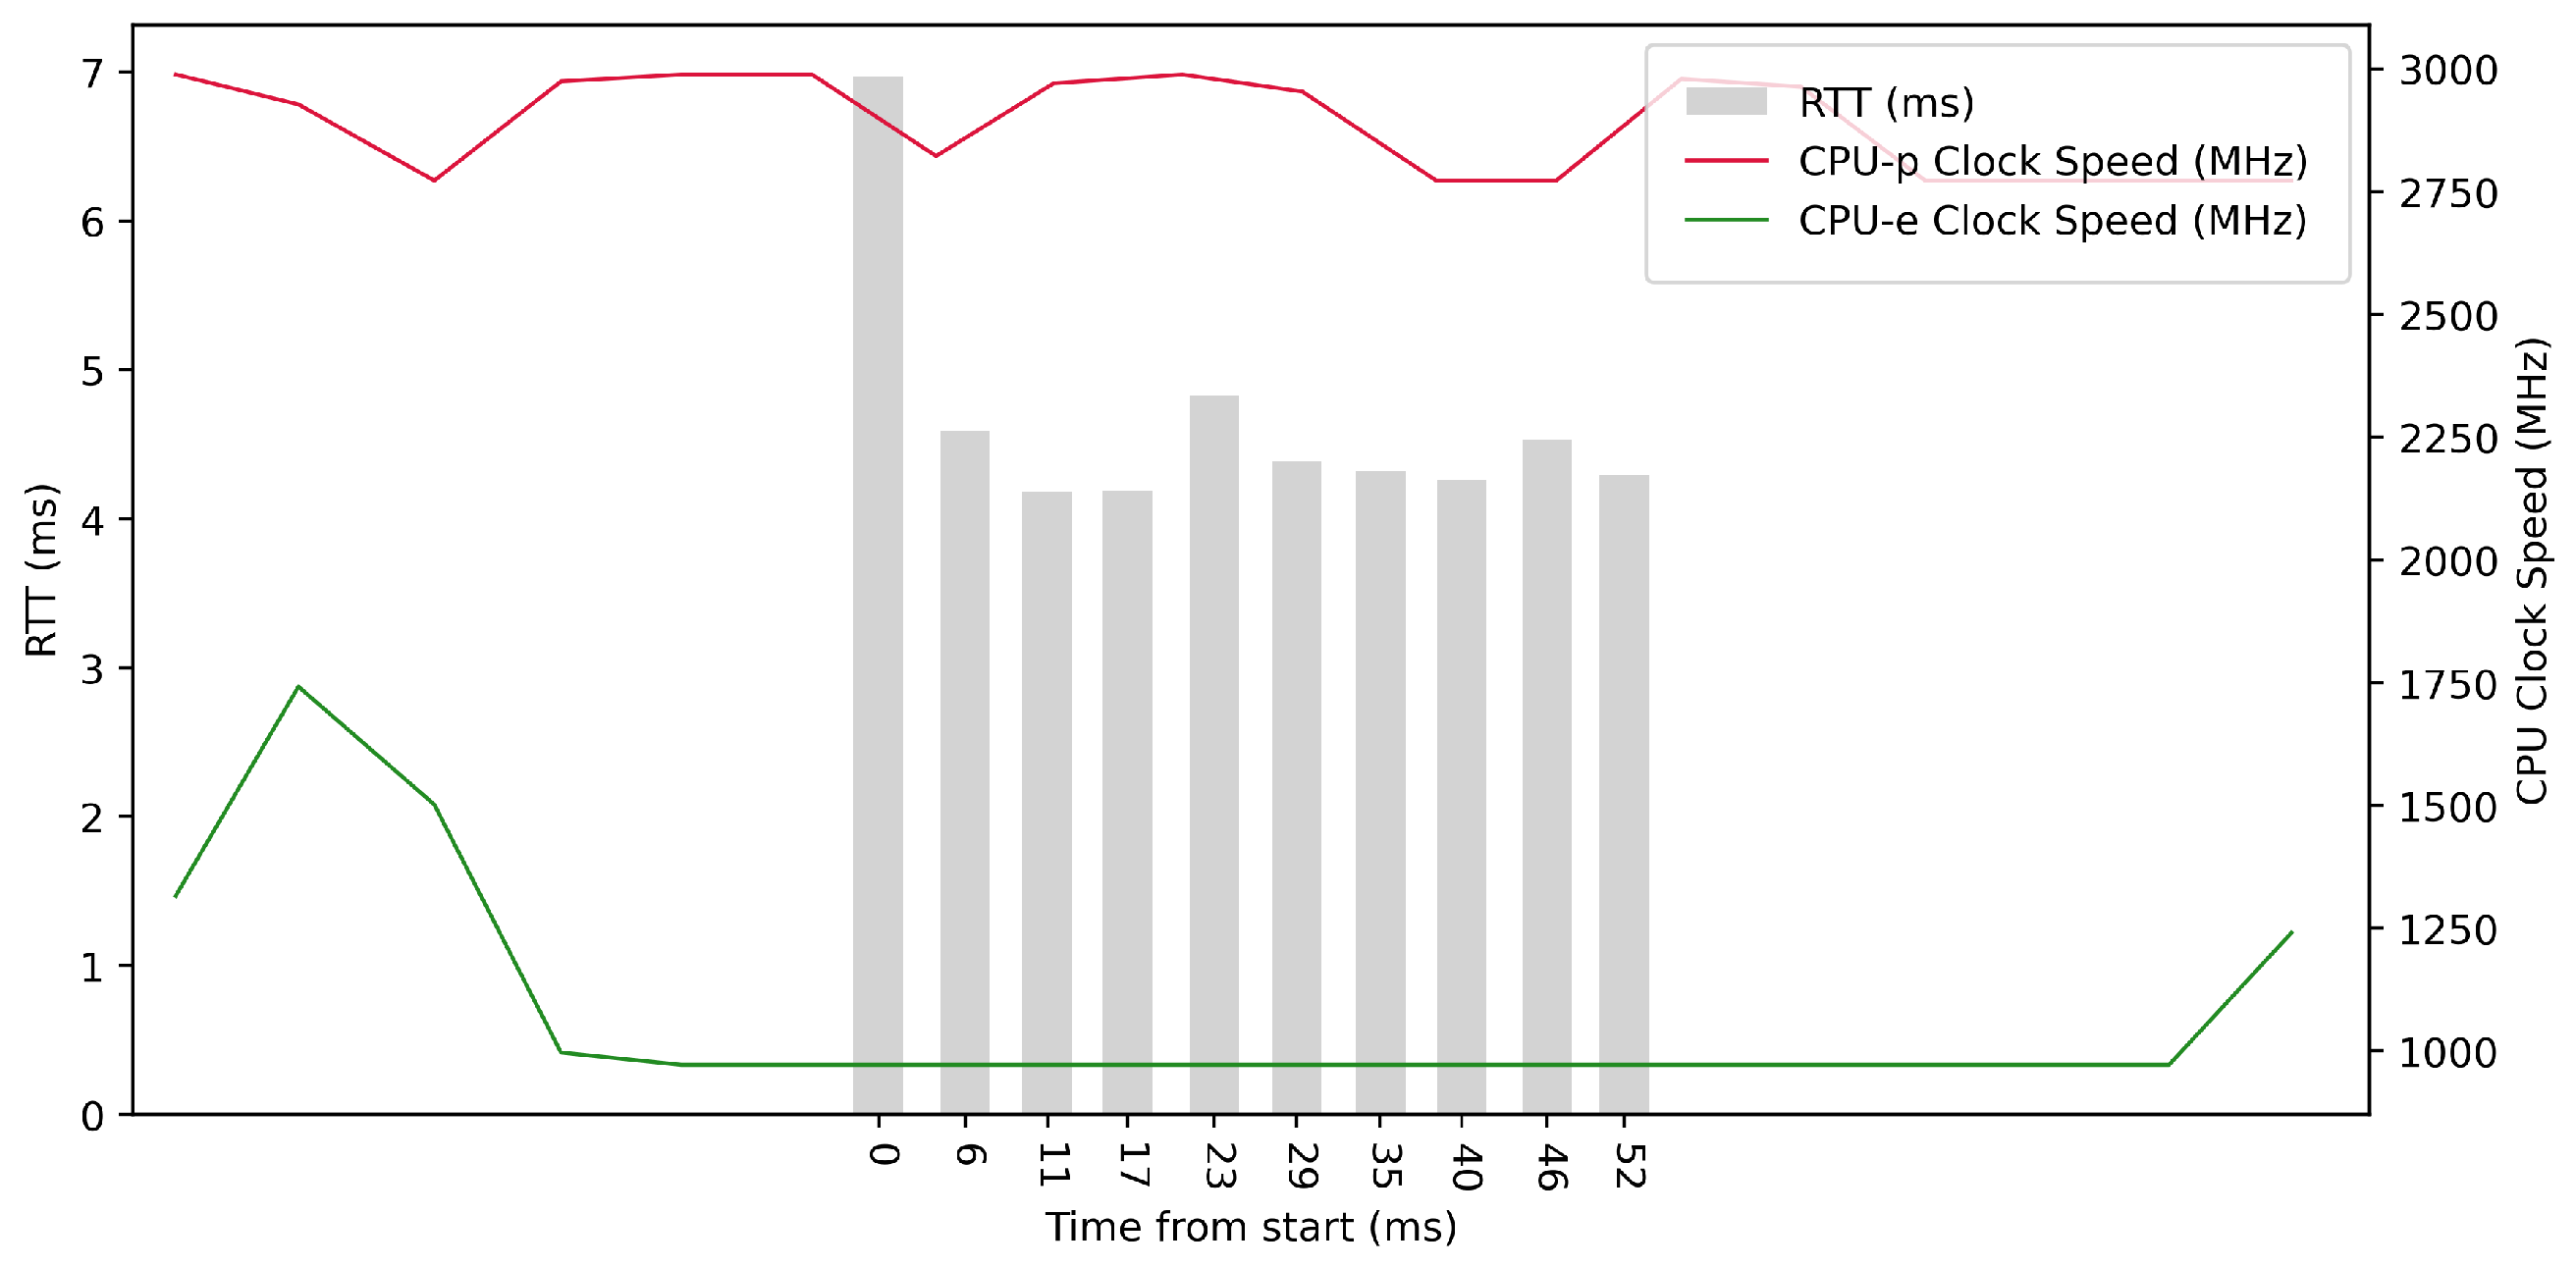
Test No. 1 consisted of 10 measurements of RTT across ETL services with a 100 ms delay between measurements. The median of this set of measurements was 5.392 ms, and the average was 5.729 ms, implying that the measurements’ distribution was approximately symmetrical. The standard deviation was 1.265 ms, implying that most values were close to the average. Other details are shown in
Table 3. From the plot in
Figure 8, we conclude that there was no increased activity in efficient cores. The performance cores worked at high frequencies, regardless of the test.
Test No. 2 consisted of 100 measurements of RTT across ETL services with a 100 ms delay between measurements. The median was 5.313 ms, and the average was 5.055 ms, implying that most measurements were close to the average. The standard deviation was 1.965 ms, which means that the values of the measurements are significantly different from the average and thus the distribution of the measurements is quite scattered. Other details can be seen in
Table 3. From the plot in
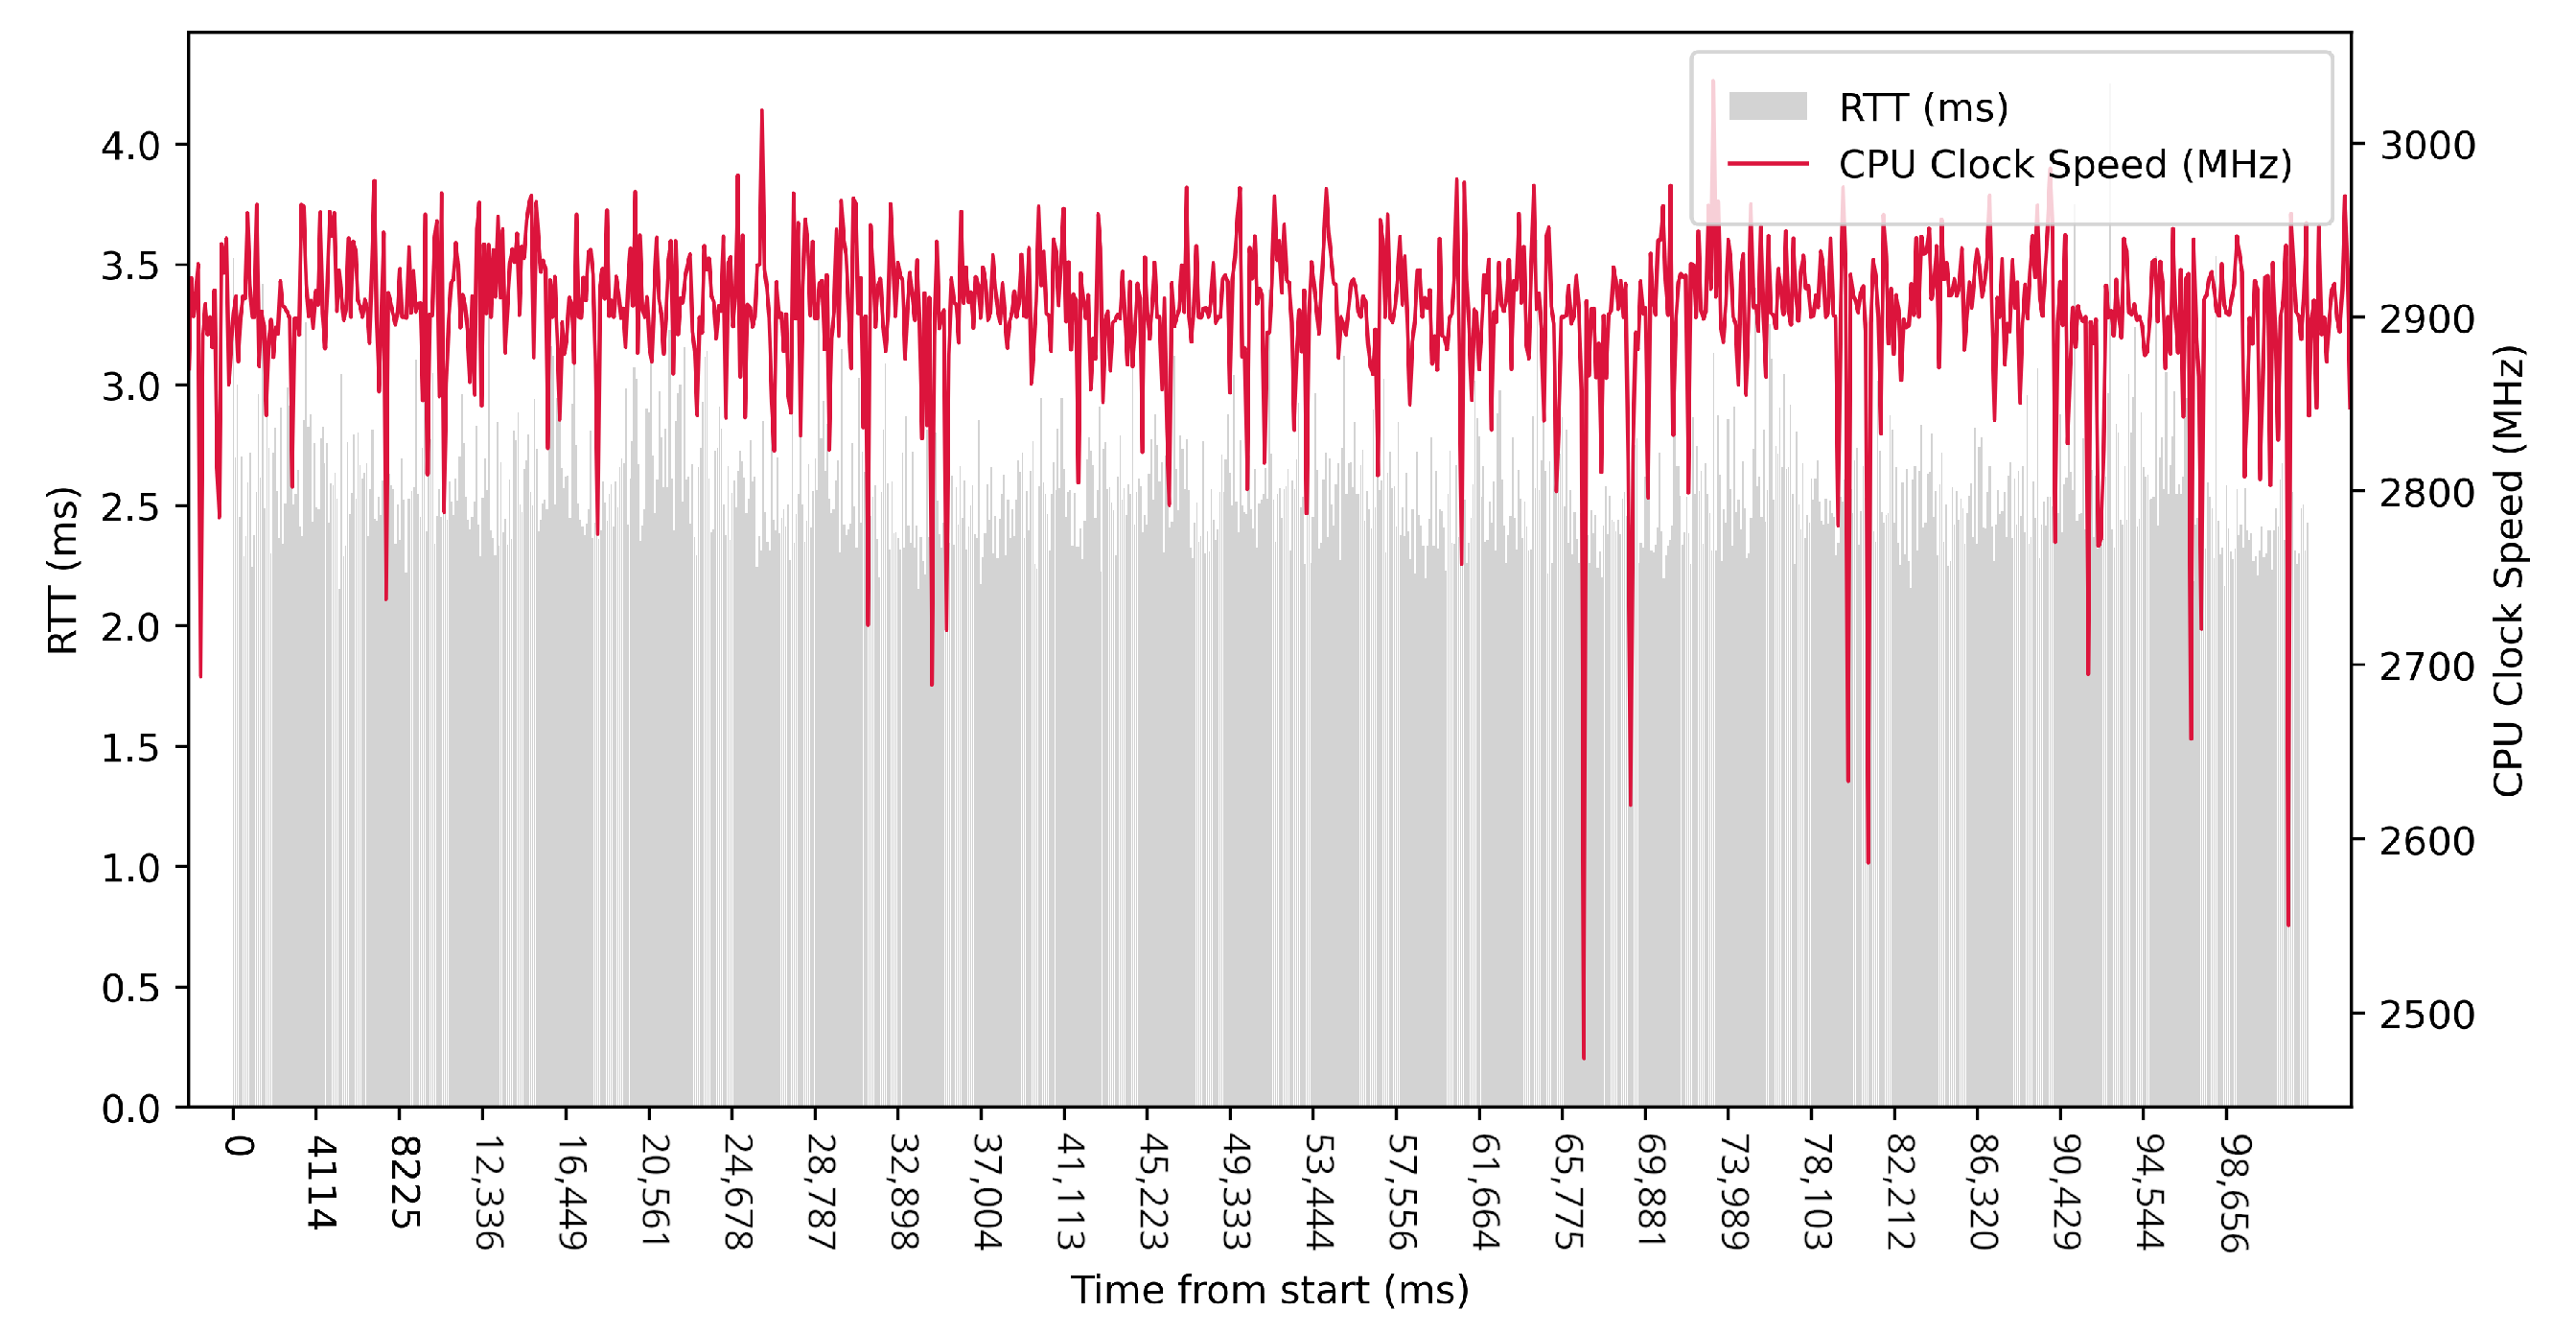
Figure 9, we can see that in some periods of the test, the RTT time is significantly reduced due to the higher clock speed of the efficient cores. In these intervals, the efficient cores were at their maximum clock speed. The performance cores operate at high frequencies, regardless of the test.
Test No. 3 consisted of 1000 measurements of RTT with a delay of 100 ms between measurements, where the median was 5.208 ms, and the average was 4.932 ms, indicating that most measurements were close to the average. The standard deviation was 1.505 ms, indicating a slight scatter of measurements and confirming that the distribution of measurements was approximately normal. The other data can be seen in
Table 3. The plot in
Figure 10 did not show a significant improvement in RTT time during the higher clock speeds of the efficient cores over the longer measurement period, and the performance cores operated at high frequencies independently of the test.
4.3. Tests on ARM64 with 10 ms Delay
For the following tests, we have decided to omit the plots as they were too similar to the plots in previous tests and therefore had little value.
Test No. 4 consisted of 10 measurements of RTT with a delay of 10 ms between measurements. The median was 5.189 ms, and the average was 5.036 ms, indicating that most measurements were close to the average. The standard deviation of the set of measurements was 1.177 ms, indicating that the distribution of measurements was slightly scattered. The other data can be seen in
Table 3. We found a lower median in test No. 4 compared to test No. 1, where the difference was 0.203 ms, indicating a smaller RTT metric.
Test No. 5 consisted of 100 measurements of RTT with a delay of 10 ms between measurements. The median was 4.692 ms, and the average was 4.492 ms, indicating that most measurements were close to the average. The standard deviation of the set of measurements was 1.175 ms, indicating that the values of the measurements were slightly different from the average. Thus, the distribution of the measurements is slightly scattered. The other data can be seen in
Table 3. Compared to test No. 2, we observed a median time lower by 0.621 ms in test No. 5, which could indicate a lower RTT metric.
Test No. 6 consisted of 1000 measurements of RTT with a delay of 10 ms between measurements. The median was 4.561 ms, and the average was 4.218 ms, indicating that most measurements were close to the average. The standard deviation of the set of measurements was 1.449 ms, indicating that the values of the measurements were slightly different from the average. The other data can be seen in the table (
Table 3). We observed a 0.647 ms lower median time in test No. 6 compared to test No. 3, which could indicate lower RTT metrics.
4.4. Tests on ARM64 with 1 ms Delay
Test No. 7 consisted of 10 measurements of RTT with a delay of 1 ms between measurements. The median was 4.352 ms, and the average was 4.653 ms, indicating that most measurements were close to the average. The standard deviation of the measurements was 0.837 ms, indicating that the measurements differed little from the average. Thus, the distribution of the measurements was poorly dispersed. The other data can be seen in
Table 3. From the plot in
Figure 11, we conclude that the efficient cores had no increased activity during the test. The performance cores were operating at high frequencies, regardless of the test. Compared to test No. 4, the median in test No. 7 was 0.837 ms lower, which could indicate better RTT metrics.
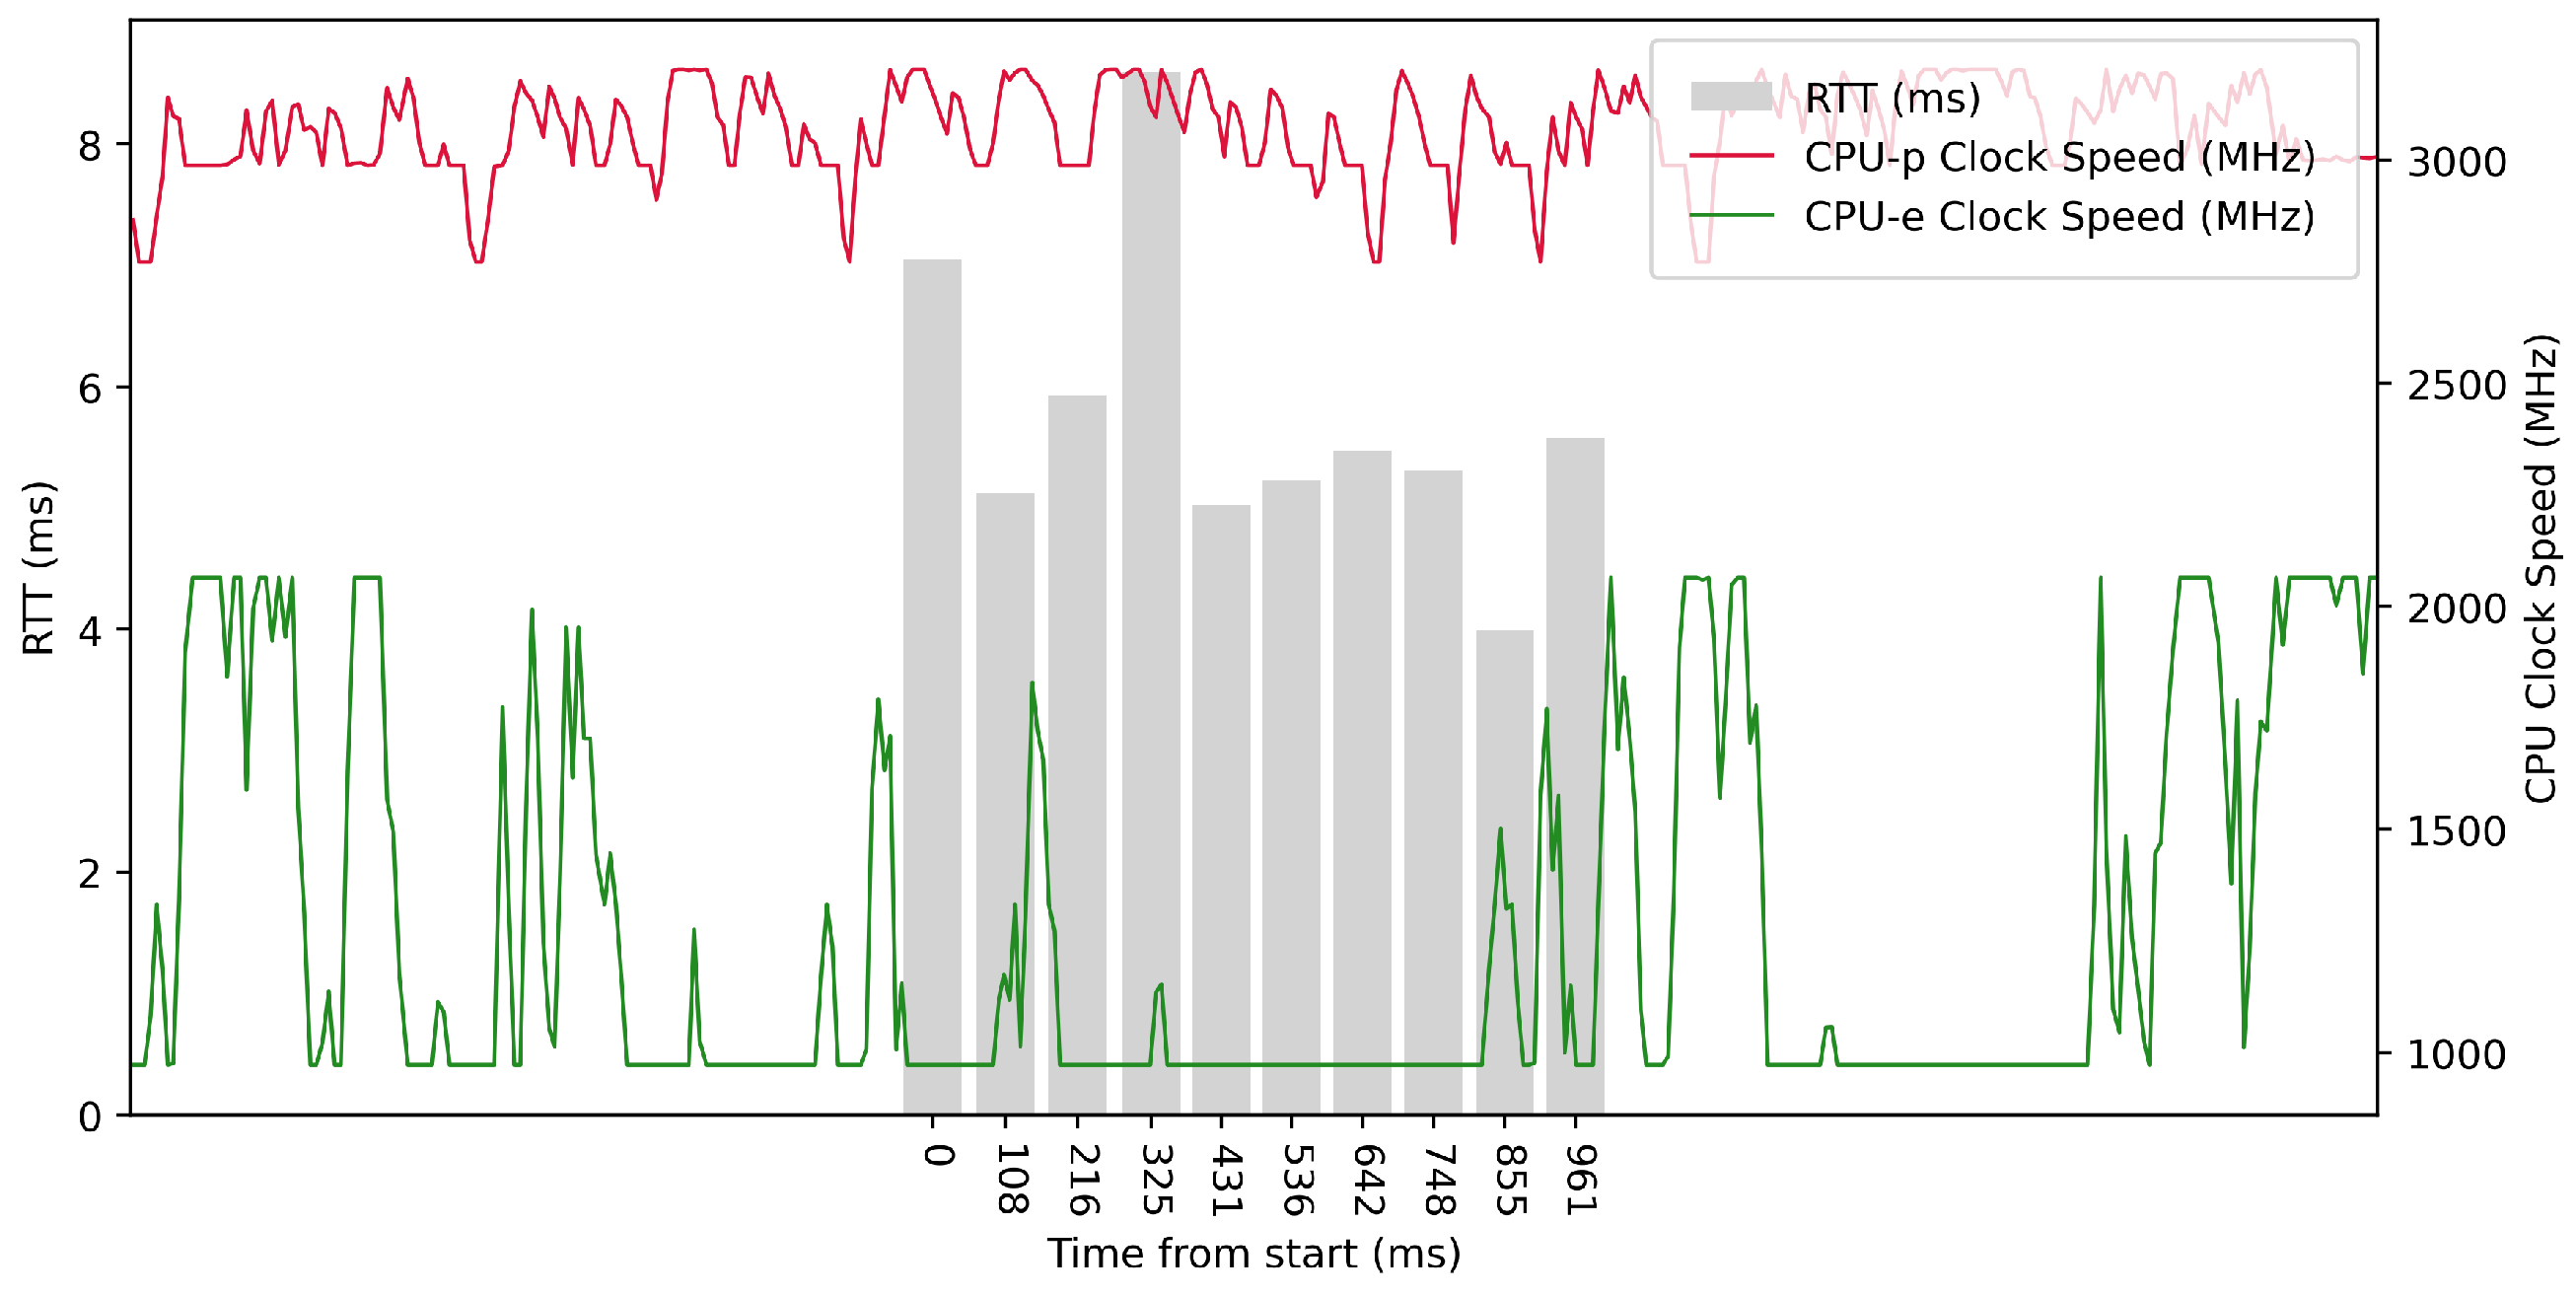
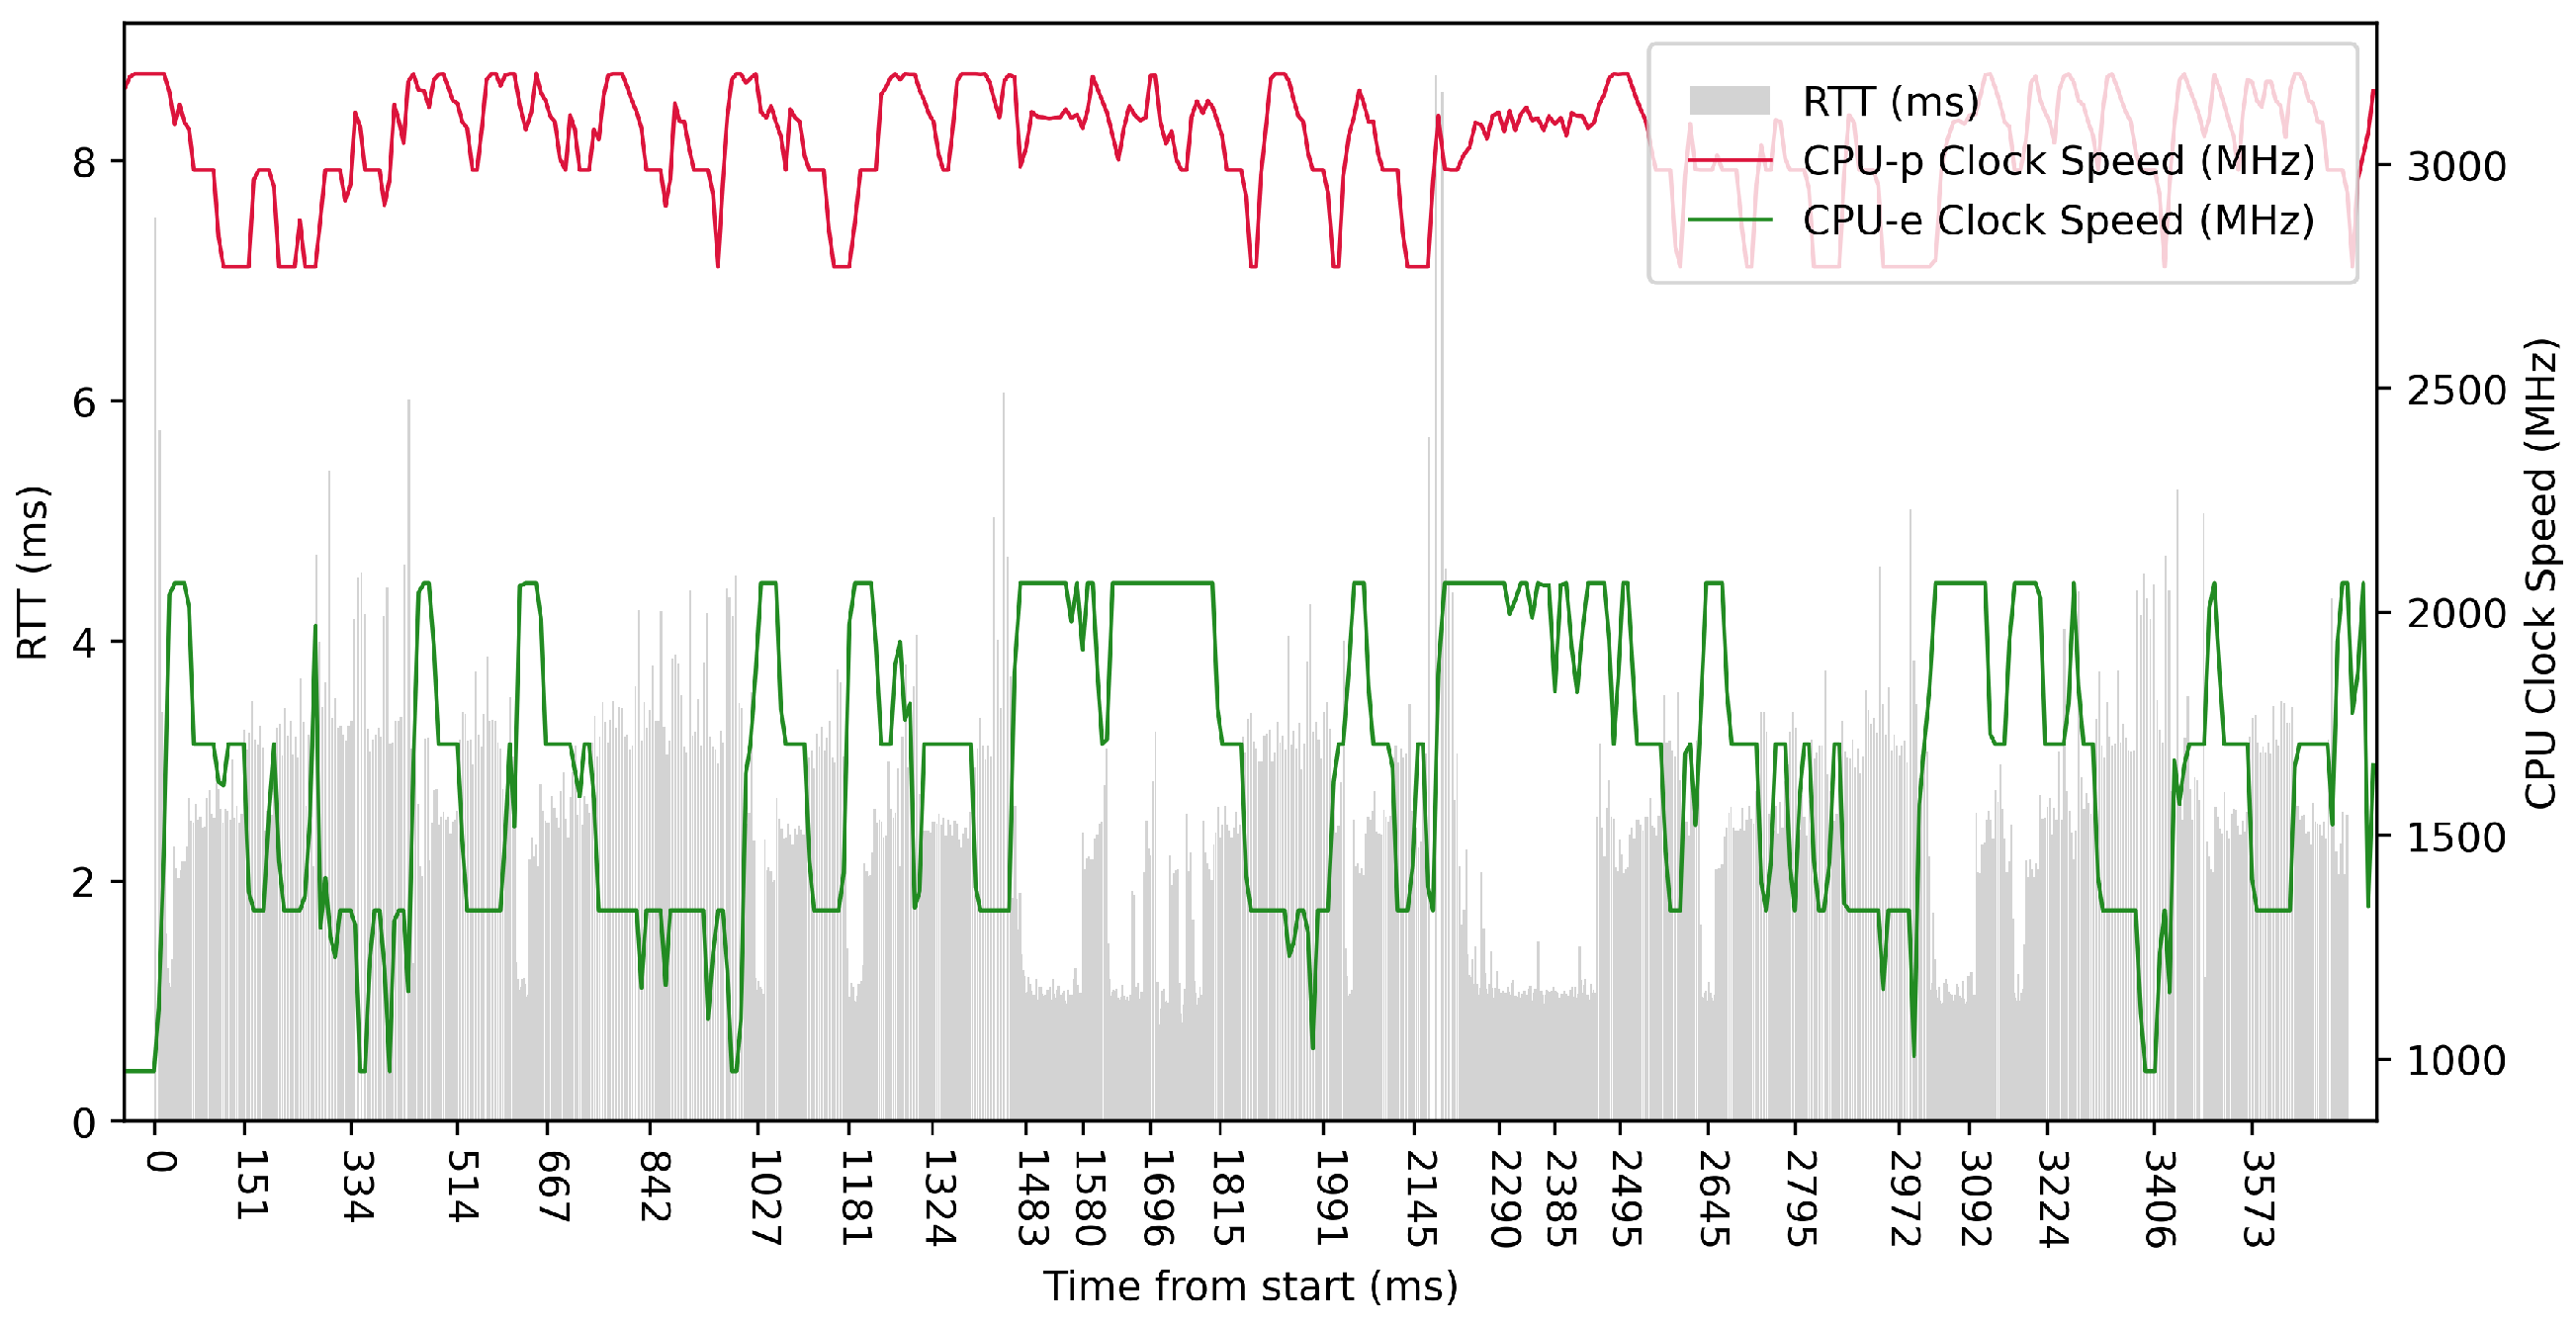
Test No. 8 consisted of 100 measurements of RTT with a delay of 1 ms between measurements. The median was 1.144 ms, and the mean was 1.852 ms, with a standard deviation of 1.617 ms, indicating a slight scatter in the measurements. The other data can be seen in
Table 3. In the plot in
Figure 12, we can see a significant decrease in RTT values at the maximum clock frequency of the efficient cores. The performance cores worked at high frequencies, regardless of the test. We observed a 3.548 ms lower median in test No. 8 compared to test No. 5, which could indicate a lower RTT metric.
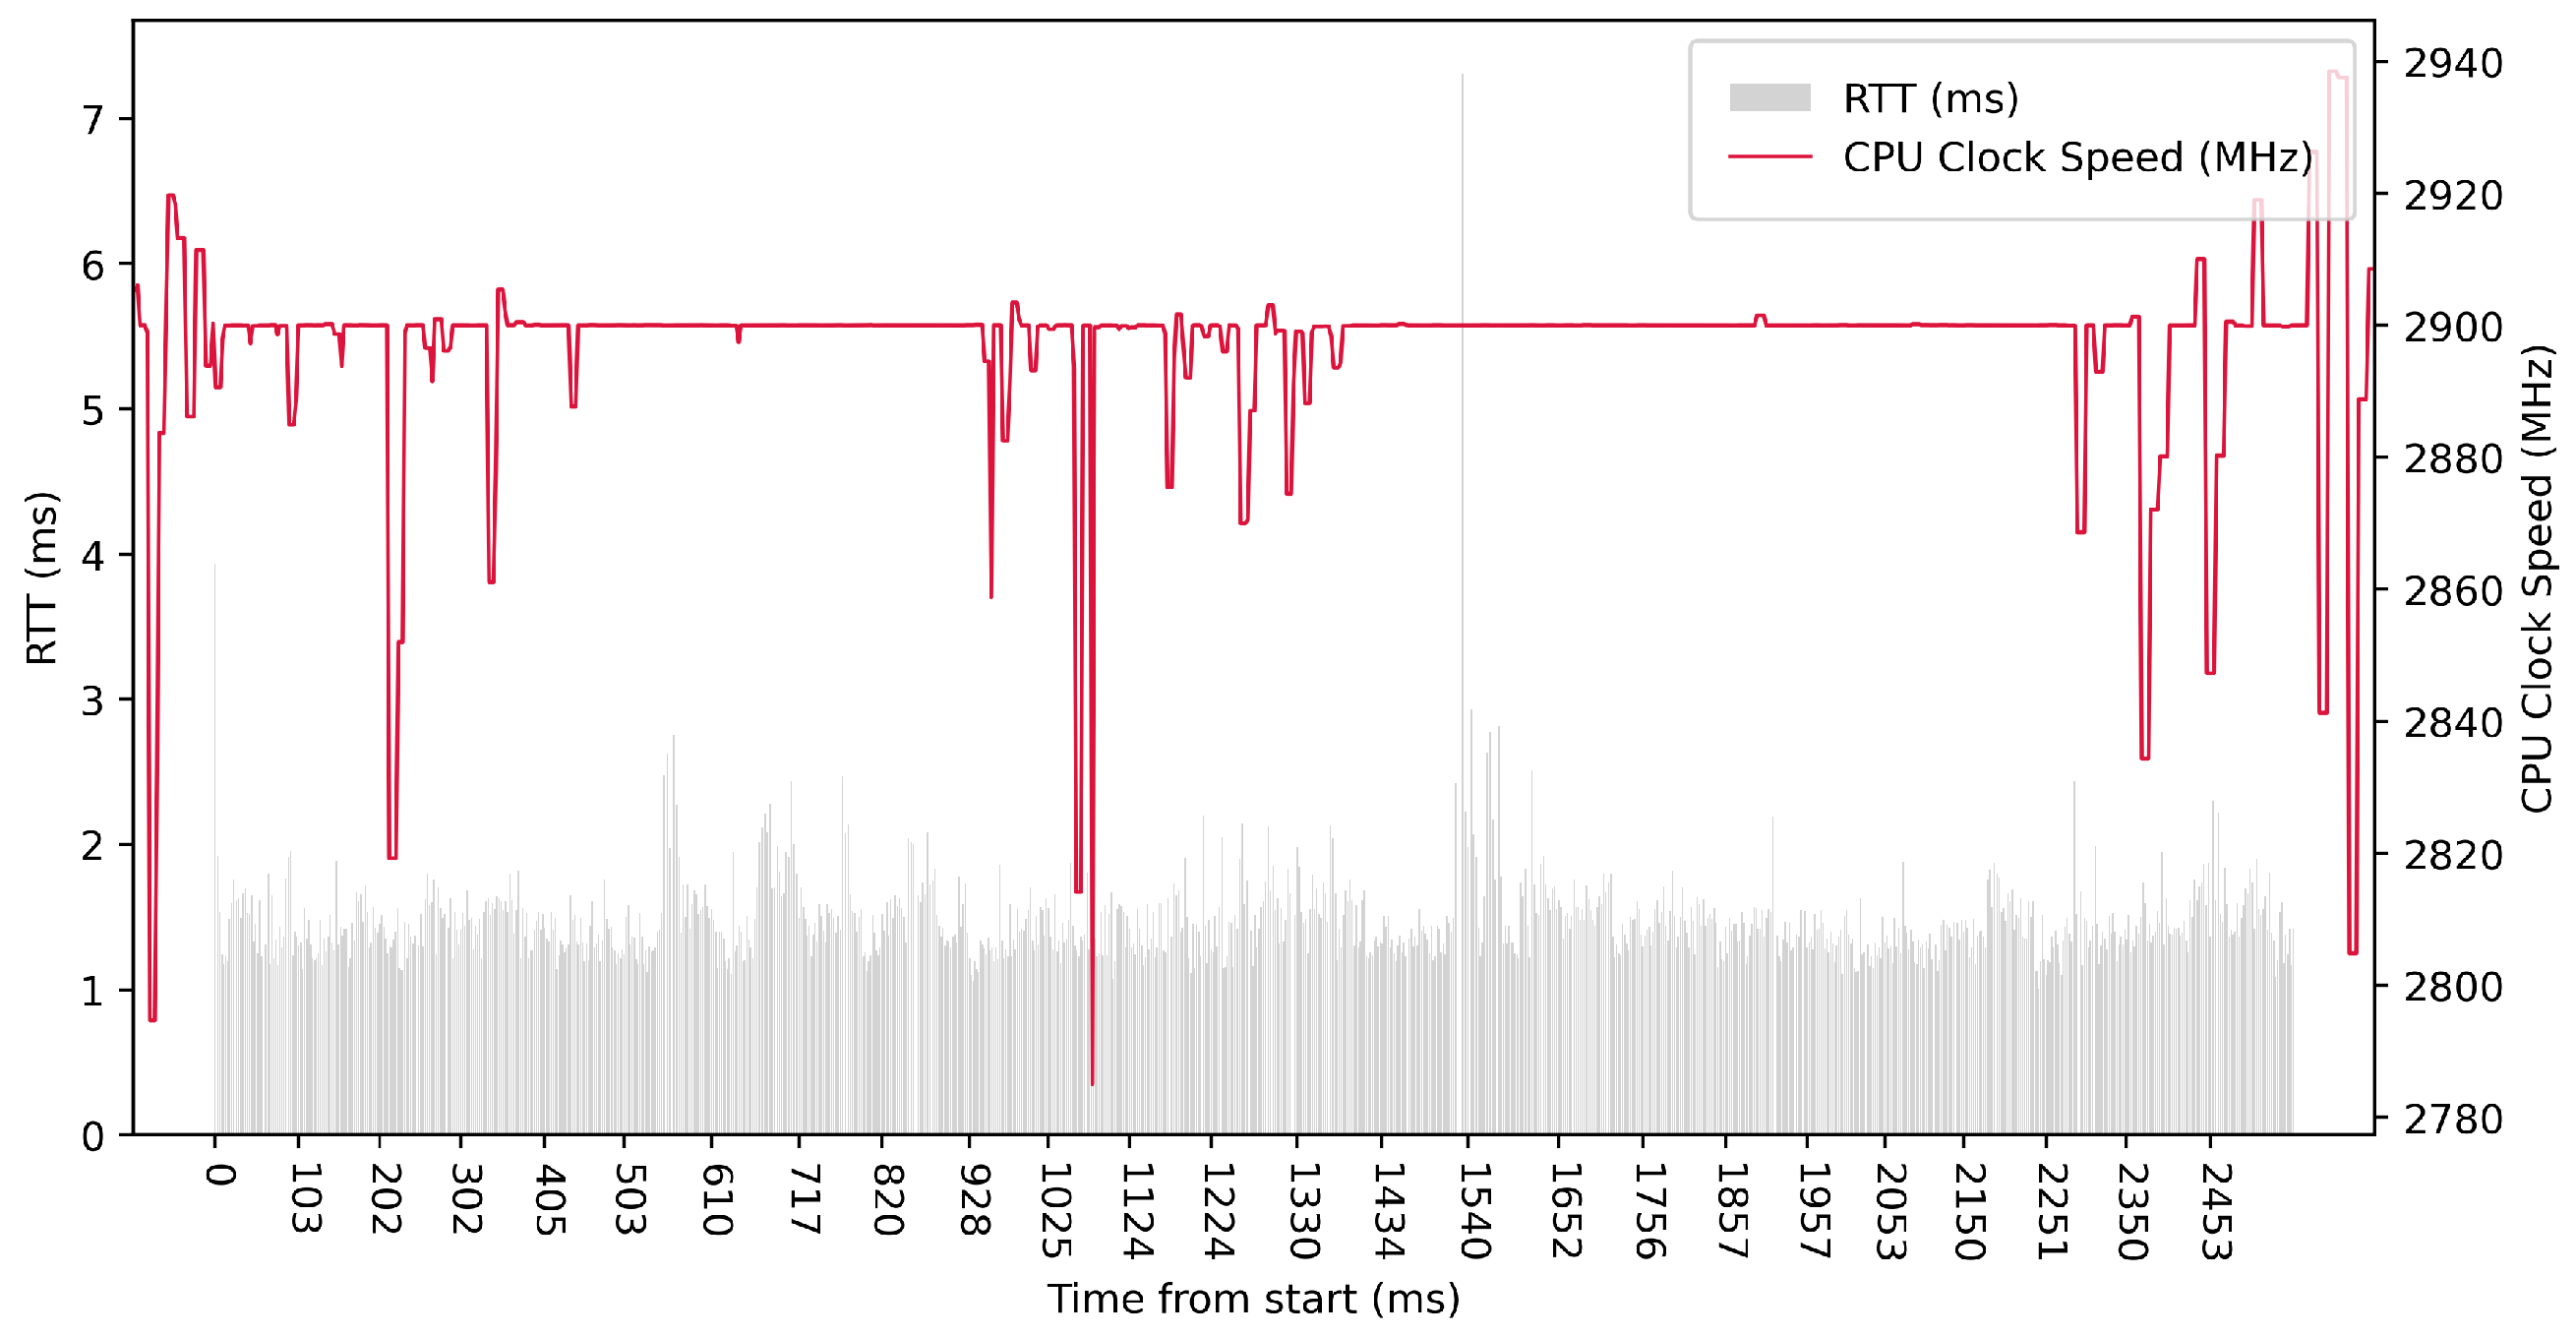
Test No. 9 consisted of 1000 measurements of RTT with a delay of 1 ms between measurements. The median was 2.504 ms, and the average was 2.428 ms, indicating that most measurements were close to the average. The standard deviation was 1.013 ms, indicating that the measurement values are slightly different from the average, and thus the distribution of measurements is slightly scattered. The plot in
Figure 13 shows the timescale improvement in RTT values during the maximum clock frequency of the efficient cores. The performance cores operated at high frequencies, regardless of the test. Compared to test No. 6, we observed a lower median in test No. 9 (difference of 2.057 ms). This may indicate lower RTT metric values. See
Table 3 for more details.
4.5. Tests on AMD64 with 100 ms Delay
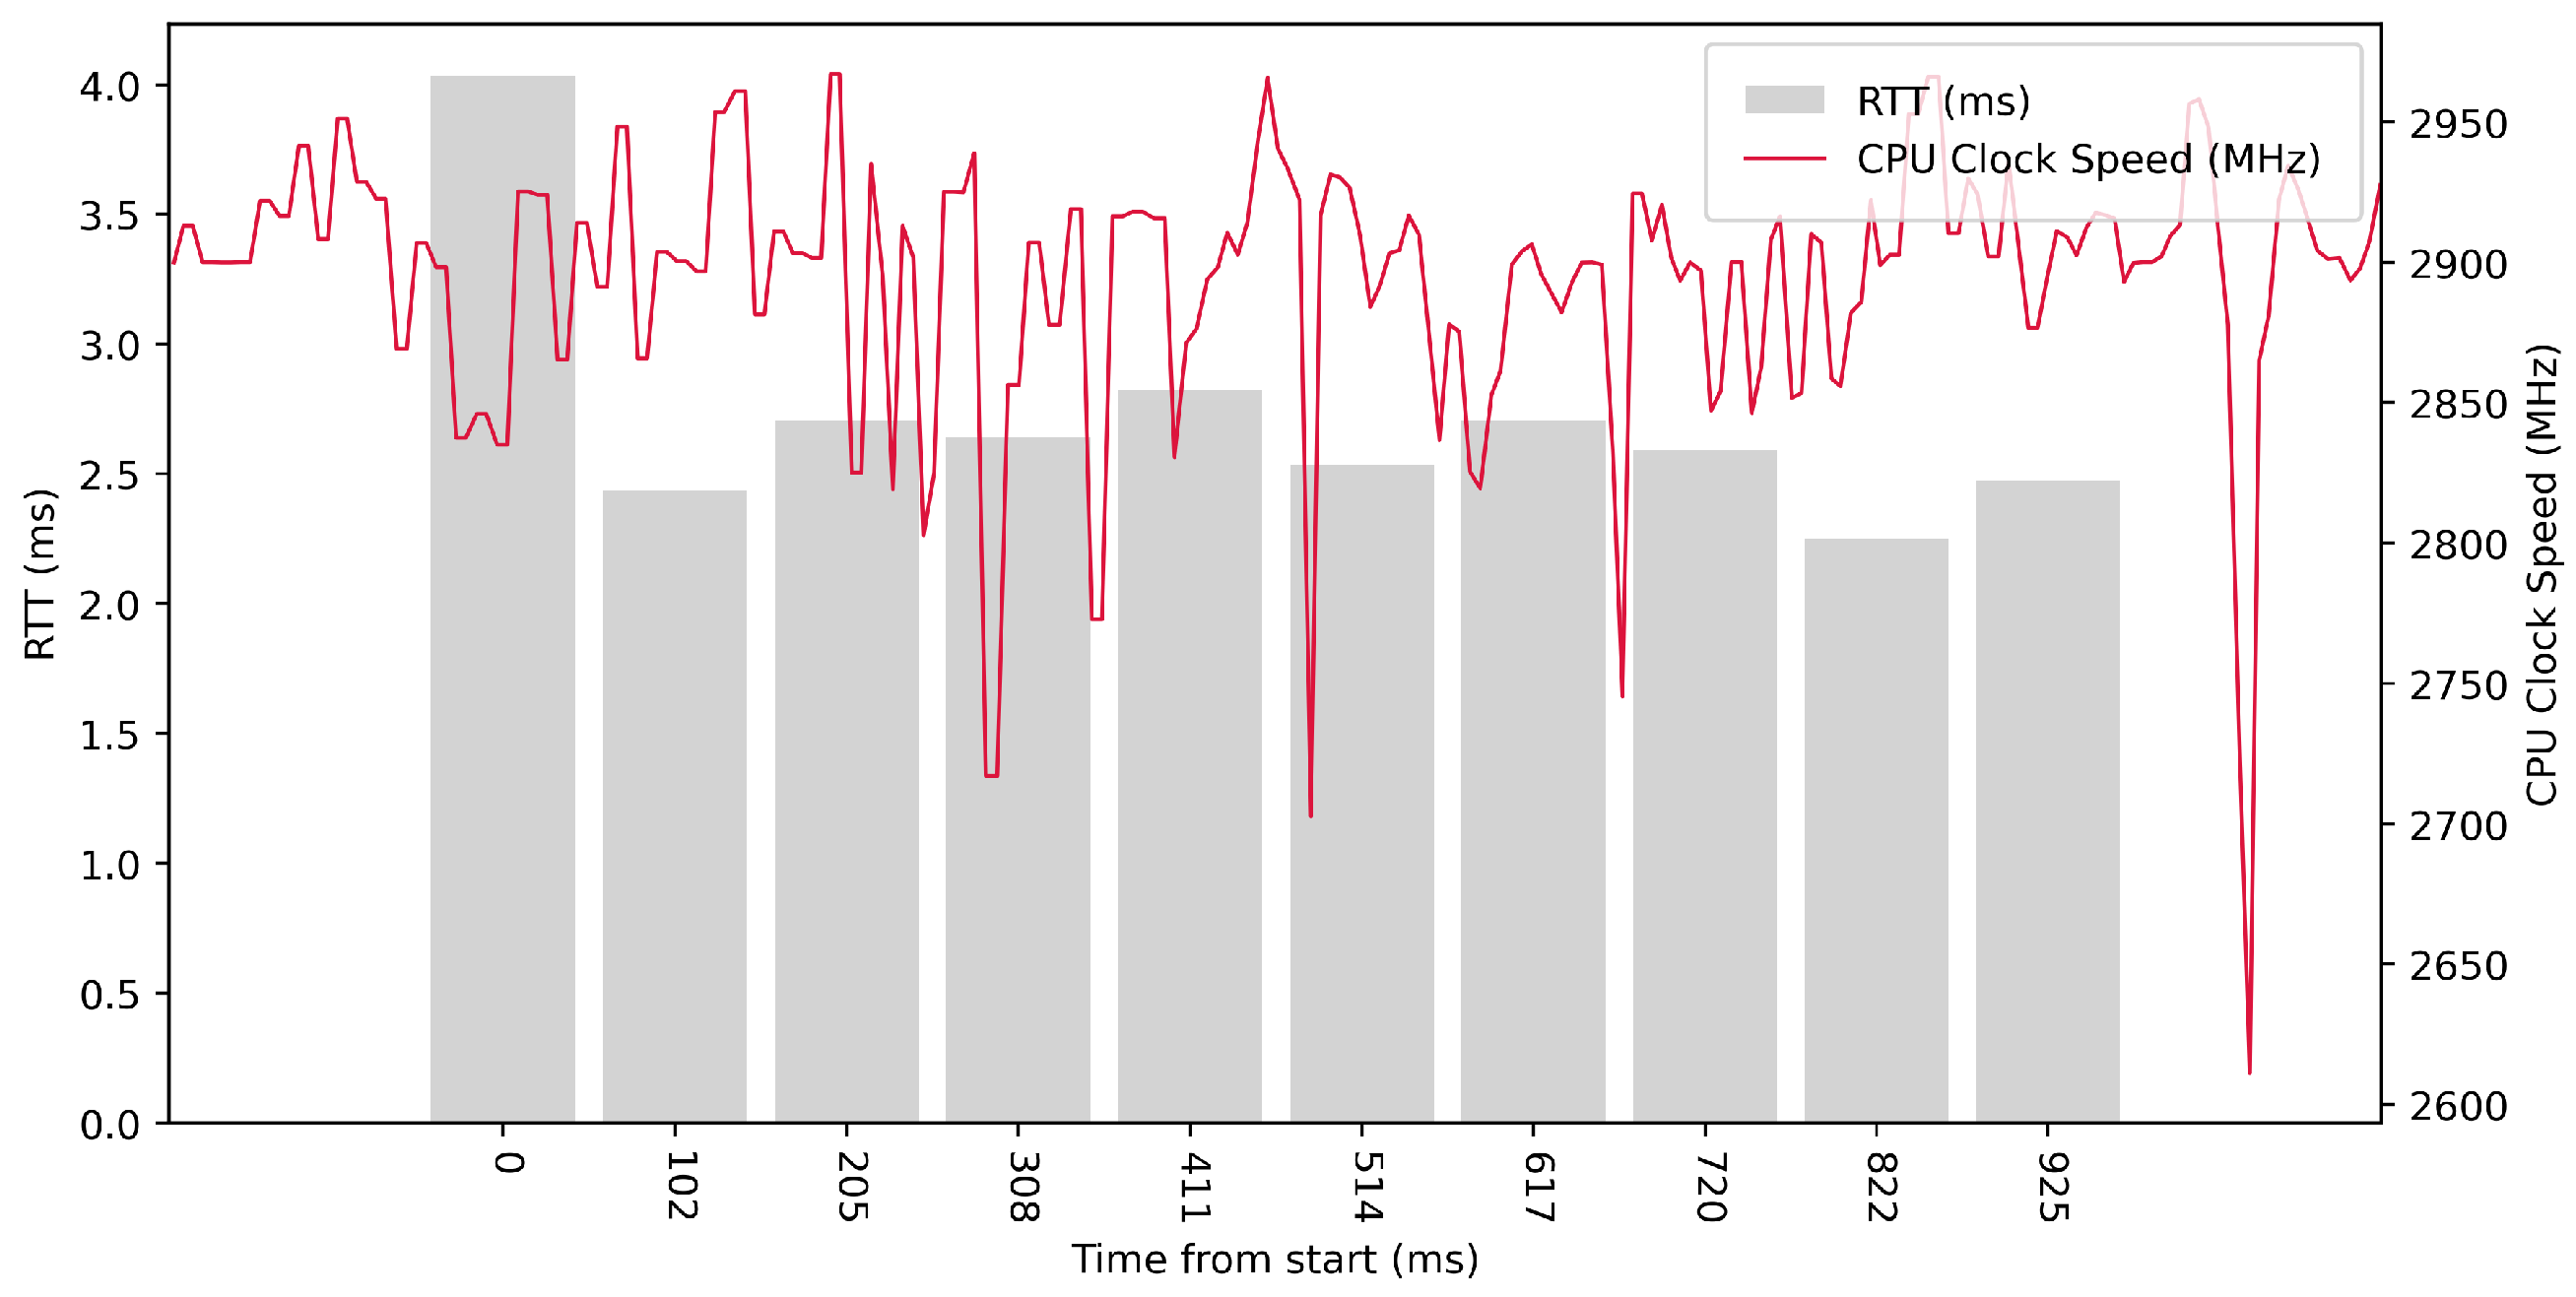
Test No. 1 consisted of 10 RTT measurements across ETL services with a delay of 100 ms between measurements. The median of the measurements was 2.616 ms, and the mean was 2.719 ms, indicating that the distribution of measurements was approximately symmetric. The standard deviation was 0.488 ms, indicating that most measurements were close to the average. Other data can be seen in
Table 3. From the graph in
Figure 14, it can be concluded that there was no significantly increased activity in the CPU cores during the test.
Test No. 2 consisted of 100 measurements of RTT across ETL services with a delay of 100 ms between measurements. The median of this set of measurements was 2.563 ms, and the mean was 2.571 ms, indicating that the distribution of measurements was approximately symmetric. The standard deviation was 0.239 ms, indicating that most measurements were close to the average. Other data can be seen in
Table 3. From the graph in
Figure 15, it can be concluded that there was an increase in the activity of the CPU cores during the test.
Test No. 3 consisted of 1000 measurements of RTT communication across ETL services with a delay of 100 ms between measurements. The median of this set of measurements was 2.529 ms, and the mean was 2.565 ms, indicating that the distribution of measurements was approximately symmetric. The standard deviation was 0.233 ms, indicating that most measurements were close to the average. Other data can be seen in
Table 3. Test No. 3 showed increased activity of the cores during the test. The graph in
Figure 16 shows that the clock speed of the cores increased at the beginning of the test.
4.6. Tests on AMD64 with 10 ms Delay
For the following tests, we decided to omit the plots as they were too similar to the plots in previous tests and therefore had little value.
Test No. 4 was performed with a delay of 10 ms between measurements and consisted of 10 measurements. The mean RTT was 2.162 ms, the median was 2.001 ms, and the standard deviation was 0.538 ms. Compared to test No. 1, where the delay was 100 ms, we can see that a lower delay between measurements resulted in lower RTTs. The other data can be seen in
Table 3.
Test No. 5 consisted of 100 measurements of RTT communication across ETL services with a delay of 10 ms between measurements. The median of this set of measurements was 2.092 ms, and the mean was 2.170 ms, indicating that the distribution of measurements was approximately symmetric. The standard deviation was 0.391 ms, indicating that most measurements were close to the average. Other data can be seen in
Table 3. Compared with the second test, we can see that a delay of 10 ms showed lower RTT values.
Test No. 6 consisted of 1000 measurements of RTT communication across ETL services with a delay of 10 ms between measurements. The median of this set of measurements was 1.955 ms, and the average was 1.991 ms, indicating that the distribution of measurements was approximately symmetric and most measurements were close to the average, as shown by the low standard deviation value of 0.231 ms. Other data can be seen in
Table 3. Test No. 6 showed better results than Test No. 3. At a delay of 10 ms, the median RTT value was slightly better (1.955 ms versus 2.529 ms).
4.7. Tests on AMD64 with 1 ms Delay
Test No. 7 consisted of 10 measurements of RTT across ETL services with a delay of 1 ms between measurements. The median of this set of measurements was 1.582 ms, and the mean was 1.798 ms, indicating that the distribution of measurements was approximately symmetric. The standard deviation was 0.660 ms. Other data can be seen in
Table 3. From the graph in
Figure 17, it can be concluded that the activity of the CPU cores increased during the test. Test No. 7, with a delay of 1 ms, had a median RTT of 1.582 ms, while Test No. 4, with a delay of 10 ms, had a median RTT of 2.001 ms. This means that decreasing the interval between sending data also decreased RTT values.
Test No. 8 consisted of 100 measurements of RTT across ETL services with a delay of 1 ms between measurements. The median of this set of measurements was 1.395 ms, and the mean was 1.444 ms, indicating that the distribution of measurements was approximately symmetric. The standard deviation was 0.244 ms, indicating that most measurements were close to the average. The results of this test are similar to test No. 7, with a delay of 1 ms, which was conducted with fewer measurements. The other data can be seen in
Table 3. The graph in
Figure 18 shows a significant increase in the clock speed of the processor cores during the test. Comparing with test No. 5, we can see that a lower median RTT of 1.395 ms was achieved in test No. 8 compared to 2.092 ms in test No. 5.
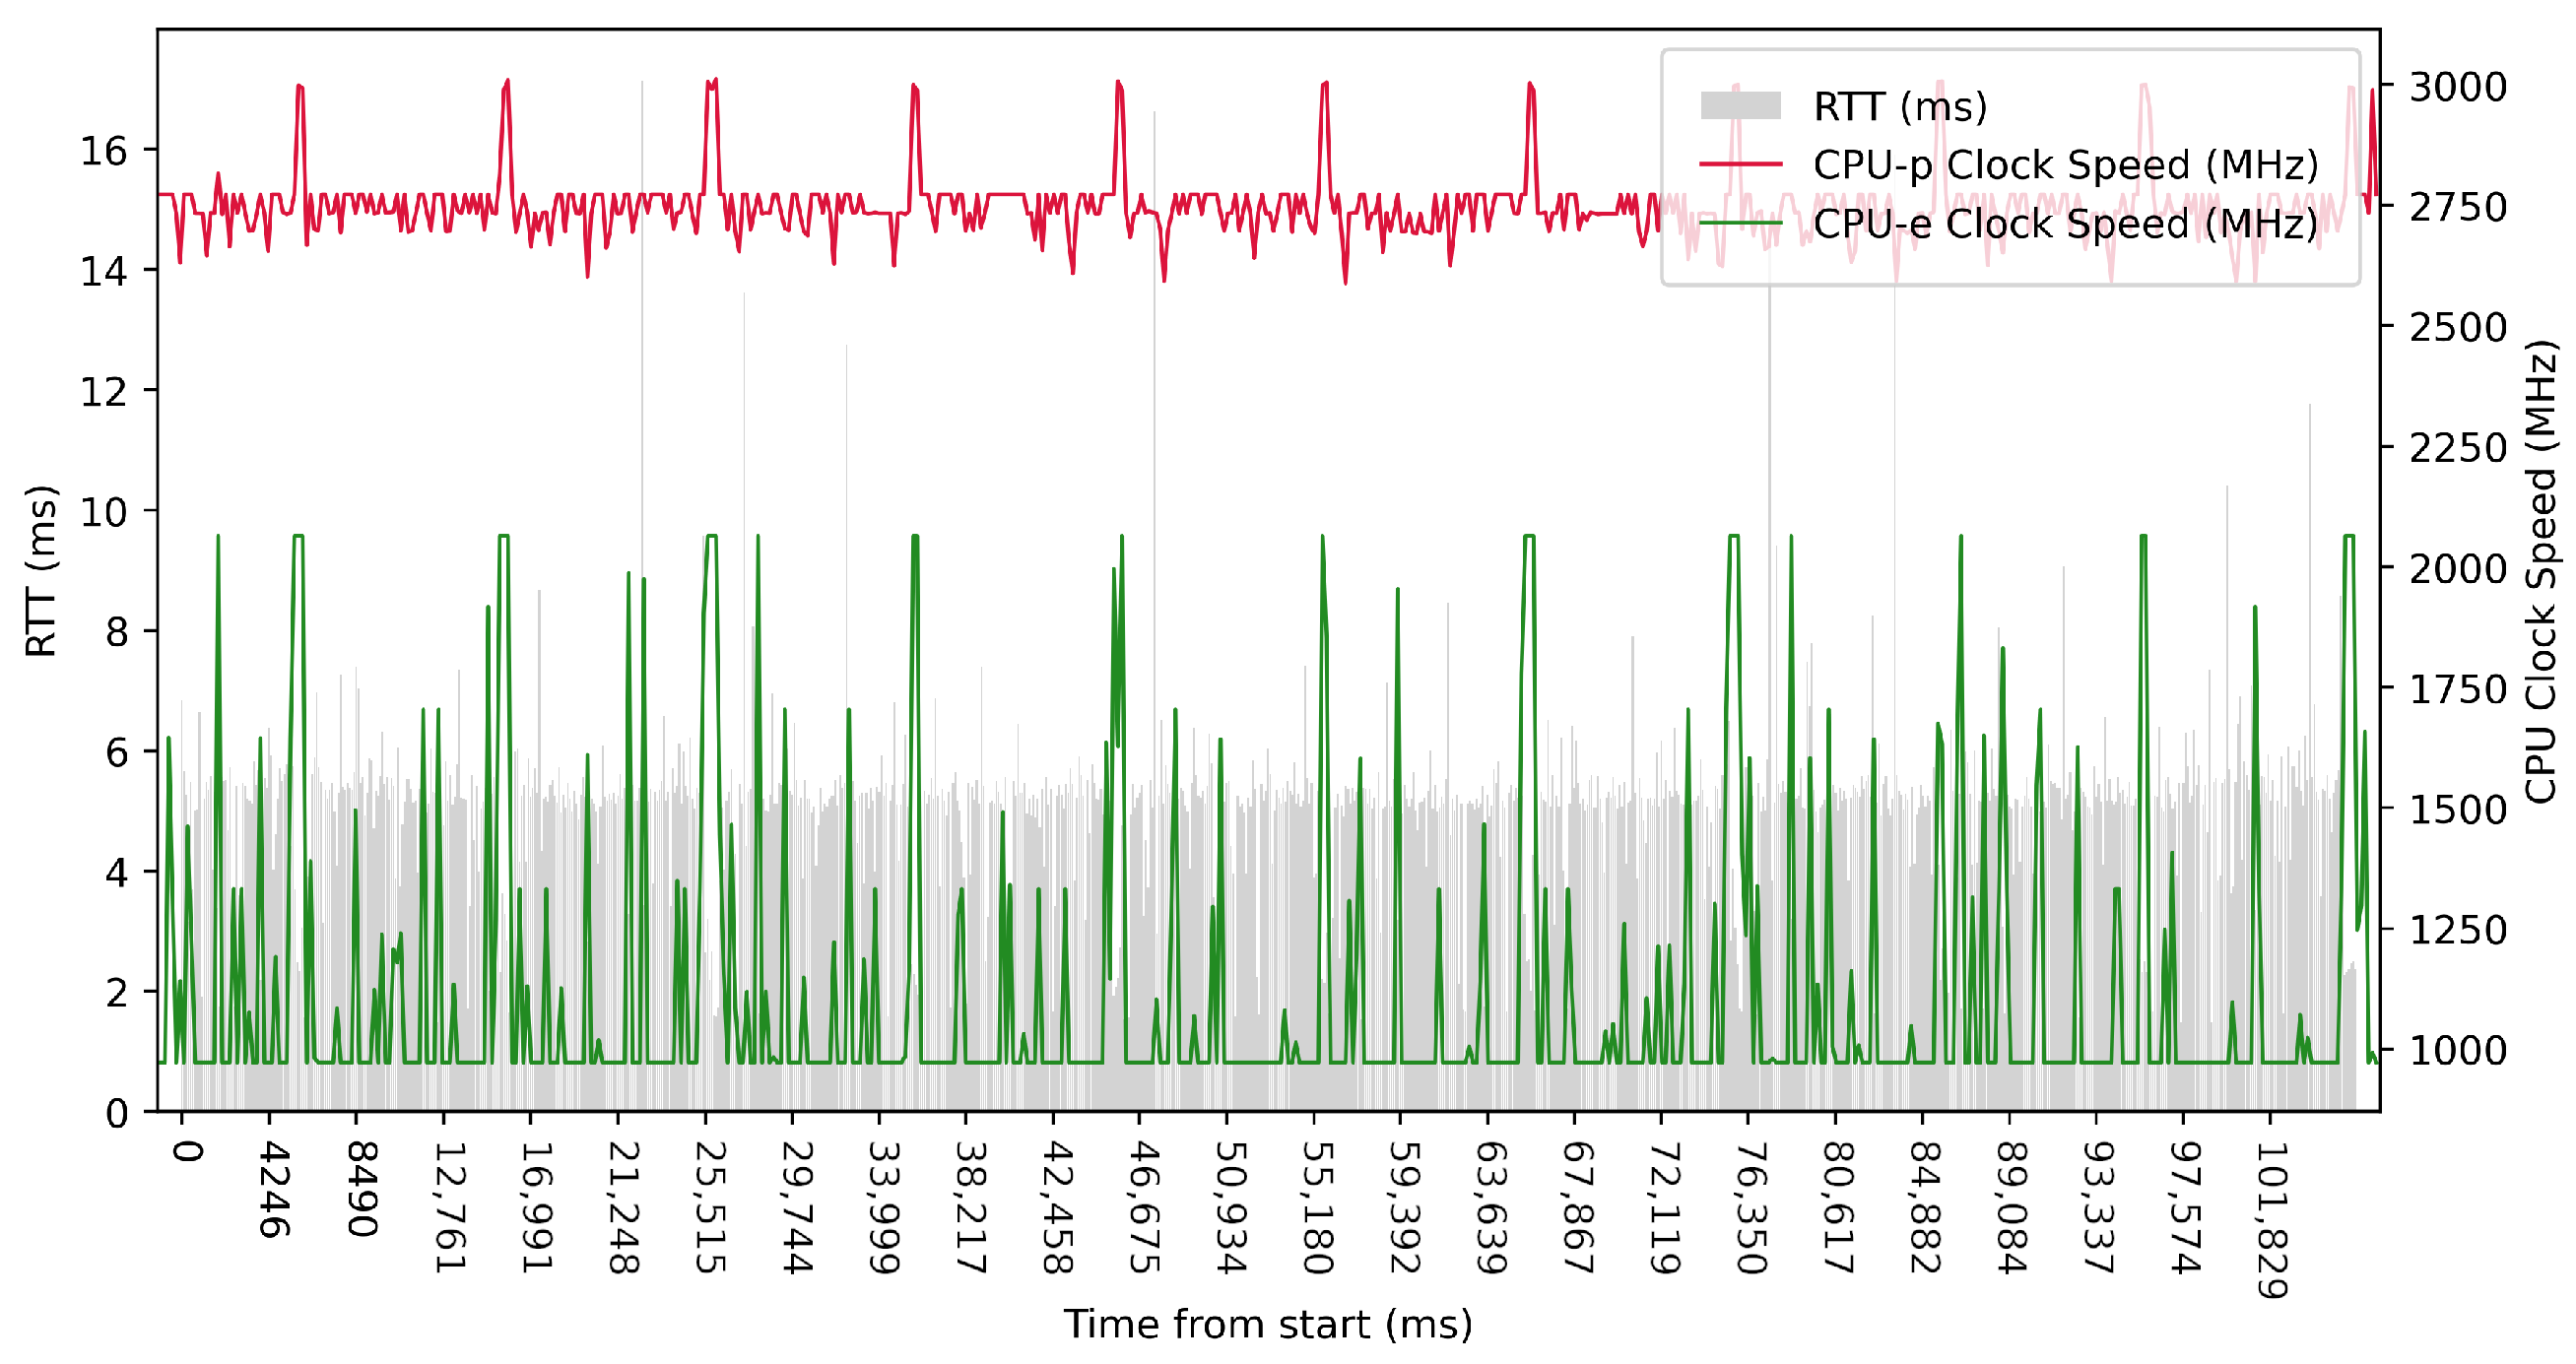
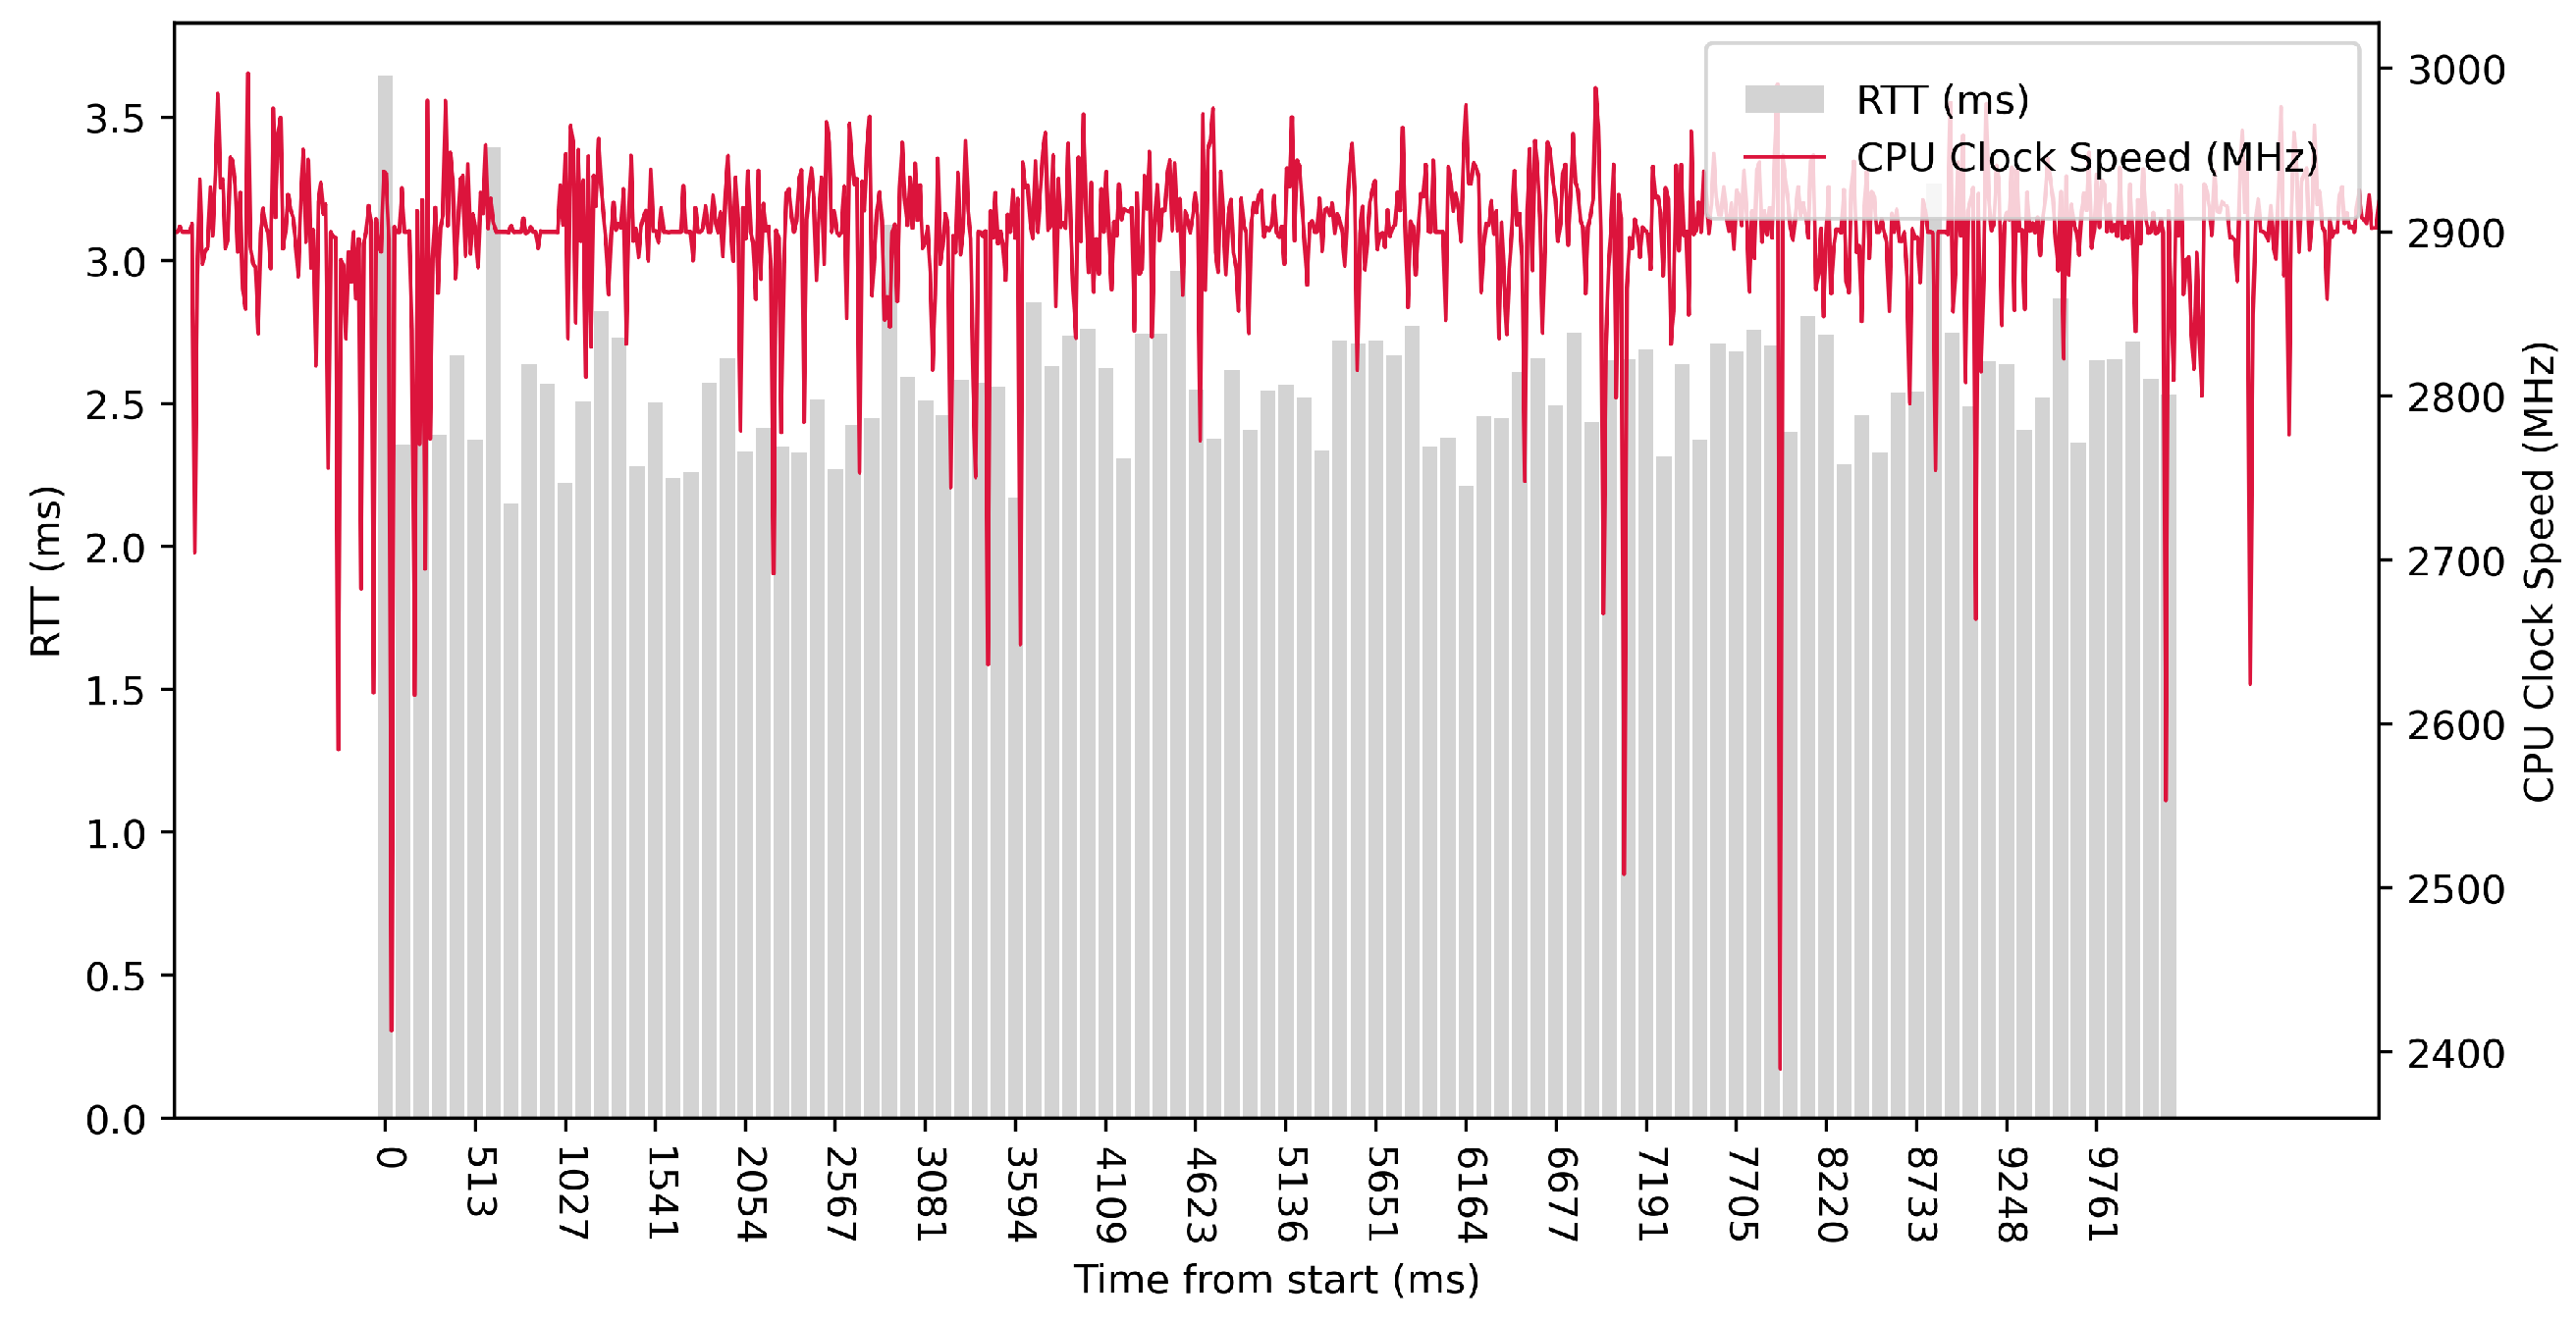
Test No. 9 consisted of 1000 measurements of RTT communication across ETL services with a delay of 1 ms between measurements. The median of this set of measurements was 1.425 ms, and the mean was 1.475 ms, indicating that the distribution of measurements was approximately symmetric. The standard deviation was 0.317 ms, indicating that most measurements were close to the average. Other data can be seen in
Table 3. Compared with previous tests, it can be seen that a short delay resulted in the lowest average value of RTT. Comparing tests No. 6 and No. 9, we can observe lower mean and median values in test No. 9. However, in test No. 9, the maximum value of RTT is significantly higher. In the graph in
Figure 19, we can see an increase in the clock speed of the CPU cores during the test, which was fairly stable throughout the test.
5. Discussion
Our test results provide valuable insight into the performance and efficiency of ETL services across different hardware platforms and configurations. Using a simulated IoT device as a test container allowed us to focus on data processing speeds and communication between ETL services while maintaining control over transmission speed and other test parameters. In addition, the decision to test the framework on ARM64 and x86 64-bit processors allowed us to explore the performance and compatibility of our framework across different modern hardware architectures.
The results show that the proposed framework performs well under varying conditions, with the RTT metric remaining within acceptable limits throughout the tests. The tests also show that the framework can handle a range of data transfer speeds and measurement volumes, demonstrating its potential for scalability and adaptability to different IoT deployment scenarios.
However, it is important to note that, while the test environment is comprehensive, it does not cover all possible scenarios. Further testing with real IoT devices and different network conditions may reveal additional challenges and potential optimizations for the ETL services.
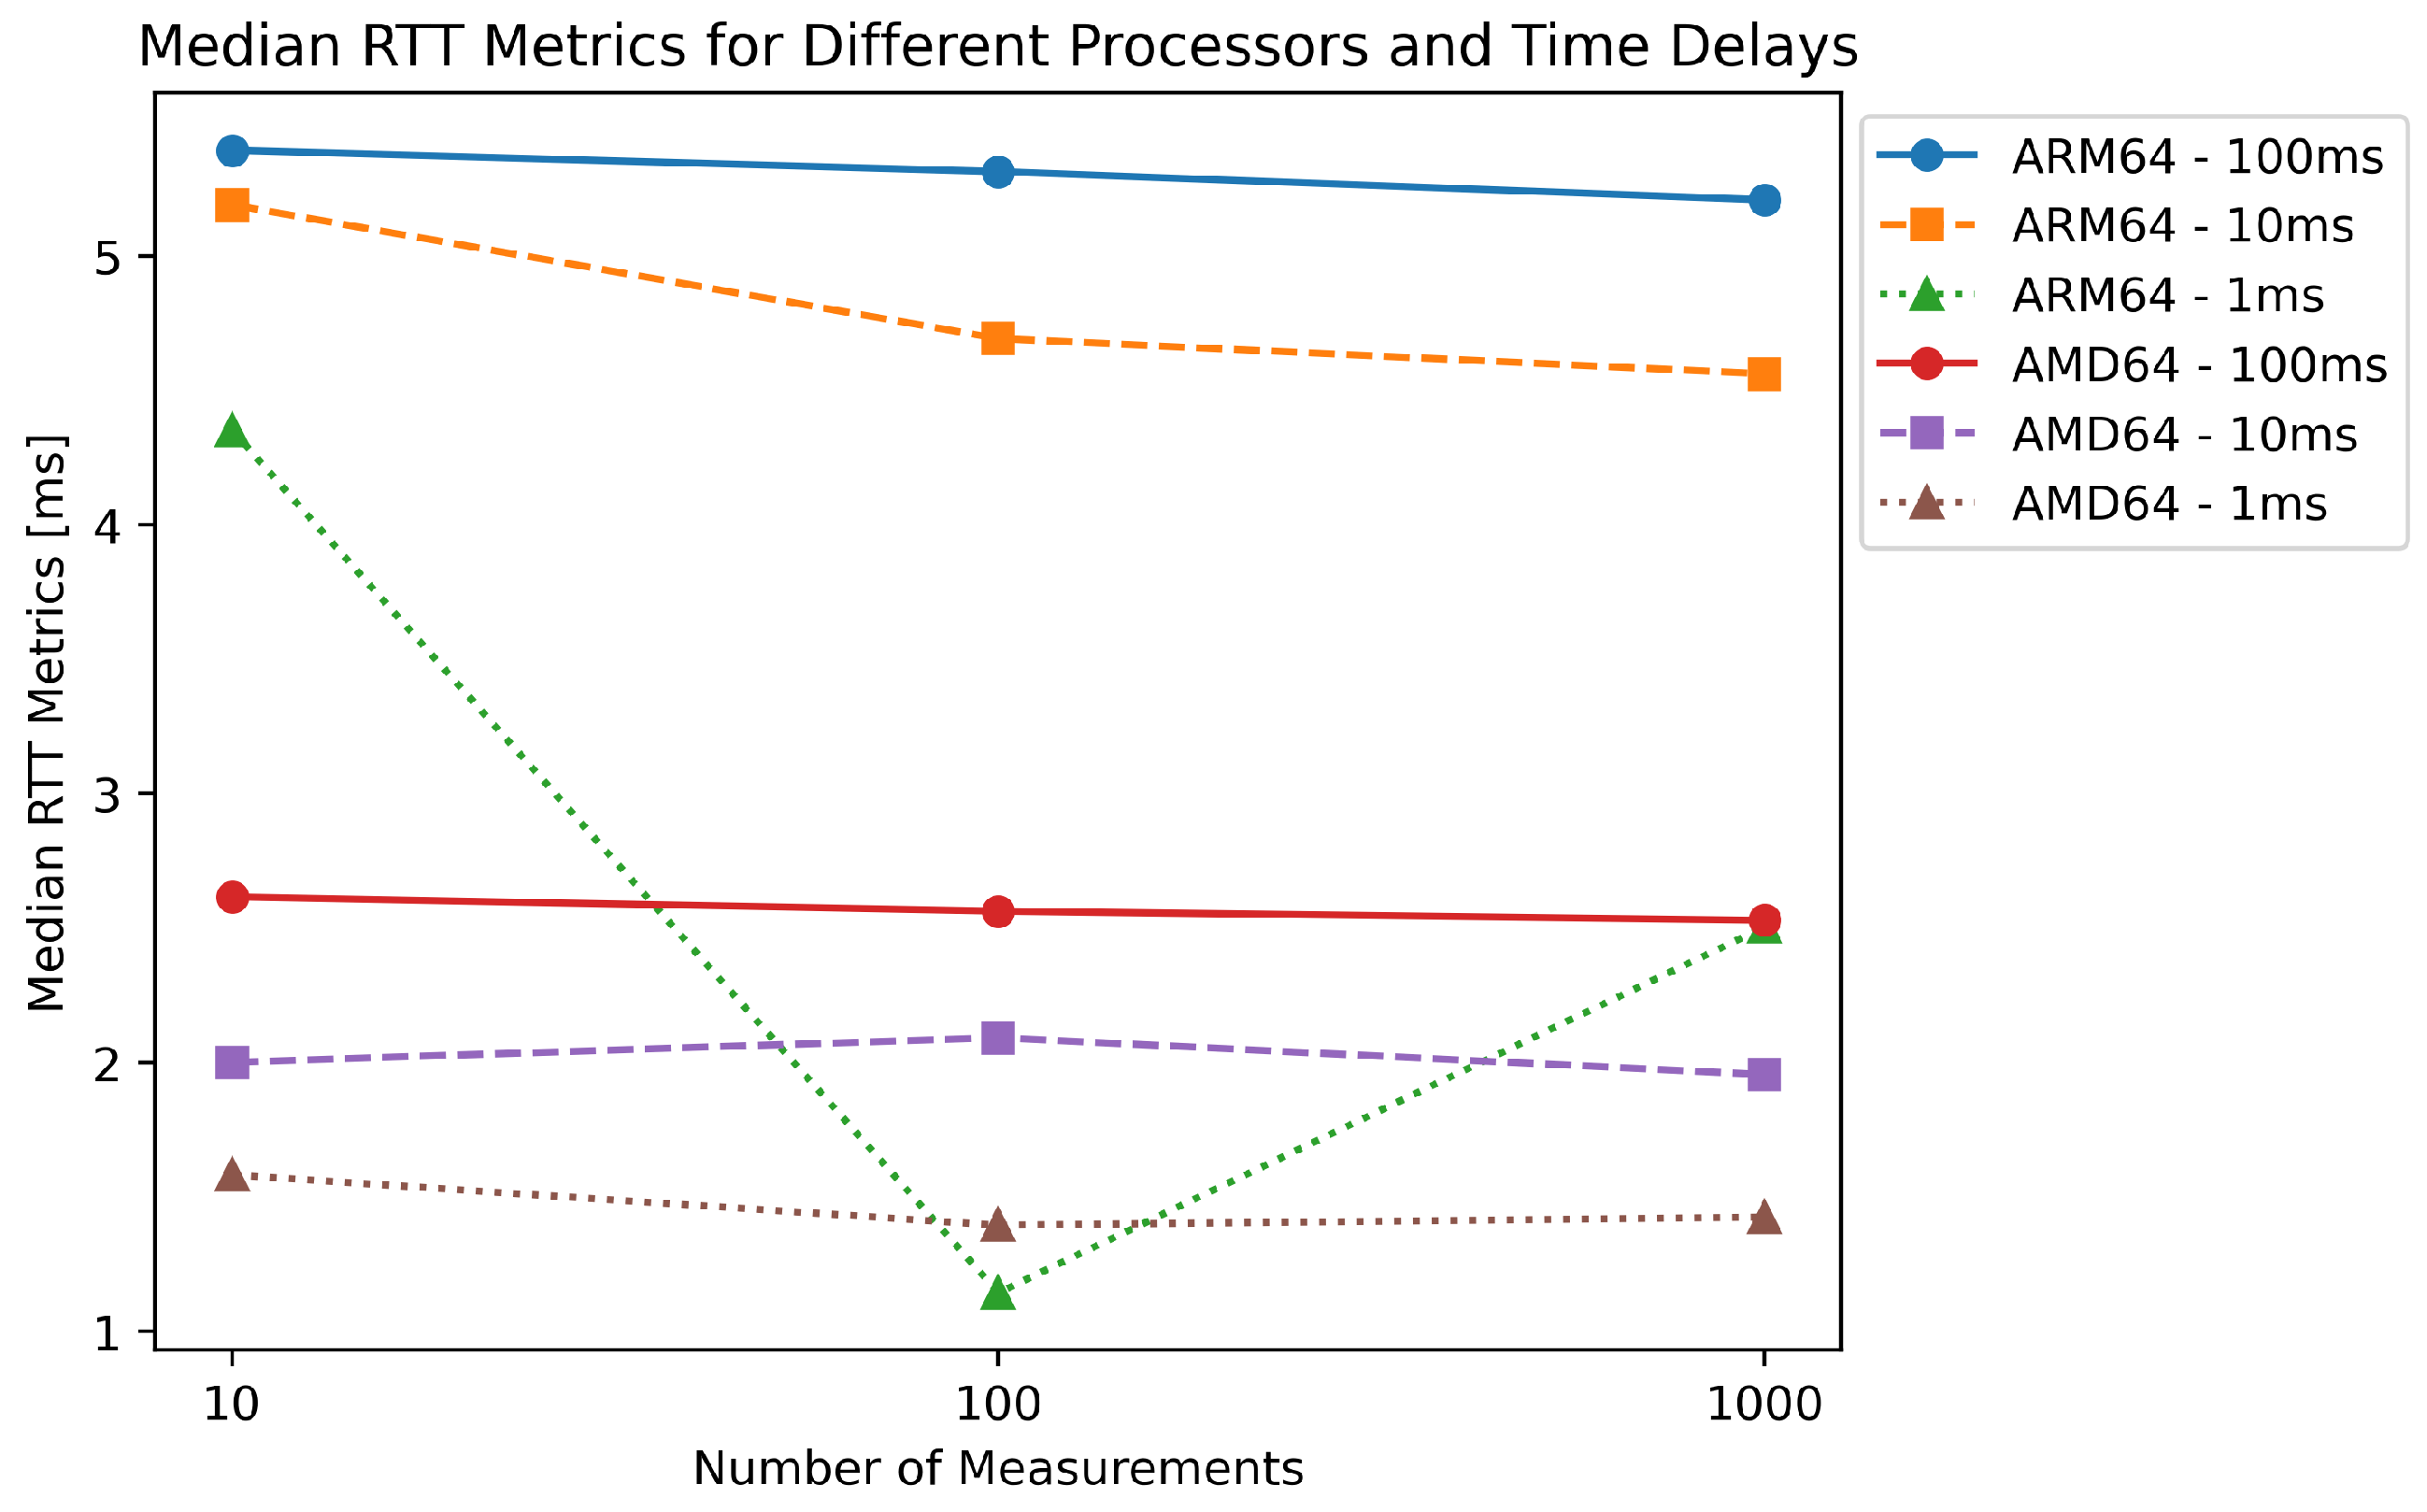
Figure 20 shows a significant difference in performance between the ARM64 and AMD64 processors in our evaluation of the RTT metrics. As the number of measurements increases, the ARM64 processor shows a greater decrease in median RTT than the AMD64 processor. This could be due to the differences in the architecture of the two processors. On the other hand, the AMD64 processor shows consistently low latency across all test scenarios, highlighting its suitability for real-time computing applications that require minimal latency. In addition, the data show that as the time delay between measurements decreases, the median RTT values for both processors tend to decrease, suggesting improved performance with more frequent requests. Overall, these results provide valuable insight into the performance of the two processors in real-time computing applications and can help select the appropriate hardware for specific use cases.
The last test on both architectures shows that even when reaching the highest CPU frequencies, the processing is not fast enough to process the data before new data are acquired. This is shown in the results, where the mean and the median increased. The processing queue will keep lengthening, and the processing times will increase.
The proposed framework shows promising performance and efficiency in processing and communication between ETL services. Further research and testing with real-world IoT devices, networks, and analytical services are required to better understand the framework’s potential for use in different IoT scenarios.
The testing was performed on both ARM64 and AMD64 CPUs, as SBCs do not use a unified CPU architecture, and we wanted to ensure that our framework was viable for both architectures. Further testing is required to check if the differences between architectures transfer to smaller devices.
Several research challenges still need to be addressed. The many devices used in edge environments make task offloading and load balancing difficult. For latency-sensitive tasks, the task offloading mechanism has to consider the distance to available nodes, their current load, and their potential performance. Load balancing is also a more complex task as the devices’ performance can vary greatly. Compatibility also needs to be considered, as the devices may not be capable of completing all the required tasks, and the system, therefore, has to consider the capabilities of other nodes [
46].
Another research challenge arises in mobile edge computing, where the edge devices or the users connected to them move. The solution must predict the movement and ensure that the services are deployed to the devices when needed. The services also need to be deployed quickly. An example of this might be a shopping center with an unevenly spread-out crowd. As a large group of users moves, the solutions must scale the services up. It also needs to scale the services down when no longer needed, leaving room for other services to be deployed [
47].
The security in edge computing also needs to be addressed, as the devices themselves may not support the security tools available for other devices. The variety of devices requires a particular approach to ensuring that all the devices are protected. Even a single vulnerable device endangers the whole network. The devices are also more prone to physical attacks where the attacker gains physical access to the devices. The data need to be protected on their entire journey from the sensor to the cloud, and they can be potentially intercepted at any step [
48].
6. Conclusions
Edge computing is a fast-growing field hindered by a lack of standardization. The variety in edge devices collecting and generating the data proves to be an obstacle.
This article focused on creating a modular framework that allows developers to modify and create data processing tasks on the edge. We first looked at the tools that can help develop and deploy edge computing solutions like Docker, Kubernetes, and Terraform. We then described the parts of our data processing pipeline and the architecture of our framework that brought the pipeline together. Using containerization technology, the tasks can be easily deployed, scaled, and monitored using an orchestrator. The pipeline approach we have selected allows us to have better control over the processing performed. It also allows us to reuse existing parts in new pipelines, leading to shorter development times. We consider the following to be the main strengths of our framework: compatibility—using Docker, we can deploy our framework to a wide array of SBCs, Mini-PCs, or servers; modularity—new data processing tasks can be easily added to the processing pipeline; agnosticism—our framework is not tied to any programming language. Parts of the pipeline can use different languages or versions of the same language. We have also created a unified testing platform that can be used to evaluate and compare the performance of edge devices.
In our testing, we focused on the RTT metric in our pipeline. This was tested on both the ARM64 and AMD64 platforms, and both were compatible. We have found that increasing the frequency of sending data leads to decreased processing time. The testing was performed using a synthetic sensor capable of simulating different sensors and generating synthetic data. This tool will be expanded to include different scenarios and serve as a standardized tool for criteria evaluation.
In the future, we plan on extending the framework with a graphical user interface (GUI) similar to Apache Airflow. This approach will provide an easy way to modify the data processing pipeline and allow even non-programmers to use the framework in their solutions. We also plan on creating more modules that will be included with our framework and can be directly used or modified. These modules will include additional data analytics, anomaly detection, and machine learning methods. Including advanced monitoring tools, such as Grafana, is also planned. The user will have better and more user-friendly access to their data with tables and graphs. The extension of the framework to include cloud nodes is also in our scope, as we have previously mentioned that edge computing and cloud computing are not competing technologies but rather complement each other.
