Abstract
Distributed acoustic sensing (DAS) is a promising technology for seismic data acquisition, particularly in downhole applications. However, downhole DAS measurements can be affected by the deployment method of the fibre-optic cable. These effects were explored in a field trial in two wells (one vertical and one deviated) drilled at the Otway International Test Centre. The trial in the vertical well shows that (1) fibre-optic cables cemented behind the casing provide data of the highest quality due to the best coupling to the formation, and (2) tubing-conveyed cable shows only slightly weaker coupling, but the data quality can be severely degraded by source-generated noise. A cable loosely suspended in the deviated well provided data quality comparable to that of the cemented DAS cable. To better understand the nature of the observed effects, the field experiments were supplemented by numerical modelling with a 1.5D full wave reflectivity algorithm (3D wave propagation in a 1D model), where cement, casing and wellbore were represented by infinite vertical layers. The results show that (1) a cement layer has only a slight effect (<5%) on the DAS amplitude; (2) the vertical strain in a liquid-filled borehole is comparable to that in the formation; and (3) the strain amplitude in the cable is of the same order of magnitude both in the formation and in the fluid. The strain in the cable is zero both when the cable’s Poisson’s ratio is zero and when the borehole fluid is air. The results confirm the feasibility of borehole DAS measurements with fibre-optic cables suspended in a borehole liquid (but not gas!).
1. Introduction
Distributed acoustic sensors (DAS) are a new type of seismic receiver that measures temporal variations of strain along an optical fibre [1]. DAS is a fibre-optics sensing technique that creates virtual distributed sensors using optical time-domain reflectometry to detect small changes in the elongation of the fibre [2]. DAS has a broad frequency range from 1 mHz to hundreds of Hz [3,4] and has been employed to record signals from local, regional and distant earthquakes [5]; ambient seismic noise; and borehole-related vibrational signals [6,7]. DAS has been particularly successful in borehole seismic applications (such as vertical seismic profiling or VSP) due to its ability to record seismic wavefields along an entire length of the wellbore [8,9,10,11]. Recent studies show that downhole DAS can have sensitivity and resolution comparable to or superior to downhole geophones [10].
Since DAS measures dynamic strain variations along an optical fibre, these measurements can be affected by the medium in which the fibre is located [12] and the method of its installation [13]. In particular, recent studies show that seismic strain amplitudes recorded by DAS can be used to estimate the elastic properties of the formation: the stiffer the formation, the smaller the strain [12,14]. However, the borehole DAS response, and especially strain amplitudes, can also be affected by the borehole environment [13]. Indeed, the DAS fibre or cable is not located in the formation but can be temporarily deployed as a wireline [15], slick line or any other retrievable cable with metallic or non-metallic armour during a well intervention operation or be placed in the well on a more permanent basis. In the latter case, it can either be cemented behind the casing [10], strapped to the production tubing [11] or even cemented inside the casing string during well abandonment operations [16].
The overall sensitivity and transfer function of the DAS system depends on the fibre and cable properties, deployment method, optical scheme and acquisition parameters. The performance of different optical fibres was addressed in [10,17]. Several studies evaluated different cables, especially in near-surface environments, both experimentally and theoretically [18,19,20,21]. Wuestefeld and Wilks [22] investigated theoretical aspects of the acquisition geometry for downhole data using straight and helically wound cables. Downhole experiments using different cable designs were presented by Correa [20] and Sidenko et al. [23], with the measurements conducted using different cables suspended in the well. Bellefleur et al. [24] compared the performance of straight and helically wound cables cemented in two shallow wells.
Each deployment method has its own effect on the DAS response through both the differences in the coupling of the sensor and the formation and the presence of a specific noise pattern. Several field studies were conducted to understand these factors. Most of those studies focus on wireline deployment [25,26], while the comparison of several different deployment methods in the same well is rare as it requires several cables deployed in the same well [27].
2. Field Experiment
2.1. The Otway Multiwell Monitoring Array
An array of wells instrumented with fibre-optic cables was built at the Otway International Test Centre (OITC) in the Australian state of Victoria. OITC is a dedicated facility established to conduct field trials of geological carbon storage (GCS) through test injections of carbon dioxide into geological formations and monitoring injected fluids from the surface and boreholes [28,29]. The Stage 3 Otway Project at OITC is focused on the downhole monitoring of a small-scale (15,000 t) CO2 injection [30]. The monitoring is performed using an array of several 1.5–1.7 km deep wells drilled within an area of approximately 1 km2 [31]. The wells have a combination of several fibre-optic cables deployed using different approaches and, in some cases, have several cables deployed differently in the same well (Figure 1):
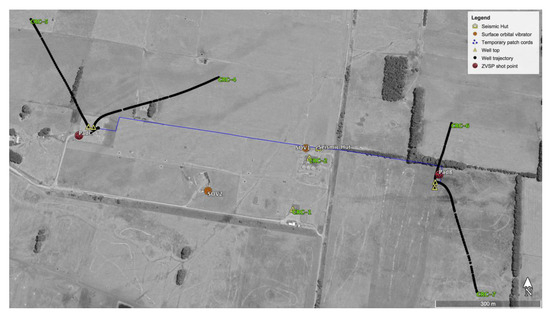
Figure 1.
Location scheme. Points marked as PadB, PadC and direct vicinity of SOV1 were used for vibroseis data acquisition.
- CRC-1 is a vertical well originally drilled for the Stage 1 Otway Project [28]. This well has no permanently deployed fibre optics but can be used to run wireline tools. CRC-2 is another vertical well; it is equipped with a fibre-optic cable with single-mode (SM) and multimode (MM) fibres deployed on production tubing;
- CRC-3 is a vertical well drilled to be the CO2 injector for the Stage 3 project. It has two fibre-optic cables cemented behind the casing, one cable having SM and MM fibres while the other also has an engineered single-mode fibre with enhanced backscattering, so-called Constellation Fibre (CF) [10]. One cable is deployed to the total depth while the other is terminated above the perforation interval as a contingency in case of accidental damage to the first cable during the perforation. In 2019, CRC-3 was perforated and completed with an extra fibre-optic cable deployed on production tubing carrying a combination of SM, MM and CF fibres;
- The CRC-4, 5, 6 and 7 wells are deviated monitoring wells with a maximum inclination of 20 to 25 degrees. Similar to CRC-3, each of these wells has two cables cemented behind the casing. However, in these monitoring wells, each cable pair has enhanced backscattering fibres from several different manufacturers. In addition, CRC-4 is also instrumented with a suspended tubing-encapsulated cable with a combination of SM and MM fibres.
The present study analyses the data from the SM fibres only.
The site also has two permanently deployed surface orbital vibrators (SOVs) [20], which were also used as seismic sources in these trials. Locations of the SOVs are marked in Figure 1. Sweep parameters are 0–80 Hz, 155 s and 10 t peak force at 80 Hz. For comparison of the sources, data were also acquired with vibroseis sources located in the direct vicinity of SOV1.
2.2. Field Data Analysis
Figure 2 shows a comparison between the zero-offset VSP data acquired in the CRC-3 well using the cables cemented behind the casing and attached to the production tubing; the same amplitude scaling is used in displays A vs. B and C vs. D (which show in colour small fragments of panels A and B, respectively). The largest difference between the two datasets is in the noise field related to waves that propagate along the tubing itself. These waves significantly contaminate the tubing-conveyed cable data (compare A vs. B). Several different tube wave modes with slightly different apparent velocities for the same depth are pronounced on this record (A) (the tube waves’ events and their velocities are highlighted). A tube wave is also present in the cemented cable record but is much weaker (apart from the top 300 m, where the main casing string is not cemented within the surface casing). The cemented cable data previously acquired in the same well before the installation of the production tubing had all the tube waves propagating with the same velocity.
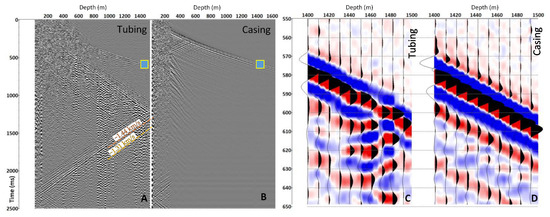
Figure 2.
Comparison of DAS VSP in the CRC-3 well acquired using a single vibroseis sweep and recorded by an enhanced backscattering fibre deployed in tubing-conveyed (A) and casing-conveyed (B) cables. Panels (C,D) are fragments of the records shown in (A,B) as blue boxes.
Tubing reverberation caused by various completion components also affects the data recorded with a tubing-conveyed cable and is not present on the cemented cable.
Finally, panels C and D show that for different coupling between cables and the formation (through cement vs. through the water), the signals are of the same order of magnitude. The direct P-wave on tubing-conveyed cable is only 30–50% weaker compared to the casing-conveyed cable record.
The tubing-conveyed deployment of an optical fibre for downhole seismic surveys demonstrates the acquisition of high-quality data. A major significant noise component in such installations is tube waves, which are typically generated by energy travelling from the source through the air and impacting the well’s surface infrastructure (wellhead, well tree, etc.). Then, this energy travels along the casing-water/fluid interface, usually with the velocity close to the sound velocity in the borehole fluid, and is sensed by any receivers deployed within the well column. To avoid such prominent noise, the source can be positioned at larger offsets from the wellhead while providing sufficient coverage to obtain an image of the well vicinity. Figure 3 shows examples of data acquired in the CRC-2 well with a tubing-conveyed cable using a vibroseis source at various offsets. The near-offset record (at 30 m in Figure 3a) is heavily contaminated by the tube wave noise, but at a far offset (at 680 m in Figure 3a), it is not present. Figure 3b shows how the noise changes with increasing offset on the CRC-2 tubing-deployed cable.
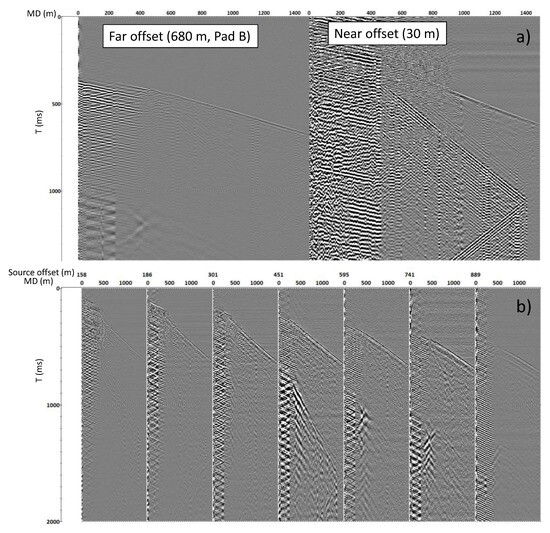
Figure 3.
Comparison of DAS VSP in CRC-2 acquired with tubing-conveyed cables using vibroseis at near and far offsets. (a) Comparison of seismograms at near (right) and far (left) offsets—demonstrates the presence and the absence of a tube wave. (b) Demonstrates the noise changes with increasing offset.
A comparison of the performance of the cemented and suspended cables is displayed in Figure 4. In general, the quality of the data acquired with a suspended cable is surprisingly good. The absence of production tubing in CRC-4 reduces the level of source-generated noise, while a slight deviation of the well improves coupling and tension on the cable. This test was carried out using a permanently deployed SOV source after a conventional vibroseis truck had been demobilised from the site.
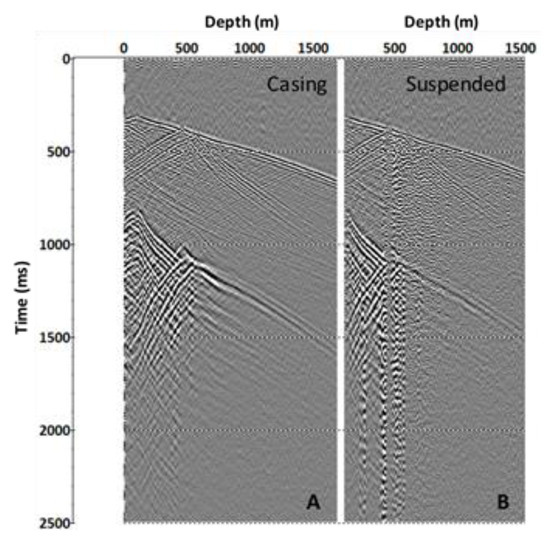
Figure 4.
Comparison of DAS VSP in CRC-4 acquired using SOV2 and both cemented (A) and loosely suspended cables (B), SMF fibre.
Some of the results reported in the trial may be surprising, in particular, the excellent results for a cable suspended in the borehole fluid. A quantitative understanding of these effects requires detailed numerical modelling. While adequate numerical modelling of all the 3D effects in the borehole would be cumbersome, as the first step, we conducted simple 1.5D numerical simulations.
3. Numerical Modelling
3.1. Modelling Approach
We model the effect of the borehole environment with the 1.5D full wave reflectivity method implemented in the OASES software, Version 3.1. OASES simulates 3D wave propagation in a 1D model, which can contain elastic or fluid layers. Similar to the classical reflectivity methods [32], this algorithm involves (1) decomposing the seismic wavefield into plane-wave components, (2) computing reflection and transmission transfer matrices for each component and (3) wavenumber integration to obtain a space–time domain response. The plane-wave transfer matrices are computed using the Direct Global Matrix solution technique, which is much more efficient than classical methods [33].
In our simulations, cement, casing, wellbore and fibre-optic cable are represented by vertical layers of infinite extent (Figure 5a,b). This is done for the simplicity of numerical simulations despite the fact that such a representation severely distorts the axisymmetric shape of these objects and thus can only be assessed qualitatively. The simulations are conducted for a P-wave generated by a point source located 200 m from the borehole wall and 1000 m above the line of receivers, which is located perpendicular to the borehole axis (Figure 5a,b). Of course, in a real borehole experiment, receivers can only be placed in the borehole, but in numerical simulations, they are placed on the line perpendicular to the borehole to explore the variations of strain with the distance from the centre of the well (to see how far the effect of the wellbore propagates into the formation).
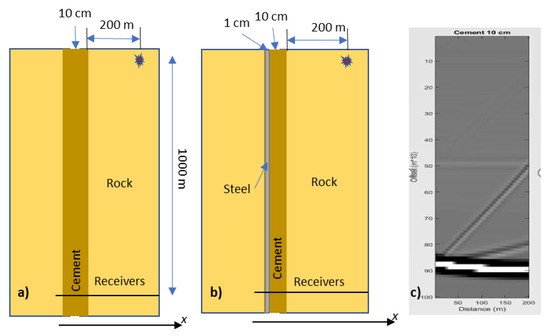
Figure 5.
2D layer representation of borehole environments: (a) cement layer, (b) cement with steel casing; (c) snapshot for (a) at the time of arrival of the direct P-wave to the receivers.
3.2. Modelling Results
The modelling results in this section are shown in Figure 6, Figure 7, Figure 8, Figure 9 and Figure 10 as the root-mean-square (RMS) vertical strain amplitude versus horizontal coordinate. For a 10 cm thick cement layer, this strain amplitude in the cement differs from the amplitude away from the well by no more than 2% (Figure 6a). Introducing a 1 cm-thick steel casing increases this effect by a factor of 2, but it is still below 5% (Figure 6b). This small effect of the cement layer on the direct-wave amplitude extends some 100–200 m into the formation (one to two wavelengths). As is evident from the snapshot (Figure 5c), this effect is the result of interference of the direct P-wave with P- and S-wave reflections from the layer.
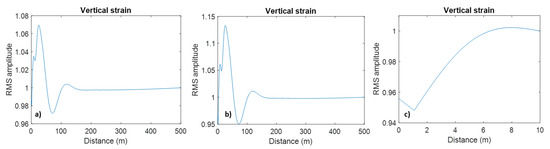
Figure 6.
Vertical strain amplitude as a function of lateral coordinate (a) for a cement layer, (b) for a cement layer with steel casing and (c) zoom of (b). Please note differences in vertical scale.
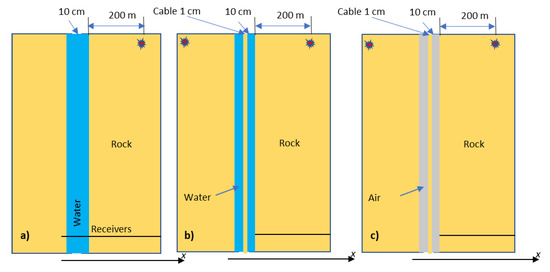
Figure 7.
2D layer representation of borehole environments: (a) fluid-filled borehole, (b) borehole with a cable suspended in water and (c) water replaced with air (all modelled as vertical layers).
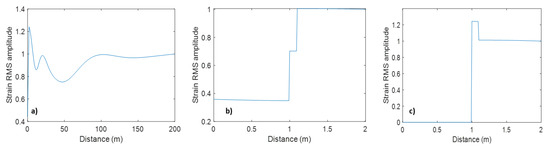
Figure 8.
Vertical strain amplitude versus lateral coordinate for (a) layer of water (Figure 7a); (b) same as in (a) but in the vicinity of the layer. (c) is the same as in (b) but for a layer of air. Note differences in vertical scale.
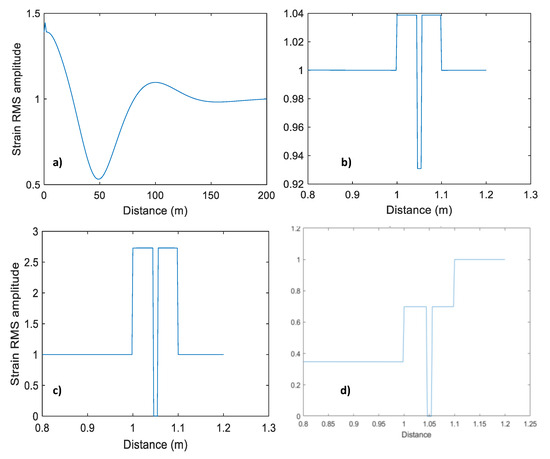
Figure 9.
Vertical strain amplitude versus lateral coordinate for (a) solid layer (representing a fibre-optic cable) suspended in a layer of water (Figure 7b); (b) same as in (a) but in the vicinity of the layer. (c) is the same as in (b) but for water replaced with air (Figure 7c); (d) the same as in (b) but with the solid layer having zero Poisson’s ratio. Note differences in vertical scale.
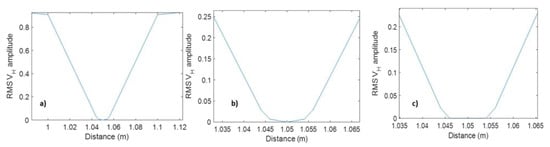
Figure 10.
Horizontal particle velocity amplitude versus lateral coordinate for (a) solid layer (representing a fibre-optic cable) suspended in a layer of water (Figure 7b); (b) same as in (a) but within the layer and its immediate vicinity. (c) is the same as (b) but for water replaced with air (Figure 7c). Note differences in vertical scale.
Figure 8 shows the effect of a liquid-filled borehole represented by a 10 cm thick liquid layer (Figure 7a). The strain in the liquid is of the same order of magnitude as that in the formation but can be larger or smaller, depending on the source configuration (Figure 8a,b). The strain is even larger when water is replaced with air (Figure 8c).
It should be noted that DAS does not measure strain in the fluid; it measures strain in an optical fibre or cable immersed in the fluid. Modelling an optical cable by a 1 cm thick elastic layer (Figure 7b) is shown in Figure 9. This modelling shows that the strain amplitude in this thin solid layer is of the same order but lower than strain both in the formation and in the fluid (Figure 9a, b). However, the strain in the cable vanishes when the borehole fluid is replaced with air (Figure 9c) or when Poisson’s ratio of the cable is zero (Figure 9d).
Bóna and Lebedev [34] measured the sensitivity of several DAS cables in a water tank to acoustic (pressure) waves in the frequency range from 20 Hz to 1 kHz. They found that the sensitivity of different cables was strongly correlated with Poisson’s ratio of cables’ jackets. These results are broadly consistent with our simulations.
4. Discussion
The numerical simulations of the fluid effect on the DAS response are consistent with the physical understanding of the effect of layer properties on wave propagation. Indeed, vertical strain in the ‘cable’ is induced by the horizontal strain through the Poisson-ratio effect. The horizontal strain in the cable is, in turn, induced by the horizontal particle velocity and pressure in the fluid. Thus, for the vertical strain in the cable to be significant, two conditions need to be satisfied:
- The horizontal strain in the cable needs to be significant. The horizontal strain is a lateral derivative of the horizontal particle velocity shown in Figure 10. We see that this derivative is significant when the cable is in water (Figure 10a,b) but zero when it is in air. This is, again, understandable as the transfer of acoustic energy into air is negligible;
- The cable’s Poisson ratio needs to be finite (larger than zero). Materials with a very low Poisson’s ratio (such as quartz glass) are best avoided.
Overall, the results of numerical simulations are consistent with the observations in field experiments. However, it should be noted that the observed effects may be site-specific and can depend on local conditions; therefore, quantitative results cannot be assumed to hold at other sites and will require field experiments at specific sites. In particular, the noise pattern may be different offshore as, here, it is largely generated by surface waves, which are not present in offshore settings. As mentioned earlier, for the same reason, the noise pattern strongly depends on the offset of the source from the wellhead.
All the field experiments in our study were carried out with cables of very similar designs. The use of a cable with a substantially different design may also affect sensitivity. This effect might not be adequately captured by simple elastic modelling presented in our study as cables may contain viscoelastic and plastic components such as a gel.
5. Conclusions
The Stage 3 Otway Project provided a rare opportunity to evaluate the performance of the fibre-optic cables for DAS VSP acquisition as a function of the deployment method through direct field experiments.
As expected, the highest quality of the data was obtained from fibre-optic cables cemented behind the casing. This method provided the best coupling conditions and virtual immunity from tube wave noise. Tubing-conveyed DAS cable demonstrated that coupling of the sensor to the geological formation through the borehole fluid produces a signal-to-noise ratio lower than for the cemented cable but of the same order of magnitude. However, in this case, the data quality can be degraded by the source-generated noise, especially where the tubing is the main conduit. In some cases, this noise can be attenuated by data processing or machine learning techniques.
Cable loosely suspended in a deviated CRC-4 provided data quality quite comparable to the cemented DAS cable. We believe the combination of the deviation of the well and the low tension of the cable positively affected the data quality.
These field trials were complemented with simple 1.5D numerical simulations. The results confirm the feasibility of borehole DAS measurements with fibre-optic cables suspended in a borehole liquid (but not gas!), provided the cable has a relatively high Poisson’s ratio. However, 2D modelling only provides a very rough proxy for the 3D effects around the borehole. As such, axisymmetric modelling is in order.
The main overall conclusion of this study is that both tubing-conveyed and loosely suspended cables represent viable options for DAS deployment.
Author Contributions
Conceptualization, R.P., K.T. and B.G.; methodology, R.P., K.T. and B.G.; software, P.S. and R.P.; validation, R.P., K.T. and B.G.; formal analysis, B.G.; investigation, R.P., A.B., K.T., E.S., S.Y. and B.G.; data curation, B.G. and R.P.; writing—original draft preparation, R.P. and B.G.; writing—review and editing, B.G., A.B. and K.T.; visualization, R.P., K.T., B.G. and A.B.; supervision, R.P.; project administration, R.P. All authors have read and agreed to the published version of the manuscript.
Funding
The Otway Project received CO2CRC Ltd., Melbourne, Australia funding through its industry members and research partners, the Australian Government under the CCS Flagships Programme, the Victorian State Government and the Global CCS Institute. The authors wish to acknowledge the financial assistance provided through Australian National Low Emissions Coal Research and Development. ANLEC R&D is supported by Low Emission Technology Australia (LETA) and the Australian Government through the Department of Industry, Science, Energy and Resources. The authors acknowledge the financial support from the Department of Industry, Science and Resources for the 2021 Global Innovation Linkage grant (GILIII000114) and the sponsors of the Curtin Reservoir Geophysics Consortium (CRGC).
Data Availability Statement
Restrictions apply to the availability of the downhole DAS data. These data were obtained within the CO2CRC Otway project and are available from the authors with the permission of CO2CRC Ltd.
Acknowledgments
The authors are grateful to the Otway Stage 3 team colleagues Paul Barraclough (CO2CRC Ltd.), Peter Dumesny (Upstream Production Solutions), Michael Mondanos and Stoyan Nikolov (Silixa LLC., Elstree, UK) for help with the fibre-optic equipment.
Conflicts of Interest
The authors declare no conflict of interest.
References
- Hartog, A.H. An Introduction to Distributed Optical Fibre Sensors; CRC Press: Boca Raton, FL, USA, 2017. [Google Scholar]
- Kersey, A.D. Distributed and Multiplexed Fiber Optic Sensors; Wiley: Hoboken, NJ, USA, 2011; pp. 277–314. [Google Scholar] [CrossRef]
- Becker, M.W.; Ciervo, C.; Cole, M.; Coleman, T.; Mondanos, M. Fracture hydromechanical response measured by fiber optic distributed acoustic sensing at milliHertz frequencies. Geophys. Res. Lett. 2017, 44, 7295–7302. [Google Scholar] [CrossRef]
- Lindsey, N.J.; Dawe, T.C.; Ajo-Franklin, J.B. Illuminating seafloor faults and ocean dynamics with dark fiber distributed acoustic sensing. Science 2019, 366, 1103–1107. [Google Scholar] [CrossRef] [PubMed]
- Ajo-Franklin, J.B.; Dou, S.; Lindsey, N.J.; Monga, I.; Tracy, C.; Robertson, M.; Rodriguez Tribaldos, V.; Ulrich, C.; Freifeld, B.; Daley, T. Distributed acoustic sensing using dark fiber for near-surface characterization and broadband seismic event detection. Sci. Rep. 2019, 9, 1328. [Google Scholar] [CrossRef] [PubMed]
- Miller, D.E.; Coleman, T.; Zeng, X.; Patterson, J.R.; Reinisch, E.C.; Cardiff, M.A.; Wang, H.F.; Fratta, D.; Trainor-Guitton, W.; Thurber, C.H. DAS and DTS at Brady Hot Springs: Observations about coupling and coupled interpretations. In Proceedings of the 43rd Workshop on Geothermal Reservoir Engineering, Stanford, CA, USA, 12–14 February 2018; pp. 12–14. [Google Scholar]
- Karrenbach, M.; Cole, S.; Ridge, A.; Boone, K.; Kahn, D.; Rich, J.; Silver, K.; Langton, D. Fiber-optic distributed acoustic sensing of microseismicity, strain and temperature during hydraulic fracturing. Geophysics 2019, 84, D11–D23. [Google Scholar] [CrossRef]
- Mateeva, A.; Lopez, J.; Chalenski, D.; Tatanova, M.; Zwartjes, P.; Yang, Z.; Bakku, S.; de Vos, K.; Potters, H. 4D DAS VSP as a tool for frequent seismic monitoring in deep water. Lead. Edge 2017, 36, 995–1000. [Google Scholar] [CrossRef]
- Bacci, V.O.; O’Brien, S.; Frank, J.; Anderson, M. Using a Walk-away DAS Time-lapse VSP for CO2 Plume Monitoring at the Quest CCS Project. Recorder 2017, 42, 18–21. [Google Scholar]
- Correa, J.; Egorov, A.; Tertyshnikov, K.; Bona, A.; Pevzner, R.; Dean, T.; Freifeld, B.; Marshall, S. Analysis of signal to noise and directivity characteristics of DAS VSP at near and far offsets—A CO2CRC Otway Project data example. Lead. Edge 2017, 36, 994a991–994a997. [Google Scholar] [CrossRef]
- Daley, T.M.; Miller, D.E.; Dodds, K.; Cook, P.; Freifeld, B.M. Field testing of modular borehole monitoring with simultaneous distributed acoustic sensing and geophone vertical seismic profiles at Citronelle, Alabama. Geophys. Prospect. 2016, 64, 1318–1334. [Google Scholar] [CrossRef]
- Mateeva, A.; Zwartjes, P.M. Depth Calibration of DAS VSP Channels: A New Data-Driven Method. In Proceedings of the 79th EAGE Conference and Exhibition 2017, Paris, France, 12–15 June 2017; pp. 1–5. [Google Scholar]
- Pevzner, R.; Tertyshnikov, K.; Sidenko, E.; Yavuz, S. Effects of Cable Deployment Method on DAS VSP Data Quality: Study at CO2CRC Otway in-situ Laboratory. In Proceedings of the 82nd EAGE Annual Conference & Exhibition, Amsterdam, The Netherlands, 8–11 December 2020. [Google Scholar]
- Pevzner, R.; Gurevich, B.; Pirogova, A.; Tertyshnikov, K.; Glubokovskikh, S. Repeat well logging using earthquake wave amplitudes measured by distributed acoustic sensors. Lead. Edge 2020, 39, 513–517. [Google Scholar] [CrossRef]
- Hartog, A.; Frignet, B.; Mackie, D.; Clark, M. Vertical seismic optical profiling on wireline logging cable. Geophys. Prospect. 2014, 62, 693–701. [Google Scholar] [CrossRef]
- Sidenko, E.; Tertyshnikov, K.; Gurevich, B.; Isaenkov, R.; Ricard, L.P.; Sharma, S.; Van Gent, D.; Pevzner, R. Distributed fiber-optic sensing transforms an abandoned well into a permanent geophysical monitoring array: A case study from Australian South West. Lead. Edge 2022, 41, 140–148. [Google Scholar] [CrossRef]
- Naldrett, G. A new era of borehole measurements for permanent reservoir monitoring. First Break 2021, 39, 77–81. [Google Scholar] [CrossRef]
- Wuestefeld, A.; Wilks, M. Modelling Microseismic Event Detection and Location Capabilities with DAS Cables. In Proceedings of the 81st EAGE Conference and Exhibition 2019, London, UK, 3–6 June 2019; Volume 2019, pp. 1–5. [Google Scholar] [CrossRef]
- Bakulin, A.; Alfataierge, E.; Pevzner, R. Evaluating HD weathering surveys and surface seismic with DAS in a sand dune environment. In Second International Meeting for Applied Geoscience & Energy; Society of Exploration Geophysicists: Houston, TX, USA, 2022; pp. 621–625. [Google Scholar] [CrossRef]
- Correa, J. Distributed Acoustic Sensing for Seismic Imaging and Reservoir Monitoring Applied to CO2 Geosequestration; Curtin: Perth, Australia, 2018. [Google Scholar]
- Kuvshinov, B.N. Interaction of helically wound fibre-optic cables with plane seismic waves. Geophys. Prospect. 2016, 64, 671–688. [Google Scholar] [CrossRef]
- Wuestefeld, A.; Wilks, M. How to twist and turn a fiber: Performance modeling for optimal DAS acquisitions. Lead. Edge 2019, 38, 226–231. [Google Scholar] [CrossRef]
- Sidenko, E.; Pevzner, R.; Bona, A.; Tertyshnikov, K. Experimental Comparison of Directivity Patterns of Straight and Helically Wound DAS Cables. In Proceedings of the 82nd EAGE Annual Conference & Exhibition, Amsterdam, The Netherlands, 18–21 October 2021. [Google Scholar]
- Bellefleur, G.; Schetselaar, E.; Wade, D.; White, D.; Enkin, R.; Schmitt, D.R. Vertical seismic profiling using distributed acoustic sensing with scatter-enhanced fibre-optic cable at the Cu–Au New Afton porphyry deposit, British Columbia, Canada. Geophys. Prospect. 2020, 68, 313–333. [Google Scholar] [CrossRef]
- Willis, M.E.; Wu, X.; Palacios, W.; Ellmauthaler, A. Understanding cable coupling artifacts in wireline-deployed DAS VSP data. In SEG Technical Program Expanded Abstracts 2019; Society of Exploration Geophysicists: Houston, TX, USA, 2019; pp. 5310–5314. [Google Scholar] [CrossRef]
- Constantinou, A.; Farahani, A.; Cuny, T.; Hartog, A. Improving DAS acquisition by real-time monitoring of wireline cable coupling. In SEG Technical Program Expanded Abstracts 2016; Society of Exploration Geophysicists: Houston, TX, USA, 2016; pp. 5603–5607. [Google Scholar] [CrossRef]
- Correa, J.; Van Zaanen, L.; Tertyshnikov, K.; Dean, T.; Pevzner, R.; Bona, A. DAS Versus Geophones: A Quantitative Comparison of a VSP Survey at a Dedicated Field Laboratory. In Proceedings of the Fourth EAGE Borehole Geophysics Workshop, Abu-Dhabi, United Arab Emirates, 19 November 2017. [Google Scholar]
- Jenkins, C.R.; Cook, P.J.; Ennis-King, J.; Undershultz, J.; Boreham, C.; Dance, T.; de Caritat, P.; Etheridge, D.M.; Freifeld, B.M.; Hortle, A.; et al. Safe storage and effective monitoring of CO2 in depleted gas fields. Proc. Natl. Acad. Sci. USA 2012, 109, E35–E41. [Google Scholar] [CrossRef] [PubMed]
- Barraclough, P.; Bagheri, M.; Jenkins, C.; Pevzner, R.; Hann, S.; Wuttke, K.; Nikolov, S.; Mondanos, M. Innovation and instrumentation in CO2 monitoring wells for reservoir surveillance and advanced diagnostics. APPEA J. 2021, 61, 530–535. [Google Scholar] [CrossRef]
- Jenkins, C.; Marshall, S.; Dance, T.; Ennis-King, J.; Glubokovskikh, S.; Gurevich, B.; La Force, T.; Paterson, L.; Pevzner, R.; Tenthorey, E.; et al. Validating Subsurface Monitoring as an Alternative Option to Surface M&V—The CO2CRC’s Otway Stage 3 Injection. Energy Procedia 2017, 114, 3374–3384. [Google Scholar] [CrossRef]
- Jenkins, C.; Barraclough, P.; Bagheri, M.; Correa, J.; Dance, T.; Ennis-King, J.; Freifeld, B.; Glubokovskikh, S.; Green, C.; Gunning, J.; et al. Drilling an Array of Monitoring Wells for a CCS Experiment: Lessons from Otway Stage 3. In Proceedings of the Greenhouse Gas Control Technologies Conference, Online, 15–18 March 2021. [Google Scholar]
- Kennett, B.L.N. Seismic Waoe Propagation in Stratified Med; ANU E Press: Canberra, Australia, 2009. [Google Scholar]
- Schmidt, H.; Jensen, F.B. A Full-Wave Solution for Propagation in Multilayered Viscoelastic Media with Application to Gaussian-Beam Reflection at Fluid-Solid Interfaces. J. Acoust. Soc. Am. 1985, 77, 813–825. [Google Scholar] [CrossRef]
- Bona, A.; Lebedev, M. Comparison of DAS Cable Sensitivity to Acoustic Waves. In Proceedings of the 2nd EAGE Workshop on Fiber Optic Sensing for Energy Applications in Asia Pacific, Kuala Lumpur, Malaysia, 5–7 December 2022; Volume 2022, pp. 1–4. [Google Scholar] [CrossRef]
Disclaimer/Publisher’s Note: The statements, opinions and data contained in all publications are solely those of the individual author(s) and contributor(s) and not of MDPI and/or the editor(s). MDPI and/or the editor(s) disclaim responsibility for any injury to people or property resulting from any ideas, methods, instructions or products referred to in the content. |
© 2023 by the authors. Licensee MDPI, Basel, Switzerland. This article is an open access article distributed under the terms and conditions of the Creative Commons Attribution (CC BY) license (https://creativecommons.org/licenses/by/4.0/).