

Colorimetric Paper-Based Analytical Devices (PADs) Backed by Chemometrics for Pd(II) Detection

 ,
,  ,
, 

Abstract
:1. Introduction
2. Materials and Methods
3. Results and Discussion
4. Conclusions
Supplementary Materials
Author Contributions
Funding
Institutional Review Board Statement
Informed Consent Statement
Data Availability Statement
Conflicts of Interest
References
- Qasem, N.A.A.; Mohammed, R.H.; Lawal, D.U. Removal of heavy metal ions from wastewater: A comprehensive and critical review. NPJ Clean Water 2021, 4, 36. [Google Scholar] [CrossRef]
- Nigam, A.; Sharma, N.; Tripathy, S.; Kumar, M. Development of semiconductor based heavy metal ion sensors for water analysis: A review. Sens. Actuators A Phys. 2021, 330, 112879. [Google Scholar] [CrossRef]
- Liu, Z.; Fan, B.; Zhao, J.; Yang, B.; Zheng, X. Benzothiazole derivatives-based supramolecular assemblies as efficient corrosion inhibitors for copper in artificial seawater: Formation, interfacial release and protective mechanisms. Corros. Sci. 2023, 212, 110957. [Google Scholar] [CrossRef]
- Zamora-Ledezma, C.; Negrete-Bolagay, D.; Figueroa, F.; Zamora-Ledezma, E.; Ni, M.; Alexis, F.; Guerrero, V.H. Heavy metal water pollution: A fresh look about hazards, novel and conventional remediation methods. Environ. Technol. Innov. 2021, 22, 101504. [Google Scholar] [CrossRef]
- Komendova, R. Recent advances in the preconcentration and determination of platinum group metals in environmental and biological samples. TrAC Trends Anal. Chem. 2020, 122, 115708. [Google Scholar] [CrossRef]
- Leśniewska, B.A.; Godlewska-Żyłkiewicz, B.; Bocca, B.; Caimi, S.; Caroli, S.; Hulanicki, A. Platinum, palladium and rhodium content in road dust, tunnel dust and common grass in Białystok area (Poland): A pilot study. Sci. Total Environ. 2004, 321, 93–104. [Google Scholar] [CrossRef]
- Tietze, L.F.; Ila, H.; Bell, H.P. Enantioselective palladium-catalyzed transformations. Chem. Rev. 2004, 104, 3453–3516. [Google Scholar] [CrossRef]
- Wu, X.F.; Neumann, H.; Beller, M. Palladium-catalyzed carbonylative coupling reactions between Ar–X and carbon nucleophiles. Chem. Soc. Rev. 2011, 40, 4986–5009. [Google Scholar] [CrossRef]
- Sore, H.F.; Galloway, W.R.; Spring, D.R. Palladium-catalysed cross-coupling of organosilicon reagents. Chem. Soc. Rev. 2012, 41, 1845–1866. [Google Scholar] [CrossRef]
- Pyrzńska, K. Viewpoint Monitoring of platinum in the environment. J. Environ. Monit. 2000, 2, 99N–103N. [Google Scholar] [CrossRef]
- Zischka, M.; Schramel, P.; Muntau, H.; Rehnert, A.; Gomez, M.G.; Stojanik, B.; Wannemaker, G.; Dams, R.; Quevauviller, P.; Maier, E.A. A new certified reference material for the quality control of palladium, platinum and rhodium in road dust, BCR-723. TrAC Trends Anal. Chem. 2002, 21, 851–868. [Google Scholar] [CrossRef]
- Ek, K.H.; Morrison, G.M.; Rauch, S. Environmental routes for platinum group elements to biological materials—A review. Sci. Total Environ. 2004, 334, 21–38. [Google Scholar] [CrossRef] [PubMed]
- Rauch, S.; Morrison, G.M. Environmental relevance of the platinum-group elements. Elements 2008, 4, 259–263. [Google Scholar] [CrossRef]
- Moldovan, M.; Palacios, M.A.; Gomez, M.M.; Morrison, G.; Rauch, S.; McLeod, C.; Ma, R.; Caroli, S.; Alimonti, A.; Petrucci, F.; et al. Environmental risk of particulate and soluble platinum group elements released from gasoline and diesel engine catalytic converters. Sci. Total Environ. 2002, 296, 199–208. [Google Scholar] [CrossRef] [PubMed]
- Savignan, L.; Faucher, S.; Chéry, P.; Lespes, G. Platinum group elements contamination in soils: Review of the current state. Chemosphere 2021, 271, 129517. [Google Scholar] [CrossRef] [PubMed]
- Ravindra, K.; Bencs, L.; Van Grieken, R. Platinum group elements in the environment and their health risk. Sci. Total Environ. 2004, 318, 1–43. [Google Scholar] [CrossRef]
- Kielhorn, J.; Melber, C.; Keller, D.; Mangelsdorf, I. Palladium—A review of exposure and effects to human health. Int. J. Hyg. Environ. 2002, 205, 417–432. [Google Scholar] [CrossRef]
- Wiseman, C.L.; Zereini, F. Airborne particulate matter, platinum group elements and human health: A review of recent evidence. Sci. Total Environ. 2009, 407, 2493–2500. [Google Scholar] [CrossRef]
- Faurschou, A.; Menné, T.; Johansen, J.D.; Thyssen, J.P. Metal allergen of the 21st century—A review on exposure, epidemiology and clinical manifestations of palladium allergy. Contact Derm. 2011, 64, 185–195. [Google Scholar] [CrossRef]
- Pawlak, J.; Łodyga-Chruścińska, E.; Chrustowicz, J. Fate of platinum metals in the environment. Trace Elem. Med. Biol. 2014, 28, 247–254. [Google Scholar] [CrossRef]
- Hosseini, M.J.; Jafarian, I.; Farahani, S.; Khodadadi, R.; Tagavi, S.H.; Naserzadeh, P.; Mohammadi-Bardbori, A.; Arghavanifard, N. New mechanistic approach of inorganic palladium toxicity: Impairment in mitochondrial electron transfer. Metallomics 2016, 8, 252–259. [Google Scholar] [CrossRef] [PubMed]
- Rao, C.R.M.; Reddi, G.S. Platinum group metals (PGM); occurrence, use and recent trends in their determination. TrAC Trends Anal. Chem. 2000, 19, 565–586. [Google Scholar] [CrossRef]
- Bagheri, A.; Taghizadeh, M.; Behbahani, M.; Asgharinezhad, A.A.; Salarian, M.; Dehghani, A.; Ebrahimzadeh, H.; Amini, M.M. Synthesis and characterization of magnetic metal-organic framework (MOF) as a novel sorbent, and its optimization by experimental design methodology for determination of palladium in environmental samples. Talanta 2012, 99, 132–139. [Google Scholar] [CrossRef] [PubMed]
- Gomez, M.B.; Gomez, M.M.; Palacios, M.A. Control of interferences in the determination of Pt, Pd and Rh in airborne particulate matter by inductively coupled plasma mass spectrometry. Anal. Chim. Acta 2000, 404, 285–294. [Google Scholar] [CrossRef]
- Georgeva, M.; Pihlar, B. Determination of palladium by adsorptive stripping voltammetry. Fresenius J. Anal. Chem. 1997, 357, 874–880. [Google Scholar] [CrossRef]
- Locatelli, C. Voltammetric Peak Area as Instrumental Datum. A Possibility to Improve the Determination at Ultratrace Level Concentration of Platinum Group Metals (PGMs) and Lead. Application to Particulate Matter. Electroanalysis 2007, 19, 445–452. [Google Scholar] [CrossRef]
- Bobrowski, A.; Gawlicki, M.; Kapturski, P.; Mirceski, V.; Spasovski, F.; Zarębski, J. The silver amalgam film electrode in adsorptive stripping voltammetric determination of palladium (II) as its dimethyldioxime complex. Electroanalysis 2009, 21, 36–40. [Google Scholar] [CrossRef]
- Velmurugan, M.; Thirumalraj, B.; Chen, S.M.; Al-Hemaid, F.M.; Ali, M.A.; Elshikh, M.S. Development of electrochemical sensor for the determination of palladium ions (Pd2+) using flexible screen printed un-modified carbon electrode. J. Colloid Interface Sci. 2017, 485, 123–128. [Google Scholar] [CrossRef]
- Bai, H.; Wang, S.; Liu, P.; Xiong, C.; Zhang, K.; Cao, Q. Electrochemical sensor based on in situ polymerized ion-imprinted membranes at graphene modified electrode for palladium determination. J. Electroanal. Chem. 2016, 771, 29–36. [Google Scholar] [CrossRef]
- Li, H.; Fan, J.; Peng, X. Colourimetric and fluorescent probes for the optical detection of palladium ions. Chem. Soc. Rev. 2013, 42, 7943–7962. [Google Scholar] [CrossRef]
- Balamurugan, R.; Liu, J.H.; Liu, B.T. A review of recent developments in fluorescent sensors for the selective detection of palladium ions. Coord. Chem. Rev. 2018, 376, 196–224. [Google Scholar] [CrossRef]
- Biesuz, R.; Nurchi, V.M.; Lachowicz, J.I.; Alberti, G. Unusual PLS application for Pd (II) sensing in extremely acidic solutions. New J. Chem. 2018, 42, 7901–7907. [Google Scholar] [CrossRef]
- Kamel, R.M.; Shahat, A.; Atta, A.H.; Farag-Allah, M.M. Development of a novel and potential chemical sensor for colorimetric detection of Pd (II) or Cu (II) in E-wastes. Microchem. J. 2022, 172, 106951. [Google Scholar] [CrossRef]
- Xu, Y.; Liu, M.; Kong, N.; Liu, J. Lab-on-paper micro-and nano-analytical devices: Fabrication, modification, detection and emerging applications. Microchim. Acta 2016, 183, 1521–1542. [Google Scholar] [CrossRef]
- Ozer, T.; McMahon, C.; Henry, C.S. Advances in paper-based analytical devices. Annu. Rev. Anal. Chem. 2020, 13, 85–109. [Google Scholar] [CrossRef]
- Magnaghi, L.R.; Alberti, G.; Pazzi, B.M.; Zanoni, C.; Biesuz, R. A green-PAD array combined with chemometrics for pH measurements. New J. Chem. 2022, 46, 19460. [Google Scholar] [CrossRef]
- Tan, W.; Zhang, L.; Jarujamrus, P.; Doery, J.C.; Shen, W. Improvement strategies on colorimetric performance and practical applications of Paper-based analytical devices. Microchem. J. 2022, 180, 107562. [Google Scholar] [CrossRef]
- Sruthi, P.S.; Balasubramanian, S.; Kumar, P.S.; Kapoor, A.; Ponnuchamy, M.; Jacob, M.M.; Prabhakar, S. Eco-friendly pH detecting paper-based analytical device: Towards process intensification. Anal. Chim. Acta 2021, 1182, 338953. [Google Scholar] [CrossRef]
- Sharifi, H.; Tashkhourian, J.; Hemmateenejad, B. Identification and determination of multiple heavy metal ions using a miniaturized paper-based optical device. Sens. Actuators B Chem. 2022, 359, 131551. [Google Scholar] [CrossRef]
- Chen, Z.; Zhang, Z.; Qi, J.; You, J.; Ma, J.; Chen, L. Colorimetric detection of heavy metal ions with various chromogenic materials: Strategies and applications. J. Hazard. Mater. 2023, 441, 129889. [Google Scholar] [CrossRef]
- Selvakumar, B.; Kathiravan, A. Sensory materials for microfluidic paper based analytical devices—A review. Talanta 2021, 235, 122733. [Google Scholar] [CrossRef]
- Sharifi, H.; Tashkhourian, J.; Hemmateenejad, B. A 3D origami paper-based analytical device combined with PVC membrane for colorimetric assay of heavy metal ions: Application to determination of Cu (II) in water samples. Anal. Chim. Acta. 2020, 1126, 114–123. [Google Scholar] [CrossRef]
- Younas, M.; Maryam, A.; Khan, M.; Nawaz, A.A.; Jaffery, S.H.I.; Anwar, M.N.; Ali, L. Parametric analysis of wax printing technique for fabricating microfluidic paper-based analytic devices (µPAD) for milk adulteration analysis. Microfluid. Nanofluid. 2019, 23, 38. [Google Scholar] [CrossRef]
- Lu, Y.; Shi, W.; Qin, J.; Lin, B. Fabrication and characterization of paper-based microfluidics prepared in nitrocellulose membrane by wax printing. Anal. Chem. 2010, 82, 329–335. [Google Scholar] [CrossRef] [PubMed]
- Dungchai, W.; Chailapakul, O.; Henry, C.S. A low-cost, simple, and rapid fabrication method for paper-based microfluidics using wax screen-printing. Analyst 2011, 136, 77–82. [Google Scholar] [CrossRef] [PubMed]
- Ghosh, R.; Gopalakrishnan, S.; Savitha, R.; Renganathan, T.; Pushpavanam, S. Fabrication of laser printed microfluidic paper-based analytical devices (LP-µPADs) for point-of-care applications. Sci. Rep. 2019, 9, 7896. [Google Scholar] [CrossRef] [PubMed]
- Abe, K.; Kotera, K.; Suzuki, K.; Citterio, D. Inkjet-printed paper fluidic immuno-chemical sensing device. Anal. Bioanal. Chem. 2010, 398, 885–893. [Google Scholar] [CrossRef] [PubMed]
- Klasner, S.A.; Price, A.K.; Hoeman, K.W.; Wilson, R.S.; Bell, K.J.; Culbertson, C.T. Paper-based microfluidic devices for analysis of clinically relevant analytes present in urine and saliva. Anal. Bioanal. Chem. 2010, 397, 1821–1829. [Google Scholar] [CrossRef]
- Li, X.; Tian, J.; Nguyen, T.; Shen, W. Paper-based microfluidic devices by plasma treatment. Anal. Chem. 2008, 80, 9131–9134. [Google Scholar] [CrossRef]
- Pesavento, M.; Riolo, C.; Soldi, T.; Cervo, G. Spectrophotometric study of the equilibria between lanthanum (III) and three azodyes. Ann. Chim. 1979, 69, 649–661. [Google Scholar]
- Pesavento, M.; Riolo, C.; Biesuz, R. Spectrophotometric Determination of Palladium(ll) with Four Water-soluble Heterocyclic Azo Dyes. Analyst 1985, 110, 801–805. [Google Scholar] [CrossRef]
- Pesavento, M.; Profumo, A. Evaluation of the activity coefficients of some sulfonated azo dyes and of their complexes with metal ions. J. Chem. Soc. Perkin Trans. 1992, 2, 107–112. [Google Scholar] [CrossRef]
- Pesavento, M.; Soldi, T. Spectrophotometric Study and Analytical Applications of the Complexes of Copper(II) and Zinc(ll) with some Sulphonated Azo Dyes. Analyst 1983, 108, 1128–1134. [Google Scholar] [CrossRef]
- Geladi, P.; Kowalski, B.R. Partial least-squares regression: A tutorial. Anal. Chim. Acta 1986, 185, 1–17. [Google Scholar] [CrossRef]
- Wold, S.; Sjöström, M.; Eriksson, L. PLS-regression: A basic tool of chemometrics. Chemom. Intell. Lab. Syst. 2001, 58, 109–130. [Google Scholar] [CrossRef]
- Haenlein, M.; Kaplan, A.M. A Beginner’s Guide to Partial Least Squares Analysis. Understand. Stat. 2004, 3, 283–297. [Google Scholar] [CrossRef]
- Jiménez-Carvelo, A.M.; Salloum-Llergo, K.D.; Cuadros-Rodríguez, L.; Capitán-Vallvey, L.F.; Fernández-Ramos, M.D. A perfect tandem: Chemometric methods and microfluidic colorimetric twin sensors on paper. Beyond the traditional analytical approach. Microchem. J. 2020, 157, 104930. [Google Scholar] [CrossRef]
- Pazzi, B.M.; Pistoia, D.; Alberti, G. RGB-Detector: A Smart, Low-Cost Device for Reading RGB Indexes of Microfluidic Paper-Based Analytical Devices. Micromachines 2022, 13, 1585. [Google Scholar] [CrossRef]
- Hamedpour, V.; Postma, G.J.; van Den Heuvel, E.; Jansen, J.J.; Suzuki, K.; Citterio, D. Chemometrics-assisted microfluidic paper-based analytical device for the determination of uric acid by silver nanoparticle plasmon resonance. Anal. Bioanal. Chem. 2018, 410, 2305–2313. [Google Scholar] [CrossRef] [PubMed]
- Shariati-Rad, M.; Irandoust, M.; Mohammadi, S. Multivariate analysis of digital images of a paper sensor by partial least squares for determination of nitrite. Chemom. Intell. Lab. Syst. 2016, 158, 48–53. [Google Scholar] [CrossRef]
- Ataide, V.N.; Pradela Filho, L.A.; Guinati, B.G.S.; Moreira, N.S.; Gonçalves, J.D.; Ribeiro, C.M.G.; Grasseschi, D.; Coltro, W.K.T.; Salles, M.O.; Paixão, T.R.L.C. Combining chemometrics and paper-based analytical devices for sensing: An overview. TrAC Trends Anal. Chem. 2023, 164, 117091. [Google Scholar] [CrossRef]
- Wang, M.; Liu, X.; Lu, H.; Wang, H.; Qin, Z. Highly selective and reversible chemosensor for Pd2+ detected by fluorescence, colorimetry, and test paper. ACS Appl. Mater. Interfaces 2015, 7, 1284–1289. [Google Scholar] [CrossRef] [PubMed]
- Yang, L.; Wang, C.; Chang, G.; Ren, X. Facile synthesis of new coumarin-based colorimetric and fluorescent chemosensors: Highly efficient and selective detection of Pd2+ in aqueous solutions. Sens. Actuators B Chem. 2017, 240, 212–219. [Google Scholar] [CrossRef]
- Chen, T.; Wei, T.; Zhang, Z.; Chen, Y.; Qiang, J.; Wang, F.; Chen, X. Highly sensitive and selective ESIPT-based fluorescent probes for detection of Pd2+ with large Stocks shifts. Dyes Pigm. 2017, 140, 392–398. [Google Scholar] [CrossRef]
- Dong, Z.; Chen, W.; Li, H.; Dai, Y.; Zheng, T.; Zhang, H.; Xu, H.; Lu, H. A dual-functional colorimetric and “on-off” fluorescent probe based on purine derivative for detecting Pd2+ and Cu2+: Application as test strips. Inorg. Chem. Commun. 2020, 116, 107915. [Google Scholar] [CrossRef]
- Zhou, W.; Gao, Q.; Liu, D.; Li, C.; Liu, S.; Xia, K.; Han, B.; Zhou, C. A single molecular sensor for selective and differential colorimetric/ratiometric detection of Cu2+ and Pd2+ in 100% aqueous solution. Spectrochim. Acta A Mol. Biomol. Spectrosc. 2020, 237, 118365. [Google Scholar] [CrossRef]
- Hassaninejad-Darzi, S.K.; Torkamanzadeh, M. Simultaneous UV-Vis spectrophotometric quantification of ternary basic dye mixtures by partial least squares and artificial neural networks. Water Sci. Technol. 2016, 74, 2497–2504. [Google Scholar] [CrossRef]
- Alberti, G.; Nurchi, V.M.; Magnaghi, L.R.; Biesuz, R. A portable, disposable, and low-cost optode for sulphide and thiol detection. Anal. Meth. 2019, 11, 4464–4470. [Google Scholar] [CrossRef]
- Magnaghi, L.R.; Capone, F.; Zanoni, C.; Alberti, G.; Quadrelli, P.; Biesuz, R. Colorimetric sensor array for monitoring, modelling and comparing spoilage processes of different meat and fish foods. Foods 2020, 9, 684. [Google Scholar] [CrossRef]
- Alberti, G.; Re, S.; Tivelli, A.M.C.; Biesuz, R. Smart sensory materials for divalent cations: A dithizone immobilized membrane for optical analysis. Analyst 2016, 141, 6140–6148. [Google Scholar] [CrossRef]
- Leardi, R.; Melzi, C.; Polotti, G. CAT (Chemometric Agile Tool). Available online: http://www.gruppochemiometria.it/index.php/software/19-download-the-rbased-chemometric-software (accessed on 3 July 2023).
- World Health Organization. Melber, Christine, Keller, Detlef, Mangelsdorf, Inge & International Programme on Chemical Safety. Palladium. 2002. Available online: https://apps.who.int/iris/handle/10665/42401 (accessed on 3 July 2023).
- Standard Methods Committee of the American Public Health Association; American Water Works Association; Water Environment Federation. 3500-Pd Palladium. Available online: https://www.standardmethods.org/doi/10.2105/SMWW.2882.238 (accessed on 3 July 2023).
- Cuadros-Rodríguez, L.; Gámiz-Gracia, L.; Almansa-López, E.M.; Laso-Sánchez, J. Calibration in chemical measurement processes: I. A metrological approach. TrAC Trends Anal. Chem. 2001, 20, 195–206. [Google Scholar] [CrossRef]
- Cuadros-Rodríguez, L.; Gámiz-Gracia, L.; Almansa-López, E.M.; Bosque-Sendra, J.M. Calibration in chemical measurement processes. II. A methodological approach. TrAC Trends Anal. Chem. 2001, 20, 620–636. [Google Scholar] [CrossRef]
- Pino, L.K.; Searle, B.C.; Yang, H.Y.; Hoofnagle, A.N.; Noble, W.S.; MacCoss, M.J. Matrix-matched calibration curves for assessing analytical figures of merit in quantitative proteomics. J. Proteome Res. 2020, 19, 1147–1153. [Google Scholar] [CrossRef] [PubMed]
- Standard Methods Committee of the American Public Health Association; American Water Works Association; Water Environment Federation. 3030 Preliminary Treatment of Samples. Available online: https://www.standardmethods.org/doi/10.2105/SMWW.2882.041 (accessed on 3 July 2023).
- Huber, L. Validation and Qualification in Analytical Laboratories, 2nd ed.; CRC Press: Boca Raton, FL, USA, 2007. [Google Scholar]
- González, A.G.; Herrador, M.Á.; Asuero, A.G. Intra-laboratory assessment of method accuracy (trueness and precision) by using validation standards. Talanta 2010, 82, 1995–1998. [Google Scholar] [CrossRef] [PubMed]


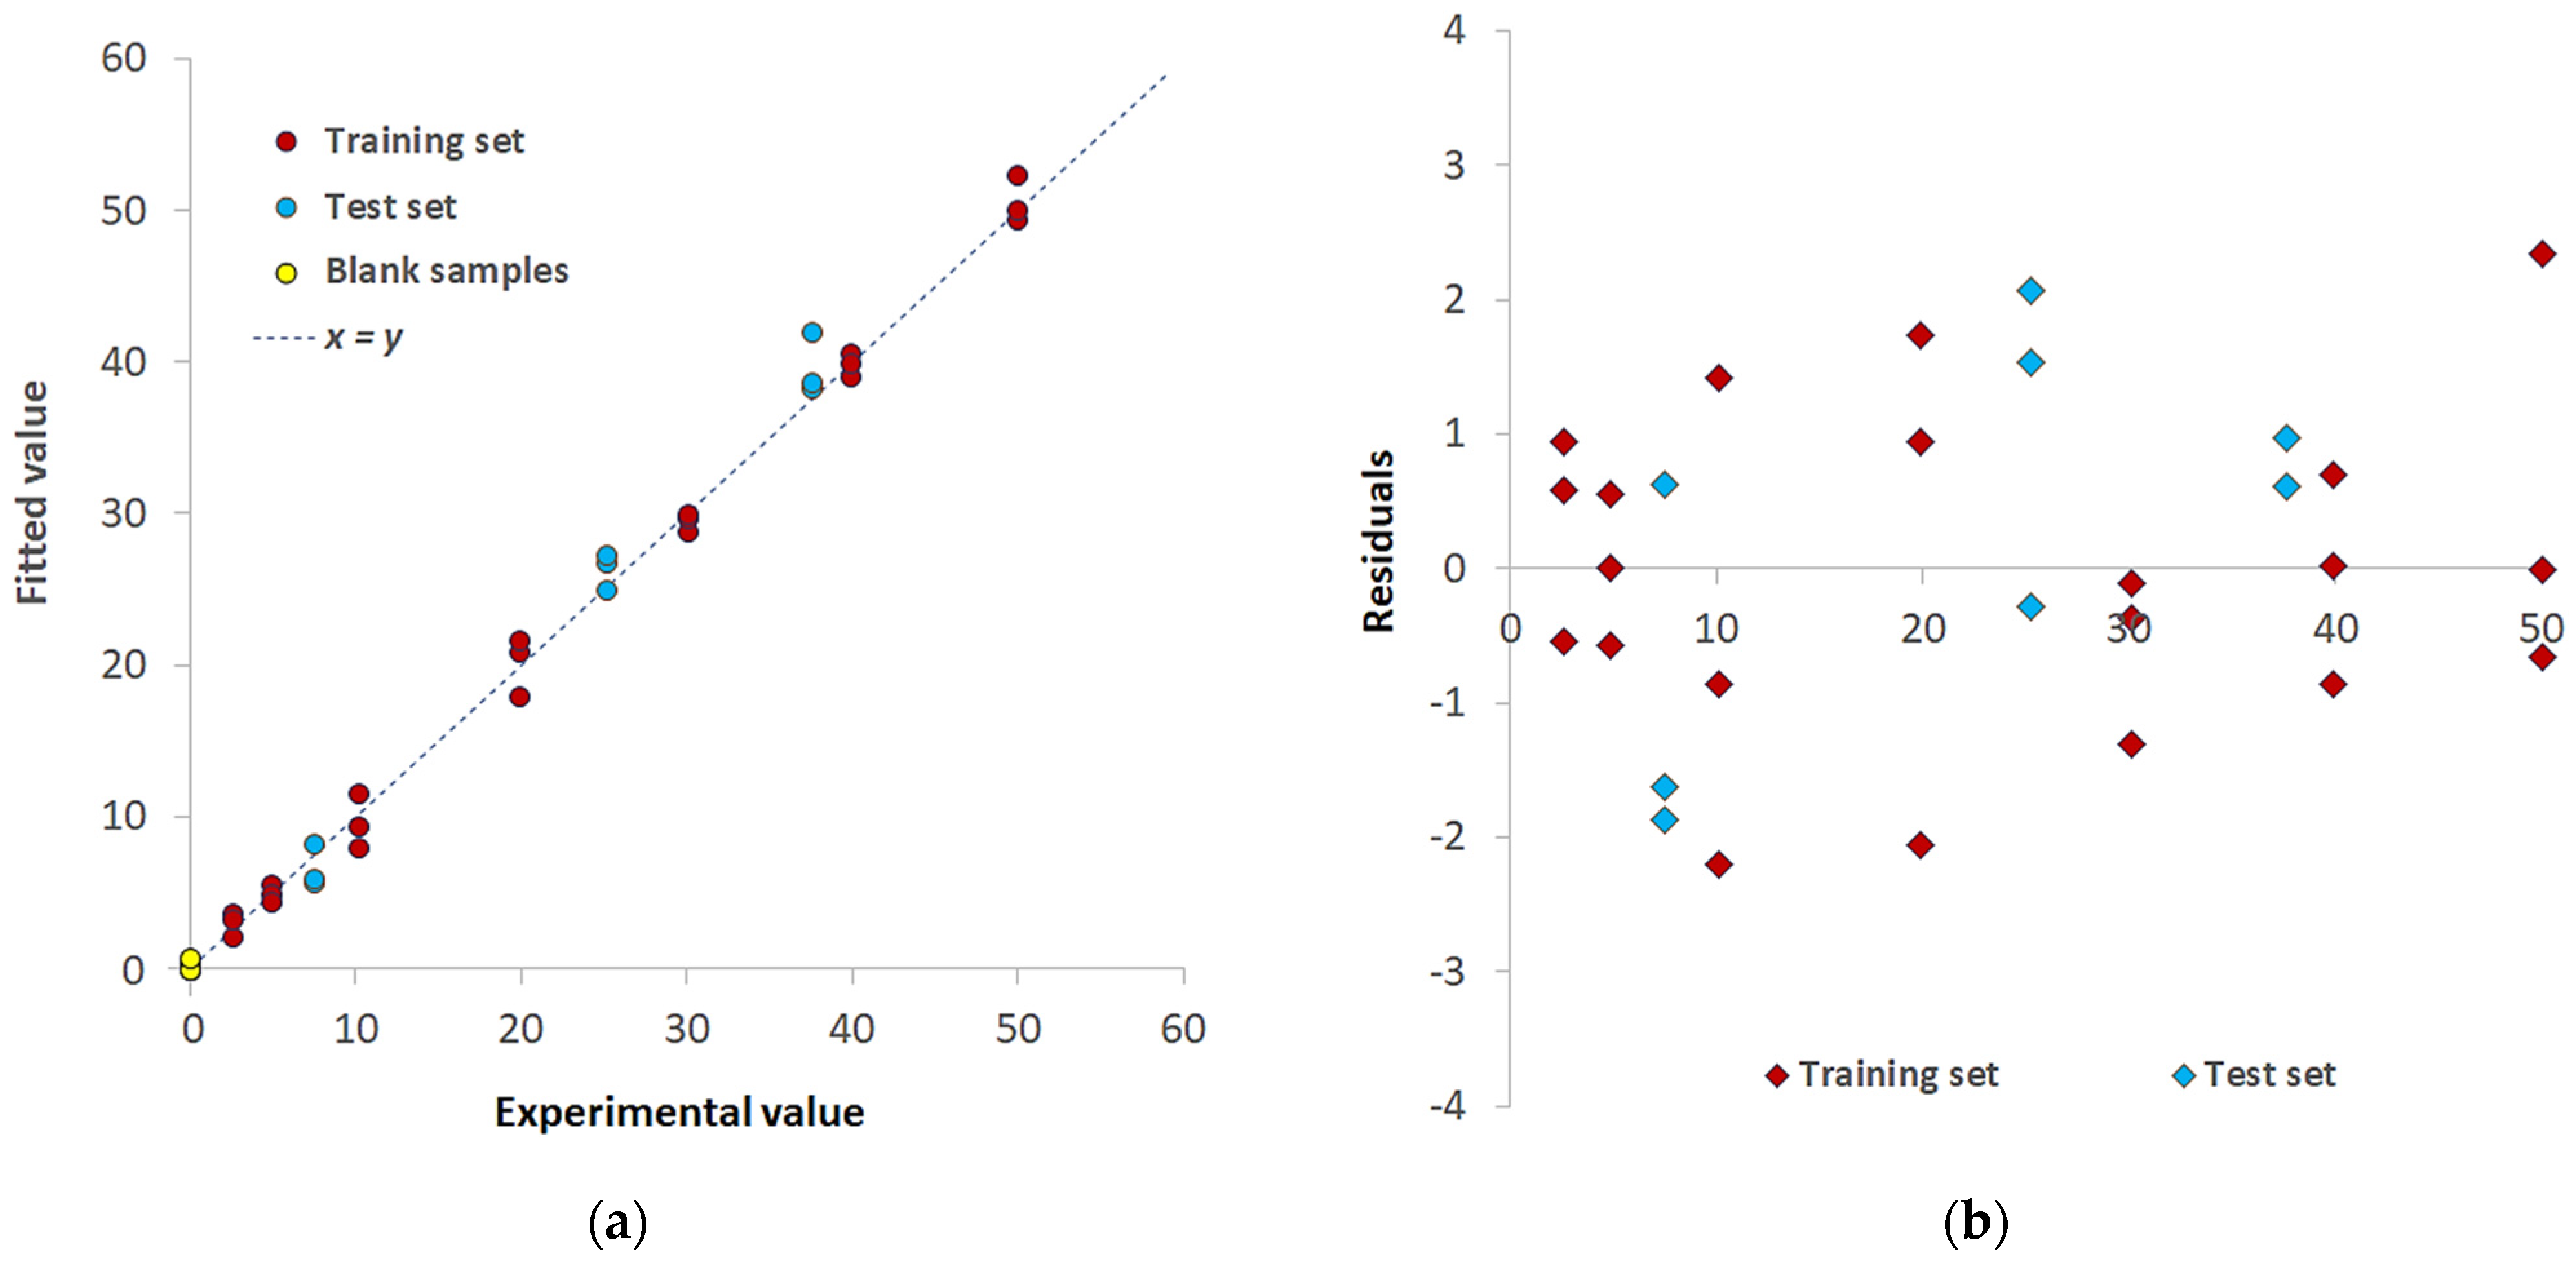
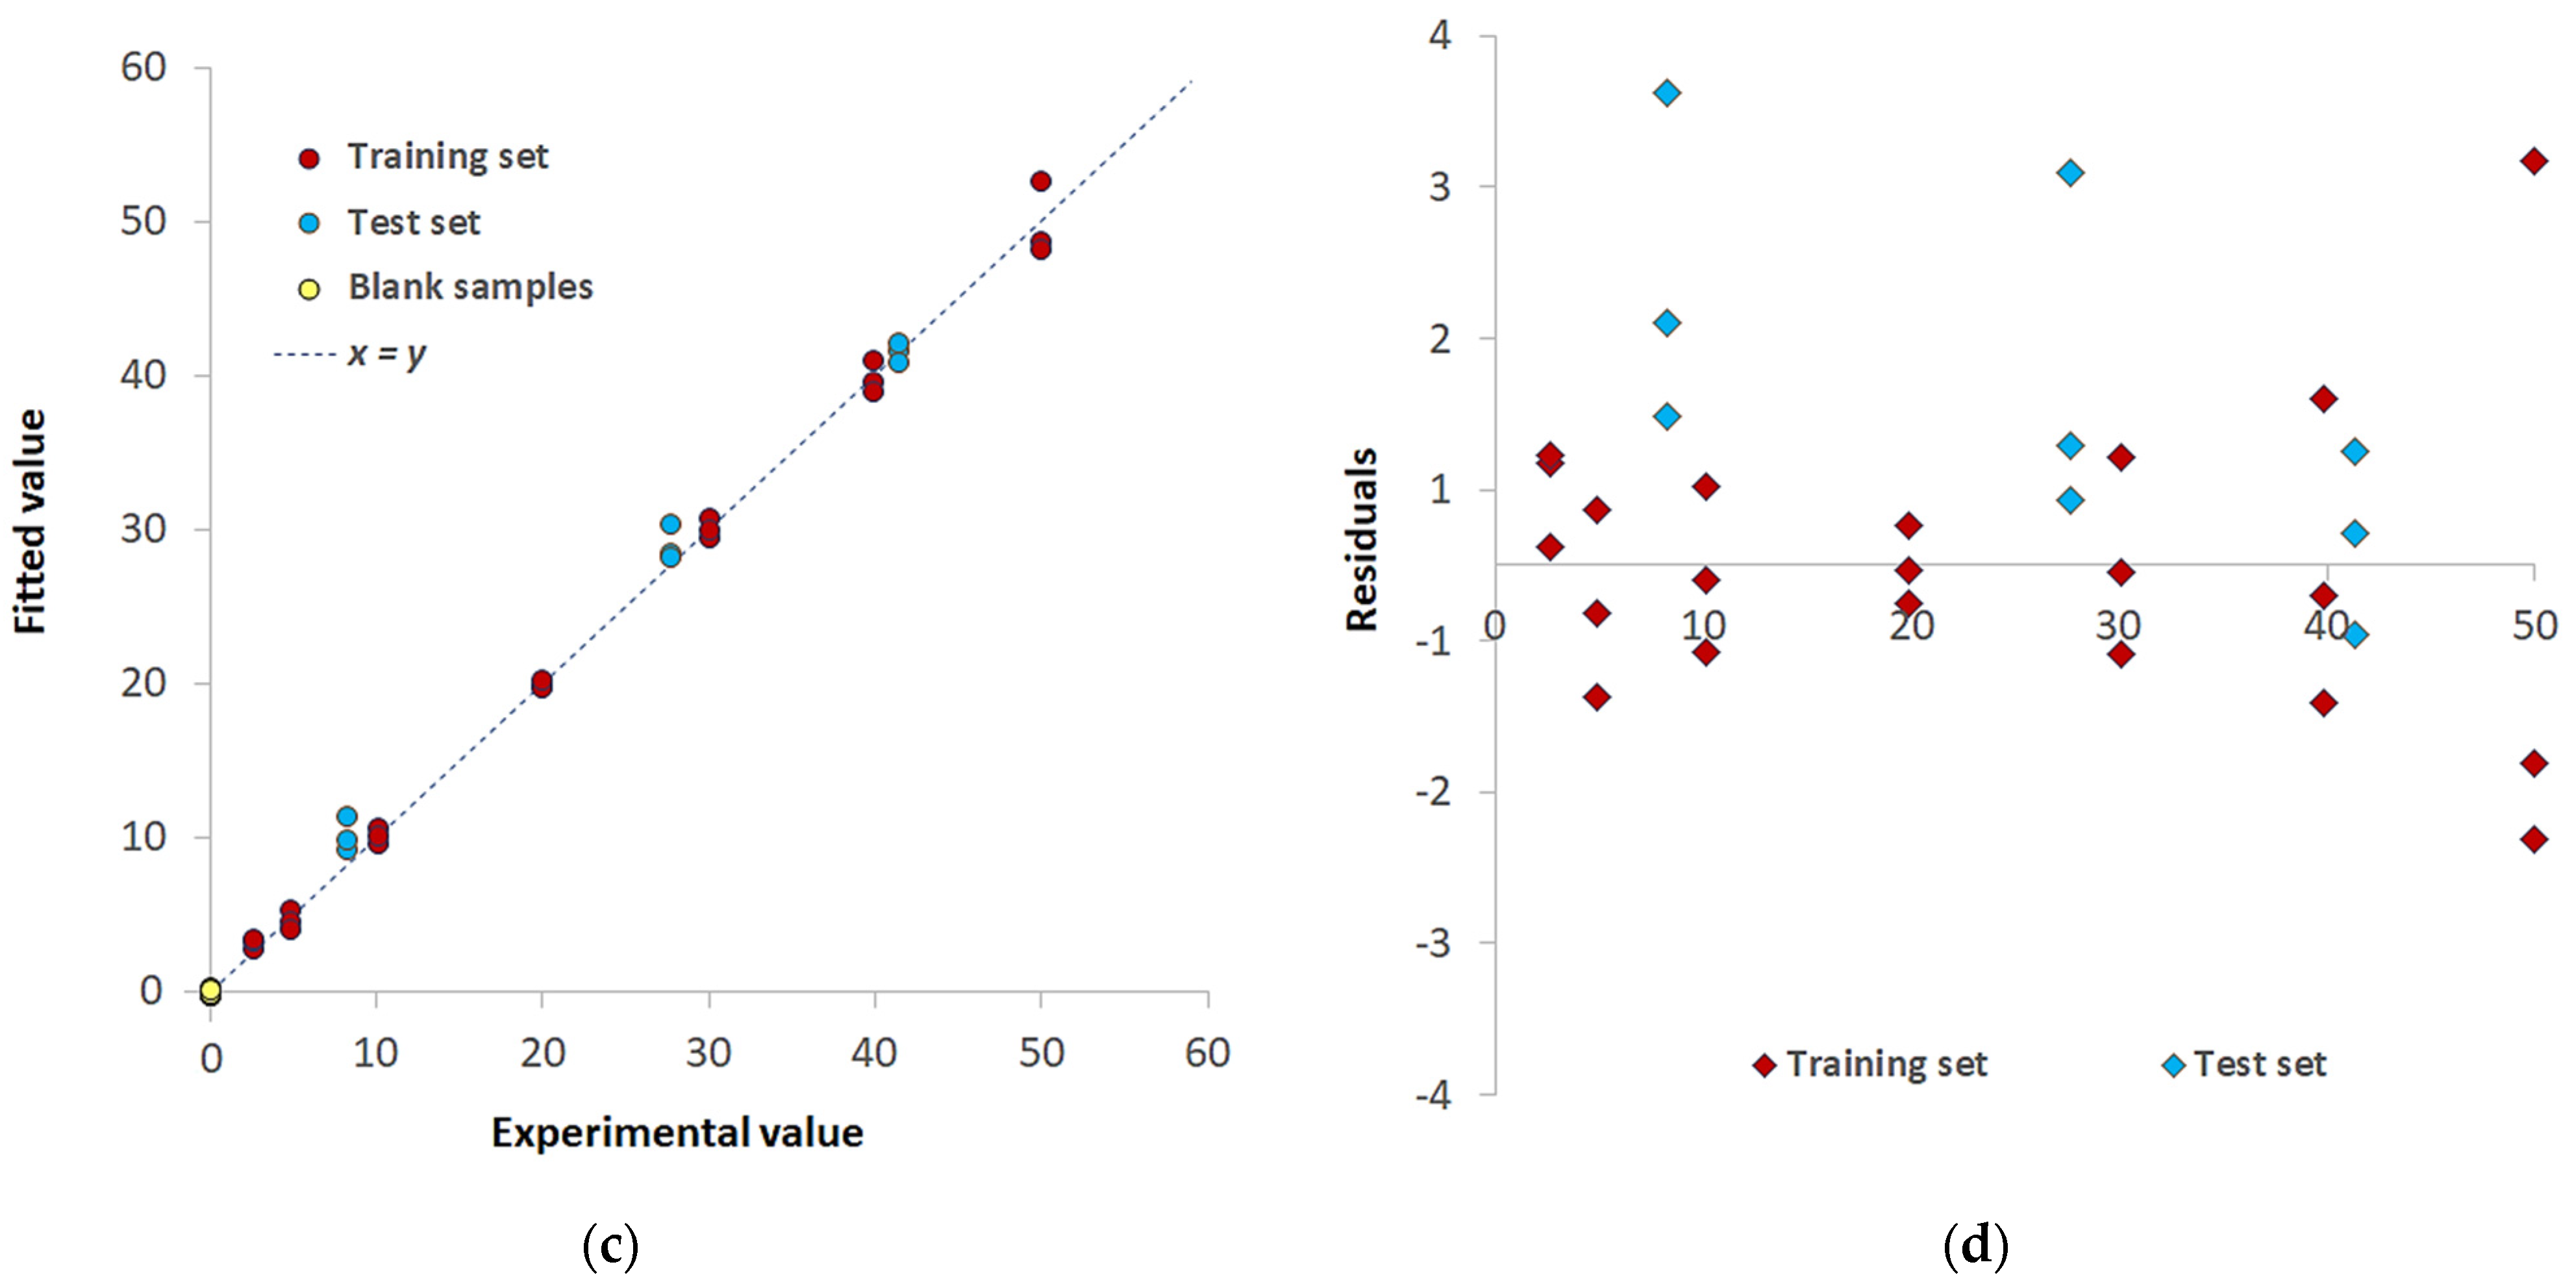
| Pd(II)/TazoC-PADs pH 2 | Pd(II)/TazoC-PADs pH 4 | Pd(II)/TazoC-PADs pH 5.5 | ||
|---|---|---|---|---|
| Training set | LVs | 5 | 8 | 8 |
| %Exp. Var. CV | 98.61 | 96.92 | 98.02 | |
| RMSECV (μM) | 2.05 | 3.08 | 2.45 | |
| r2 model | 0.994 | 0.996 | 0.997 | |
| Test set | RMSEP (μM) | 1.86 | 1.92 | 1.55 |
| r2 prediction | 0.994 | 0.991 | 0.995 | |
| Blank samples | LOD (μM) | 0.8 | 0.8 | 0.7 |
| LOQ (μM) | 2.3 | 2.4 | 2.0 |
| Sensor | LOQ (μM) | Reference |
|---|---|---|
| Rhodamine B-based test papers | 2.5 | [62] |
| Coumarin-based test papers | 10 | [63] |
| 2-(2′-hydroxyphenyl)benzothiazole-based test papers | 4.7 | [64] |
| PTAID-based test papers 1 | 100 | [65] |
| SAS-IMIs-based test silica plates 2 | 10 | [66] |
| TazoC-based test papers 3 | 2–2.4 | This work |
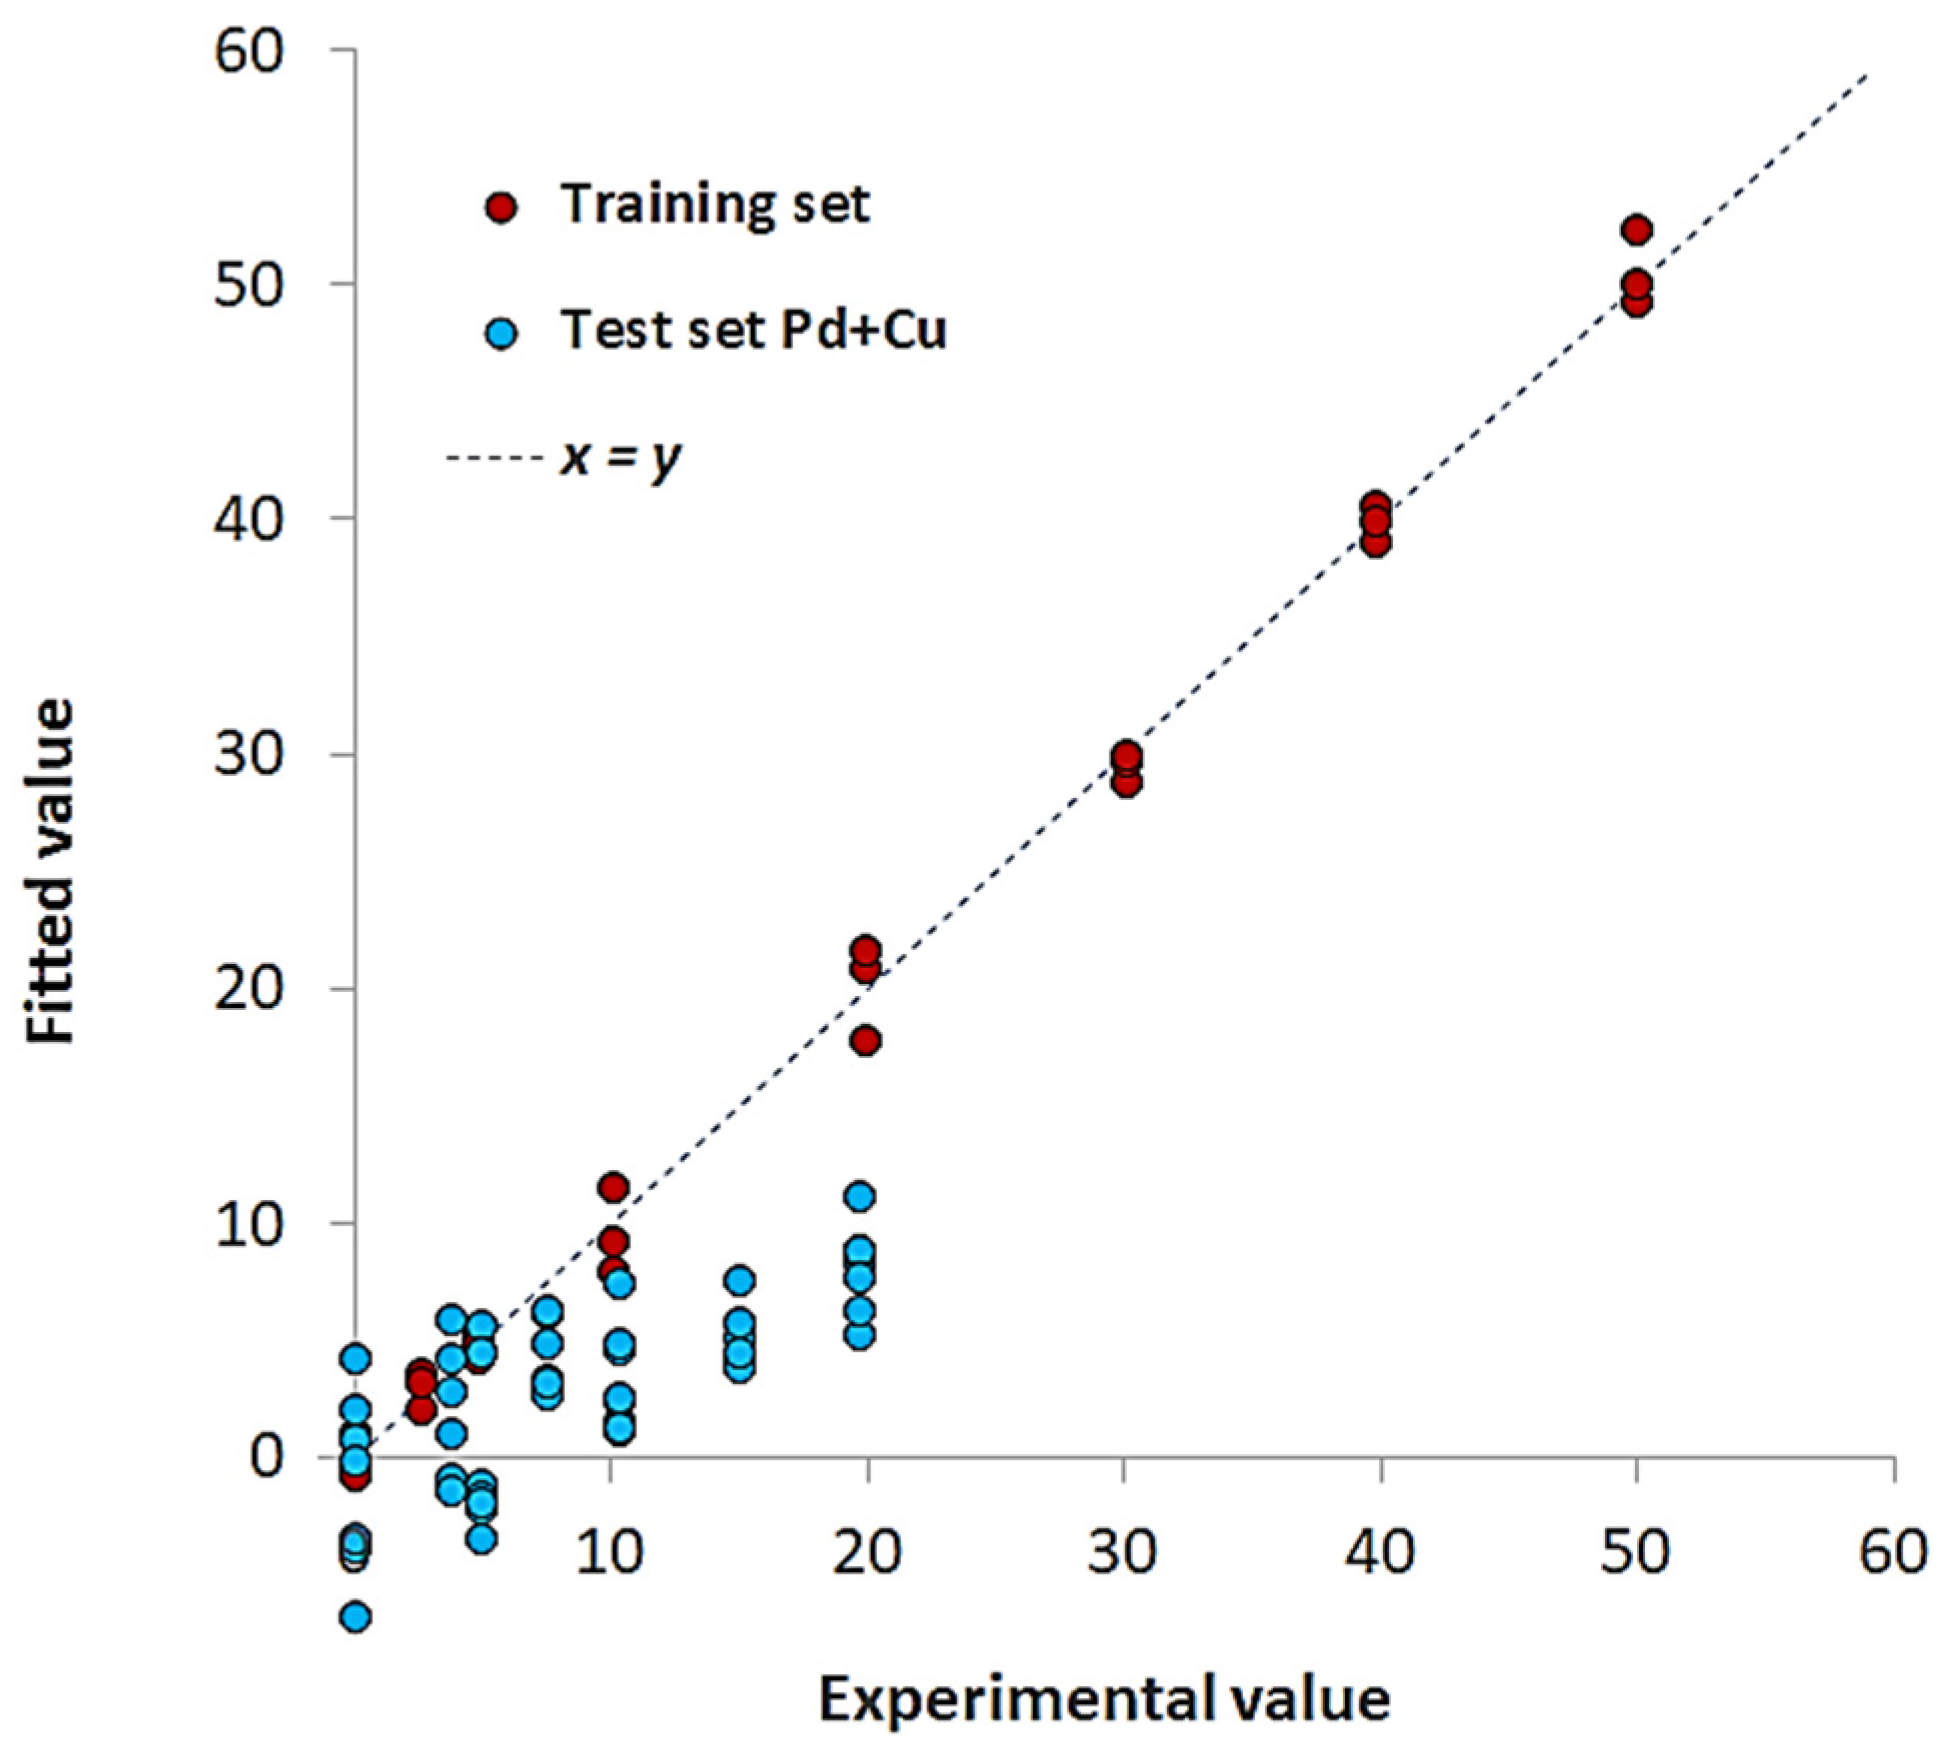
| Pd(II)+Cu(II)/TazoC-PADs pH 4 | Pd(II)+Cu(II)+Ni(II)/TazoC-PADs pH 5.5 | ||
|---|---|---|---|
| Training set | LVs | 8 | 7 |
| %Exp. Var. CV | 93.07 | 74.2 | |
| RMSECV (μM) | 1.92 | 2.33 | |
| r2 model | 0.992 | 0.995 | |
| Test set | RMSEP (μM) | 1.41 | 0.86 |
| r2 prediction | 0.993 | 0.990 |
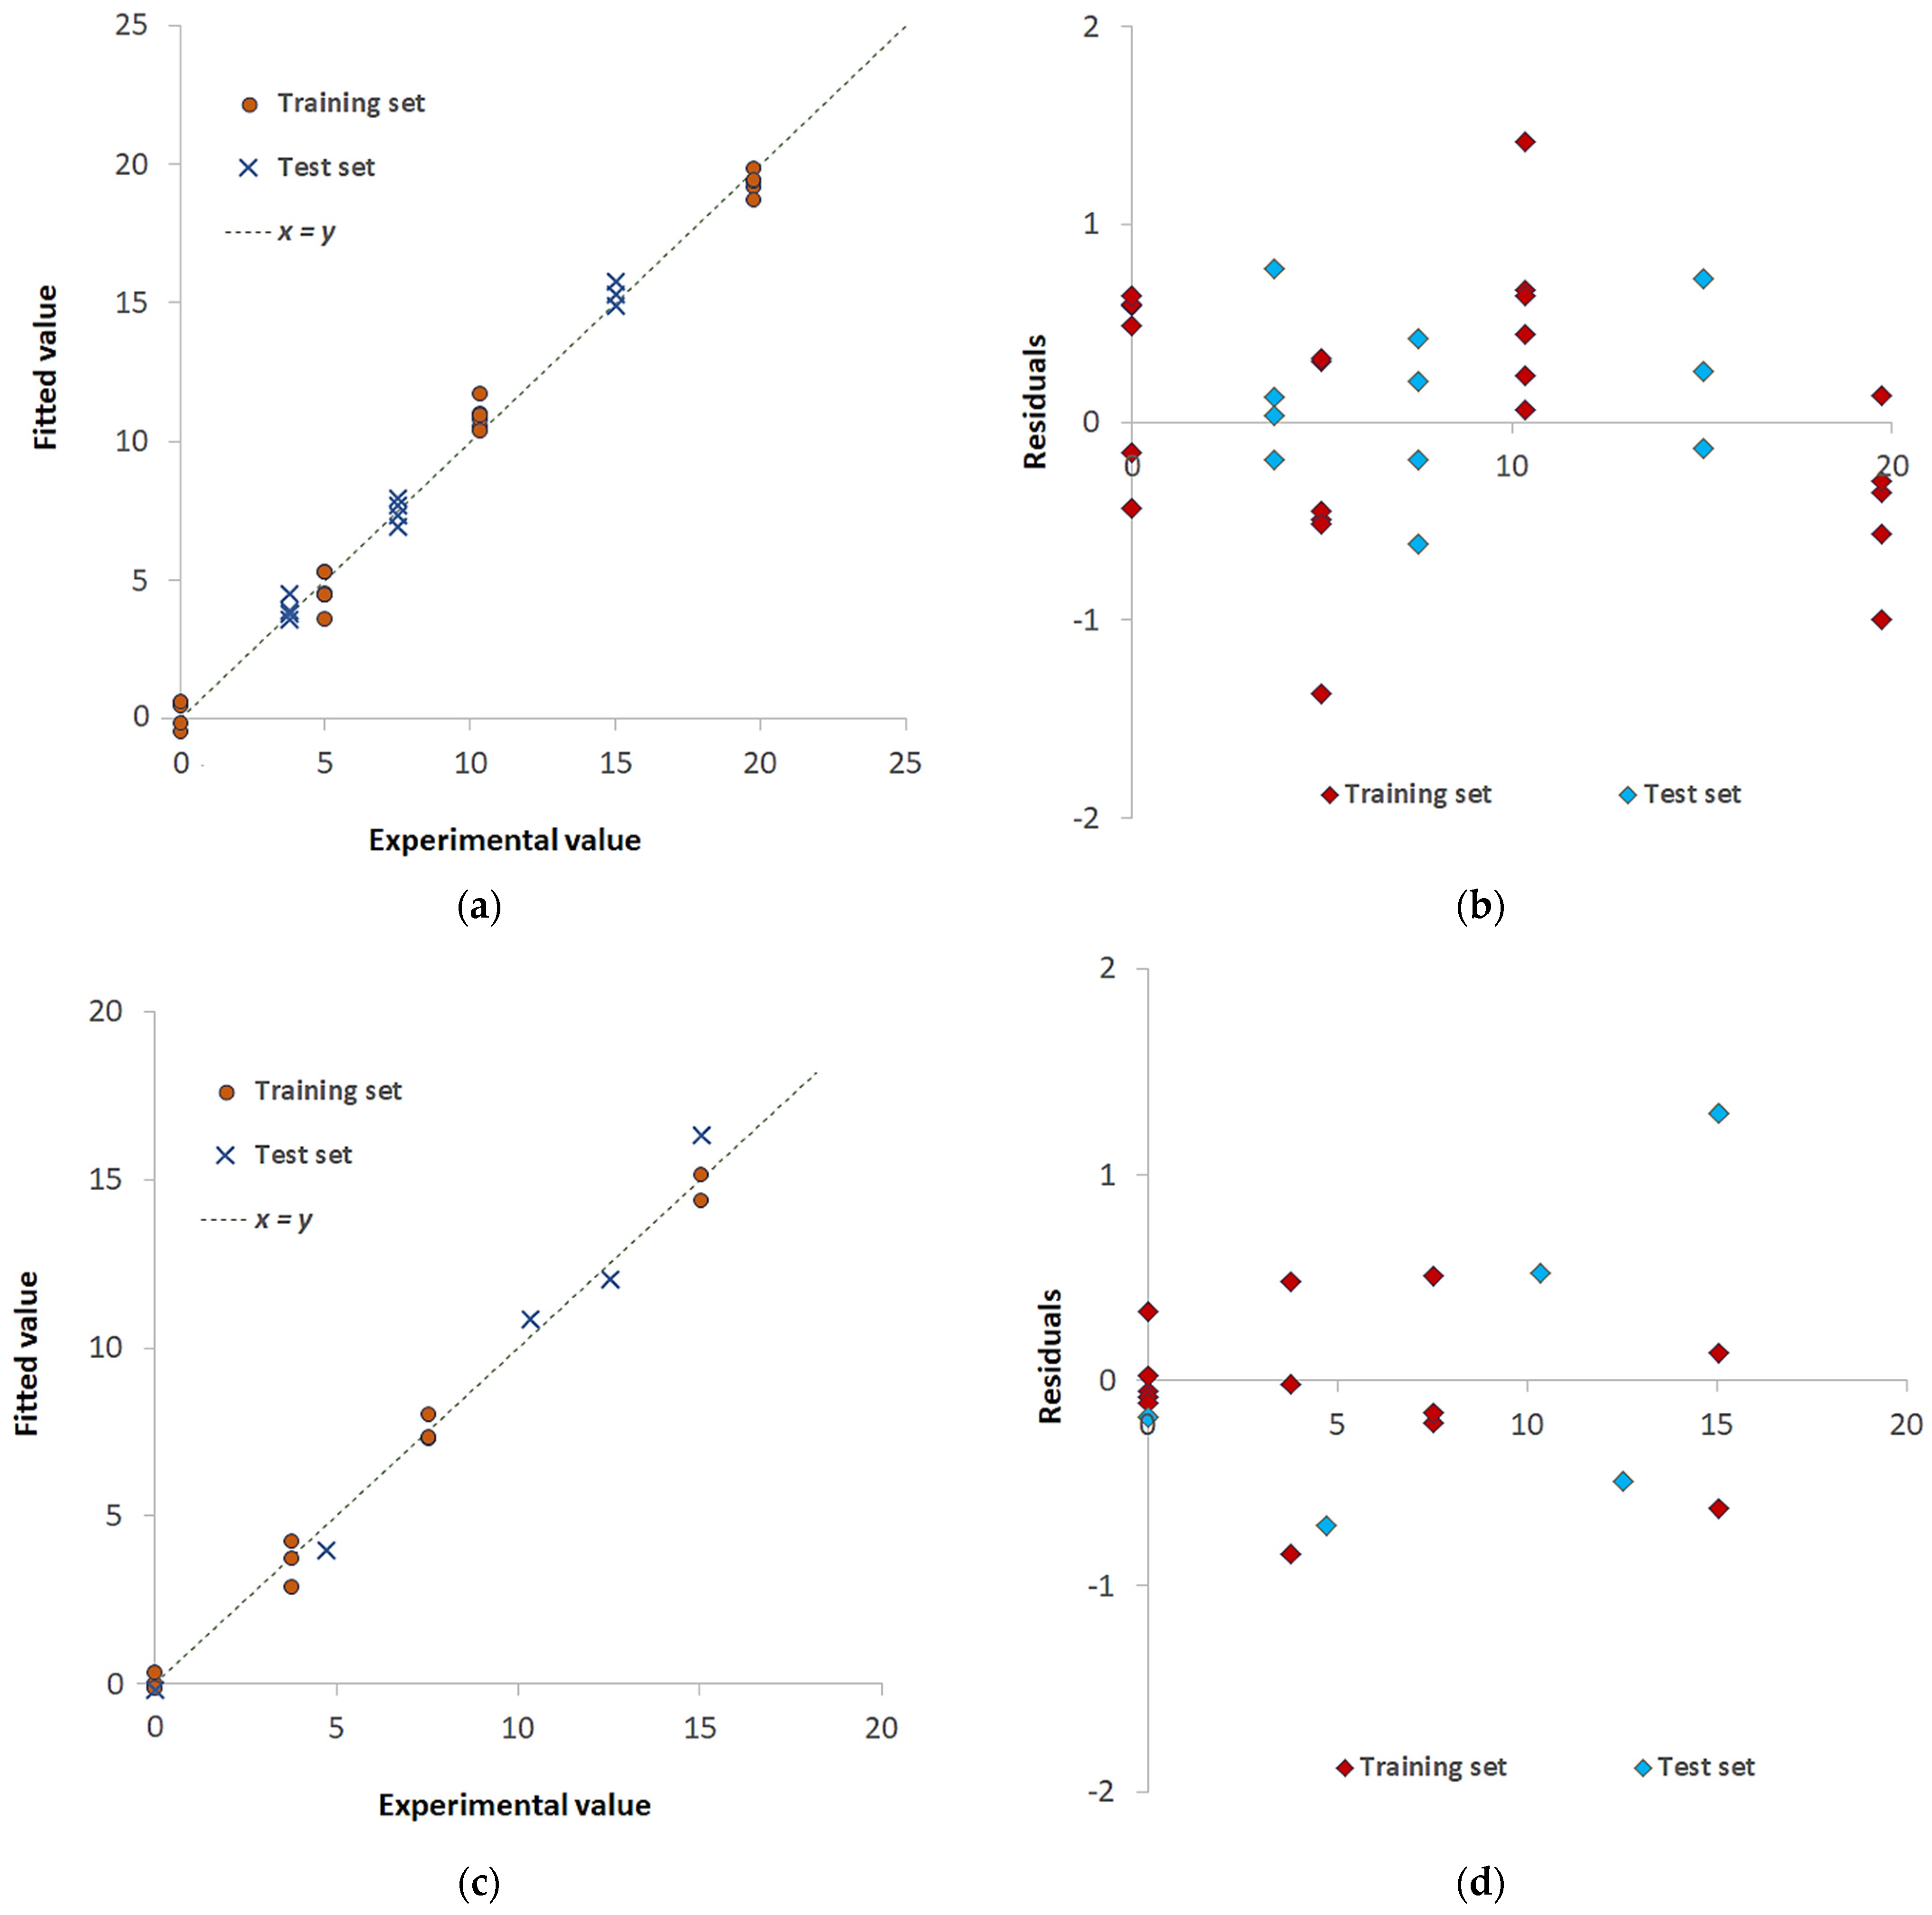
| Pd(II)/TazoC-PADs TW | ||
|---|---|---|
| Training set | LVs | 5 |
| %Exp. Var. CV | 98.73 | |
| RMSECV (μM) | 1.96 | |
| r2 model | 0.995 | |
| Test set | RMSEP (μM) | 2.06 |
| r2 prediction | 0.992 |
| Pd(II) Added (μM) | Pd(II) FoundICP-OES (µM) | Pd(II) FoundTazoC-PADs (µM) | Rc% | E% |
|---|---|---|---|---|
| 7.5 | 7.4(3) | 8.1(5) | 108 | 8 |
| 25.2 | 25.0(4) | 26(1) | 103 | 3 |
| 44.6 | 45.2(7) | 44(2) | 98 | −2 |
Disclaimer/Publisher’s Note: The statements, opinions and data contained in all publications are solely those of the individual author(s) and contributor(s) and not of MDPI and/or the editor(s). MDPI and/or the editor(s) disclaim responsibility for any injury to people or property resulting from any ideas, methods, instructions or products referred to in the content. |
© 2023 by the authors. Licensee MDPI, Basel, Switzerland. This article is an open access article distributed under the terms and conditions of the Creative Commons Attribution (CC BY) license (https://creativecommons.org/licenses/by/4.0/).
Share and Cite
Alberti, G.; Magnaghi, L.R.; Iurato, M.; Zanoni, C.; Biesuz, R. Colorimetric Paper-Based Analytical Devices (PADs) Backed by Chemometrics for Pd(II) Detection. Sensors 2023, 23, 7425. https://doi.org/10.3390/s23177425
Alberti G, Magnaghi LR, Iurato M, Zanoni C, Biesuz R. Colorimetric Paper-Based Analytical Devices (PADs) Backed by Chemometrics for Pd(II) Detection. Sensors. 2023; 23(17):7425. https://doi.org/10.3390/s23177425
Chicago/Turabian StyleAlberti, Giancarla, Lisa Rita Magnaghi, Marzia Iurato, Camilla Zanoni, and Raffaela Biesuz. 2023. "Colorimetric Paper-Based Analytical Devices (PADs) Backed by Chemometrics for Pd(II) Detection" Sensors 23, no. 17: 7425. https://doi.org/10.3390/s23177425
APA StyleAlberti, G., Magnaghi, L. R., Iurato, M., Zanoni, C., & Biesuz, R. (2023). Colorimetric Paper-Based Analytical Devices (PADs) Backed by Chemometrics for Pd(II) Detection. Sensors, 23(17), 7425. https://doi.org/10.3390/s23177425