
Enhancing Energy Efficiency and Fast Decision Making for Medical Sensors in Healthcare Systems: An Overview and Novel Proposal


Abstract
:1. Introduction
2. Related Work
- (A)
- The load balancing of IoT networks among the four layers (Edge, Mist, Fog, and Cloud).
- (B)
- The effective use of fuzzy logic systems in networking.
2.1. Load Balancing among the Four IoT Network Layers
- In the task selection stage, tasks are prioritized based on their deadlines.
- The VM filtering stage aims to select the appropriate security level.
- The VM selection stage determines the suitable VM for task processing based on the earliest estimated finish time.
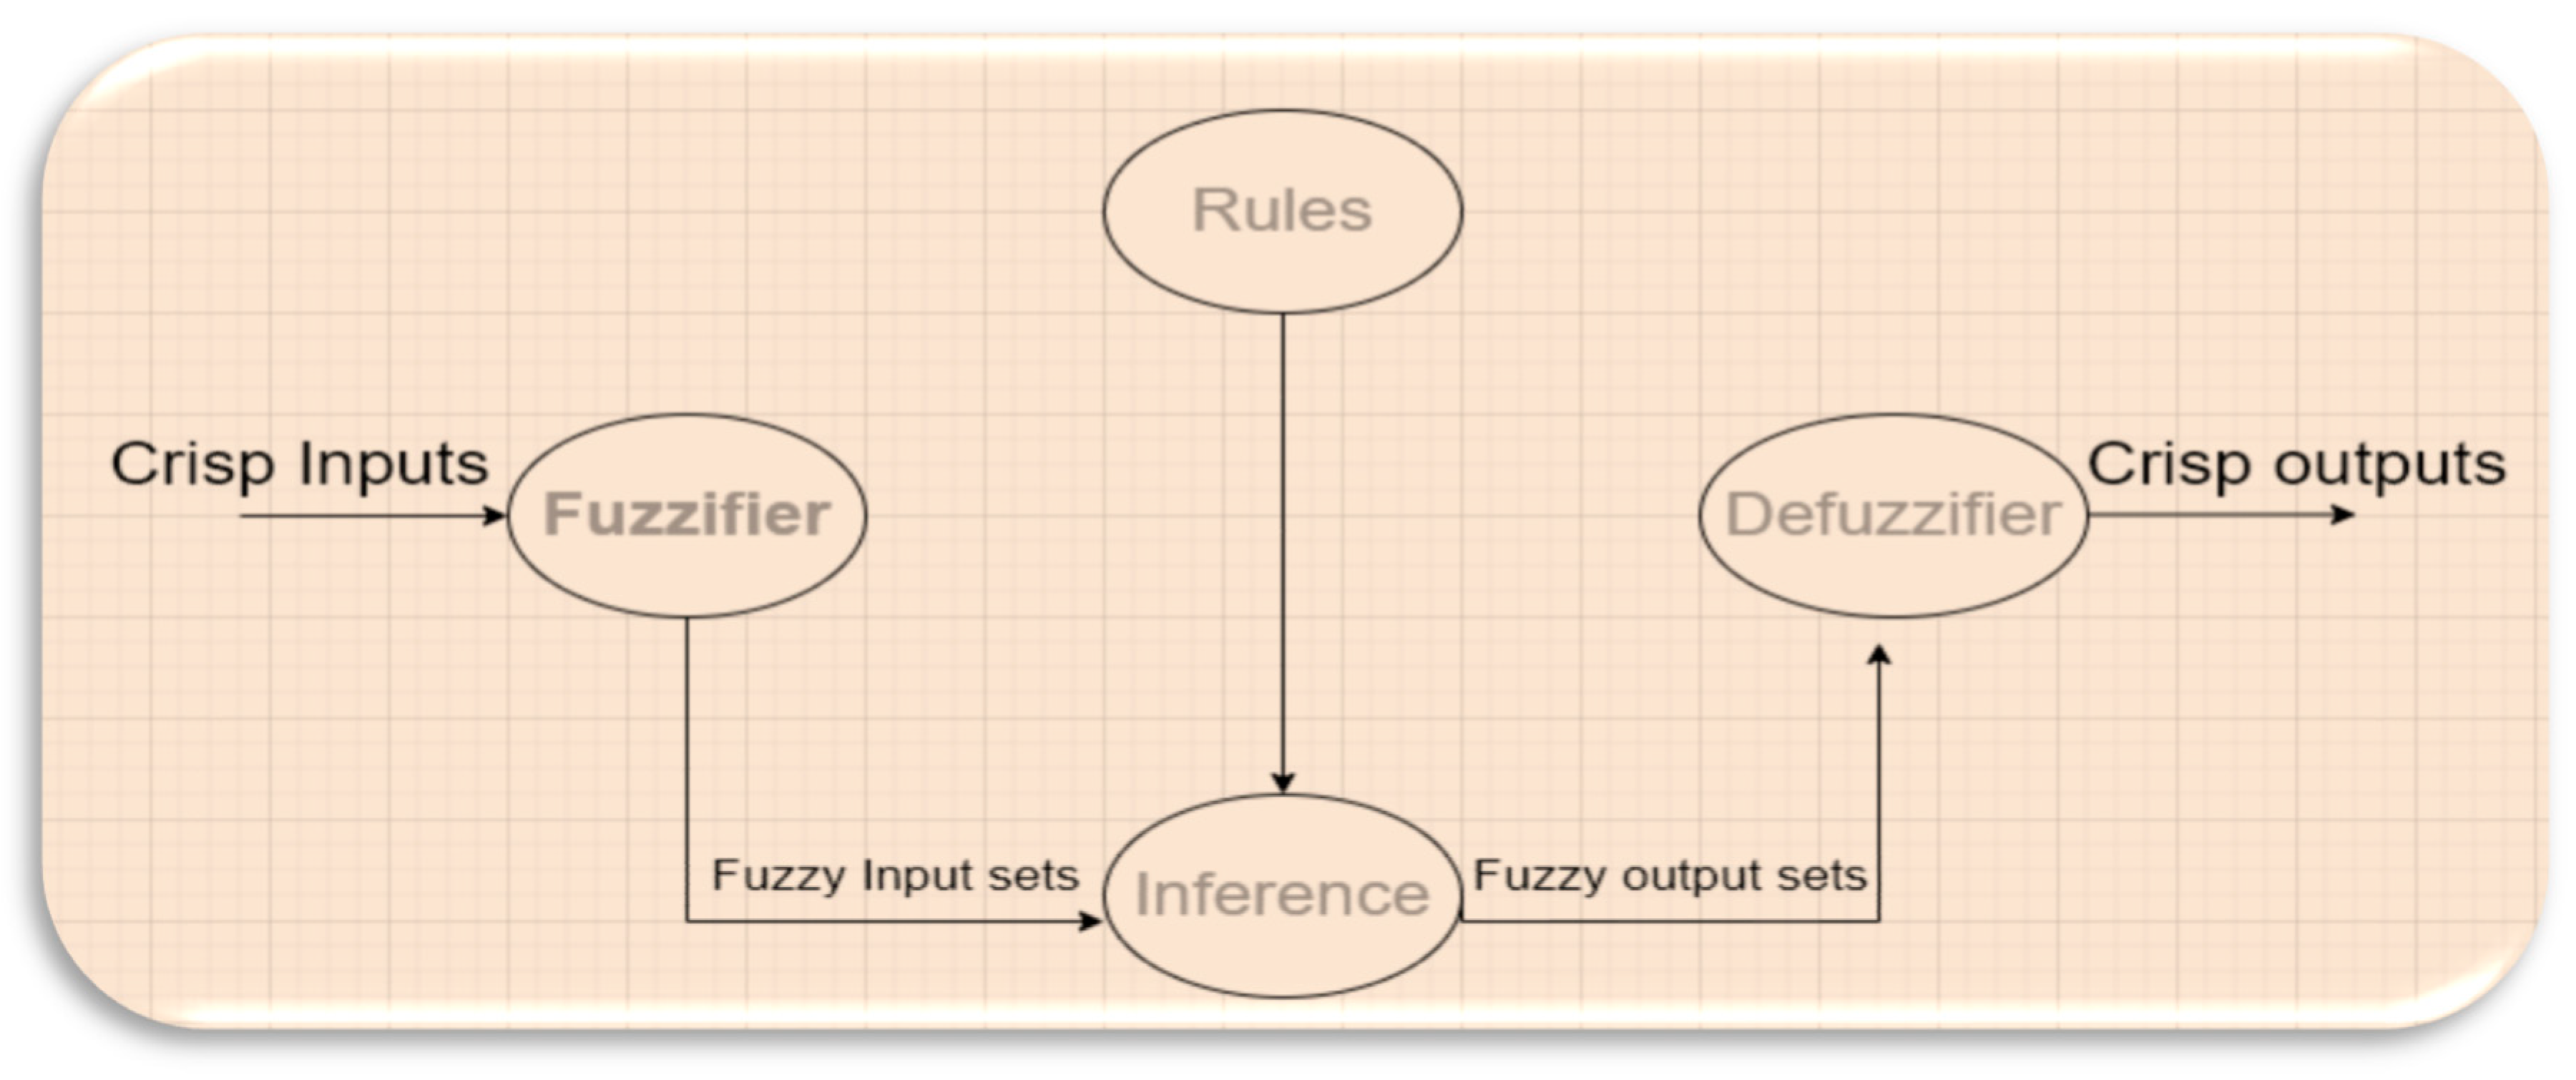
2.2. Fuzzy Logic and Load Balancing
3. Motivation and Aims: Proposed Model
3.1. Our Proposed MFHS Aims to Achieve the Following
- Decision making at the extreme edge of the network, facilitated by the Mist broker, to enable fast decision making and reduce processing time.
- Estimating patients’ healthcare conditions and allocating resources based on their conditions.
- Prioritizing data packets for patients with critical conditions, ensuring they are served first.
- Minimizing transfer time by allocating resources at the Mist broker, located at the extreme edge of the network.
- Reducing power consumption by eliminating the need for data offloading at all layers except the Mist layer.
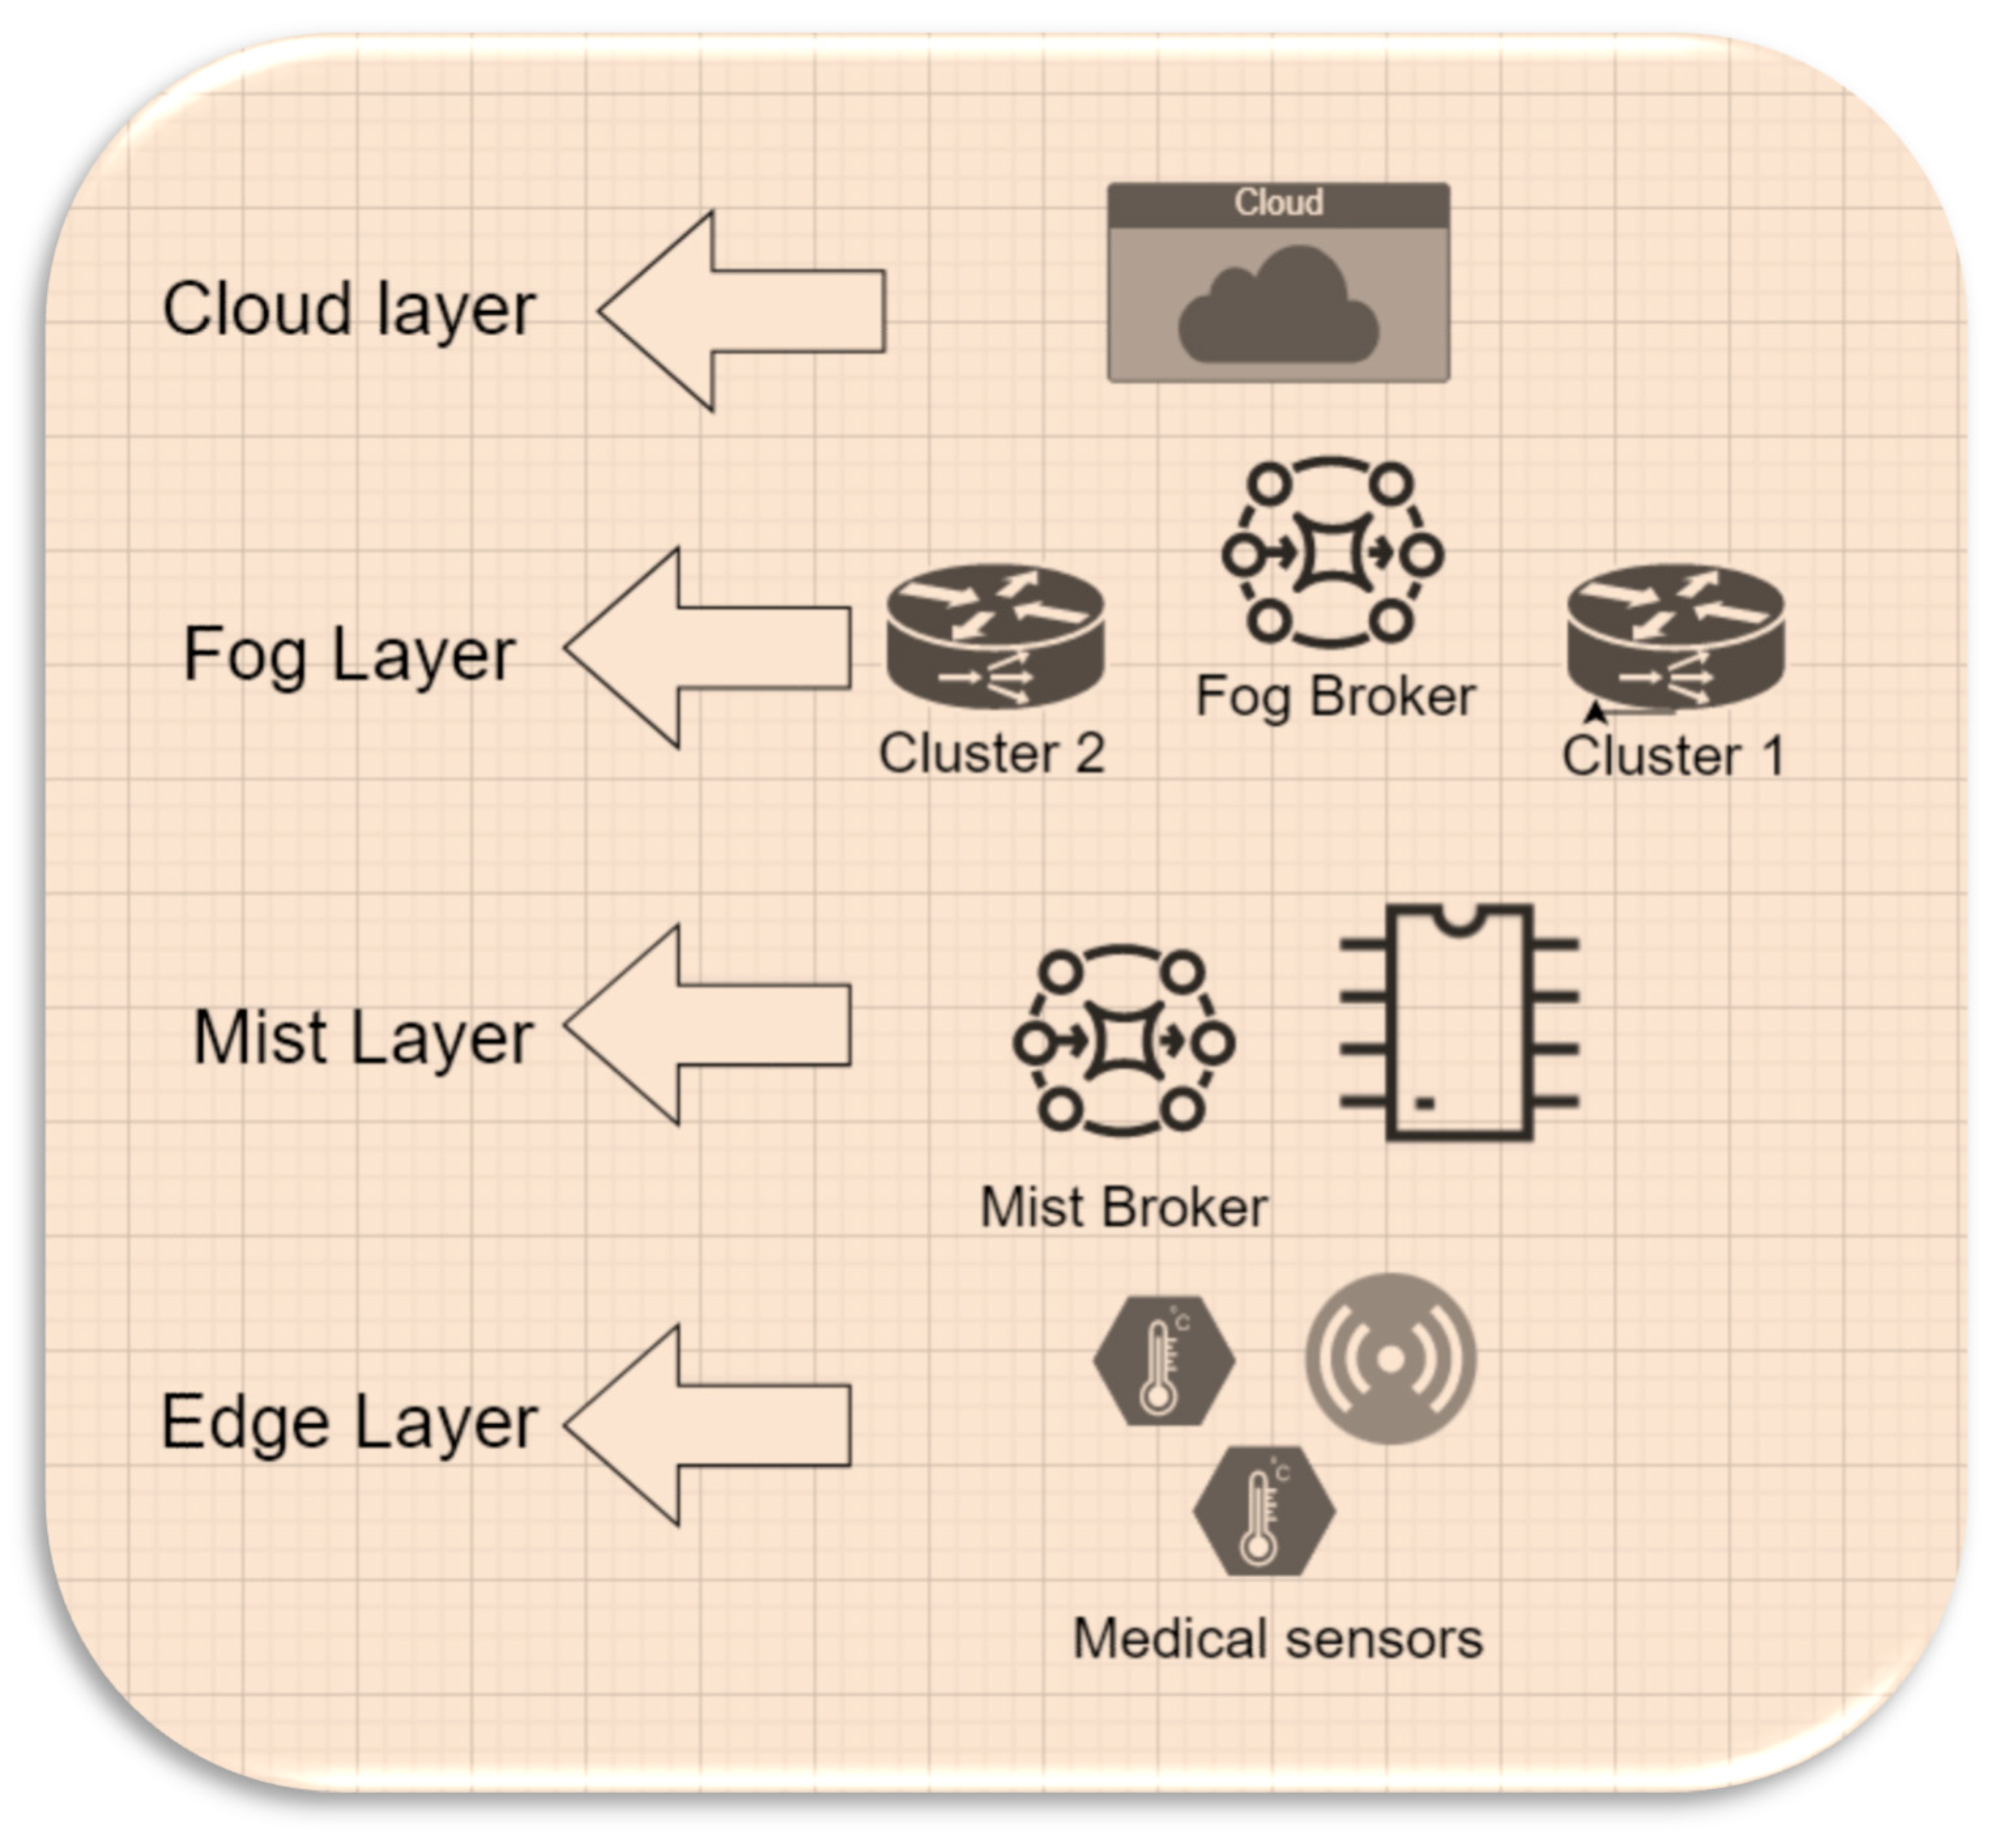
3.2. The Proposed Approach
- (1)
- Edge layer: It collects medical data such as body temperature using sensor devices. The Edge layer sends the sensed data to the Mist layer, which categorizes data based on the patient’s condition. The Edge layer only sends the sensed data that a Mist layer requires for categorization, which means some medical sensor devices can be removed without affecting the system.
- (2)
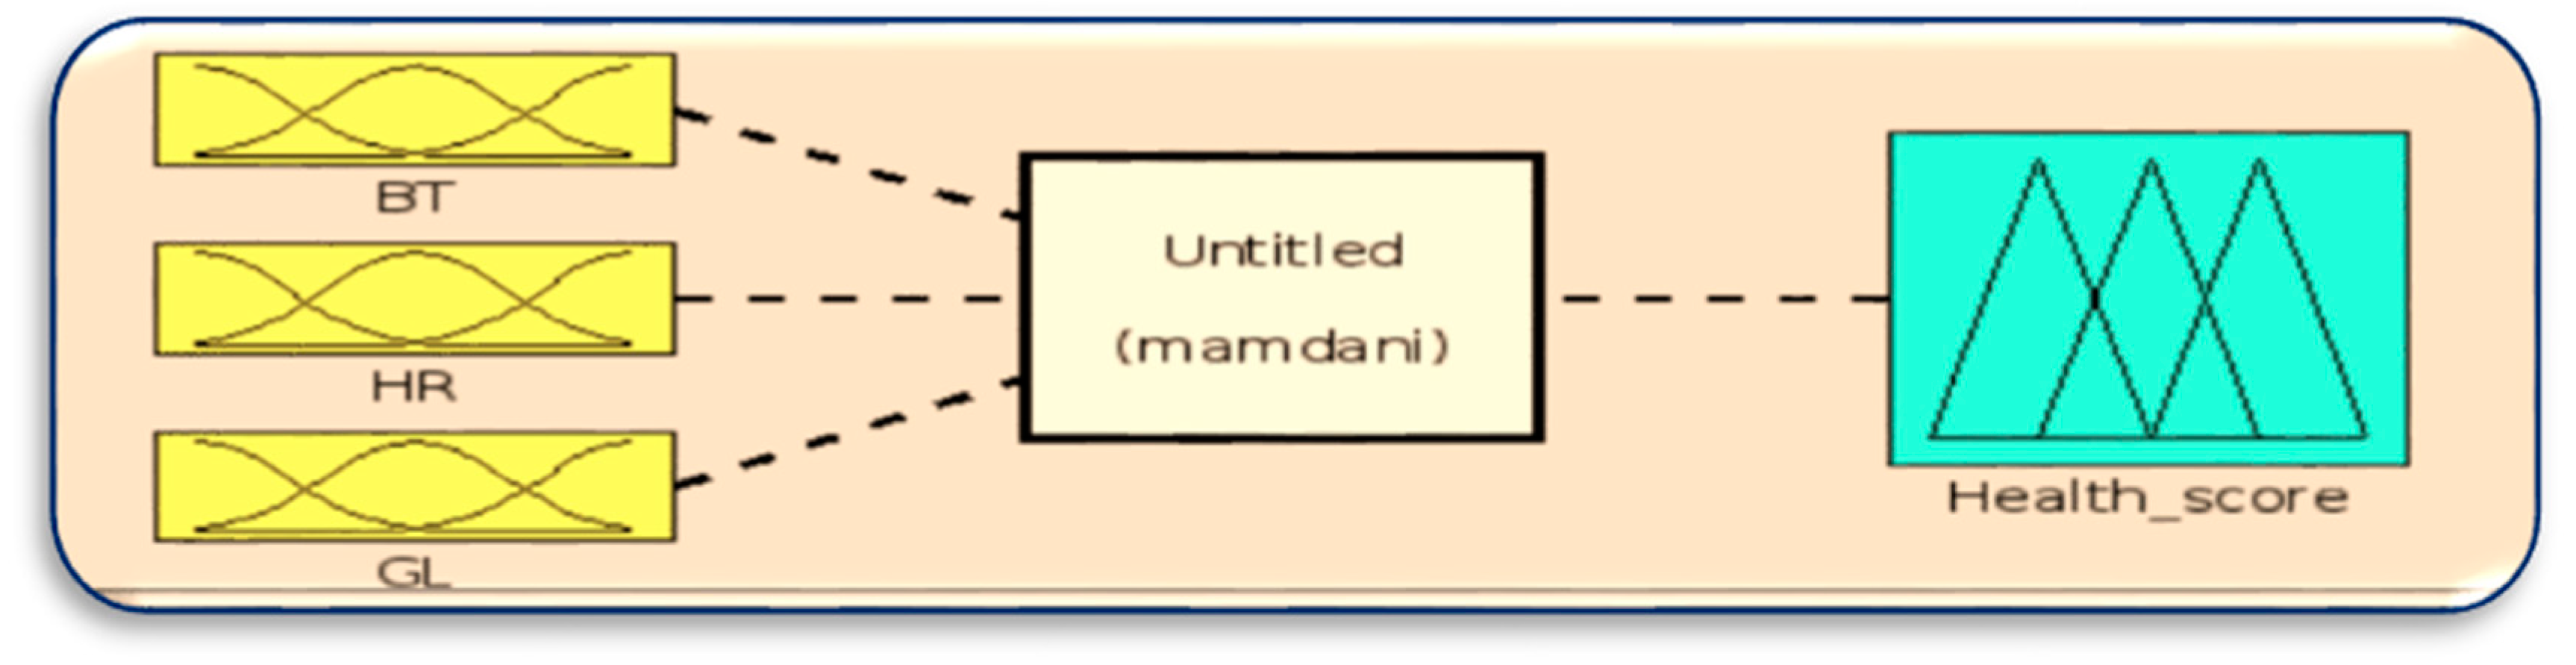
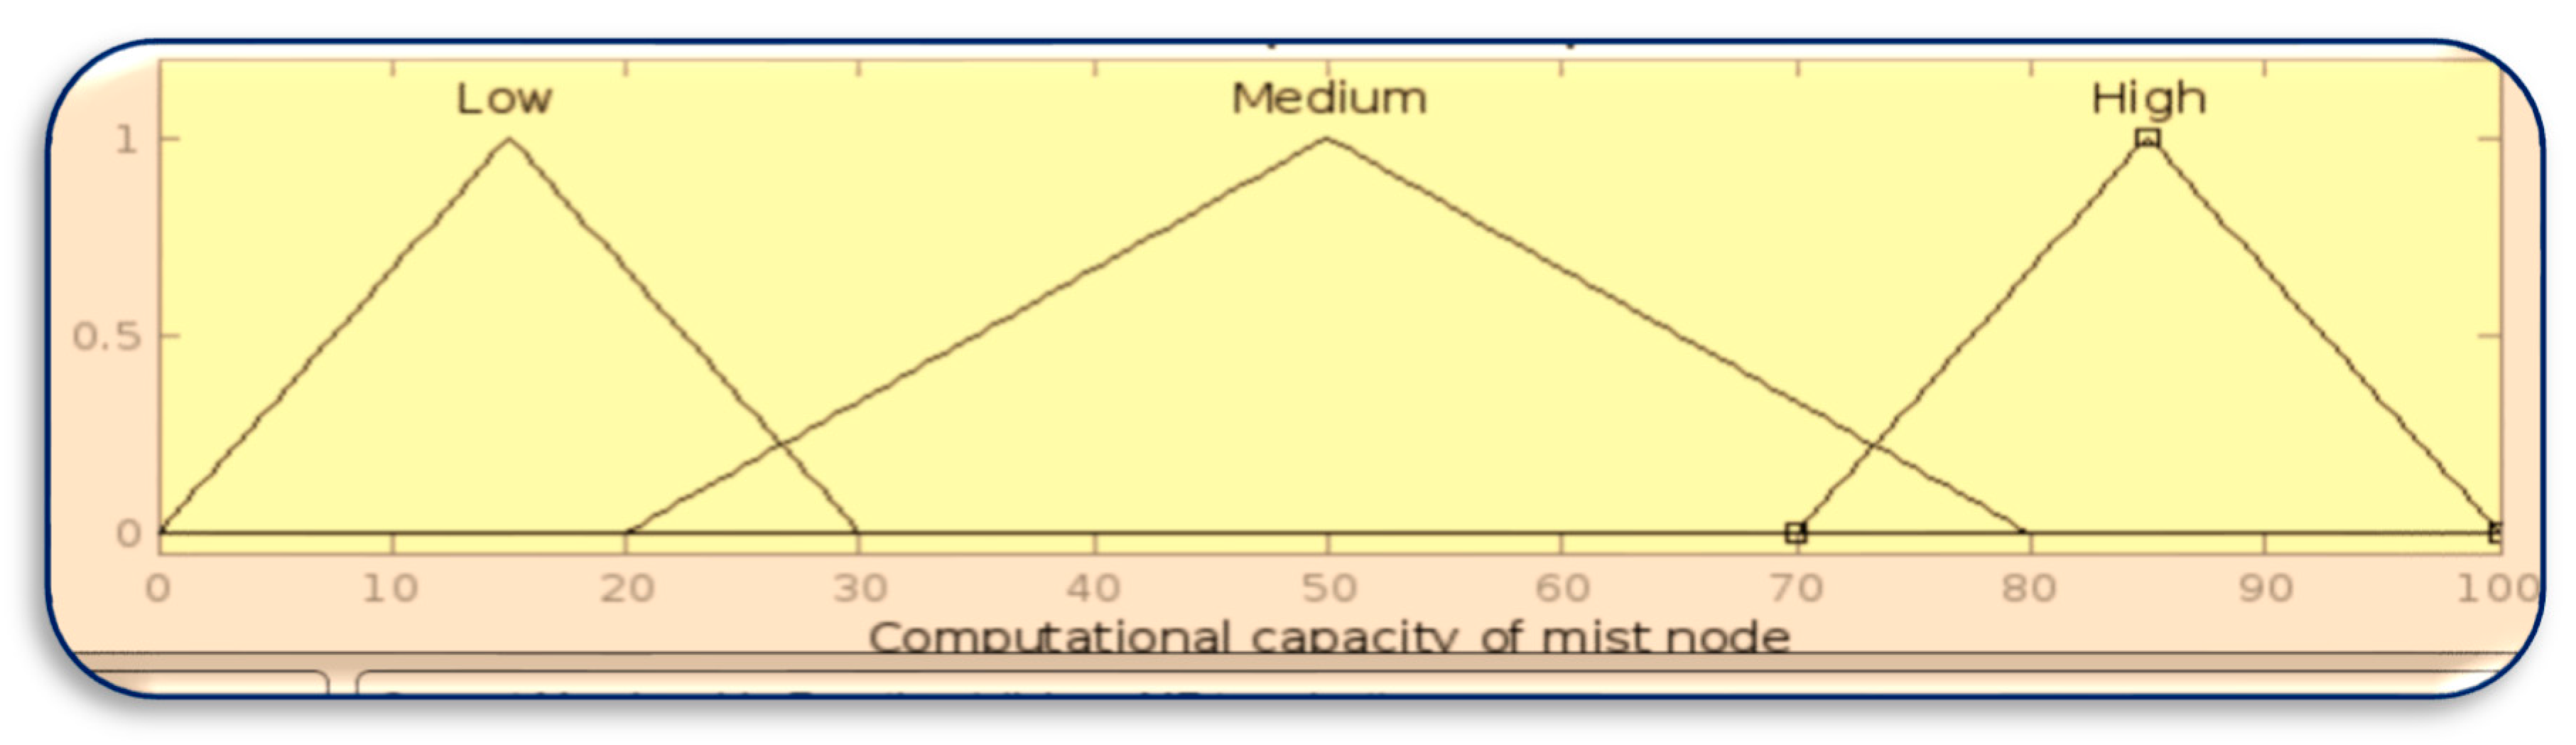
- Mist layer: The Mist layer receives the sensed data from the Edge layer. It categorizes data based on the patient’s health condition and the computing capacity of Mist using two fuzzy logic systems, namely MFHS1 and MFHS2. MFHS1 focuses on data categorization, where the Mist broker employs fuzzy rules to classify the data based on the patient’s health condition and its priority. On the other hand, MFHS2 is responsible for estimating the computing capacity of the Mist nodes, enabling the system to determine whether the data should be processed in the Fog, Cloud, or within the Mist layer itself.
- (3)
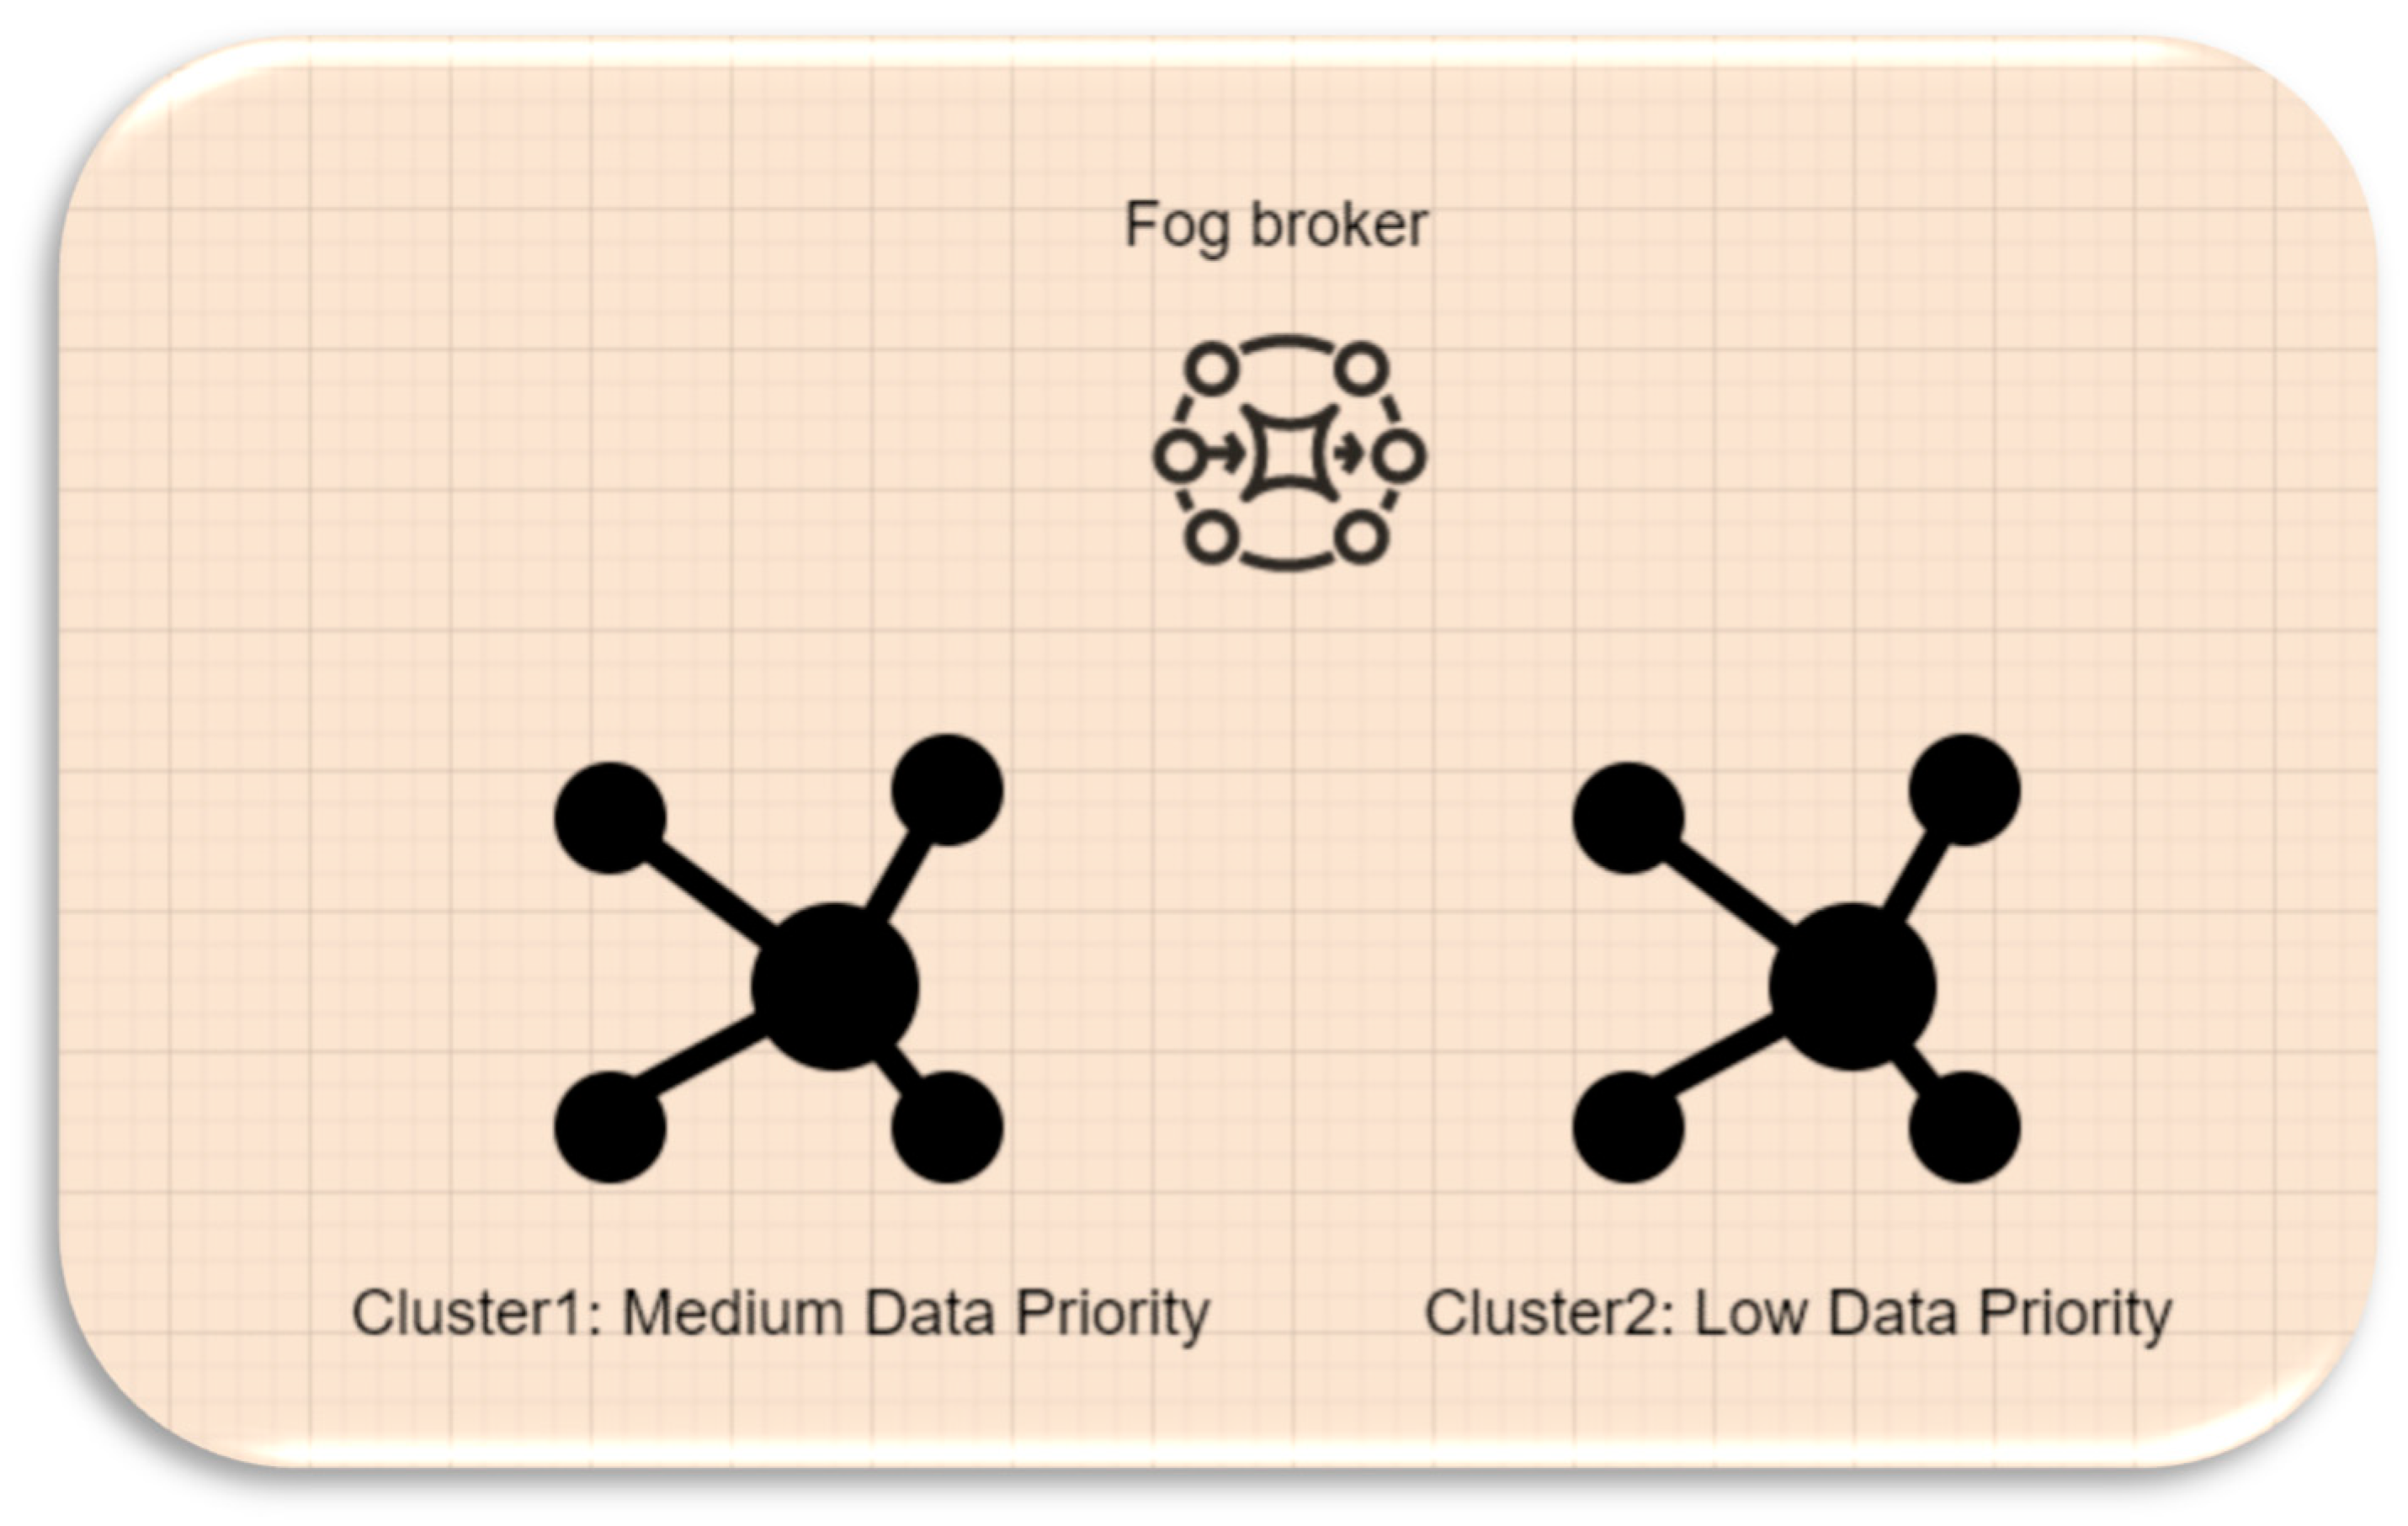
- Fog layer: The Fog layer via the Fog broker is responsible for exceptional cases, such as when the Mist layer is unable to process data due to storage or capacity limitations. The Fog broker takes charge of distributing these data among the Fog nodes based on the clustering of these nodes.
- (4)
- Cloud layer: The Cloud layer receives high-priority cases directly from the Mist layer for processing. Additionally, it acts as a recipient of data when the computing capacity of both the Mist and Fog nodes is insufficient to handle the workload.
4. Phases of the Proposed Approach
4.1. Phase 1
4.2. Phase 2
- C is the capacity of a Mist node.
- Pi is the packet arrival rate for i as a data packet.
- Si is the size of the data packet i.
- n is the number of data packets.
capacities of Mist node)
4.3. Fog Broker
5. Experimental Setup
6. Evaluation
7. Results
7.1. Energy Consumption
7.1.1. Etr Calculations
7.1.2. Ec and Ea Calculations
7.1.3. Energy Cost Comparison
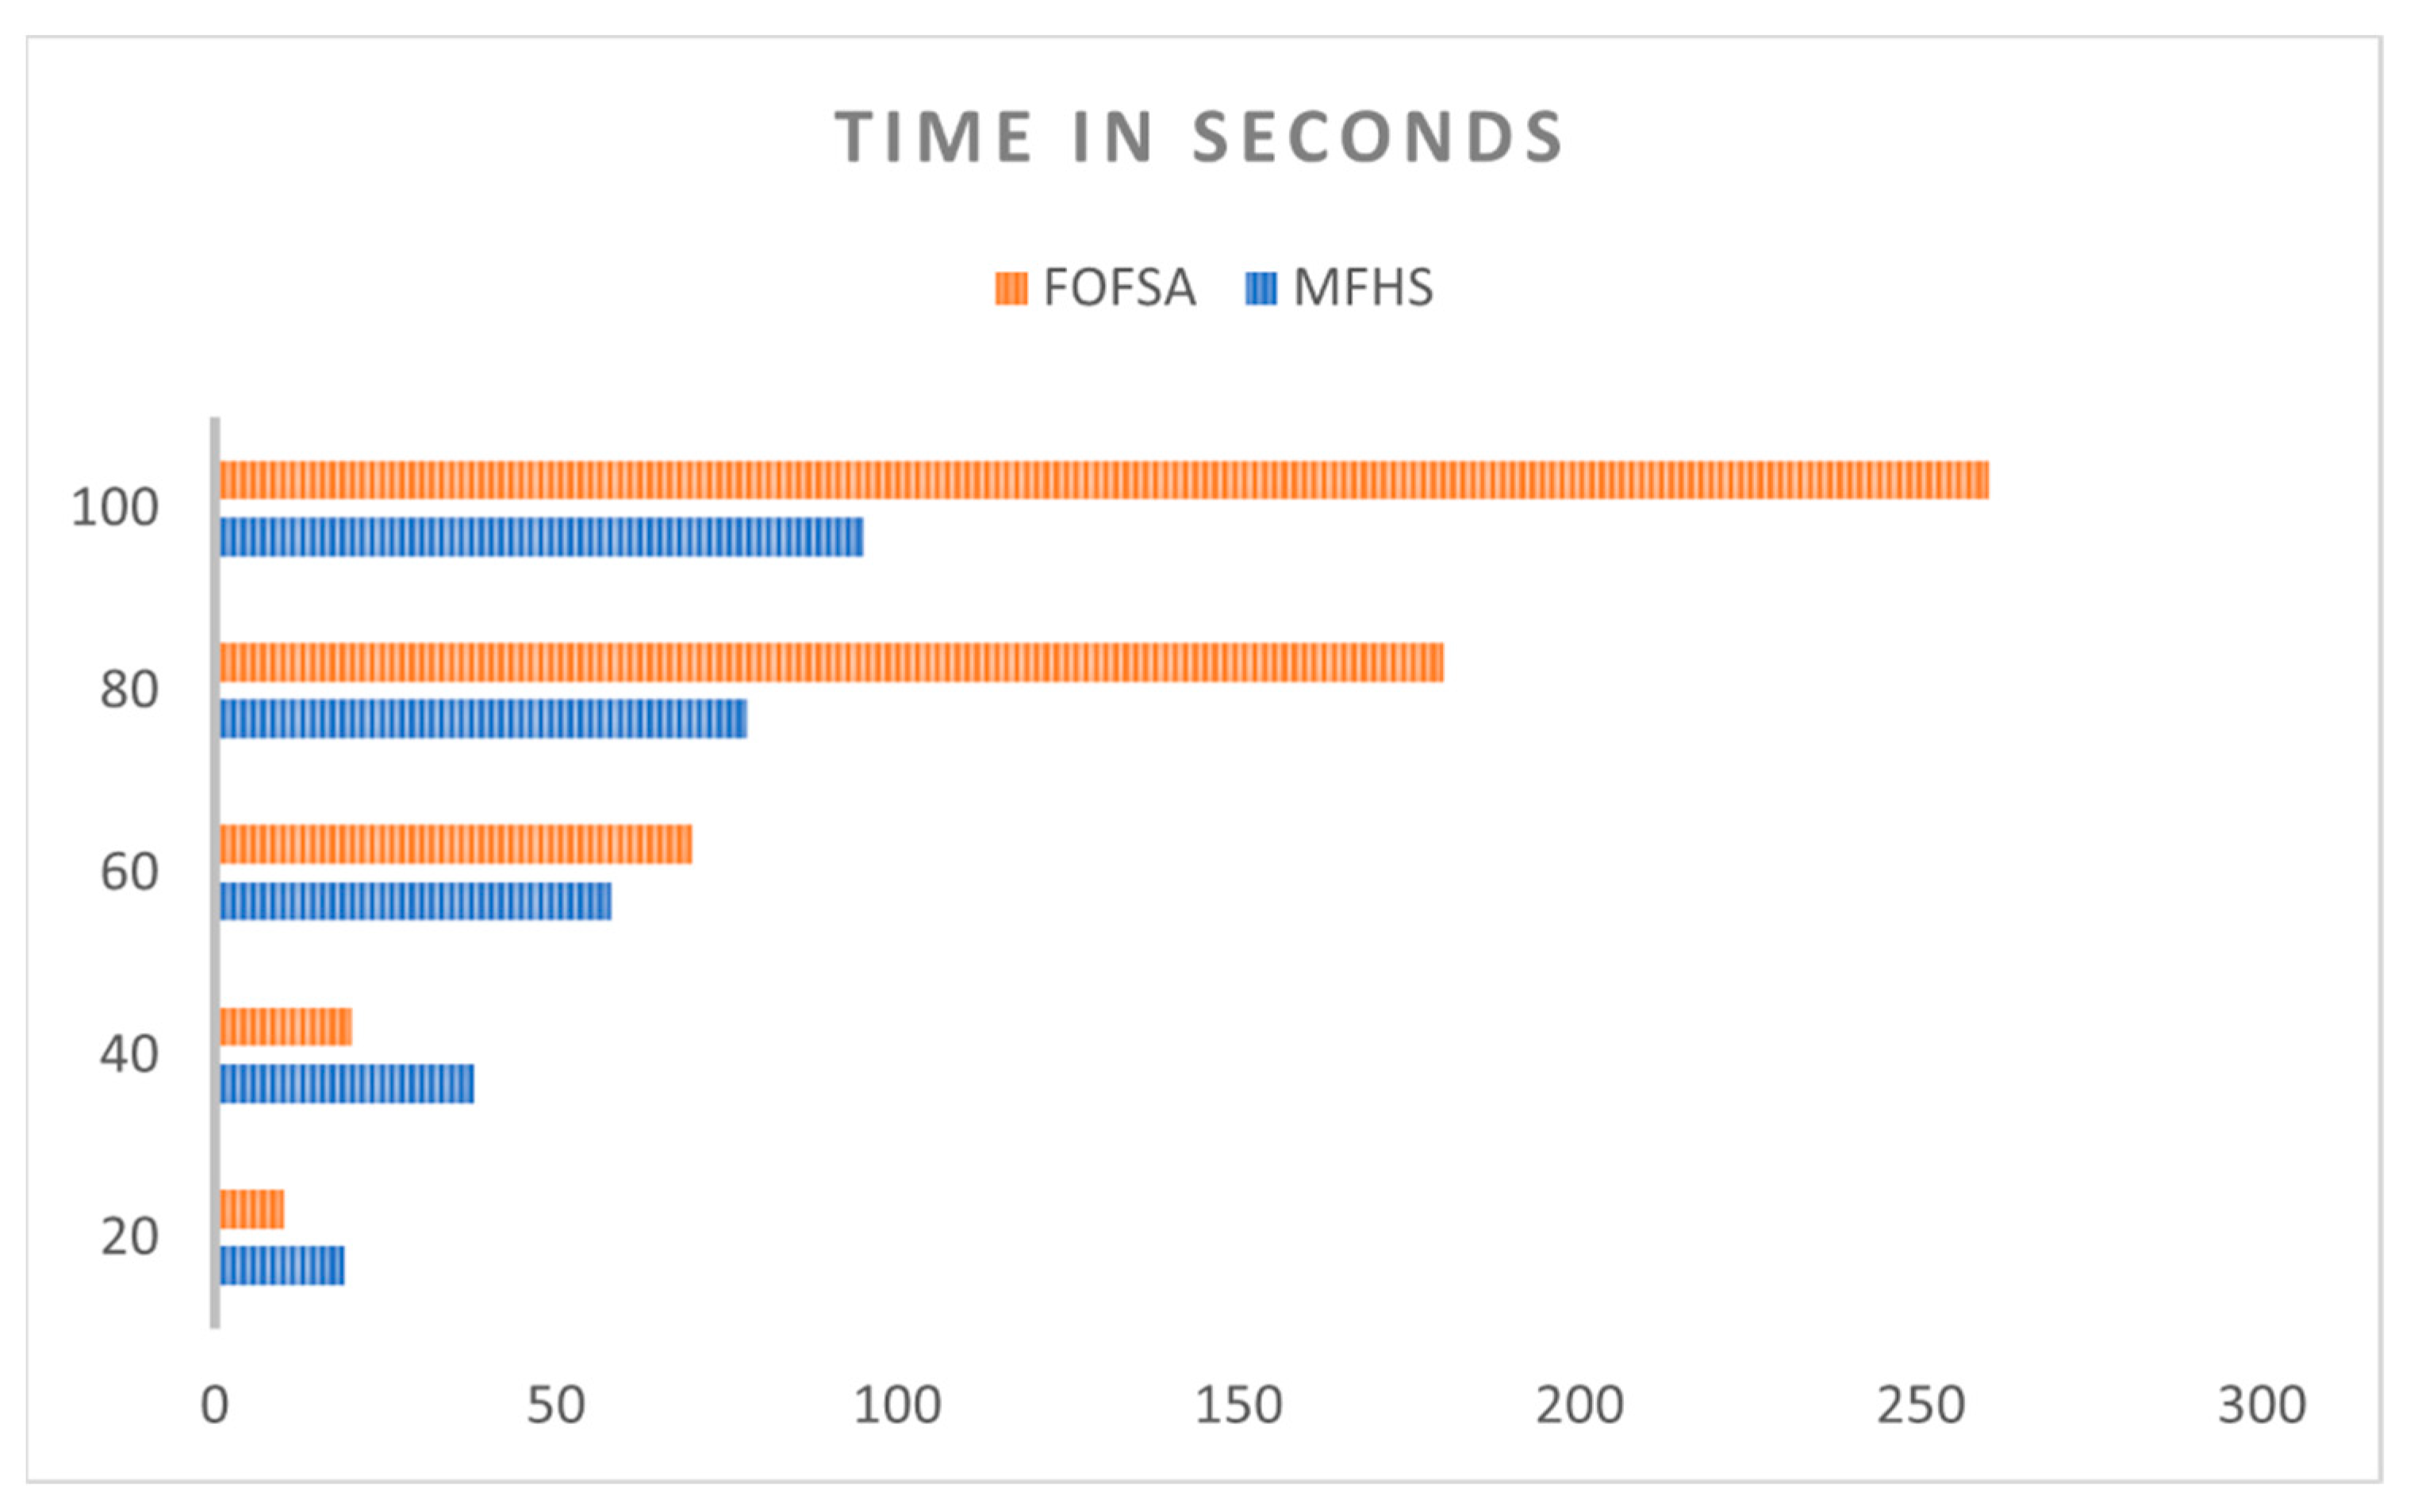
7.2. Processing Time
7.2.1. Ttr Calculations
7.2.2. Tc and Ta Calculations
8. Discussion
9. Conclusions
Author Contributions
Funding
Institutional Review Board Statement
Informed Consent Statement
Data Availability Statement
Conflicts of Interest
Appendix A
Appendix A.1. Energy Consumption Calculations for FOFSA, ATAT, and OLB
Appendix A.1.1. FOFSA
Appendix A.1.2. ATAT
Appendix A.1.3. OLB
References
- Alghofaili, Y.; Rassam, M.A. A Dynamic Trust-Related Attack Detection Model for IoT Devices and Services Based on the Deep Long Short-Term Memory Technique. Sensors 2023, 23, 3814. [Google Scholar] [CrossRef] [PubMed]
- Barik, R.K.; Patra, S.S.; Kumari, P.; Mohanty, S.N.; Hamad, A.A. A new energy aware task consolidation scheme for geospatial big data application in Mist computing environment. In Proceedings of the 8th International Conference on Computing for Sustainable Global Development (INDIACom), New Delhi, India, 17–19 March 2021; pp. 48–52. [Google Scholar]
- Hmissi, F.; Ouni, S. An MQTT Brokers Distribution Based on Mist Computing for Real-Time IoT Communications; Springer: Berlin/Heidelberg, Germany, 2021. [Google Scholar]
- Refaat, H.E. MLITS:Multi-Level tasks scheduling model for IoT Service Provisioning. Inf. Bull. Comput. Inf. 2020, 2, 1–9. [Google Scholar] [CrossRef]
- Rubio-Drosdov, E.; Sánchez, D.D.; Almenárez, F.; Marín, A. A framework for efficient and scalable service offloading in the Mist. In Proceedings of the IEEE 5th World Forum on Internet of Things (WF-IoT), Limerick, Ireland, 15–18 April 2019; pp. 460–463. [Google Scholar]
- Hensh, F.; Gupta, M.; Nene, M.J. Mist-Edge-Cloud (MEC) Computing: An Integrated Computing Architecture. In Proceedings of the Second International Conference on Electronics and Sustainable Communication Systems (ICESC), Coimbatore, India, 4–6 August 2021; pp. 1035–1040. [Google Scholar]
- Shahid, H.; Shah, M.A.; Almogren, A.; Khattak, H.A.; Din, I.U.; Kumar, N.; Maple, C. Machine Learning-based Mist Computing Enabled Internet of Battlefield Things. ACM Trans. Internet Technol. 2021, 21, 1–26. [Google Scholar] [CrossRef]
- Hosen, A.S.; Sharma, P.K.; Cho, G.H. MSRM-IoT: A reliable resource management for Cloud, Fog and Mist assisted IoT networks. IEEE Internet Things J. 2021, 9, 2527–2537. [Google Scholar] [CrossRef]
- Ejaz, M.; Kumar, T.; Ylianttila, M.; Harjula, E. Performance and Efficiency Optimization of Multi-layer IoT Edge Architecture. In Proceedings of the 2nd 6G Wireless Summit (6G SUMMIT), Levi, Finland, 17–20 March 2020; pp. 1–5. [Google Scholar] [CrossRef]
- Tripathy, S.S.; Barik, R.K.; Roy, D.S. Secure-M2FBalancer: A Secure Mist to Fog Computing-Based Distributed Load Balancing Framework for Smart City Application. In Advances in Communication, Devices and Networking; Springer: Berlin/Heidelberg, Germany, 2021; pp. 277–285. [Google Scholar] [CrossRef]
- Barik, R.K.; Misra, C.; Lenka, R.K.; Dubey, H.; Mankodiya, K. Hybrid mist-cloud systems for large scale geospatial big data analytics and processing: Opportunities and challenges. Arab. J. Geosci. 2019, 12, 32. [Google Scholar] [CrossRef]
- Stavrinides, G.L.; Karatza, H.D. Security and Cost Aware Scheduling of Real-Time IoT Workflows in a Mist Computing Envi-ronment. In Proceedings of the 8th International Conference on Future Internet of Things and Cloud (FiCloud), Rome, Italy, 23–25 August 2021; pp. 34–41. [Google Scholar]
- Ali, H.S.; Rout, R.R.; Parimi, P.; Das, S.K. Real-Time Task Scheduling in Fog-Cloud Computing Framework for IoT Applications: A Fuzzy Logic based Approach. In Proceedings of the International Conference on COMmunication Systems & NETworkS (COMSNETS), Bangalore, India, 5–9 January 2021; pp. 556–564. [Google Scholar]
- Das, A.K.; Kalam, S.; Sahar, N.; Sinha, D. UCFL: User Categorization using fuzzy logic towards PUF based two-phase authentication of Foassisted IoT devices. Comput. Secur. 2020, 97, 101938. [Google Scholar] [CrossRef]
- Reddy, D.A.; Krishna, P.V. Feedback-based fuzzy resource management in IoT using fog computing. Evol. Intell. 2020, 14, 669–681. [Google Scholar] [CrossRef]
- Cuka, M.; Elmazi, D.; Bylykbashi, K.; Spaho, E.; Ikeda, M.; Barolli, L. Implementation and performance evaluation of two fuzzy-based systems for selection of IoT devices in opportunistic networks. J. Ambient. Intell. Humaniz. Comput. 2018, 10, 519–529. [Google Scholar] [CrossRef]
- Haripriya, A.; Kulothungan, K. Secure-MQTT: An efficient fuzzy logic-based approach to detect DoS attack in MQTT protocol for Internet of Things. EURASIP J. Wirel. Commun. Netw. 2019, 2019, 1–15. [Google Scholar]
- Khalil, A.; Mbarek, N.; Togni, O. Fuzzy Logic based security trust evaluation for IoT environments. In Proceedings of the IEEE/ACS 16th International Conference on Computer Systems and Applications (AICCSA), Abu Dhabi, United Arab Emirates, 3–7 November 2019; pp. 1–18. [Google Scholar]
- Sankar, S.; Srinivasan, P. Fuzzy Logic Based Energy Aware Routing Protocol for Internet of Things. Int. J. Intell. Syst. Appl. 2018, 10, 11–19. [Google Scholar] [CrossRef]
- Ramkumar, K.; Ananthi, N.; Brabin, D.R.D.; Goswami, P.; Baskar, M.; Bhatia, K.K.; Kumar, H. Efficient routing mechanism for neighbour selection using fuzzy logic in wireless sensor network. Comput. Electr. Eng. 2021, 94, 107365. [Google Scholar] [CrossRef]
- Radhika, S.; Rangarajan, P. Fuzzy Based Sleep Scheduling Algorithm with Machine Learning Techniques to Enhance Energy Efficiency in Wireless Sensor Networks. Wirel. Pers. Commun. 2021, 118, 3025–3044. [Google Scholar] [CrossRef]
- Deabes, W.; Bouazza, K.E.; Algthami, W. Smart Fuzzy Petri Net-Based Temperature Control Framework for Reducing Building Energy Consumption. Sensors 2023, 23, 5985. [Google Scholar] [CrossRef] [PubMed]
- Hu, Y.; Meng, J.; Li, G.; Zhao, D.; Feng, G.; Zuo, G.; Liu, Y.; Zhang, J.; Shi, C. Fuzzy Adaptive Passive Control Strategy Design for Upper-Limb End-Effector Rehabilitation Robot. Sensors 2023, 23, 4042. [Google Scholar] [CrossRef] [PubMed]
- Shehabi, A.; Smith, S.; Sartor, D.; Brown, R.; Herrlin, M.; Koomey, J.; MasaneT, E.; Lintner, W.; Horner, N.; Azevedo, I. United States Data Center Energy Usage Report; LBNL-1005775; Lawrence Berkeley National Laboratory: Berkeley, CA, USA, 2016. [Google Scholar]
- Bennouri, H.; Berqia, A. U-NewReno transmission control protocol to improve TCP performance in Underwater Wireless Sensors Networks. J. King Saud Univ.-Comput. Inf. Sci. 2022, 34, 5746–5758. [Google Scholar] [CrossRef]


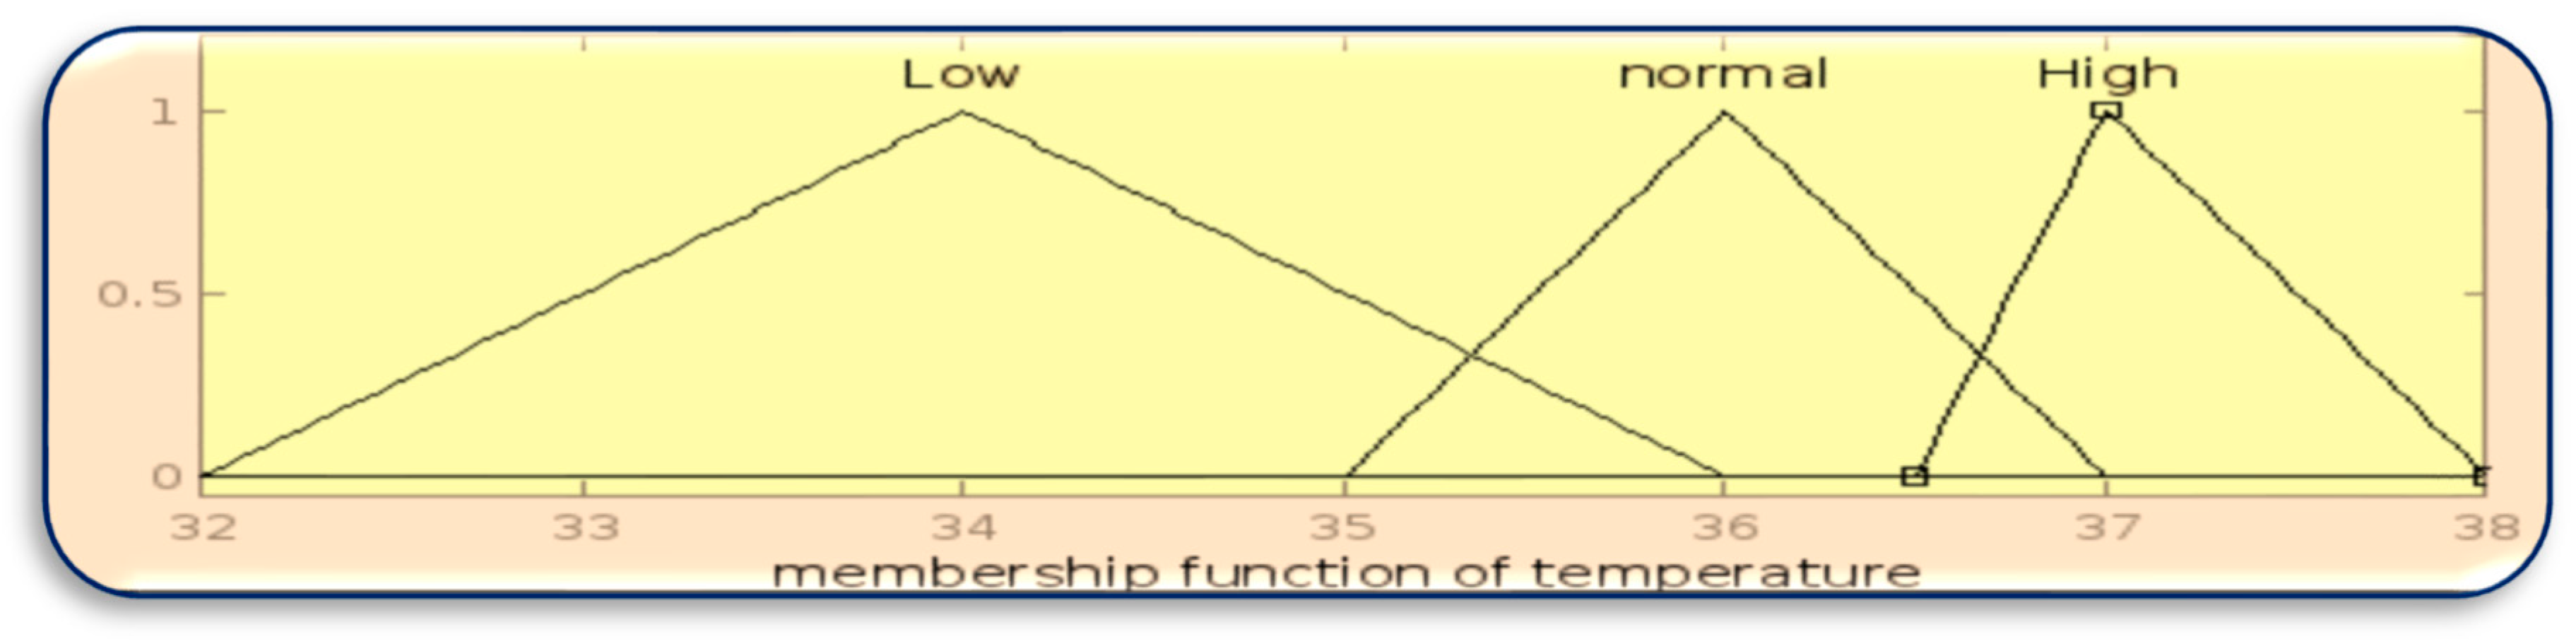
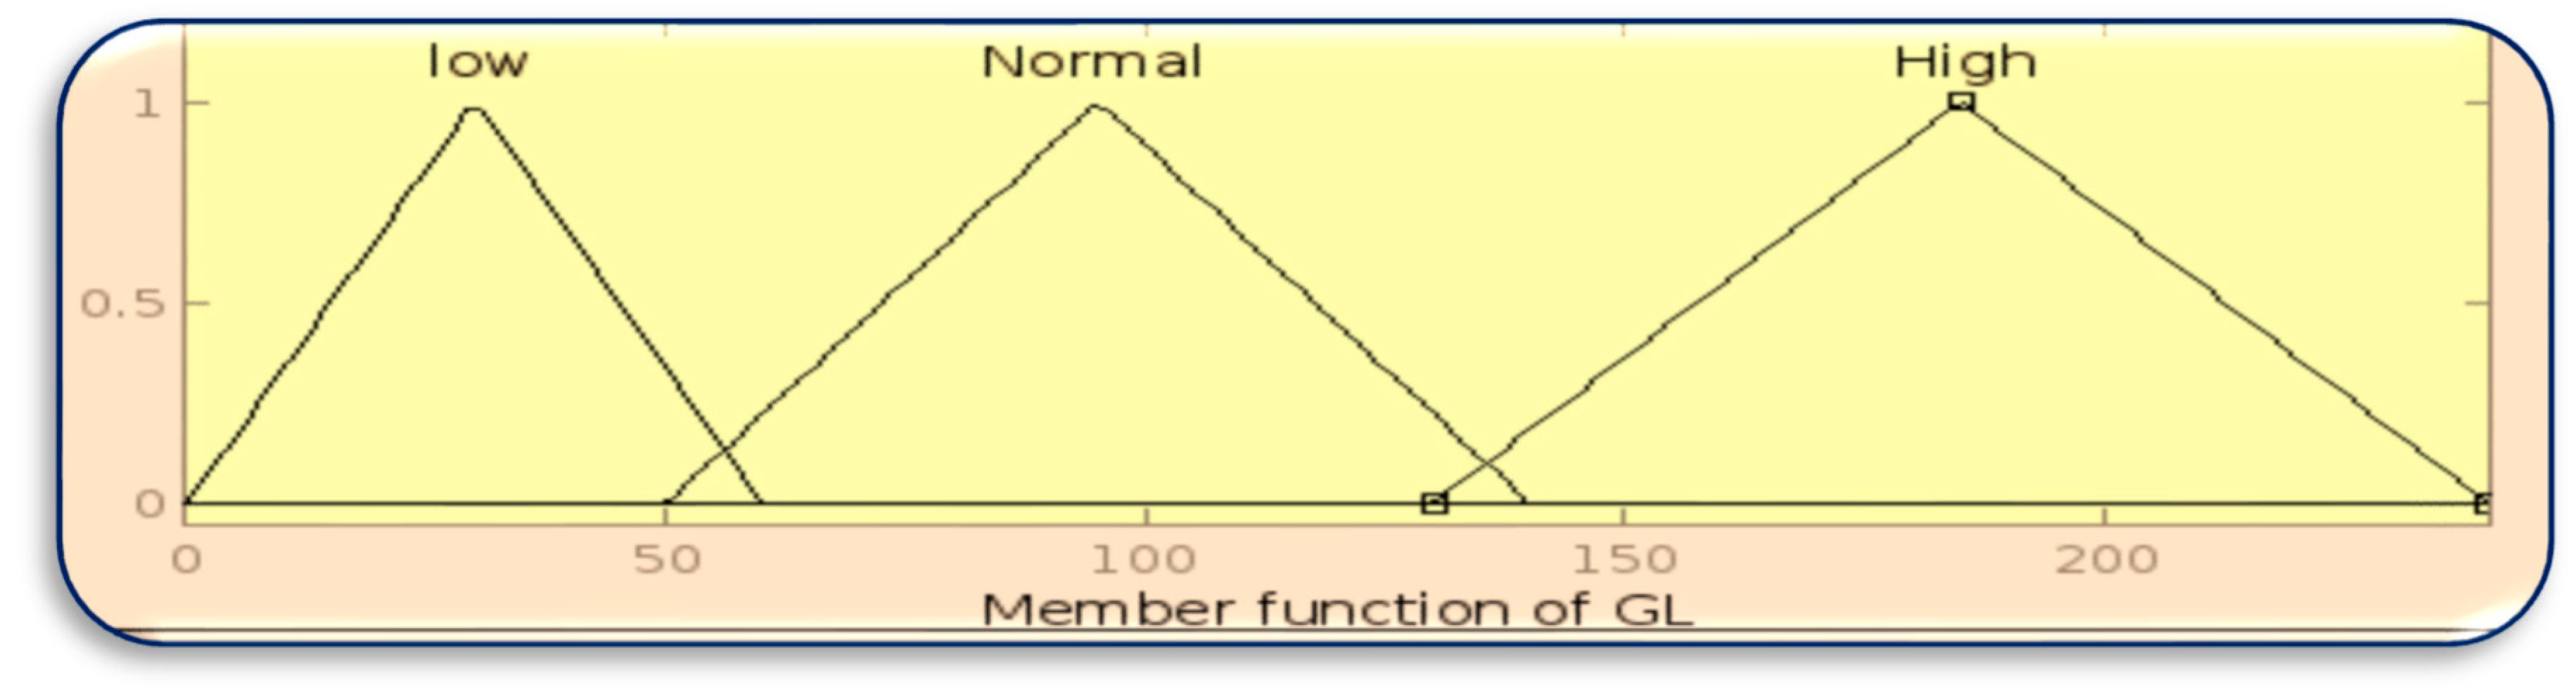
| BT (Body Temperature) | HR (Heart Rate) | GL (Glucose Level) |
|---|---|---|
| Low 35.5 °C to 36.5 °C | Slow (<70 bpm) | Less (<60 mg/dL) |
| Normal 36.1 °C to 37.2 °C | Average 60 bpm to 110 bpm | Normal 50 mg/dL to 140 mg/dL |
| High 37 °C to 38 °C | Fast 100 bpm to 140 bpm | High 130 mg/dL to 240 mg/dL |
| BT (Body Temperature) | HR (Heart Rate) | GL (Glucose Level) | Health Score | Patient Health Condition | Data Priority |
|---|---|---|---|---|---|
| Low | Slow | Less | Poor | Critical | High |
| Low | Slow | Normal | Medium | Exposed to diseases | Medium |
| Low | Slow | High | Poor | Critical | High |
| Low | Average | Less | Medium | Exposed to diseases | Medium |
| Low | Average | Normal | Good | Healthy | Low |
| Low | Average | High | Medium | Exposed to diseases | Medium |
| Low | Fast | Less | Poor | Critical | High |
| Low | Fast | Normal | Medium | Exposed to diseases | Medium |
| Low | Fast | High | Poor | Critical | High |
| Normal | Slow | Less | Medium | Exposed to diseases | Medium |
| Normal | Slow | Normal | Good | Healthy | Low |
| Normal | Slow | High | Medium | Exposed to diseases | Medium |
| Normal | Average | Less | Good | Healthy | Low |
| Normal | Average | Normal | Good | Healthy | Low |
| Normal | Average | High | Good | Healthy | Low |
| Normal | Fast | Less | Medium | Exposed to diseases | Medium |
| Normal | Fast | Normal | Good | Healthy | Low |
| Normal | Fast | High | Medium | Exposed to diseases | Medium |
| High | Slow | Less | Poor | Critical | High |
| High | Slow | Normal | Medium | Exposed to diseases | Medium |
| High | Slow | High | Poor | Critical | High |
| High | Average | Less | Medium | Exposed to diseases | Medium |
| High | Average | Normal | Good | Healthy | Low |
| High | Average | High | Medium | Exposed to diseases | Medium |
| High | Fast | Less | Poor | Critical | High |
| High | Fast | Normal | Medium | Exposed to diseases | Medium |
| High | Fast | High | Poor | Critical | High |
| Data Priority | Computational Capacity of Mist Node | Source Allocation |
|---|---|---|
| High | High | Cloud |
| High | Medium | Cloud |
| High | Low | Cloud |
| Medium | High | Mist |
| Medium | Medium | Mist |
| Medium | Low | Fog |
| Low | High | Mist |
| Low | Medium | Fog |
| Low | Low | Fog |
| Parameters | Configuration |
|---|---|
| Processor | 11th Gen Intel(R) Core(TM) i7-1165G7 @ 2.80 GHz 1.69 GHz |
| Language | Java |
| Integrated Development Environment (IDE) | Eclipse |
| Development Kit | Java Development Kit (JDK) 17 |
| Fuzzy rules integration | MATLAB |
| Nodes | Description |
|---|---|
| 1, 2, 3, 4, 5, 6 | BT, HR, GL nodes at the Edge layer |
| MB | Mist broker |
| FB | Fog broker |
| F1, F2, F3, F4, F5, F6 | Nodes at the Fog layer |
| CL1, CL2, CL3 | Nodes at the Cloud layer |
| C1 and C2 | The two Fog clusters |
| M1 and M2 | Mist nodes |
| CC | Computational capacity |
| Node Name | Computational Capacity |
|---|---|
| F1 | 360 |
| F2 | 60 |
| F3 | 120 |
| F4 | 280 |
| F5 | 40 |
| F6 | 160 |
| Number of Packets | Etr | Ec + Ea | Etotal |
|---|---|---|---|
| 20 | 0.15 KJ | 0.38 KJ | 0.53 KJ |
| 40 | 0.3 KJ | 0.76 KJ | 1.06 KJ |
| 60 | 0.45 KJ | 1.14 KJ | 1.59 KJ |
| 80 | 0.60 KJ | 1.52 KJ | 2.12 KJ |
| 100 | 0.75 KJ | 1.9 KJ | 2.65 KJ |
| Number of Packets | OLB | FOFSA | ATAT |
|---|---|---|---|
| 20 | 1.15 KJ | 0.56 KJ | 2.16 KJ |
| 40 | 2.6 KJ | 1.44 KJ | 3.3 KJ |
| 60 | 3.4 KJ | 2.5 KJ | 4.03 KJ |
| 80 | 4.1 KJ | 2.8 KJ | 5 KJ |
| 100 | 5 KJ | 3.3 KJ | 6 KJ |
Disclaimer/Publisher’s Note: The statements, opinions and data contained in all publications are solely those of the individual author(s) and contributor(s) and not of MDPI and/or the editor(s). MDPI and/or the editor(s) disclaim responsibility for any injury to people or property resulting from any ideas, methods, instructions or products referred to in the content. |
© 2023 by the authors. Licensee MDPI, Basel, Switzerland. This article is an open access article distributed under the terms and conditions of the Creative Commons Attribution (CC BY) license (https://creativecommons.org/licenses/by/4.0/).
Share and Cite
Almudayni, Z.; Soh, B.; Li, A. Enhancing Energy Efficiency and Fast Decision Making for Medical Sensors in Healthcare Systems: An Overview and Novel Proposal. Sensors 2023, 23, 7286. https://doi.org/10.3390/s23167286
Almudayni Z, Soh B, Li A. Enhancing Energy Efficiency and Fast Decision Making for Medical Sensors in Healthcare Systems: An Overview and Novel Proposal. Sensors. 2023; 23(16):7286. https://doi.org/10.3390/s23167286
Chicago/Turabian StyleAlmudayni, Ziyad, Ben Soh, and Alice Li. 2023. "Enhancing Energy Efficiency and Fast Decision Making for Medical Sensors in Healthcare Systems: An Overview and Novel Proposal" Sensors 23, no. 16: 7286. https://doi.org/10.3390/s23167286
APA StyleAlmudayni, Z., Soh, B., & Li, A. (2023). Enhancing Energy Efficiency and Fast Decision Making for Medical Sensors in Healthcare Systems: An Overview and Novel Proposal. Sensors, 23(16), 7286. https://doi.org/10.3390/s23167286