Abstract
Aiming at comprehensively evaluating the status of a bridge monitoring system, an evaluation framework based on the improved Delphi, analytic Hierarchy process, Grey relations analysis and Fuzzy integrated evaluation (DHGF) is selected. Firstly, the evaluation indexes for the bridge monitoring system are determined by an anonymous group discussion and expert questionnaire using the improved Delphi method. Secondly, a comparison matrix of the evaluation indexes is constructed to determine the comprehensive weight via the analytic hierarchy process. Then, based on the gray relations analysis, the albino weight function is constructed, the evaluation gray class is determined, and the single-factor fuzzy evaluation matrix is obtained. Finally, the final evaluation result was obtained by the fuzzy comprehensive evaluation. The evaluation results of a real bridge monitoring system show that the evaluation level of the monitoring system was level II, and the proposed framework could better reflect the construction and operation status of the monitoring system.
1. Introduction
With the long-term effect of natural factors and increasing traffic, the safety of bridge structures will inevitably deteriorate, and catastrophic accidents will occur in extreme cases. To ensure the safe operation of bridges, bridge monitoring systems have been widely established. At present, the goals of real-time monitoring, synchronous analysis, and data network sharing of monitoring systems have been gradually achieved [1,2,3,4,5]; however, the accurate diagnosis of bridge status, as the main functional goal of health-monitoring systems [6], is still difficult due to the complexity of the bridges, the randomness of external loads, and the uncertainty of the service environment. Therefore, most of the existing studies focus on the accumulation of historical data [7,8,9,10,11,12,13], the identification of external load and internal damage [14,15,16], and the assessment of overall safety [17]. For example, Jian et al. [18] automatically detected and classified a large number of fault monitoring data points by using the histogram of the relative frequency distribution of the data and the one-dimensional convolutional neural network and then comprehensively verified the selected acceleration data of the two long-span bridges. Hajializadeh et al. [19] propose a bridge damage recognition method based on deep learning, which can accurately and automatically identify the damage at different speeds and track unevenness and ambient noise. Zhang et al. [20] proposed a robustness index evaluation method based on bridge health monitoring data, which can effectively evaluate the structural state of bridges.
After the long period of operation of some monitoring facilities, there are phenomena such as a lack of basic data, damage to instruments and equipment, unstable system operation, and chaotic monitoring data. The monitoring system belongs to complex multidisciplinary cross-system engineering, and many factors, such as the coverage degree of sensor layout, the installation of monitoring equipment, and the quality of monitoring data, may cause large deviations in structural evaluation results. In this context, the evaluation of bridge monitoring systems (BHM) has become a new topic for scholars and engineers in the field. In terms of the operation state analysis of BHM systems, Li et al. [21] proposed a method for sensor fault detection using a generalized likelihood ratio and correlation coefficient and carried out manual fault sensor detection and classification verification tests on the Yangtze River Bridge, which can realize the online diagnosis of multiple sensor faults. Li et al. [22] proposed an abnormal signal detection method for the BHM system based on a two-segment deep convolutional neural network, which improved the recognition accuracy of abnormal signal patterns. Yu et al. [23] proposed a sensor state assessment and fault diagnosis method based on multi-dimensional information fusion, which can accurately obtain information from multiple sensors through the simultaneous interpretation of different sensor data. The above research focuses on the diagnosis of the monitoring status of a single sensor, and the evaluation model for the overall quality of the bridge monitoring system is rarely reported.
In view of the complexity of the operation status evaluation of BHM systems and the shortcomings of existing research, this paper proposes a DHGF-based operation status evaluation method for bridge monitoring systems and verifies the effectiveness of this method using a real-world system.
2. DHGF Algorithm
The DHGF comprehensive evaluation method integrates the successes of the improved Delphi method, analytic hierarchy process, gray relations analysis, and fuzzy comprehensive evaluation method [24]. The theoretical basis of the DHGF comprehensive evaluation method is the comprehensive, integrated method proposed by Qian [25] and the physics–affairs–human science (WSR) analysis method proposed by Gu, which combines disciplinary theory and human experience and knowledge and makes full use of the advantages of these two methods. To this end, the DHGF algorithm is introduced in the evaluation of bridge health monitoring systems to accurately grasp the operation status of bridge monitoring systems.
The basic idea of the DHGF comprehensive evaluation method is to use the improved Delphi method for anonymous discussion and statistics, optimize the evaluation indicators of the system to be evaluated, formulate the comprehensive evaluation index system, and establish a hierarchy of evaluation indicators. The analytic hierarchy process is used to calculate the combined weights of the underlying elements, and the evaluation value matrix of the evaluation index is given. The gray system theory is used to determine the evaluation gray class, and the gray evaluation coefficient is calculated to obtain the gray evaluation weight vector and weight matrix. According to the fuzzy integrated evaluation, the evaluation matrix is formed, and fuzzy calculation is carried out to obtain comprehensive evaluation results. The application of different theories and methods in different steps of the systematic evaluation can take advantage of their strengths and avoid their weaknesses, and the process of the DHGF algorithm for system state evaluation is shown in Figure 1.
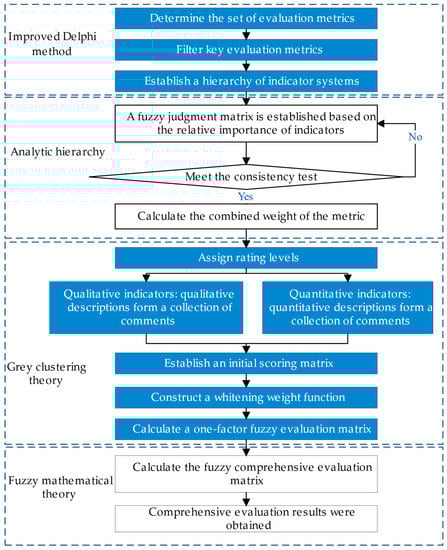
Figure 1.
The holistic structure of the proposed method.
3. Construction of Bridge Monitoring System Evaluation Model
3.1. Selection of Evaluation Indicators
For the selection of evaluation indicators, the indicators are determined by means of expert group discussion and the current standard “Technical Code for Monitoring Highway Bridge Structures” (JT T 1037-2022). In order to ensure the independence of the indicators, principles based on scientificity, systematicness, accuracy, and operability are adopted. In addition, the completeness of the design function of the monitoring system, the quality control of the construction stage, the stability of the system operation status, and the timeliness of manual maintenance management are taken into account. On this basis, a hierarchical index system for the evaluation of the bridge monitoring system is constructed, and the established state evaluation index system is a three-level hierarchy, including criterion layer indicators and several index layer indicators , as shown in Figure 2. The evaluation of the BHM system is mainly divided into four stages (i.e., design, construction, operation, and maintenance) to evaluate the whole lifecycle of the BHM system.
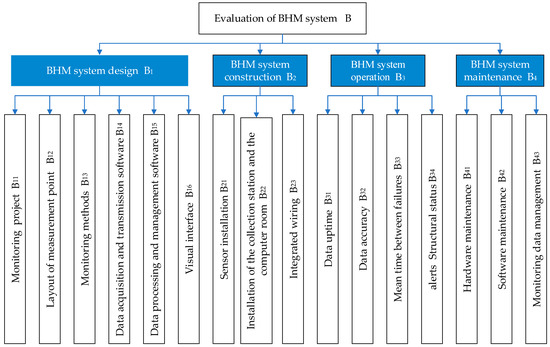
Figure 2.
Evaluation index hierarchy of bridge monitoring system.
Assuming that experts participate in the evaluation and there are evaluation indicators, represents the score of the expert on the index . Then, the evaluation data of experts on indicators constitute an evaluation sample size matrix:
3.2. The Evaluation Index Weights
The importance of each indicator in reflecting the operation status of the bridge monitoring system varies. Thus, it is necessary to empower each evaluation indicator before conducting a comprehensive evaluation. In this paper, the analytic hierarchy process [24] is used to construct two pairs of judgment matrices to determine the combined weights of each index, and the determination of the judgment matrix scale is determined in Table 1. The reciprocal of the scale (1/3, 1/5, 1/7, 1/9, etc.) indicates that the importance of the two indicators is opposite to the description in the table.

Table 1.
Determining the scale and meaning of the matrix.
A consistency test is required for the obtained judgment matrix. The results of the consistency test can exhibit the logical rationality of the judgment matrix. By this test, an awkward situation can be avoided, i.e., the indicator is more important than the indicator , and the indicator is more important than the indicator , but the indicator is more important than the indicator . The consistency metric is defined below:
where is the consistency ratio; is an average random consistency metric; is determined by the order of the matrix (see Table 2); is the maximum eigenvalue; and represents the order of the judgment matrix.
Table 2.
Reference table of average consistency indicators.
In the process of consistency test, is the only non-zero eigenvalues of the m-rank consensus matrix, and the maximum eigenvalues satisfy ; if and only if max = m, the matrix has complete consistency. Therefore, the greater the is than m, the more serious the inconsistency of the matrix. As a result, the value of can be used to measure the degree of inconsistency of the matrix. As for , the smaller the , the greater the consistency. It has complete consistency when , while there is good consistency when is close to 0.
To measure the value of , the random consistency index is introduced, which is determined by the rank of the matrix. In general, the larger the rank of the matrix, the greater the possibility of random deviation of consistency. Table 2 presents the relationship between RI and matrix rank.
Considering that the deviation of consistency may be caused by randomness, it is also necessary to compare and the immediate agreement index to obtain the test coefficient when testing whether the matrix has satisfactory consistency. The formula is as follows:
When , it is considered that the judgment matrix has passed the consistency test, otherwise it does not have satisfactory consistency, and the judgment matrix needs to be readjusted. By calculating each judgment matrix and finding the feature vector corresponding to the largest feature value as the weight set of each indicator, the weight set can be expressed by
where is the weight corresponding to indicator . The weight vector satisfies the normalization condition, and the normalization condition is as follows:
3.3. Determine the Evaluation Level of the BHM System
In this paper, the evaluation level of the operation status of the BHM system is set as I, II, III, and IV, i.e., , . Each rating corresponds to a state of the BHM system (Table 3):
Table 3.
Evaluation grades and score divisions of BHM systems.
- ●
- Level I indicates that the system is in an “excellent” state, where the BHM system fully meets the needs of the monitoring work and has performance beyond the requirements of “Technical Code for Monitoring Highway Bridge Structures” (JT T 1037-2022).
- ●
- Level II indicates that the system is in a “good” state, where the BHM system meets the needs of monitoring work, and the system meets the specifications of (JT T 1037-2022).
- ●
- Level III indicates that the system is in a “medium” state, where the BHM system has a few defects but basically meets the needs of monitoring work.
- ●
- Level IV means that the system is in a “poor” state, where the monitoring system defects are more obvious and cannot meet the needs of monitoring work.
According to the “Technical Code for Monitoring Highway Bridge Structures” (JT T 1037-2022), the evaluation standards for each indicator are formulated, as shown in Table 4. Among the 16 secondary evaluation indicators, two quantitative evaluation indicators are included, and the calculation of the quantitative evaluation indicators is given below.
Table 4.
Indicator evaluation sets.
The indicator of measurement point data integrity rate can be expressed as
where is the integrity rate of the measurement point data; is the number of fault measurement points; is the failure time of the -th fault measurement point (take days () as a unit); is the total number of measurement points; and is the check cycle time in days ().
The indicator is calculated by
where is the normal working time of the unit , is the abnormal working time of unit , and is the total number of units in the data acquisition. Taking the integrity rate () of measurement point data as an example, the calculation method of the specific score of quantitative evaluation indicators is shown. From Table 4, if is located in the interval , the corresponding score interval is , and the score () of the indicator is calculated by
3.4. Determine the Gray Class Assessment
To comprehensively calculate the overall evaluation level of the BHM system by combining the evaluation level of each indicator, it is necessary to construct a whitening weight function to quantitatively describe the importance of the evaluation indicator. The albino weight function corresponds to an evaluation gray class for each evaluation level. Using the lowest score of the evaluation level as the threshold, the gray category is set as I, II, III, and IV according to the defined four evaluation levels; the minimum threshold of each level is 20, 50, 70, and 90, which are the gray numbers of each evaluation gray class. The corresponding whitening weight function of each level can be obtained:
For the first gray class “I” (i.e., and gray number ), the albino weight function is written as
For the second gray class “II” (i.e., , and gray number ), the albino weight function is written as
For the third gray class “III” (i.e., , and gray number ), the albino weight function is written as
For the fourth gray class “IV” (i.e., , and gray number ), the albino weight function is written as
3.5. Gray Statistical Calculation
Based on the gray theory, the whitening function can find the weight of each expert’s score belonging to the category evaluation gray class, which is denoted as . Therefore, the gray statistics for each indicator belonging to the evaluation gray category of the category is calculated by
The total gray statistics for each evaluation indicator are calculated by
The gray weights of the -th evaluation factor and gray category by the comprehensive experts are calculated by
The univariate gray clustering coefficient matrix composed of can be constructed by
3.6. Fuzzy All-Round Assessment Matrix
The multiplication of the univariate weighted matrix and the gray clustering coefficient matrix is carried out to obtain the fuzzy comprehensive evaluation matrix can be constructed below [25,26]:
where , .
3.7. Calculation of Evaluation Results
The final evaluation result is calculated from the fuzzy all-round evaluation matrix and the evaluation grade matrix [27]:
The final BHM system evaluation level can be obtained via Table 3.
4. Analysis of Example
4.1. Overview of the BHM System
A cable-stayed bridge with a total length of 1001 m is employed for analysis. The BHM system is mainly composed of an automatic perception subsystem, a data acquisition and transmission subsystem, a data processing and analysis subsystem, a structural early warning and evaluation subsystem, and a visual integration subsystem, which can realize early warning in abnormal conditions. There are a total of 288 measurement points. The layout of the measurement point is shown in Figure 3. The labels in Figure 3 correspond to the type of measurement point, as shown in Table 5, and the number in parentheses is the number of measurement points.
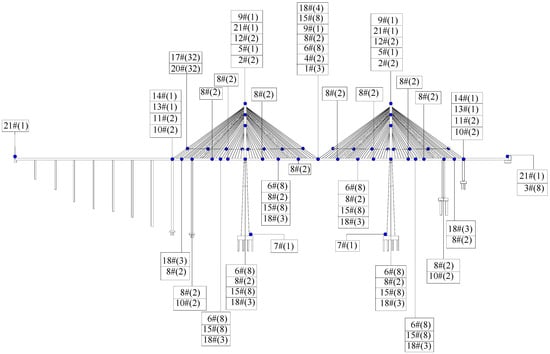
Figure 3.
The layout of the bridge measurement point.
Table 5.
Labels correspond to the types of measurement points.
4.2. Comprehensive Evaluation
The operation quality of the above BHM system was evaluated using the evaluation model established in Section 2.
4.2.1. Building the Sample Matrix of Evaluation Quantities
Based on the evaluation, ten experts were invited to objectively evaluate the 16 indicators of the BHM system. The scoring range is 1–100 grades, and a sample matrix with the size of 10 × 16 was obtained. The initial scores of the experts for each indicator are shown in Table 6 and Figure 4.
Table 6.
Initial expert scoring matrix.
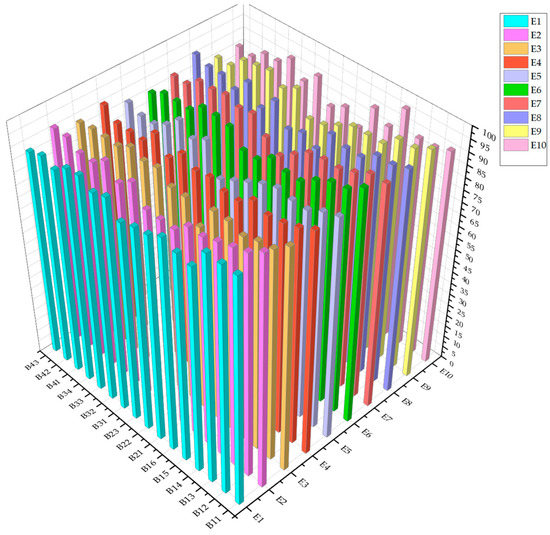
Figure 4.
Three-dimensional view of the evaluation sample matrix.
4.2.2. The Weights of Evaluation Indicators
There are 16 indicators reflecting the operation status of the BHM system. To fully consider the relationship between all evaluation indicators, the weight of the evaluation indicators is calculated in hierarchical blocks [24], and the weight of each level of indicators is analyzed according to Figure 1.
The four indicators of the criterion layer are taken as examples to present the process of weights allocation: First, in comparing design () and construction (), is more important than , and the degree of importance is slightly more important, which is recorded as scale 2; in comparing and running (), is more important than B3 and the degree of importance is slightly more important, which is denoted as scale 2; in comparing and , is more important than maintenance (), and the degree of importance is clearly important, which is recorded as scale 4. Then, in comparing B2 and , they are of similar importance and are recorded as scale 1; in comparing with and , is more important than , and the degree of importance is slightly more important, which is recorded as scale 2. Finally, in comparing and , is more important, and the degree of importance is slightly more important, which is denoted as scale 3. The judgment matrix between the indicators of the criterion layer is shown in Table 7. Based on Equations (2) and (3), the consistency ratio is calculated. According to Table 2, due to , , it can be seen that there is no logical error in the judgment matrix, and the weights of the , , , and layers are shown in the eigenvalue corresponding to the indicators in Table 7. Similarly, the final combination weights of the index layer are displayed in Table 8.
Table 7.
Criterion layer judgment matrix of BHM system.
Table 8.
Evaluation index system and weight of BHM system.
Then, the consistency for weights of the criterion layer was checked:
for the weights of the index layer:
Obviously, the combined weights of the above standard layer and index layer meet the normalization test.
The weights of the index layer are shown in Figure 5. It can be seen that the five most important indicators accounting for the heaviest proportion are , , , , , and .
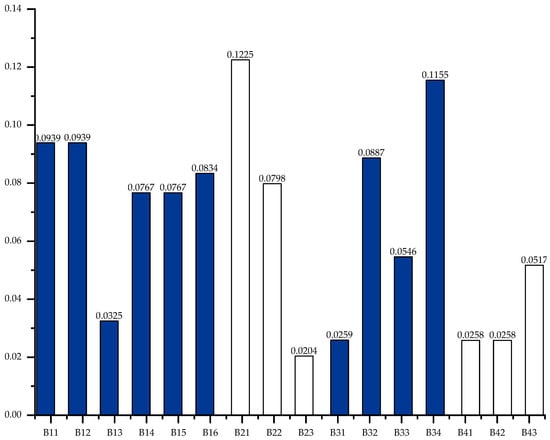
Figure 5.
Index layer weight diagram.
4.2.3. Gray Statistical Calculation
Taking the weight of the BHM evaluation indicator for the first gray group as an example, the gray group statistics are calculated from Equation (13):
Similarly, the evaluation indicator of gray statistics for gray groups 2, 3, and 4 is calculated , , and .
The gray statistics matrix calculated for the 16 secondary evaluation indicators belonging to each gray category is as follows:
The gray statistics of the indicator is calculated by Equation (14):
The evaluation indicator for each gray class weight can be obtained:
By analogy, the univariate gray clustering matrix for all indicators of the index layer is as follows:
4.2.4. Fuzzy Comprehensive Assessment Matrix
The fuzzy comprehensive evaluation matrix of the BHM system is calculated by combining the weight matrix and the univariate fuzzy evaluation matrix using Equation (17):
The comprehensive clustering coefficients of the four gray groups of the BHM system are 0.5161, 0.3719, 0.1013, and 0.
4.2.5. Calculate the Results of the Overall Evaluation
The comprehensive evaluation results are calculated by the fuzzy all-around evaluation matrix and the evaluation grade matrix by Equation (18), and the final comprehensive evaluation score is .
The comprehensive evaluation results of the BHM system are
From Table 3, the BHM system belongs to evaluation level “II”.
5. Conclusions
To accurately grasp the operation status of the BHM system, this paper establishes an evaluation framework based on the DHGF comprehensive evaluation method. The feasibility of the proposed framework is verified by a real-world BHM system, and some main conclusions are summarized below:
The DHGF comprehensive evaluation method integrates the advantages of the improved Delphi method, the analytic hierarchy process, the gray theory, and the fuzzy comprehensive evaluation method, which can effectively meet the needs of qualitative and quantitative evaluation. Specifically, the improved Delphi method can comprehensively consider the opinions of multiple experts and avoid one-sidedness caused by personal subjective factors. Meanwhile, the analytic hierarchy process can comprehensively consider the logical relationship between the importance of multiple evaluation indicators when determining the weight of evaluation indicators. In addition, the gray theory can effectively divide the evaluation levels of each evaluation indicator according to the principle of the maximum gray clustering coefficient and effectively display the influence of each indicator on different evaluation levels; and the fuzzy comprehensive evaluation method can transform qualitative and quantitative analysis into the final quantitative evaluation results;
The evaluation of the operation status of the BHM system is a comprehensive evaluation problem involving multiple indicators. The improved Delphi method is employed to determine the evaluation indicators of the BHM system, and the evaluation indicator system is established, which can reflect the interrelationship between the indicators well. On this basis, the 16 proposed evaluation indicators can depict the operation status of the BHM system well, which is scientific, comprehensive, and feasible;
The case study shows that the proposed indicators are detailed and reasonable, and the comprehensive evaluation framework is effective and feasible. By this framework, the complex indicators of the BHM system can be integrated, and the qualitative and quantitative evaluation can be realized. Therefore, a comprehensive evaluation of the operation status of the BHM system is achieved, and the evaluation results accurately reflect the operation status of the BHM system.
This paper provides a framework for the evaluation of the BHM system and presents the evaluation process through a new BHM system. In this framework, the evaluation indicators (e.g., data quality) can be flexibly adjusted to evaluate the in-service BHM system to achieve more accurate evaluation results.
Author Contributions
J.X. conceived the framework of this paper and wrote this paper. C.W. and Q.T. advised the data analysis and paper organization. R.Z. and T.Y. were involved in paper writing. All authors have read and agreed to the published version of the manuscript.
Funding
This work was supported by National Natural Science Foundation of China (Grant No. 52278292), Chongqing Outstanding Youth Science Foundation (Grant No. CSTB2023NSCQ-JQX0029); Chongqing Science and Technology Project (CSTB2022TIAD-KPX0205); Chongqing Transportation Science and Technology Project (Grant No. 2022-01); Science and Technology Project of Guizhou Department of Transportation (Grant No. 2023-122-001); China Postdoctoral Science Foundation (Grant No. 2023M730431); Special Funding of Chongqing Postdoctoral Research Project (Grant No. 2022CQBSHTB2053).
Institutional Review Board Statement
Not applicable.
Informed Consent Statement
Not applicable.
Data Availability Statement
The data presented in this study are available on request from the corresponding author.
Conflicts of Interest
The authors declare no conflict of interest.
References
- Xin, J.; Tang, H.; Wang, J.; Tang, Q.; Xin, D.; Qu, J. Automatic separation of temperature effects from bridge cable force data based on the VMD-PE-KLD algorithm. Int. J. Robot. Autom. 2023, 38, 247–258. [Google Scholar] [CrossRef]
- Li, S.; Xin, J.; Jiang, Y.; Wang, C.; Zhou, J.; Yang, X. Temperature-induced deflection separation based on bridge deflection data using the TVFEMD-PE-KLD method. J. Civ. Struct. Health Monit. 2023, 13, 781–797. [Google Scholar] [CrossRef]
- Xin, J.; Jiang, Y.; Zhou, J.; Peng, L.; Liu, S.; Tang, Q. Bridge deformation prediction based on SHM data using improved VMD and conditional KDE. Eng. Struct. 2022, 261, 114285. [Google Scholar] [CrossRef]
- Jiang, Y.; Hui, Y.; Wang, Y.; Peng, L.; Huang, G.; Liu, S. A novel eigenvalue-based iterative simulation method for multi-dimensional homogeneous non-Gaussian stochastic vector fields. Struct. Saf. 2023, 100, 102290. [Google Scholar] [CrossRef]
- Chen, Z.; Zhang, C.; Wang, X.; Ma, C. Wind Tunnel Measurements for Flutter of a Long-Afterbody Bridge Deck. Sensors 2017, 17, 335. [Google Scholar] [CrossRef] [PubMed]
- Tang, Q.; Zhou, J.; Xin, J.; Zhao, S.; Zhou, Y. Autoregressive model-based structural damage identification and localization using convolutional neural networks. KSCE J. Civ. Eng. 2020, 24, 2173–2185. [Google Scholar] [CrossRef]
- Tao, T.; Wang, H. Efficient Buffeting Analysis of Long-Span Bridges under Non-Stationary Winds: A 2D Interpolation Enhanced Approach. J. Sound Vib. 2023, 559, 117754. [Google Scholar] [CrossRef]
- Liu, S.; Jiang, Y.; Qiao, K.; Peng, L.; Liu, D. Record-based simulation of three-component long-period ground motions: Hybrid of surface wave separation and multivariate empirical mode decomposition. Soil Dyn. Earthq. Eng. 2023, 172, 108037. [Google Scholar] [CrossRef]
- Jiang, Y.; Zhao, N.; Peng, L.; Zhao, L.; Liu, M. Simulation of stationary wind field based on adaptive interpolation-enhanced scheme. J. Wind Eng. Ind. Aerod. 2019, 195, 104001. [Google Scholar] [CrossRef]
- Zhao, N.; Jiang, Y.; Peng, L.; Chen, X. Fast simulation of nonstationary wind velocity fields by proper orthogonal decomposition interpolation. J. Wind Eng. Ind. Aerod. 2021, 219, 104798. [Google Scholar] [CrossRef]
- Yang, J.; Chen, R.; Zhang, Z.; Zou, Y.; Zhou, J.; Xia, J. Experimental study on the ultimate bearing capacity of damaged RC arches strengthened with ultra-high performance concrete. Eng. Struct. 2023, 279, 115611. [Google Scholar] [CrossRef]
- Jiang, Y.; Liu, S.; Peng, L.; Zhao, N. A novel wind speed prediction method based on robust local mean decomposition, group method of data handling and conditional kernel density estimation. Energ. Convers. Manag. 2019, 200, 112099. [Google Scholar] [CrossRef]
- Xin, J.; Zhou, C.; Jiang, Y.; Tang, Q.; Yang, X.; Zhou, J. A signal recovery method for bridge monitoring system using TVFEMD and encoder-decoder aided LSTM. Measurement 2023, 214, 112797. [Google Scholar] [CrossRef]
- Tang, Q.; Xin, J.; Jiang, Y.; Zhou, J.; Li, S.; Chen, Z. Novel identification technique of moving loads using the random response power spectral density and deep transfer learning. Measurement 2022, 195, 111120. [Google Scholar] [CrossRef]
- Tang, Q.; Xin, J.; Jiang, Y.; Zhou, J.; Li, S.; Fu, L. Fast identification of random loads using the transmissibility of power spectral density and improved adaptive multiplicative regularization. J. Sound Vib. 2022, 534, 117033. [Google Scholar] [CrossRef]
- Jiang, Y.; Zhao, N.; Peng, L.; Liu, S. A new hybrid framework for probabilistic wind speed prediction using deep feature selection and multi-error modification. Energ. Convers. Manag. 2019, 199, 111981. [Google Scholar] [CrossRef]
- Wang, C.; Ansari, F.; Wu, B.; Li, S.; Morgese, M.; Zhou, J. LSTM approach for condition assessment of suspension bridges based on time-series deflection and temperature data. Adv. Struct. Eng. 2022, 25, 3450–3463. [Google Scholar] [CrossRef]
- Jian, X.D.; Zhong, H.Q.; Xia, Y.; Sun, L.M. Faulty data detection and classification for bridge structural health monitoring via statistical and deep-learning approach. Struct. Control Health Monit. 2021, 28, e2824. [Google Scholar] [CrossRef]
- Hajializadeh, D. Deep learning-based indirect bridge damage identification system. Struct. Health Monit.-Int. J. 2023, 22, 897–912. [Google Scholar] [CrossRef]
- Zhang, L.; He, Y.; Cheng, S.; Wang, G.; Wang, B.; Chen, K.; Dong, L. Bayes method for bridge robustness assessment based on monitoring data. In Proceedings of the 10th International Conference on Bridge Maintenance, Safety and Management (IABMAS), Electr Network, Sapporo, Japan, 11–18 April 2021; pp. 2126–2230. [Google Scholar]
- Li, L.; Liu, G.; Zhang, L.; Li, Q. Sensor fault detection with generalized likelihood ratio and correlation coefficient for bridge SHM. J. Sound Vib. 2019, 442, 445–458. [Google Scholar] [CrossRef]
- Li, S.; Jin, L.; Qiu, Y.; Zhang, M.M.; Wang, J. Signal Anomaly Detection of Bridge SHM System Based on Two-Stage Deep Convolutional Neural Networks. Struct. Eng. Int. 2023, 33, 74–83. [Google Scholar] [CrossRef]
- Yu, X.B. Research on Sensor State Evaluation and Fault Diagnosis based on Multi-dimensional Information Fusion. In Proceedings of the International Conference on Optoelectronic Materials and Devices (ICOMD), Guangzhou, China, 18–20 December 2020. [Google Scholar]
- Qin, C.X.; Li, B.D.; Shi, B.; Qin, T.; Xiao, J.T.; Xin, Y.L. Location of substation in similar candidates using comprehensive evaluation method base on DHGF. Measurement 2019, 146, 152–158. [Google Scholar] [CrossRef]
- Jin, D.Z.; Zhou, Y.T.; Liu, J.Y.; Han, M.G. Culture innovation of building enterprises based on WSR. Tech. Technol. Educ. Manag.-Ttem 2010, 5, 785–791. [Google Scholar]
- Xu, X.Y.; Yu, F.S.; Pedrycz, W.; Du, X.B. Multi-source fuzzy comprehensive evaluation. Appl. Soft Comput. 2023, 135, 110042. [Google Scholar] [CrossRef]
- Meng, M.; Zhao, P.; Bai, M.; Wang, J. Fuzzy comprehensive evaluation of performance on urban water supply system. In Proceedings of the 40th Chinese Control Conference, Shanghai, China, 26–28 July 2021; pp. 6679–6684. [Google Scholar]
Disclaimer/Publisher’s Note: The statements, opinions and data contained in all publications are solely those of the individual author(s) and contributor(s) and not of MDPI and/or the editor(s). MDPI and/or the editor(s) disclaim responsibility for any injury to people or property resulting from any ideas, methods, instructions or products referred to in the content. |
© 2023 by the authors. Licensee MDPI, Basel, Switzerland. This article is an open access article distributed under the terms and conditions of the Creative Commons Attribution (CC BY) license (https://creativecommons.org/licenses/by/4.0/).