
The Impact of Stretching Intensities on Neural and Autonomic Responses: Implications for Relaxation
 , and
, and
Abstract
1. Introduction
2. Materials and Methods
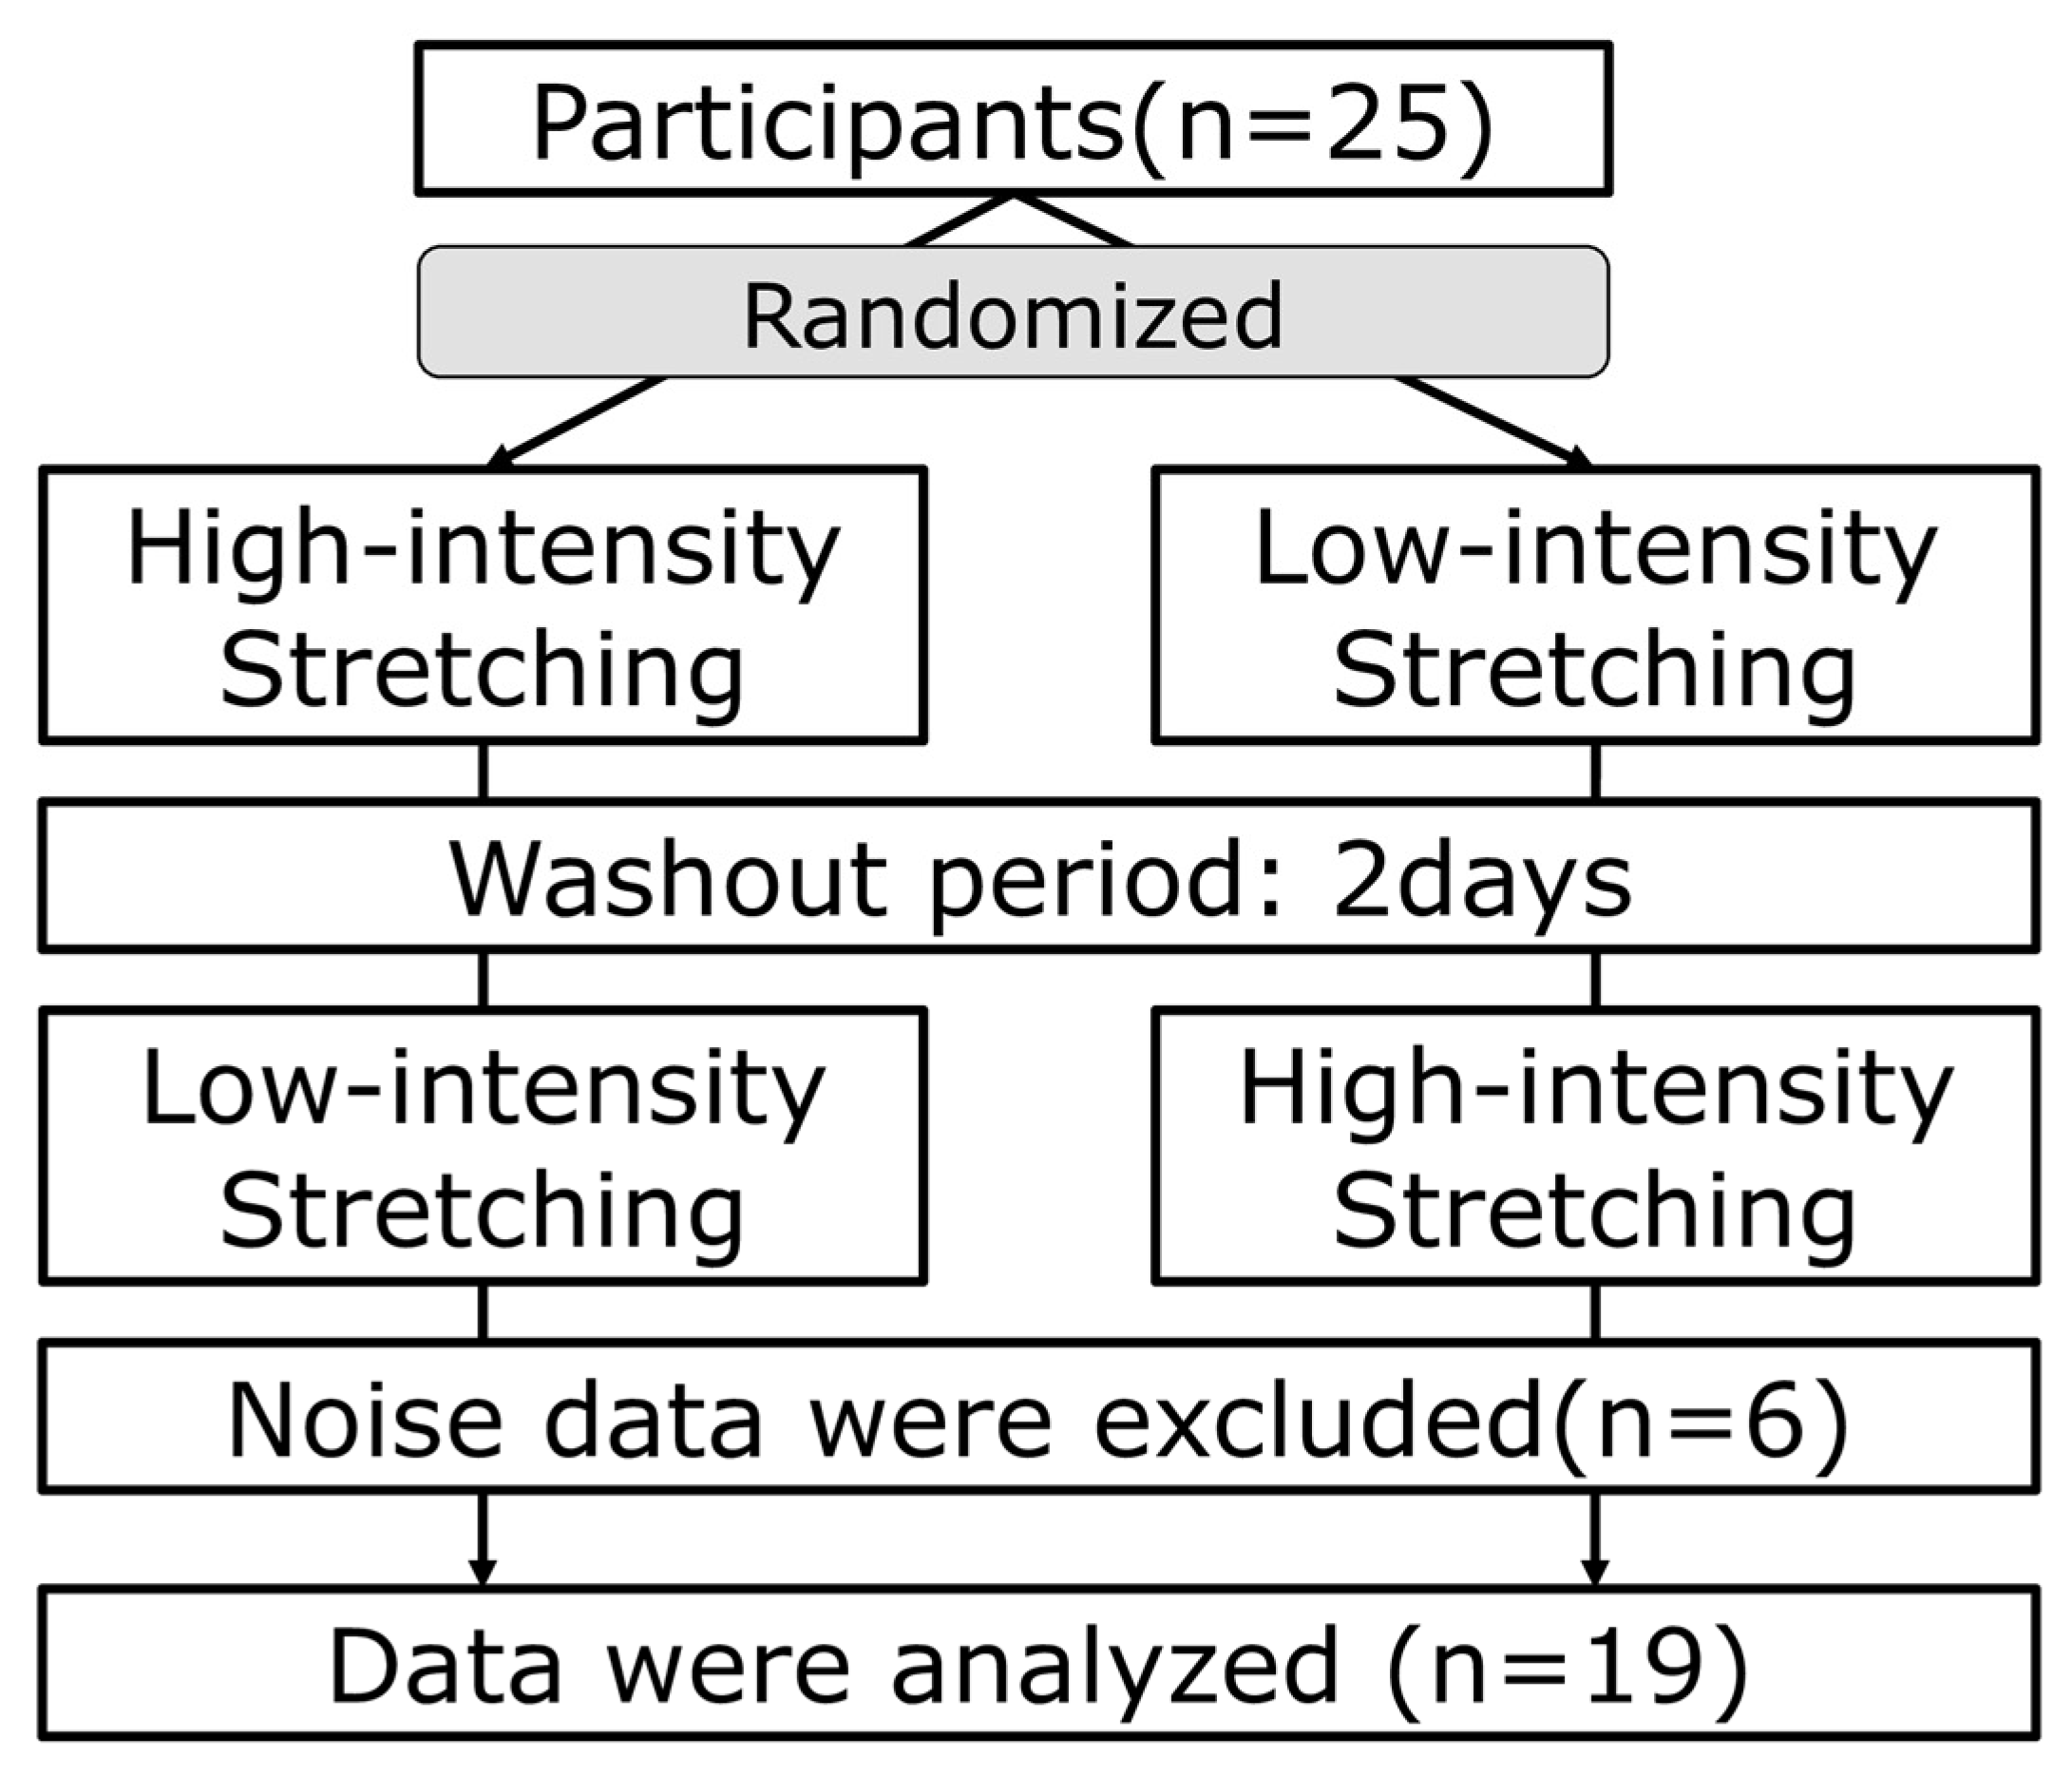
2.1. Participants
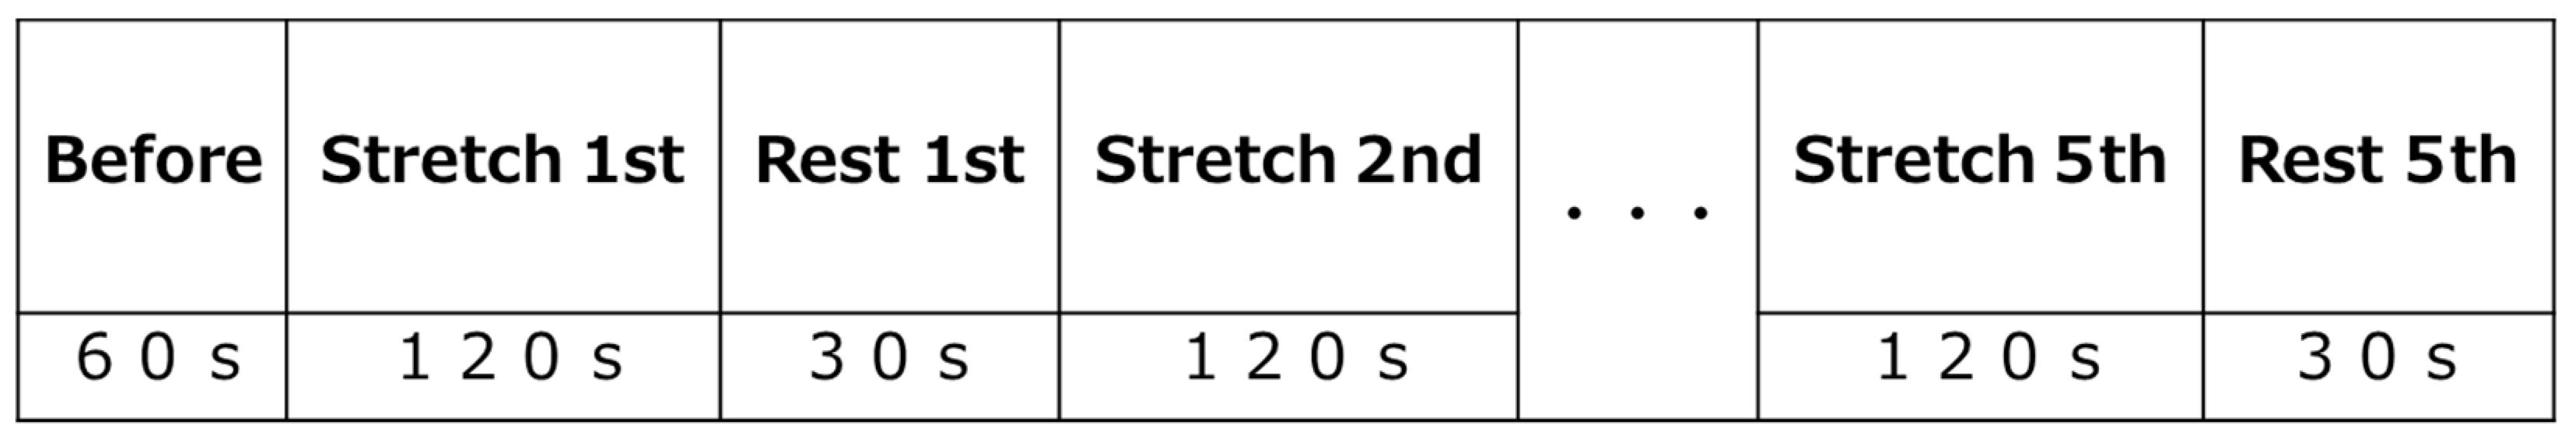
2.2. Protocol
2.3. Two-Dimensional Mood Scale (TDMS)
2.4. Visual Analog Scale (VAS)
2.5. Electroencephalography (EEG)
2.6. Plethysmography
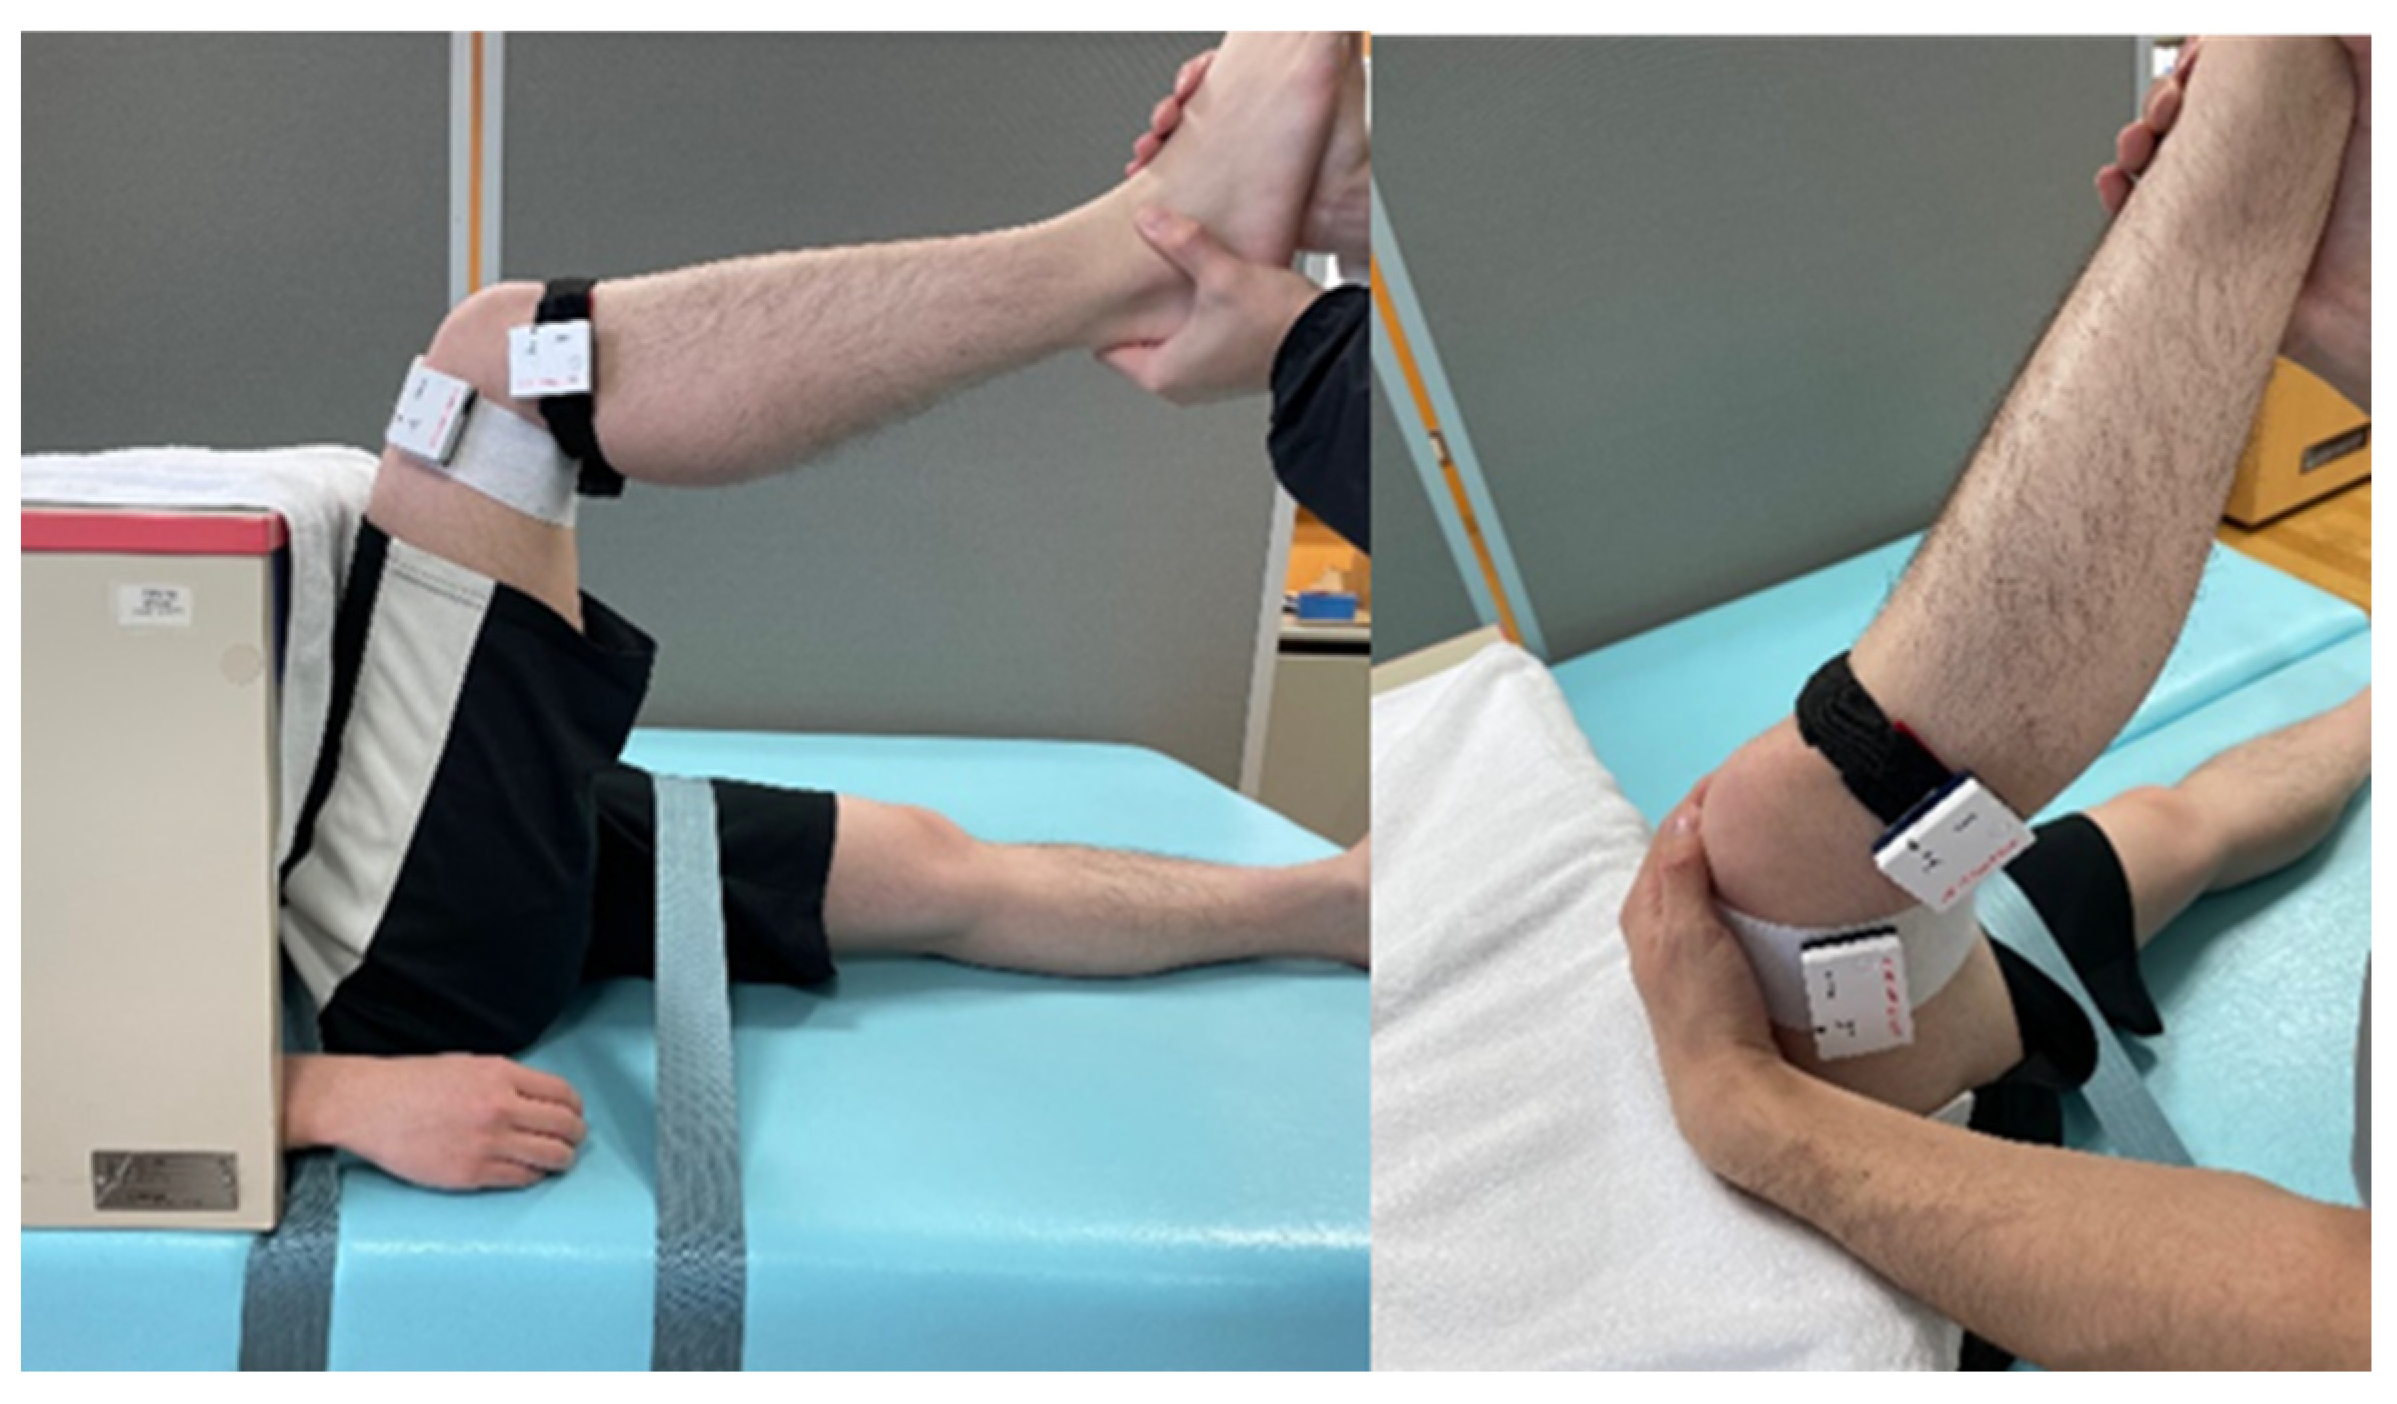
2.7. Joint Angle Measurement
2.8. Stretching
2.9. Data Analysis
2.10. Statistical Analysis
3. Results
3.1. Pleasure and Mood Changes during Stretching: VAS and TDMS
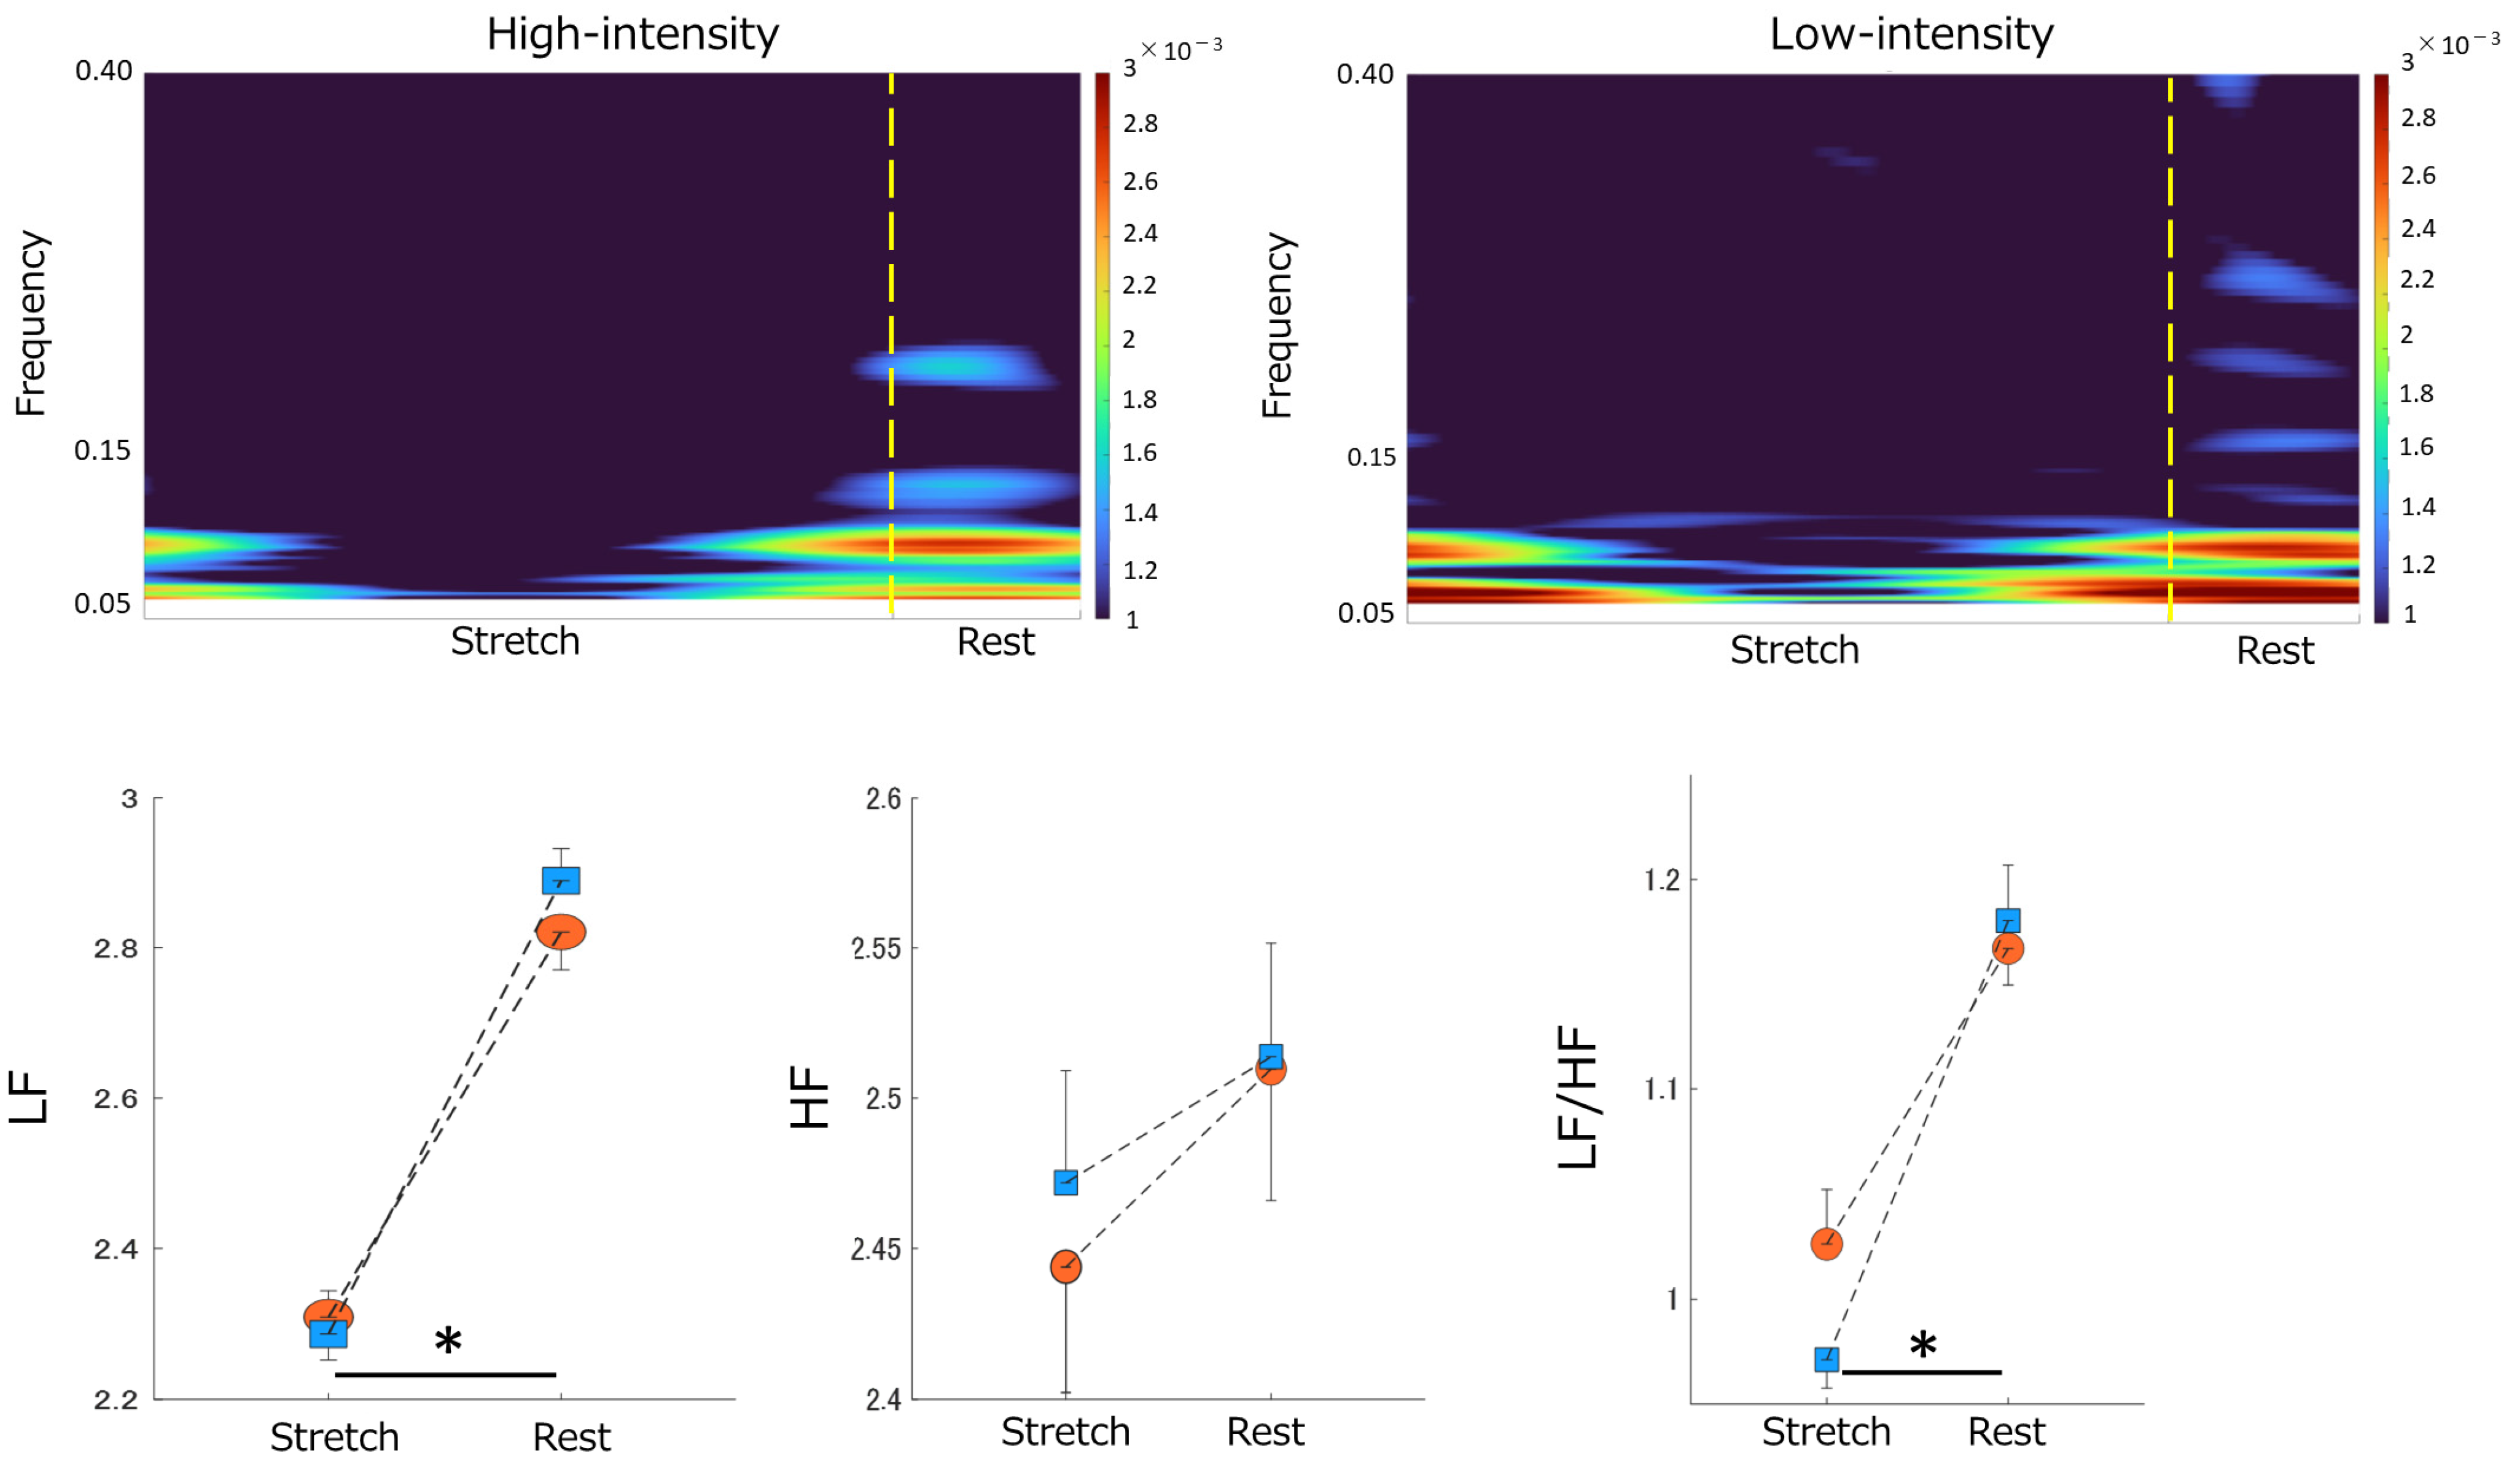
3.2. ANS Activity Changes during Stretching
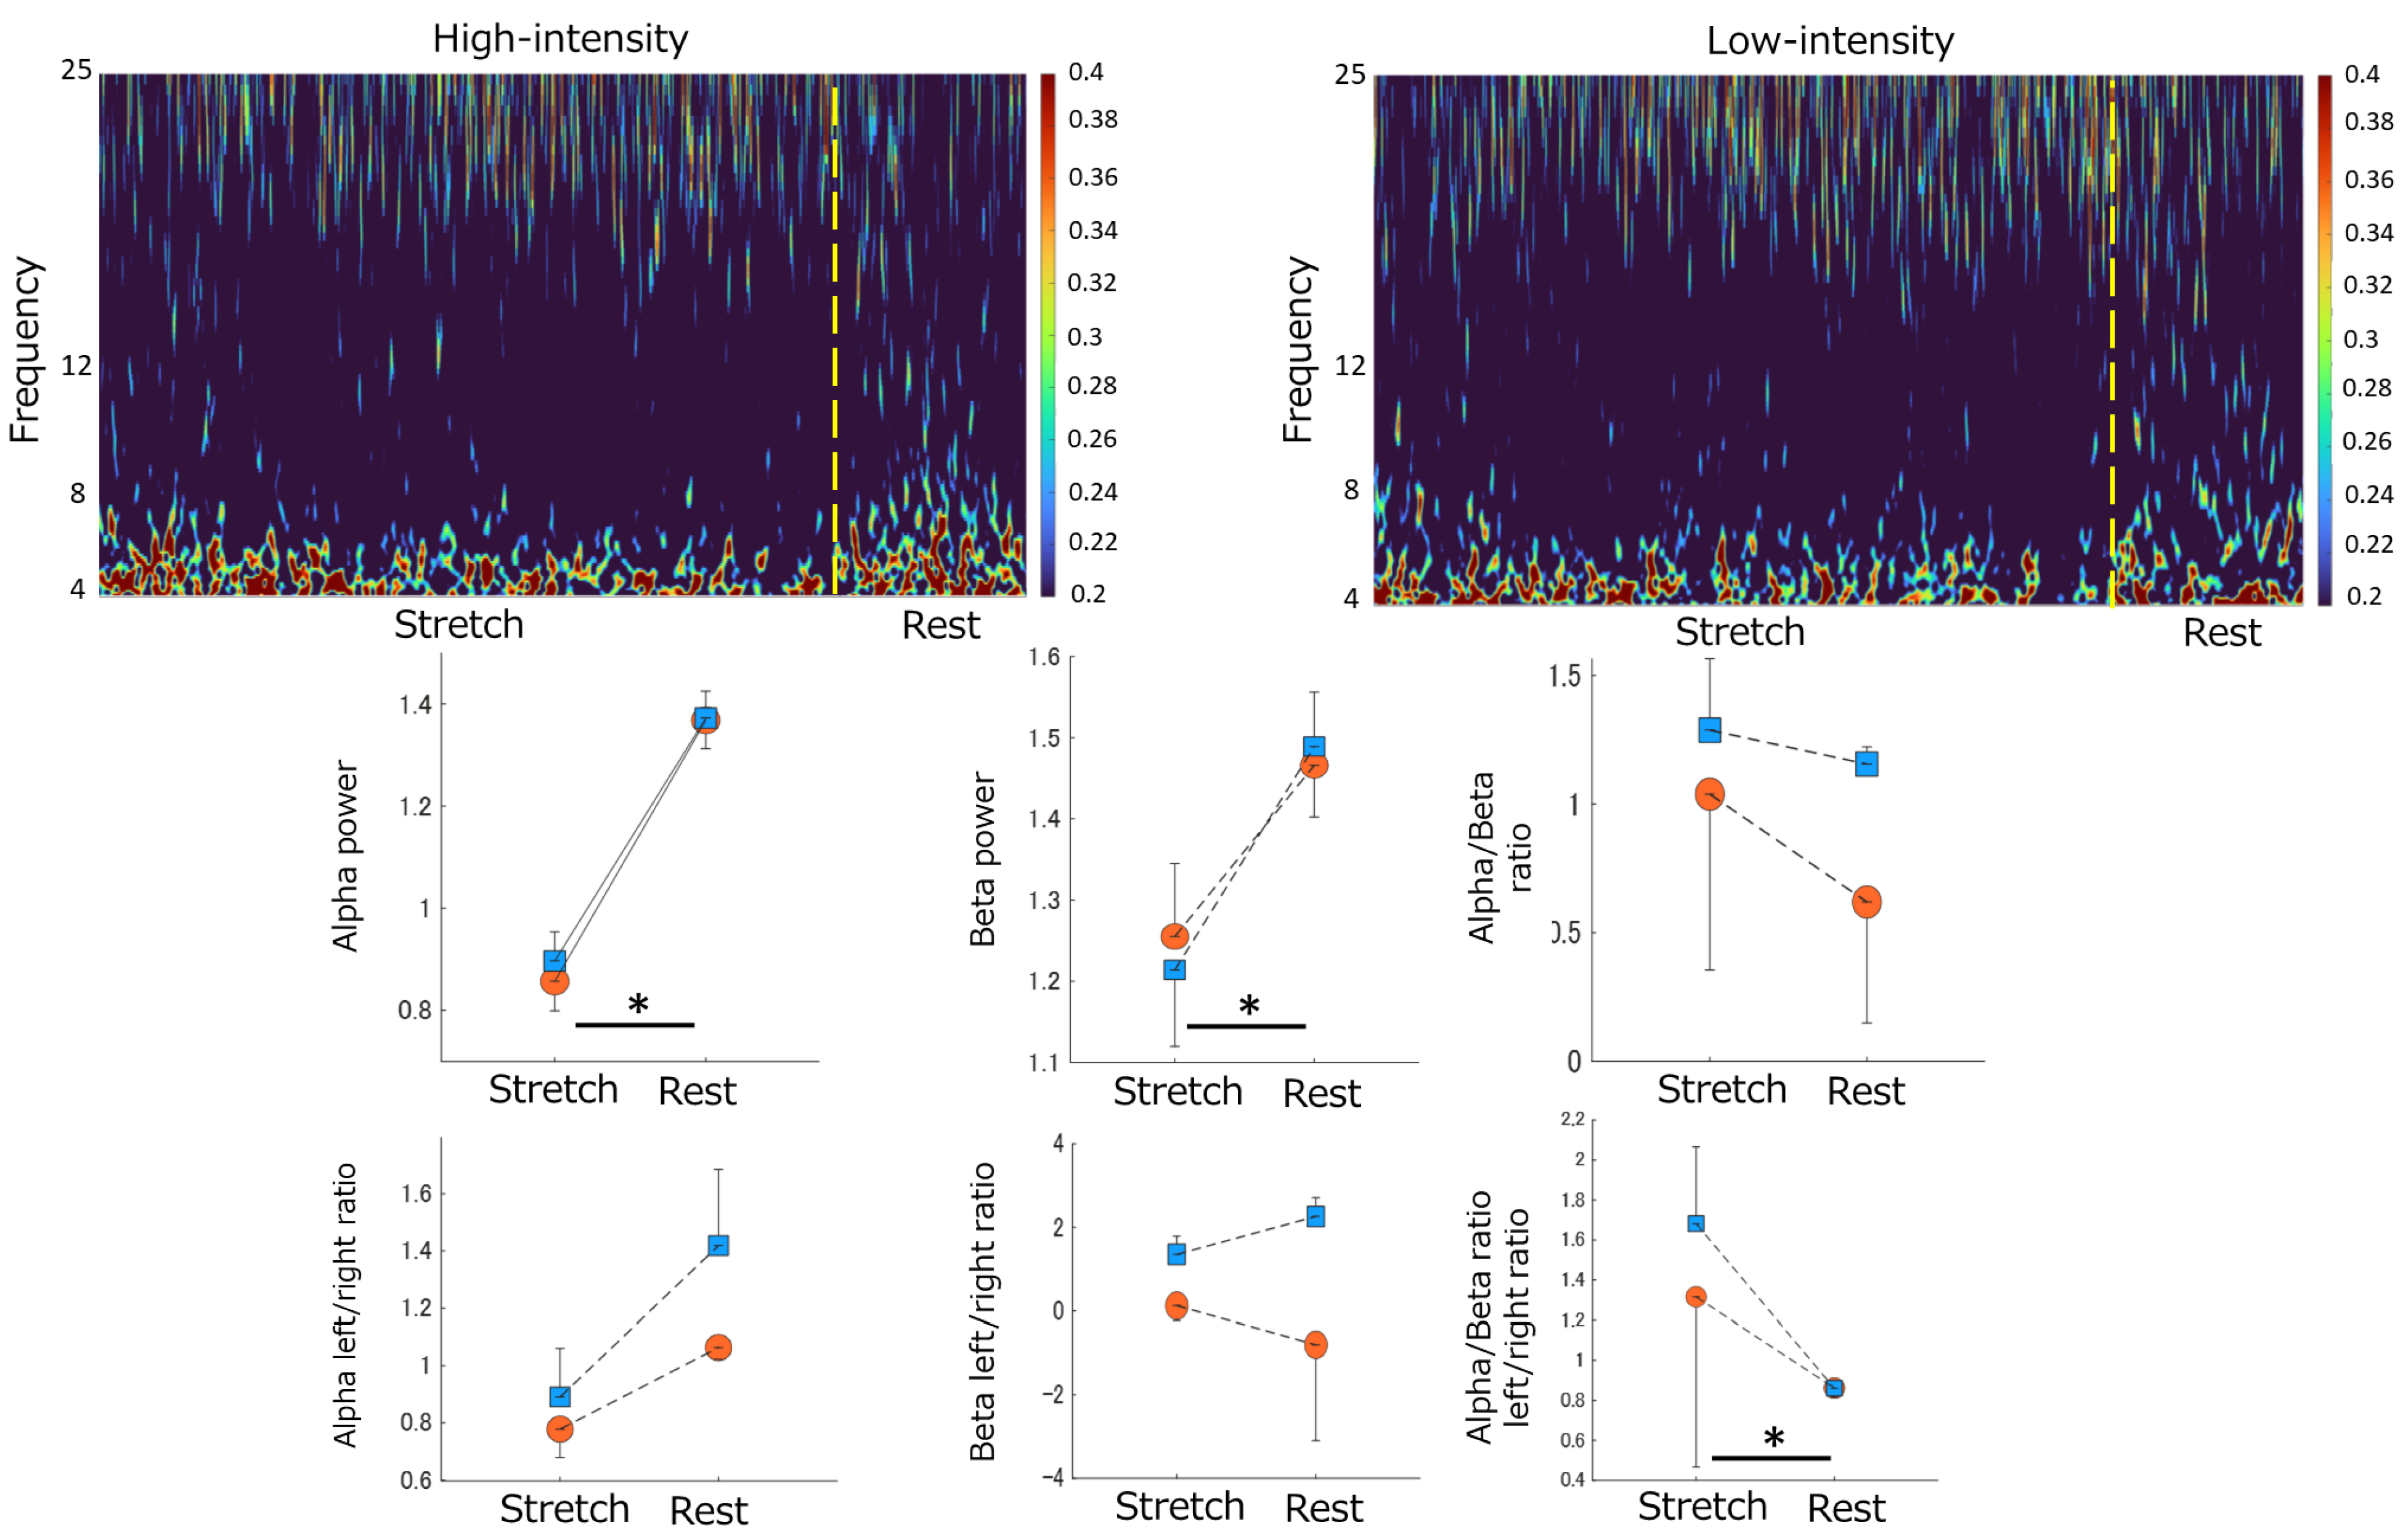
3.3. Brainwave Activity Changes during Stretching
3.4. Correlation between ANS Activity and Brainwave Activity
4. Discussion
5. Conclusions
Author Contributions
Funding
Institutional Review Board Statement
Informed Consent Statement
Data Availability Statement
Acknowledgments
Conflicts of Interest
References
- Paradisis, G.P.; Pappas, P.T.; Theodorou, A.S.; Zacharogiannis, E.G.; Skordilis, E.K.; Smirniotou, A.S. Effects of Static and Dynamic Stretching on Sprint and Jump Performance in Boys and Girls. J. Strength Cond. Res. 2014, 28, 154–160. [Google Scholar] [CrossRef] [PubMed]
- Power, K.; Behm, D.; Cahill, F.; Carroll, M.; Young, W. An Acute Bout of Static Stretching: Effects on Force and Jumping Performance. Med. Sci. Sports Exerc. 2004, 36, 1389–1396. [Google Scholar] [CrossRef] [PubMed]
- Young, W.B.; Behm, D.G. Effects of running, static stretching and practice jumps on explosive force production and jumping performance. J. Sports Med. Phys. Fit. 2003, 43, 21–27. [Google Scholar]
- Young, W.B. The Use of Static Stretching in Warm-Up for Training and Competition. Int. J. Sports Physiol. Perform. 2007, 2, 212–216. [Google Scholar] [CrossRef]
- Ekstrand, J.; Gillquist, J.; Liljedahl, S.O. Prevention of Soccer Injuries. Supervision by Doctor and Physiotherapist. Am. J. Sports Med. 1983, 11, 116–120. [Google Scholar] [CrossRef] [PubMed]
- Hadala, M.; Barrios, C. Different Strategies for Sports Injury Prevention in an America’s Cup Yachting Crew. Med. Sci. Sports Exerc. 2009, 41, 1587–1596. [Google Scholar] [CrossRef]
- Eda, N.; Ito, H.; Akama, T. Beneficial Effects of Yoga Stretching on Salivary Stress Hormones and Parasympathetic Nerve Activity. J. Sports Sci. Med. 2020, 19, 695–702. [Google Scholar]
- Apostolopoulos, N.; Metsios, G.S.; Flouris, A.D.; Koutedakis, Y.; Wyon, M.A. The relevance of stretch intensity and position—A systematic review. Front. Psychol. 2015, 6, 1128. [Google Scholar] [CrossRef]
- Oba, K.; Samukawa, M.; Nakamura, K.; Mikami, K.; Suzumori, Y.; Ishida, Y.; Keeler, N.; Saitoh, H.; Yamanaka, M.; Tohyama, H. Influence of Constant Torque Stretching at Different Stretching Intensities on Flexibility and Mechanical Properties of Plantar Flexors. J. Strength Cond. Res. 2021, 35, 709–714. [Google Scholar] [CrossRef]
- Nakamura, M.; Yahata, K.; Sato, S.; Kiyono, R.; Yoshida, R.; Fukaya, T.; Nunes, J.P.; Konrad, A. Training and Detraining Effects Following a Static Stretching Program on Medial Gastrocnemius Passive Properties. Front. Physiol. 2021, 12, 656579. [Google Scholar] [CrossRef]
- Takeuchi, K.; Sato, S.; Kiyono, R.; Yahata, K.; Murakami, Y.; Sanuki, F.; Yoshida, R.; Nakamura, M. High-Intensity Static Stretching in Quadriceps Is Affected More by Its Intensity Than Its Duration. Front. Physiol. 2021, 12, 709655. [Google Scholar] [CrossRef] [PubMed]
- Koudelková, Z.; Strmiska, M. Introduction to the identification of brain waves based on their frequency. MATEC Web Conf. 2018, 210, 05012. [Google Scholar] [CrossRef]
- Tindle, J.; Tadi, P. Neuroanatomy, Parasympathetic Nervous System. In StatPearls; StatPearls Publishing: Treasure Island, FL, USA, 2022. [Google Scholar]
- Inami, T.; Shimizu, T.; Baba, R.; Nakagaki, A. Acute Changes in Autonomic Nerve Activity during Passive Static Stretching. Am. J. Sports Sci. Med. 2014, 2, 166–170. [Google Scholar] [CrossRef]
- Venturelli, M.; Rampichini, S.; Coratella, G.; Limonta, E.; Bisconti, A.V.; Cé, E.; Esposito, F. Heart and musculoskeletal hemodynamic responses to repetitive bouts of quadriceps static stretching. J. Appl. Physiol. 2019, 127, 376–384. [Google Scholar] [CrossRef] [PubMed]
- Einerman, C.; Eleff, E.; Ilijeska, A.; Zinberg, A. The Effects of Morning versus Evening Stretching Exercises in Hamstrings Flexibility Gains; City University of New York (CUNY): New York, NY, USA, 2014. [Google Scholar]
- Wattananon, P.; Prasertkul, W.; Sakulsriprasert, P.; Laskin, J.J. Effect of increased relative stiffness of the lumbar spine on hamstring muscle stretching in individuals with a history of low back pain suspected to have a clinical lumbar instability: A randomized crossover design. Clin. Biomech. 2020, 75, 104996. [Google Scholar] [CrossRef]
- Sakairi, Y.; Nakatsuka, K.; Shimizu, T. Development of the Two-Dimensional Mood Scale for self-monitoring and self-regulation of momentary mood states. Jpn. Psychol. Res. 2013, 55, 338–349. [Google Scholar] [CrossRef]
- Selles, R.W.; Li, X.; Lin, F.; Chung, S.G.; Roth, E.J.; Zhang, L.-Q. Feedback-Controlled and Programmed Stretching of the Ankle Plantarflexors and Dorsiflexors in Stroke: Effects of a 4-Week Intervention Program. Arch. Phys. Med. Rehabil. 2005, 86, 2330–2336. [Google Scholar] [CrossRef]
- Petrantonakis, P.C.; Hadjileontiadis, L.J. Emotion Recognition from EEG Using Higher Order Crossings. IEEE Trans. Inf. Technol. Biomed. 2009, 14, 186–197. [Google Scholar] [CrossRef]
- Tanaka, M.; Shigihara, Y.; Ishii, A.; Funakura, M.; Kanai, E.; Watanabe, Y. Effect of mental fatigue on the central nervous system: An electroencephalography study. Behav. Brain Funct. 2012, 8, 48. [Google Scholar] [CrossRef]
- Thammasan, N.; Moriyama, K.; Fukui, K.-I.; Numao, M. Continuous Music-Emotion Recognition Based on Electroencephalogram. IEICE Trans. Inf. Syst. 2016, 99, 1234–1241. [Google Scholar] [CrossRef]
- Jie, X.; Cao, R.; Li, L. Emotion recognition based on the sample entropy of EEG. Bio-Medical Mater. Eng. 2014, 24, 1185–1192. [Google Scholar] [CrossRef] [PubMed]
- Lin, I.-M.; Fan, S.-Y.; Lu, Y.-H.; Lee, C.-S.; Wu, K.-T.; Ji, H.-J. Exploring the blood volume amplitude and pulse transit time during anger recall in patients with coronary artery disease. J. Cardiol. 2014, 65, 50–56. [Google Scholar] [CrossRef][Green Version]
- Pagani, M.; Lombardi, F.; Guzzetti, S.; Rimoldi, O.; Furlan, R.; Pizzinelli, P.; Sandrone, G.; Malfatto, G.; Dell’Orto, S.; Piccaluga, E. Power spectral analysis of heart rate and arterial pressure variabilities as a marker of sympatho-vagal interaction in man and conscious dog. Circ. Res. 1986, 59, 178–193. [Google Scholar] [CrossRef]
- Ballantyne, F.; Fryer, G.; McLaughlin, P. The effect of muscle energy technique on hamstring extensibility: The mechanism of altered flexibility. J. Osteopat. Med. 2003, 6, 59–63. [Google Scholar] [CrossRef]
- Nakamura, M.; Ikezoe, T.; Takeno, Y.; Ichihashi, N. Time course of changes in passive properties of the gastrocnemius muscle–tendon unit during 5 min of static stretching. Man. Ther. 2013, 18, 211–215. [Google Scholar] [CrossRef] [PubMed]
- Kim, H.-G.; Cheon, E.-J.; Bai, D.-S.; Lee, Y.H.; Koo, B.-H. Stress and Heart Rate Variability: A Meta-Analysis and Review of the Literature. Psychiatry Investig. 2018, 15, 235–245. [Google Scholar] [CrossRef]
- Kannan, H.; Yamashita, H.; Koizumi, K.; Brooks, C.M. Neuronal activity of the cat supraoptic nucleus is influenced by muscle small-diameter afferent (groups III and IV) receptors. Proc. Natl. Acad. Sci. USA 1988, 85, 5744–5748. [Google Scholar] [CrossRef]
- Hébert, M.T.; Marshall, J.M. Direct observations of the effects of baroreceptor stimulation on skeletal muscle circulation of the rat. J. Physiol. 1988, 400, 45–59. [Google Scholar] [CrossRef] [PubMed]
- Cui, J.; Blaha, C.; Moradkhan, R.; Gray, K.S.; Sinoway, L.I. Muscle sympathetic nerve activity responses to dynamic passive muscle stretch in humans. J. Physiol. 2006, 576, 625–634. [Google Scholar] [CrossRef]
- Watanabe, N.; Hotta, H. Heart Rate Changes in Response to Mechanical Pressure Stimulation of Skeletal Muscles Are Mediated by Cardiac Sympathetic Nerve Activity. Front. Neurosci. 2017, 10, 614. [Google Scholar] [CrossRef] [PubMed]
- Gladwell, V.F.; Fletcher, J.; Patel, N.; Elvidge, L.J.; Lloyd, D.; Chowdhary, S.; Coote, J.H. The influence of small fibre muscle mechanoreceptors on the cardiac vagus in humans. J. Physiol. 2005, 567, 713–721. [Google Scholar] [CrossRef] [PubMed]
- Wongwilairat, K.; Buranruk, O.; Eungpinichpong, W.; Puntumetakul, R.; Kantharadussadee-Triamchaisri, S. Muscle stretching with deep and slow breathing patterns: A pilot study for therapeutic development. J. Complement. Integr. Med. 2018, 16, 20170167. [Google Scholar] [CrossRef]
- de Munck, J.C.; Gonçalves, S.I.; Faes, T.J.C.; Kuijer, J.P.A.; Pouwels, P.J.W.; Heethaar, R.M.; Lopes da Silva, F.H. A Study of the Brain’s Resting State Based on Alpha Band Power, Heart Rate and FMRI. Neuroimage 2008, 42, 112–121. [Google Scholar] [CrossRef] [PubMed]
- Takahashi, T.; Murata, T.; Hamada, T.; Omori, M.; Kosaka, H.; Kikuchi, M.; Yoshida, H.; Wada, Y. Changes in EEG and autonomic nervous activity during meditation and their association with personality traits. Int. J. Psychophysiol. 2005, 55, 199–207. [Google Scholar] [CrossRef] [PubMed]
- Ahern, G.L.; Schwartz, G.E. Differential lateralization for positive and negative emotion in the human brain: EEG spectral analysis. Neuropsychologia 1985, 23, 745–755. [Google Scholar] [CrossRef]
- Cheron, G.; Petit, G.; Cheron, J.; Leroy, A.; Cebolla, A.; Cevallos, C.; Petieau, M.; Hoellinger, T.; Zarka, D.; Clarinval, A.-M.; et al. Brain Oscillations in Sport: Toward EEG Biomarkers of Performance. Front. Psychol. 2016, 7, 246. [Google Scholar] [CrossRef]
- Abdullah, H.; Maddage, N.C.; Cosic, I.; Cvetkovic, D. Cross-correlation of EEG frequency bands and heart rate variability for sleep apnoea classification. Med. Biol. Eng. Comput. 2010, 48, 1261–1269. [Google Scholar] [CrossRef]
- von Mohr, M.; Crowley, M.J.; Walthall, J.; Mayes, L.C.; Pelphrey, K.A.; Rutherford, H.J.V. EEG captures affective touch: CT-optimal touch and neural oscillations. Cogn. Affect. Behav. Neurosci. 2018, 18, 155–166. [Google Scholar] [CrossRef]
- Singh, H.; Bauer, M.; Chowanski, W.; Sui, Y.; Atkinson, D.; Baurley, S.; Fry, M.; Evans, J.; Bianchi-Berthouze, N. The Brain’s Response to Pleasant Touch: An EEG Investigation of Tactile Caressing. Front. Hum. Neurosci. 2014, 8, 893. [Google Scholar] [CrossRef]
- Thayer, J.F.; Lane, R.D. Claude Bernard and the heart–brain connection: Further elaboration of a model of neurovisceral integration. Neurosci. Biobehav. Rev. 2009, 33, 81–88. [Google Scholar] [CrossRef]
- Forte, G.; Favieri, F.; Casagrande, M. Heart Rate Variability and Cognitive Function: A Systematic Review. Front. Neurosci. 2019, 13, 710. [Google Scholar] [CrossRef] [PubMed]
- Reisert, M.; Weiller, C.; Hosp, J. Displaying the autonomic processing network in humans—A global tractography approach. Neuroimage 2021, 231, 117852. [Google Scholar] [CrossRef] [PubMed]
- Komori, T. Extreme Prolongation of Expiration Breathing: Effects on Electroencephalogram and Autonomic Nervous Function. Ment. Illn. 2018, 10, 7881. [Google Scholar] [PubMed]
- Park, Y.-J. Association of autonomic function and brain activity with personality traits by paced breathing and su-soku practice: A three-way crossover study. Complement. Ther. Med. 2021, 63, 102778. [Google Scholar] [CrossRef]


| Intensity | Trial (VAS)/ Pre-Post (TDMS) | Intensity × Trial (VAS)/ Pre-Post (TDMS) | |
|---|---|---|---|
| VAS | p = 0.82 | p = 0.87 | p = 0.23 |
| η2 ≤ 0.01 | η2 ≤ 0.01 | η2 ≤ 0.01 | |
| TDMS | |||
| Stability | p = 0.001 ** | p = 0.41 | p = 0.001 ** |
| η2 = 0.18 | η2 ≤ 0.01 | η2 = 0.25 | |
| Activation | p = 0.47 | p = 0.62 | p = 0.75 |
| η2 ≤ 0.01 | η 2 ≤ 0.01 | η2 ≤ 0.01 |
| Variable | Intensity | Trial | Phase | Intensity ×Trial | Intensity ×Phase | Trial ×Phase | Intensity ×Trial ×Phase |
|---|---|---|---|---|---|---|---|
| HRV | |||||||
| LF | p = 0.76 | p = 0.69 | p = 0.001 ** | p = 0.40 | p = 0.14 | p = 0.92 | p = 0.27 |
| η2 ≤ 0.01 | η2 ≤ 0.01 | η2 = 0.33 | η2 ≤ 0.01 | η2 ≤ 0.01 | η2 = 0.011 | η2 ≤ 0.01 | |
| HF | p = 0.83 | p = 0.74 | p = 0.22 | p = 0.23 | p = 0.50 | p = 0.65 | p = 0.33 |
| η2 ≤ 0.01 | η2 ≤ 0.01 | η2 ≤ 0.01 | η2 = 0.010 | η2 ≤ 0.01 | η2 ≤ 0.01 | η2 ≤ 0.01 | |
| LF/HF ratio | p = 0.39 | p = 0.64 | p = 0.001 ** | p = 0.29 | p = 0.071 | p = 0.76 | p = 0.035 * |
| η2 ≤ 0.01 | η2 ≤ 0.01 | η2 = 0.15 | η2 ≤ 0.01 | η2 ≤ 0.01 | η2 ≤ 0.01 | η2 = 0.016 | |
| EEG | |||||||
| Fp1 + Fp2 average | |||||||
| α power | p = 0.72 | p = 0.001 ** | p = 0.001 ** | p = 0.81 | p = 0.55 | p = 0.047 * | p = 0.46 |
| η2 ≤ 0.01 | η2 = 0.050 | η2 = 0.18 | η2 ≤ 0.01 | η2 ≤ 0.01 | η2 ≤ 0.01 | η2 ≤ 0.01 | |
| β power | p = 0.92 | p = 0.19 | p = 0.0082 ** | p = 0.73 | p = 0.40 | p = 0.36 | p = 0.35 |
| η2 ≤ 0.01 | η2 ≤ 0.01 | η2 = 0.024 | η2 ≤ 0.01 | η2 ≤ 0.01 | η2 ≤ 0.01 | η2 ≤ 0.01 | |
| α/β ratio | p = 0.26 | p = 0.43 | p = 0.46 | p = 0.53 | p = 0.70 | p = 0.22 | p = 0.84 |
| η2 ≤ 0.01 | η2 = 0.015 | η2 ≤ 0.01 | η2 = 0.012 | η2 ≤ 0.01 | η2 = 0.011 | η2 ≤ 0.01 | |
| Left/Right ratio | |||||||
| α power | p = 0.06 | p = 0.27 | p = 0.083 | p = 0.28 | p = 0.66 | p = 1.0 | p = 0.62 |
| η2 ≤ 0.01 | η2 ≤ 0.01 | η2 = 0.016 | η2 = 0.012 | η2 ≤ 0.01 | η2 ≤ 0.01 | η2 ≤ 0.01 | |
| β power | p = 0.16 | p = 0.51 | p = 1.0 | p = 0.31 | p = 0.38 | p = 0.27 | p = 0.65 |
| η2 ≤ 0.01 | η2 ≤ 0.01 | η2 ≤ 0.01 | η2 = 0.012 | η2 ≤ 0.01 | η2 = 0.015 | η2 ≤ 0.01 | |
| α/β ratio | p = 0.46 | p = 0.50 | p = 0.037 * | p = 0.76 | p = 0.36 | p = 0.46 | p = 0.79 |
| η2 ≤ 0.01 | η2 = 0.011 | η2 ≤ 0.01 | η2 ≤ 0.01 | η2 ≤ 0.01 | η2 = 0.011 | η2 ≤ 0.01 | |
| LF Stretch | LF Rest | HF Stretch | HF Rest | LF/HF Ratio Stretch | LF/HF Ratio Rest | ||
|---|---|---|---|---|---|---|---|
| Low− intensity | Fp1 + Fp2 average | ||||||
| α power Stretch | 0.14 | −0.14 | 0.20 | 0.15 | −0.09 | −0.41 | |
| α power rest | 0.15 | −0.22 | 0.20 | 0.1 | −0.09 | −0.33 | |
| β power Stretch | 0.47 * | 0.22 | 0.42 | 0.34 | −0.10 | −0.07 | |
| β power rest | 0.41 | 0.24 | 0.50 * | 0.37 | −0.3 | 0.01 | |
| α/β ratio Stretch | 0.01 | 0.07 | 0.10 | 0.13 | −0.12 | −0.09 | |
| α/β ratio rest | −0.23 | −0.33 | −0.23 | −0.25 | 0.17 | −0.33 | |
| Left/Right ratio | |||||||
| α power Stretch | 0.14 | 0.26 | 0.03 | 0.05 | 0.11 | 0.19 | |
| α power rest | 0.08 | 0.29 | 0.01 | 0.03 | 0.02 | 0.19 | |
| β power Stretch | 0.16 | −0.19 | −0.02 | −0.06 | 0.13 | 0.06 | |
| β power rest | 0 | 0.10 | 0.03 | −0.06 | −0.21 | 0.04 | |
| α/β ratio Stretch | −0.04 | −0.15 | −0.04 | −0.06 | −0.07 | −0.18 | |
| α/β ratio rest | 0.1 | −0.04 | 0.11 | 0.09 | 0.12 | −0.09 | |
| High− intensity | Fp1 + Fp2 average | ||||||
| α power Stretch | −0.26 | −0.51 * | 0.12 | −0.14 | −0.28 | −0.61 ** | |
| α power rest | −0.08 | −0.40 | 0.30 | 0 | −0.35 | −0.65 ** | |
| β power Stretch | −0.17 | −0.28 | 0.26 | 0.03 | −0.18 | −0.42 | |
| β power rest | −0.03 | −0.19 | 0.33 | 0.09 | −0.18 | −0.37 | |
| α/β ratio Stretch | 0.15 | 0.14 | 0.07 | 0.11 | −0.04 | −0.01 | |
| α/β ratio rest | −0.33 | −0.4 | −0.05 | −0.23 | −0.12 | −0.20 | |
| Left/Right ratio | |||||||
| α power Stretch | −0.18 | −0.10 | 0.15 | 0.04 | −0.19 | −0.22 | |
| α power rest | 0.33 | 0.32 | 0.12 | 0.28 | 0.01 | −0.01 | |
| β power Stretch | −0.25 | −0.19 | 0.03 | −0.11 | −0.08 | −0.09 | |
| β power rest | −0.31 | −0.36 | −0.03 | −0.22 | −0.11 | −0.16 | |
| α/β ratio Stretch | 0.11 | 0.19 | 0.05 | 0.14 | 0 | 0.03 | |
| α/β ratio rest | −0.29 | −0.26 | −0.11 | −0.12 | 0.09 | −0.16 |
Disclaimer/Publisher’s Note: The statements, opinions and data contained in all publications are solely those of the individual author(s) and contributor(s) and not of MDPI and/or the editor(s). MDPI and/or the editor(s) disclaim responsibility for any injury to people or property resulting from any ideas, methods, instructions or products referred to in the content. |
© 2023 by the authors. Licensee MDPI, Basel, Switzerland. This article is an open access article distributed under the terms and conditions of the Creative Commons Attribution (CC BY) license (https://creativecommons.org/licenses/by/4.0/).
Share and Cite
Imagawa, N.; Mizuno, Y.; Nakata, I.; Komoto, N.; Sakebayashi, H.; Shigetoh, H.; Kodama, T.; Miyazaki, J. The Impact of Stretching Intensities on Neural and Autonomic Responses: Implications for Relaxation. Sensors 2023, 23, 6890. https://doi.org/10.3390/s23156890
Imagawa N, Mizuno Y, Nakata I, Komoto N, Sakebayashi H, Shigetoh H, Kodama T, Miyazaki J. The Impact of Stretching Intensities on Neural and Autonomic Responses: Implications for Relaxation. Sensors. 2023; 23(15):6890. https://doi.org/10.3390/s23156890
Chicago/Turabian StyleImagawa, Naoto, Yuji Mizuno, Ibuki Nakata, Natsuna Komoto, Hanako Sakebayashi, Hayato Shigetoh, Takayuki Kodama, and Junya Miyazaki. 2023. "The Impact of Stretching Intensities on Neural and Autonomic Responses: Implications for Relaxation" Sensors 23, no. 15: 6890. https://doi.org/10.3390/s23156890
APA StyleImagawa, N., Mizuno, Y., Nakata, I., Komoto, N., Sakebayashi, H., Shigetoh, H., Kodama, T., & Miyazaki, J. (2023). The Impact of Stretching Intensities on Neural and Autonomic Responses: Implications for Relaxation. Sensors, 23(15), 6890. https://doi.org/10.3390/s23156890