Abstract
Bound states in the continuum (BICs) garnered significant research interest in the field of sensors due to their exceptionally high-quality factors. However, the wide-band continuum in BICs are noise to the bound states, and it is difficult to control and filter. Therefore, we constructed a top-bottom symmetric cavity containing three high permittivity rectangular columns. The cavity supports a symmetry-protected (SP) superbound state (SBS) mode and an accidental (AC) SBS mode within the bandgap. With a period size of 5 × 15, the bandgap effectively filters out the continuum, allowing only the bound states to exist. This configuration enabled us to achieve a high signal-to-noise ratio and a wide free-spectral-range. The AC SBS and the SP SBS can be converted into quasi-SBS by adjusting different parameters. Consequently, the cavity can function as a single-band sensor or a dual-band sensor. The achieved bulk sensitivity was 38 µm/RIU in terahertz wave band, and a record-high FOM reached 2.8 × 10⁸ RIU−1. The effect of fabrication error on the performance for sensor application was also discussed, showing that the application was feasible. Moreover, for experimental realization, a 3D schematic was presented. These achievements pave the way for compact, high-sensitivity biosensing, multi-wavelength sensing, and other promising applications.
1. Introduction
Bound states in continuums (BICs) attracted significant attention for open systems without coupling channels from outside radiation, as they possess infinite Q-factors and have become a hot topic of research in interfering systems [1,2], extending from quantum mechanics [3] to photonics [1,2,3,4]. BICs can be divided into several groups based on their intrinsic topological nature, with two of the most conventional kinds being symmetry-protected (SP) BICs, and accidental (AC) BICs [5]. An symmetry-protected (SP) BIC exists in a system that exhibits mirror or rotational symmetry, and this BIC mode belongs to different symmetry classes that completely decouple with the system as long as the symmetry is preserved [1], while an accidental (AC) BIC is a single resonance that evolves into a BIC when enough parameters are tuned. The single resonance itself can be thought of as arising from two (or more) sets of waves, and the radiation of the constituting waves can be tuned to cancel each other [1]. The BIC represents a perfectly localized state with no leakage energy, even when it coexists with a continuous spectrum of radiating waves, which effectively manipulates the light-matter interaction and generates an ultrahigh Q-factor resonance [1,2]. Thus, BICs found prospects in various material systems of photonics crystals [6,7,8], topological insulators [9,10], and metamaterials [11,12,13].
The optical BIC is invisible with zero linewidth and an infinite Q-factor in its optical spectra [14]. When it collapses to the quasi-BIC (QBIC), it can be experimentally observed with a highly enhanced Q factor [14,15,16,17] and other interesting phenomena [1,2]. These unique features distinguish BICs from the traditional optical modes and significantly improve the performance of optical devices, especially for sensors, whose sensitivity is directly affected by the Q factor. In recent years, BICs were well explored in the literature for sensors in different structures, such as photonic crystals [7,18,19], metasurfaces [20,21,22,23,24,25,26,27,28,29,30,31,32,33,34,35], and gratings [36,37,38,39]. These BIC sensors have different uses, for instance, refractive index sensing [7,25,28,30,36,39,40], biosensing [20,34,41,42], and gas detection [37], ranging from visible [37] to infrared [23,33,38,39] to THz [21,22,29,31,35,43] regions.
However, BICs are locked in the passband of the continua in an open system, and these continua can be regarded as noise, limited the free-spectral-range (FSR, namely, there exists only one resonance within a broad optical span) of the sensors, and the FSR directly limits the operation span. Nevertheless, limited by the finite periodic system [44], or fabrication errors [45], the radiative loss is difficult to suppress, and only QBICs with finite radiative lifetime can be actually observed, exhibiting Fano resonances in the scattering spectrum [14,15,16,17,46]. The Q-factors of most QBICs are affected by the dimension of the open systems [8,47]; the larger the period, the higher the Q-factor. Obtaining high Q-values with small structural sizes is, therefore, challenging.
Therefore, the design of ultra-high Q SBS modes in the bandgap is of interest for sensing. These SBSs exhibit quality factors that approach infinity and are free from the background noise of the continuum. The characteristics of SBSs and BICs are the same; however, an SBS exists within a bandgap, whereas a BIC is in a continuum of waves. The band gap of the SBS structure effectively filters out the background continuum. This is an important difference between them and produces a considerable advantage for the SBSs over BICs that the SBSs are with much wider FSR and high signal-to-noise ratio than BICs.
In the previous work [48], we employed a two-dimensional photonic crystal (PhC) cavity with one rectangular defect column to generate SP SBSs. In this study, we changed the cavity with three defect columns, the new cavity can generate both accidental (AC) and SP SBSs, and the Q factor improved almost 100 times with the same period size. The cavity had top-bottom symmetry and supported an inverse-phase field pattern (SP SBS mode) or dipole field (AC SBS mode).
The quality factors of these SBSs are theoretically as infinite as those of BICs. Moreover, there is no stray interference frequency component in the wide frequency range next to the SBS modes, which is conducive to obtaining an ultra-wide FSR; thus, they have a larger operation span. However, ideal SBSs are not visible, which again limits their application. The symmetry can be slightly broken for SP SBS and the parameters of the AC SBS can be tuned away from the SBS point to obtain quasi-SBSs (QSBSs) that are visible at the output port and have limited albeit very high-quality factors; thus, they can be used for sensor applications.
In this paper, we studied the transmission spectrum of an SP SBS and an AC SBS within bandgap. The calculations indicate that, for one thing, the bandgap can filter out the background light, allowing the QSBS to have Lorentz line types in addition to being limited to Fano resonance, thus expanding its range of applications. Additionally, the two SBSs in bandgap can be modulated individually, we can obtain a single AC QSBS or SP QSBS in the transmission spectral, and we can also obtain both in the transmission spectral by tuning the geometric parameter. A top-bottom symmetric super-cavity with an SP SBS mode and an AC SBS mode in the bandgap was designed. The two SBSs resulted in an extremely high Q-factor that was more than 1010 with a period size of 5 × 15; thus, we can obtain an ultra-high FOM that is more than 108. These research findings have a positive impact on the miniaturization of high-quality factor sensors.
2. Materials and Methods
Figure 1a shows the schematics and parameter symbols of the proposed structure. Circular cylinders of 5 × 15 were arranged in air to form a two-dimensional PhC and the central three circular columns were replaced with rectangular columns (defect columns). The height of the columns in the z direction was infinite. A TE plane wave with an electric field in the z-direction propagated from the port “in” to the port “out” along the x-direction with wave vector . The lattice constant of the square lattice PhC was and dielectric silicon columns had permittivity = 12.25. The three rectangular rutile ceramics pillars at the center, with permittivity = 100, are marked in green. Additionally, the width () and height () of the rectangular defect pillars were the same, and is the most important parameter for achieving the AC SBS. The center defect column can be moved in y-direction, the amount of movement is , which is the most significant parameter to tune SP SBS. Two ports marked as the blue solid line indicate the input and output ports of the wave for the cavity. In Figure 1b, the band map of the simplified 2D perfect PhC was obtained using the finite element method. The ideal silicon PhC exhibited a large photonic bandgap in the range of 0.2393–0.4149 in units of ( is the light speed in vacuum). The AC SBS (even mode in blue line) and SP SBS (odd mode in red line) modes in the photonic bandgap are shown in Figure 2c,d with = 0.2, = 0.515525. The band map of the cavity was calculated by treating the entire structure as a supercell in the finite element method.
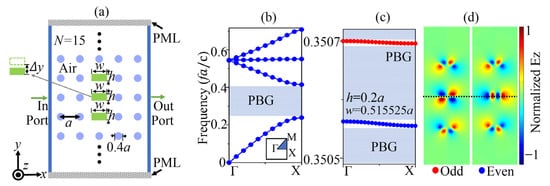
Figure 1.
(a) Schematic of the PhC cavity structure. (b) TE band map of the simplified 2D perfect PhC along the Γ-X direction. (c) TE Band maps and (d) electrical field patterns in z-direction of the SBS modes when = 0.2, = 0.515525 in the bandgap along the Γ-X direction.
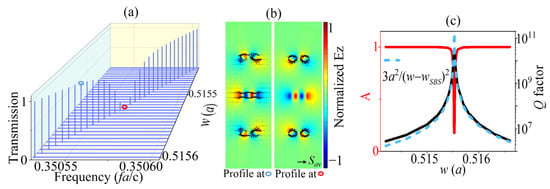
Figure 2.
The evolution of (a) transmission spectral profile and (c) Q factors (black line) and amplitude (A, red line) of the AC SBS mode with different values when = 0.2. (b) Electrical field patterns in z-direction of the defect cavity in the SBS point and QSBS point.
Figure 2 shows the transmission and Q-factor properties of the AC SBS mode. In Figure 2a, the evolution of the transmission illustrates that the amplitude of the peak nearly disappeared at ( = 0.515525) the SBS point. The other peaks of those transmissions decreased from both sides of the SBS point with closing to 0.515525. The field profiles and Poynting vector for the SBS point (the red circle in Figure 2a) and a typical (the blue circle in Figure 2a) were chosen to show the difference between them. The two field patterns had minor differences, while the Poynting vectors showed a significant variation in the center. For the profile of the blue circle point in the left side panel of Figure 2b, the Poynting vectors indicate that the energy radiated to the out space of the cavity. However, for the other panel of Figure 2b, there was no radiation energy from the center field of the BIC point, and the up and down parts had reverse relation, giving no radiating channel to the free space. In momentum space, Q is shown to decay quadratically () with respect to the distance k from a single isolated BIC [49]. Here, there is a similar phenomenon: when tends to , Q increases quadratically, or , as shown in Figure 2c, where is used to fit the Q-value curve with the fitting constant B. The Q factor here are ultra-high that more than 1010. The Q value is calculated using the following formula:
where is the frequency of the peak in transmission and FWHM (full width of half maximum) is the frequency width at half value of transmission peak.
Next, the evolution of transmission, field profiles, and Q factors of the counterpart named SP SBS mode is given in Figure 3. In the previous section, the geometric parameter was tuned to produce AC SBS, and no structural symmetry was broken until the SP SBS mode was discussed with the parameter induced. The transmissions in Figure 3a indicate that the amplitudes of the peaks decreased to 0 with the absolute value of closing to 0. As is known, the infinite Q factor is one of the most specific characteristics of the BIC. Then, the corresponding tendencies of the Q factors and amplitude are detailly shown in Figure 3b. The amplitudes decreased to a small value, while the Q factors increased dramatically with closing to 0. For the Q factor, it increased quadratically concerning (), as shown in Figure 3b, where was used to fit the Q-value curve with the fitting constant B. The Q factor here was also as high as more than 1010. To compare the QBIC and BIC points, the field patterns and Poynting vectors at the blue circle point with = −0.02 and the red circle point with = 0.001 are illustrated in Figure 3a and Figure 3b, respectively. These patterns and vectors differed from those shown in Figure 2b. The field pattern and Poynting vector in the left side panel of Figure 3c were much weaker in the upper rectangular column than the other two. The topological symmetry was broken to provide a radiation tunnel for the peak is near 1 with = −0.02. However, the topological symmetry was reserved to constrain the energy in the cavity in the right panel of Figure 3c, in which the corresponding amplitude was 0.06 with = 0.001.
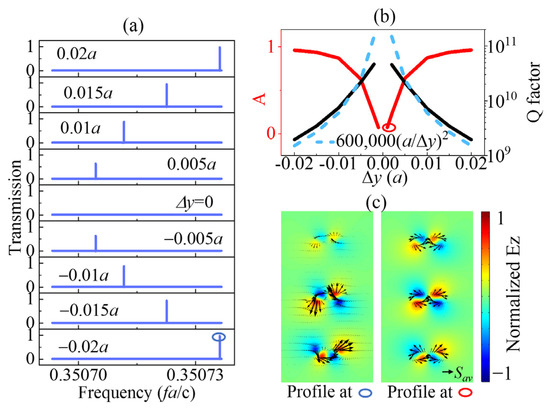
Figure 3.
Evolution of (a) transmission spectral profile and (b) Q factors (black line) and amplitude (A, red line) of the SP SBS mode with different values for = 0.2, = 0.515525. (c) Electrical field patterns in z-direction of the defect cavity in the SBS point and QSBS point.
3. Results
Sensitivity S is a very important parameter in sensor research, which reflects the change of the sensor with detection parameters. The general definition of sensitivity is S = ∆λ/∆n, where ∆λ refers to the change in wavelength under different refractive indices, ∆n is the change in refractive index. Another very important parameter in the sensors is the quality factor FOM, which is generally defined as:
where S is the sensitivity of the sensor mentioned earlier, Q is the quality factor of the resonator, refers to the resonant frequency of the resonator, and FWHM is the frequency width at half value of transmission peak.
From the tuned geometric parameters in the previous sections, the related two parameters and can control the AC BIC and SP SBS independently. By adjusting the parameters, we can obtain three kinds of transmission lines in Figure 4. The first one, as in the top panel, shows the result that there was only SP QSBS in the transmission spectra with = 0.515525, = 0.005. The second one is shown in the middle with both SP QSBS and AC QSBS in the transmission when = 0.515515, = 0.005. The last one in the bottom panel had only AC QSBS in the transmission spectrum, in which = 0.515515, = 0. The top and the bottom transmission line can be used as ultra-wide FSR high FOM sensors, while the middle panel case can function as multi-mode sensing. For the possibility of fabricating the sensor, we considered that the sensor was applied in the frequency region of THz, and the lattice of the photonic crystal was confirmed as = 1 mm. Then, the other geometric parameters of = 0.2 mm and were established.
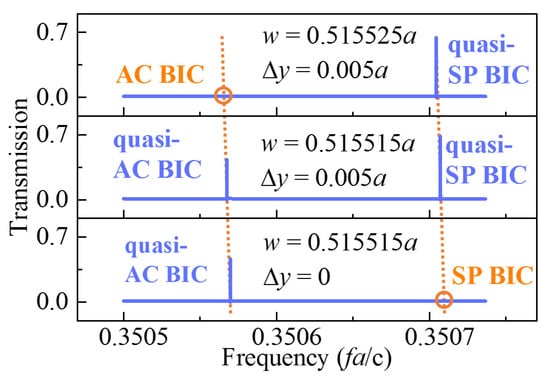
Figure 4.
Evolution of transmission spectral profile of the two SBS modes with different and values when = 0.2.
The band maps of the even AC SBS mode with different values are shown in Figure 5a,b. It is evident that this mode resided within the band gap, effectively avoiding interference from background light. The field pattern in Figure 5c is consistent with the even mode pattern in Figure 1d of AC BIC. The transmission in Figure 5d shows a very sharp Lorentz shape line in which the Q factor reached high to 2.83 × 10⁹ with = 0.2 mm, = 0.51556 mm. For the lone AC BIC mode in the band gap region, no background interference resulted in a relatively broad band suitable for various sensor applications. In Figure 5e, the peak frequencies decrease with the permittivity of the background tuned manually. Meanwhile, the evolution of Q factors and peak frequencies in Figure 5f demonstrate that the Q factors had minor fluctuation and the frequency can be varied linearly with the permittivity. The evaluation parameters FOM and S were obtained by the equation of (2) in Figure 5g. The values of FOM 107 and S 38.25 µm/RIU were very high compared to the current research results.
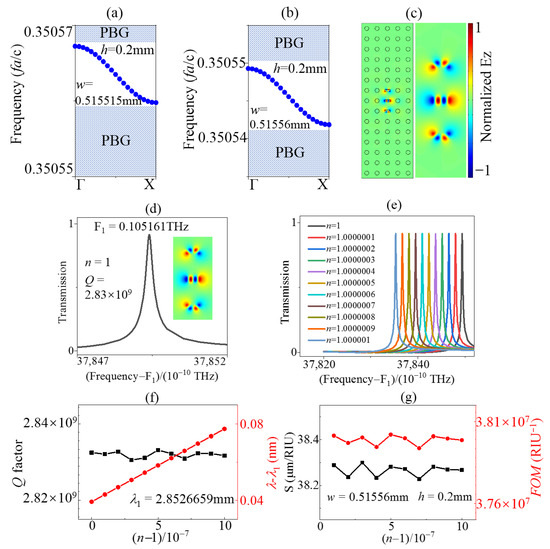
Figure 5.
TE band maps of the AC BIC mode for = 0.2 mm, (a) = 0.515515 mm and (b) = 0.51556 mm in the bandgap along the Γ-X direction. (c) Electrical field pattern in z-direction of the AC SBS mode when = 0.2 mm, = 0.515515 mm. (d) Transmission line of the AC SBS mode when = 0.2 mm, = 0.51556 mm. Evolution of (e) transmission spectral profile, (f) Q factors, peak frequencies, and (g) S, and FOM of the AC SBS mode with different values when = 0.2 mm, = 0.51556 mm.
To further investigate the impact of varying the parameter on the properties of AC SBS sensors, we conducted calculations and analyzed the sensor characteristics at = 0.515515. Comparing the amplitudes of transmission in Figure 6b to those in Figure 5d, we observed a significant reduction (0.464), albeit with an accompanying increase in the Q value by an order of magnitude. The evolution of Q factors and peak frequencies with different values in Figure 6c indicates that the Q factors exhibited minor fluctuations, and the wavelength can be linearly varied. These observations are consistent with those depicted in Figure 5f. The evaluation parameters, FOM and S in Figure 6d, demonstrate that the values of FOM 108 were one order of magnitude higher than those of = 0.51556 (Figure 5g). However, there was no significant change in sensitivity S. This indicates that, for the same structural mode, altering the parameters did not lead to a considerable change in sensitivity S. On the other hand, FOM was highly influenced by the Q value, and modifying the Q value can effectively alter FOM.
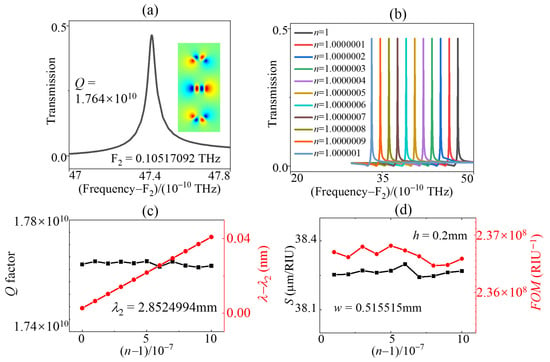
Figure 6.
(a) Transmission line of the AC SBS mode when = 0.2 mm, = 0.515515 mm. Evolution of (b) transmission spectral profile, (c) Q factors, peak frequencies, (d) S, and FOM of the AC SBS mode with different values when = 0.2 mm, = 0.515515 mm.
The other single SBS condition in Figure 4 is the SP SBS, which was protected by topological symmetry. When the geometric parameters = 0.2 mm and = 0.515525 mm were fixed, the transmitting tunnel was opened by breaking the symmetry with offset parameter = 0.005 mm. From Figure 2, we know the peak of transmission disappeared at the AC SBS point ( = 0.515525). Only a single SP QSBS peak appeared in the transmission spectra due to symmetry broken. The band gaps and the field pattern in Figure 7a,b illustrate that the operating mode was odd in the band gaps, as shown in Figure 1d. The Q factor of the SP QSBS in Figure 7b was 2.1 × 10¹⁰ and the amplitude was 0.64 and both are higher than that of AC QSBS in Figure 6a. The transmissions, the evolution of Q factor, S, and FOM varying with refractive were introduced from Figure 7c–e. The difference from the AC QBIC sensor in Figure 6 was larger values of the peaks of transmission, the operating frequency, Q factors, and FOM, and a smaller value of S = 38. This shows that by adjusting the parameters and , we can change the working mode, frequency, FOM, signal amplitude, etc., of the single-mode sensor.
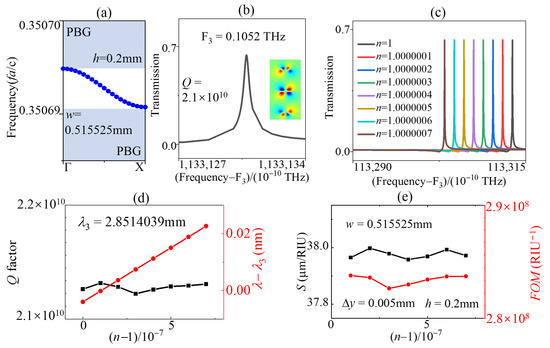
Figure 7.
(a) TE band maps of the defect cavity modes for = 0.2 mm, = 0.515525 mm in the bandgap along the Γ-X direction. (b) Transmission line and electrical field pattern in z-direction of the SP SBS mode for = 0.2 mm, = 0.515525 mm, and = 0.005 mm. Evolution of (c) transmission spectral profile, (d) Q factors, peak frequencies, (e) S, and FOM of the SP SBS mode with different values of for = 0.2 mm, = 0.515525 mm, and = 0.005 mm.
In the more common scenario, when both parameters ≠ 0 and ≠ 0.515525 mm, the transmission exhibited two peaks simultaneously at different frequencies. When = 0.2 mm, = 0.515515 mm, = 0.005 mm, both AC QSBS and SP QSBS were in the transmission spectra. The transmission spectra, the evolution of Q factors, S, and FOM varying with the refractive index of a dual-bands sensor are shown in Figure 8. The Q factors of the two modes were larger than 1010, inducing an ultra-large FOM that more than 108. The sensitivity of the AC SBS mode and the SP SBS mode was 38 and 38.3 µm/RIU in the terahertz wave band, respectively. It can be utilized for ultra-sensitive multi-parameter measurements. In addition, the dual-band sensor can also be transformed back into a single-band sensor by adjusting the parameters and .
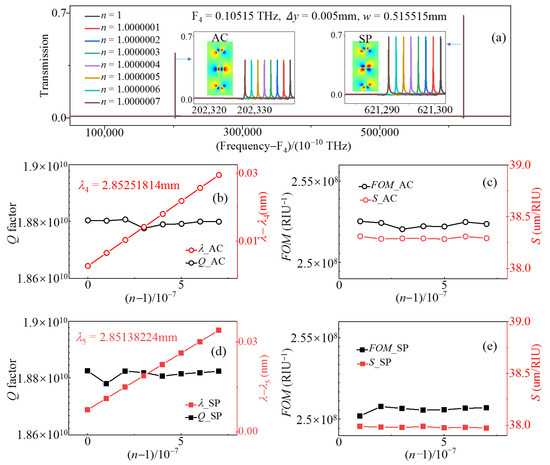
Figure 8.
(a) Evolution of transmission spectral profile with different values when = 0.2 mm, = 0.515525 mm, = 0.005 mm. Evolution of (b) Q factors, peak frequencies, (c) S, and FOM of the AC SBS mode and (d) Q factors, peak frequencies, (e) S, and FOM of the SP SBS mode with different values when = 0.2 mm, = 0.515525 mm, = 0.005 mm.
Compared to traditional 2D PhC activity sensor structures, most of them have larger sizes, typically exceeding 15 × 15 dimensions [50,51]. The Q factor generally does not exceed 107, and the sensitivity remains below 10,000 nm/RIU [50,51]. However, in this study, the 2D PhC cavity structure demonstrated remarkable performance with an ultra-compact size of 5 × 15, achieving a Q value of more than 1010 and a sensitivity of 383,000 nm/RIU. Furthermore, it exhibited a high signal-to-noise ratio and an exceptionally wide FSR. These achievements open up possibilities for compact, high-sensitivity biosensing, multi-wavelength sensing, and other promising applications.
4. Analysis of the Effect of Fabrication Error and Experimental Scheme
The accuracy of mechanical processing will inevitably affect the sensor parameter indicators. Therefore, it is important to analyze the impact of fabrication errors and determine executable solutions before conducting experiments. In general, the machining accuracy can reach 0.002 to 0.001 mm [52]. We studied the changes in sensor parameters under an error of 0.002 mm. For the SP SBS mode, the accuracy error of will affect the Q factor, as . Let , then
In Figure 3b, when = 0.005 and 0.009, Q = 2.1 × 10¹⁰ and 9 × 10⁹, respectively, where = 1 mm. Therefore, when = 0.007 mm, even with an error of = 0.002 mm, the variation of Q will be
thus, the value of Q has an evident fall, but it is still high in between 0.903 × 10¹⁰ and 3.87 × 10⁹, which means the sensor can still has high sensitivity and FOM.
The effect of the radius of the silicon column with a fabrication error of 0.002 mm on the parameters of the SP SBS mode sensor was studied. Comparing Figure 9a with Figure 1b, when increased from 0.2 mm to 0.202 mm, the band gap range of the perfect photonic crystal became 0.2379–0.41229, with a slight red shift in frequency and no significant change in band gap width. With the same and values in Figure 7a and Figure 9b, the increase in induced a slight blue shift in the frequency of the band map of the SP SBS mode. Comparing Figure 9c with Figure 1d and Figure 9d with Figure 3a, the change of had no evident effect on both the mode field distribution and the evolution of the transmission spectrum. Figure 9e shows the parameters of the SP SBS mode sensor with changed , the FOM, and the sensitivity S showed only slight changes compared to that in Figure 7. According to the above, we can see that the SP SBS mode sensor had strong robustness.

Figure 9.
(a) TE band maps of the perfect PhC with = 0.202 mm, = 1 mm. (b) TE Band map and (c) electrical field pattern in z-direction of the SP SBS mode with = 0.202 mm, = 0.2 mm, = 0.515525 mm. (d) For = 0.202 mm, = 0.2 mm, = 0.515525 mm, the evolution of transmission spectra of the SP SBS mode with different values. (e) For = 0.202 mm, = 0.2 mm, = 0.515525 mm, and = 0.01 mm, the evolution of transmission spectra of the SP SBS mode with different values.
Moreover, we investigated the effect of the radius of the silicon column with an error of 0.002 mm. As shown in Figure 10, the situation was the same with the SP SBS mode sensor except for two things. The first one was that the increase in induced a slight red shift in the frequency of the AC SBS mode in Figure 10a, not as the blue shift in Figure 9. The second one was that the value of changed from 0.515525 in Figure 2a to 0.51549 in Figure 10c, which caused a variation in Q value, resulting in the FOM dropping by an order of magnitude. Compared with the SP SBS mode, the AC SBS mode sensor was more affected by changes in , and if the value can be adjusted to be closer to , it can compensate for the loss of the Q value.

Figure 10.
(a) TE band map and (b) electrical field pattern in z-direction of the AC SBS mode with = 0.202 mm, = 0.2 mm, = 0.515515 mm. (c) For = 0.202 mm, = 0.2 mm, the evolution of transmission spectra of the AC SBS mode with different values. (d) For = 0.202 mm, = 0.2 mm, = 0.515515 mm, the evolution of transmission spectra of the AC SBS mode with different values.
Additionally, we studied the effect of the parameters and with an error of 0.002 mm on the AC SBS mode sensor. In Figure 2c, when = 0.51551 and 0.5154, Q = 1.3 × 10¹⁰ and 1.9 × 10⁸, respectively, where = 1 mm. The error in value of 0.00011 mm resulted in a change of two orders of magnitude in Q value, let alone an error of 0.002 mm. The fitted B of the AC SBS mode is 3 in Figure 2c, which is much smaller than that of the SP SBS mode in Figure 3b. So, the AC SBS mode was very sensitive to geometric parameter . In Figure 11, the value of increased to 0.202 mm, and the value of increased to 0.520803. The value of is close to in Figure 11d, the FOM and S are as high as that in Figure 6. However, the value in Figure 11e is the same as that in Figure 6, with a 0.002 mm error in , resulting in the FOM value as low as 5019, reducing it by five orders in magnitude. Therefore, the ability to adjust the value is very important for the practical application of the AC SBS mode sensor.

Figure 11.
(a) TE band map and (b) electrical field pattern in z-direction of the AC SBS mode with = 0.202 mm, = 0.202 mm, and = 0.52082 mm. (c) For = 0.202 mm, = 0.202 mm, the evolution of transmission spectra of the AC SBS mode with different values. For = 0.202 mm, = 0.202 mm, (d) = 0.52082 mm and (e) = 0.515515 mm, the evolution of transmission spectra of the AC SBS mode with different values.
To construct adjustable structure, we proposed using long trapezoidal columns instead of rectangular columns in a three-dimensional model with extremely short column lengths in the z-axis direction to achieve adjustment of the value. We first discussed the construction of 3D models. In this study, the input electromagnetic wave was a TE-polarized wave, with the electric field vector oriented perpendicular to the direction of propagation (in the y-direction). It can be directly input at the wave port. To approach the 2D structure more precisely, very long dielectric columns are usually required, which can be challenging to achieve. Instead, a proposed scheme involves the introduction of two metal plates, creating mirrors for the dielectric columns and electromagnetic waves, thereby achieving an equivalent 2D PhC. To mitigate the loss caused by the metal, silver can be used as the material due to its favorable properties. To prevent oxidation of the silver, an organic film can be deposited on the silver plates. This approach significantly reduces the required length of the dielectric columns in z-direction. The three-dimensional model, depicted in Figure 12a, illustrates this concept with a length () of 1 mm. The photonic crystal structure and other parameters in the figure remain the same as that in Figure 1a. A TE electromagnetic wave was excited or input from the input port (left port), guided by the metal plates and the PhC, form resonance in the PhC cavity, and finally went to the output port (right port). Within the resonant cavity, the distribution of the electromagnetic field can be approximated as a TE wave. The band map in Figure 12b displays the odd SP SBS mode (red line) and the even AC SBS mode (blue line) in the 3D cavity. It is similar to the band map of the 2D structure in Figure 1c, except for a minor blue shift in frequency. The frequency shift was understandable because the metal material introduced leads to a change of the effective refractive index of the structure. The electric field patterns in the x-y plane of the two SBS modes in the 3D cavity, shown in Figure 12c,d, are the same as those in the 2D cavity in Figure 1d. The electric field patterns in the x-z plane of the two SBS modes in the 3D cavity, also depicted in Figure 12c,d, illustrate the distribution of the electric field in the z-direction. The transmission spectra of the two SBS modes in the 3D cavity are presented in Figure 12f,h. This demonstrates that it is feasible to reduce the length of the dielectric column by utilizing the metal-plate-assisted construction.
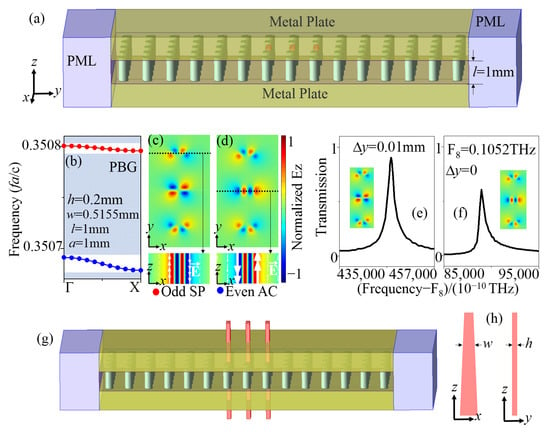
Figure 12.
(a) Schematic of the 3D PhC cavity structure. (b) TE band maps of the SBS modes in 3D PhC cavity along the Γ-X direction with = 0.2 mm, = 0.5155 mm, = 1 mm, and = 0. Electrical field patterns in z-direction of the (c) odd SP SBS mode and (d) even AC SBS mode with = 0.2 mm, = 0.5155 mm, = 1 mm, and = 0. For = 0.2 mm, = 0.5155 mm, and = 1 mm, the transmission spectra of (e) SP QSBS with = 0.01 mm, and (f) AC QSBS with = 0. (g) Schematic of the 3D PhC cavity structure with 3 trapezoidal columns. (h) Schematic of the trapezoidal column.
Finally, in order to adjust the value, the rectangular column was designed as a trapezoidal column whose x-z plane was trapezoidal, as shown in Figure 12h. The upper short side of the trapezoid had a length of 0.505 mm, and the lower long side had a length of 0.525 mm, which means the adjustment range of the value was 0.505–0.525 mm, while remained fixed. The length of the trapezoidal column in the z-direction was 100 mm, and the part of the trapezoidal column in the resonant cavity could be approximated as a rectangular column. By adjusting the trapezoidal column up and down, the value can be adjusted to solve the problem caused by insufficient machining accuracy. With this scheme, machining accuracy to 1% is feasible.
5. Conclusions
In conclusion, this study introduced a top-bottom symmetric cavity consisting of three rectangular columns with high permittivity. It exhibited both an SP SBS mode and an AC SBS mode located within the band gap, with a period size of 5 × 15. By adjusting the parameters and , the AC SBS and SP SBS can be converted into QSBS, respectively. This means that the two SBS modes within the band gap can be individually modulated, resulting in a single AC QSBS or SP QSBS in the transmission spectrum. By tuning and , it was also possible to obtain both QSBS modes simultaneously in the transmission spectrum. Hence, this cavity can function as a single-band sensor or a dual-band sensor by manipulating the aforementioned parameters. For the single-band sensor configuration, the frequency and figure of merit (FOM) can also be adjusted. The achieved Q factors of the QSBS modes can exceed 1010. The obtained bulk sensitivity was 38 µm/RIU with a high signal-to-noise ratio in the terahertz wave band, and a record-breaking figure of merit of 2.8 × 10⁸ RIU−1 was achieved. The effect of fabrication error on the performance of the proposed structure was also discussed, showing feasibility for applications. For experimental realization, a 3D schematic was presented. These accomplishments open up avenues for compact, high-sensitivity biosensing, multi-wavelength sensing, and other promising applications.
Author Contributions
Conceptualization, Z.O. and Y.A.; methodology, Y.A.; software, Y.A.; resources, Z.O., C.G. and J.P.; writing—original draft preparation, Y.A. and T.F.; writing—review and editing, Z.O., C.G. and J.P. All authors have read and agreed to the published version of the manuscript.
Funding
This research was funded by the National Natural Science Foundation of China, grant numbers: 61275043, 61307048, 60877034, and 61605128. Moreover, it was partially funded by the Natural Science Foundation of Guangdong Province, grant number: 2020A1515011154, and the Natural Science Foundation of Shenzhen City, grant numbers: JCYJ20190808151017218, JCYJ20190808161801637, and JCYJ20180305124247521.
Institutional Review Board Statement
Not applicable.
Informed Consent Statement
Not applicable.
Data Availability Statement
The research data will be supplied with reasonable request.
Conflicts of Interest
The authors declare no conflict of interest.
References
- Hsu, C.W.; Zhen, B.; Stone, A.D.; Joannopoulos, J.D.; Soljacic, M. Bound states in the continuum. Nat. Rev. Mater. 2016, 1, 16048. [Google Scholar] [CrossRef]
- Azzam, S.I.; Kildishev, A.V. Photonic Bound States in the Continuum: From Basics to Applications. Adv. Opt. Mater. 2021, 9, 2001469. [Google Scholar] [CrossRef]
- Sadreev, A.F. Interference traps waves in an open system: Bound states in the continuum. Rep. Prog. Phys. 2021, 84, 055901. [Google Scholar] [CrossRef] [PubMed]
- Plotnik, Y.; Peleg, O.; Dreisow, F.; Heinrich, M.; Nolte, S.; Szameit, A.; Segev, M. Experimental Observation of Optical Bound States in the Continuum. Phys. Rev. Lett. 2011, 107, 183901. [Google Scholar] [CrossRef]
- Hwang, M.S.; Lee, H.C.; Kim, K.H.; Jeong, K.Y.; Kwon, S.H.; Koshelev, K.; Kivshar, Y.; Park, H.G. Ultralow-threshold laser using super-bound states in the continuum. Nat. Commun. 2021, 12, 4135. [Google Scholar] [CrossRef]
- Bulgakov, E.N.; Sadreev, A.F. Robust bound state in the continuum in a nonlinear microcavity embedded in a photonic crystal waveguide. Opt. Lett. 2014, 39, 5212–5215. [Google Scholar] [CrossRef]
- Liu, Y.H.; Zhou, W.D.; Sun, Y.Z. Optical Refractive Index Sensing Based on High-Q Bound States in the Continuum in Free-Space Coupled Photonic Crystal Slabs. Sensors 2017, 17, 1861. [Google Scholar] [CrossRef]
- Taghizadeh, A.; Chung, I.S. Quasi bound states in the continuum with few unit cells of photonic crystal slab. Appl. Phys. Lett. 2017, 111, 031114. [Google Scholar] [CrossRef]
- Cerjan, A.; Jurgensen, M.; Benalcazar, W.A.; Mukherjee, S.; Rechtsman, M.C. Observation of a Higher-Order Topological Bound State in the Continuum. Phys. Rev. Lett. 2020, 125, 213901. [Google Scholar] [CrossRef]
- Wang, Y.; Xie, B.Y.; Lu, Y.H.; Chang, Y.J.; Wang, H.F.; Gao, J.; Jiao, Z.Q.; Feng, Z.; Xu, X.Y.; Mei, F.; et al. Quantum superposition demonstrated higher-order topological bound states in the continuum. Light-Sci. Appl. 2021, 10, 173. [Google Scholar] [CrossRef]
- Koshelev, K.; Lepeshov, S.; Liu, M.K.; Bogdanov, A.; Kivshar, Y. Asymmetric Metasurfaces with High-Q Resonances Governed by Bound States in the Continuum. Phys. Rev. Lett. 2018, 121, 193903. [Google Scholar] [CrossRef] [PubMed]
- Koshelev, K.; Bogdanov, A.; Kivshar, Y. Meta-optics and bound states in the continuum. Sci. Bull. 2019, 64, 836–842. [Google Scholar] [CrossRef]
- Kupriianov, A.S.; Xu, Y.; Sayanskiy, A.; Dmitriev, V.; Kivshar, Y.S.; Tuz, V.R. Metasurface Engineering through Bound States in the Continuum. Phys. Rev. Appl. 2019, 12, 014024. [Google Scholar] [CrossRef]
- Liao, Z.X.; Ma, Q.C.; Wang, L.X.; Yang, Z.; Li, M.Q.; Deng, F.; Hong, W.Y. Guiding-mode-assisted double-BICs in an all-dielectric metasurface. Opt. Express 2022, 30, 24676–24688. [Google Scholar] [CrossRef] [PubMed]
- Melik-Gaykazyan, E.; Koshelev, K.; Choi, J.H.; Kruk, S.S.; Bogdanov, A.; Park, H.G.; Kivshar, Y. From Fano to Quasi-BIC Resonances in Individual Dielectric Nanoantennas. Nano Lett. 2021, 21, 1765–1771. [Google Scholar] [CrossRef] [PubMed]
- Odit, M.; Koshelev, K.; Gladyshev, S.; Ladutenko, K.; Kivshar, Y.; Bogdanov, A. Observation of Supercavity Modes in Subwavelength Dielectric Resonators. Adv. Mater. 2021, 33, e2003804. [Google Scholar] [CrossRef]
- Mouadili, A.; El Boudouti, E.H.; Akjouj, A.; Al-Wahsh, H.; Djafari-Rouhani, B.; Dobrzynski, L. Effect of Damping on Magnetic Induced Resonances in Cross Waveguide Structures. J. Supercond. Nov. Magn. 2021, 34, 597–608. [Google Scholar] [CrossRef]
- Wang, Z.; Xue, Q.; Zhao, S.L.; Zhang, X.R.; Liu, H.M.; Sun, X.H. Study on the characteristics of a photonic crystal sensor with rectangular lattice based on bound states in the continuum. J. Phys. D Appl. Phys. 2022, 55, 175106. [Google Scholar] [CrossRef]
- Chao, M.H.; Liu, Q.S.; Zhang, W.J.; Zhuang, L.Y.; Song, G.F. Mutual coupling of corner-localized quasi-BICs in high-order topological PhCs and sensing applications. Opt. Express 2022, 30, 29258–29270. [Google Scholar] [CrossRef]
- Romano, S.; Zito, G.; Torino, S.; Calafiore, G.; Penzo, E.; Coppola, G.; Cabrini, S.; Rendina, I.; Mocella, V. Label-free sensing of ultralow-weight molecules with all-dielectric metasurfaces supporting bound states in the continuum. Photonics Res. 2018, 6, 726–733. [Google Scholar] [CrossRef]
- Wang, Y.L.; Han, Z.H.; Du, Y.; Qin, J.Y. Ultrasensitive terahertz sensing with high-Q toroidal dipole resonance governed by bound states in the continuum in all-dielectric metasurface. Nanophotonics 2021, 10, 1295–1307. [Google Scholar] [CrossRef]
- Cen, W.Y.; Lang, T.T.; Hong, Z.; Liu, J.J.; Xiao, M.Y.; Zhang, J.H.; Yu, Z.Y. Ultrasensitive Flexible Terahertz Plasmonic Metasurface Sensor Based on Bound States in the Continuum. IEEE Sens. J. 2022, 22, 12838–12845. [Google Scholar] [CrossRef]
- Liu, Z.R.; Zhou, Y.; Guo, Z.H.; Zhao, X.Y.; Luo, M.; Li, Y.X.; Wu, X. Ultrahigh Q-Guided Resonance Sensor Empowered by Near Merging Bound States in the Continuum. Photonics 2022, 9, 852. [Google Scholar] [CrossRef]
- Wang, X.Y.; Xin, J.H.; Ren, Q.; Cai, H.C.; Han, J.Q.; Tian, C.Y.; Zhang, P.C.; Jiang, L.J.; Lan, Z.H.; You, J.W.; et al. Plasmon hybridization induced by quasi bound state in the continuum of graphene metasurfaces oriented for high-accuracy polarization-insensitive two-dimensional sensors. Chin. Opt. Lett. 2022, 20, 042201. [Google Scholar] [CrossRef]
- Watanabe, K.; Iwanaga, M. Nanogap enhancement of the refractometric sensitivity at quasi-bound states in the continuum in all-dielectric metasurfaces. Nanophotonics 2023, 12, 99–109. [Google Scholar] [CrossRef]
- Chen, Y.X.; Li, Y.K.; Hu, Z.D.; Wang, Z.X.; Li, Z.X.; Wang, J.C. High-Performance Quality Factor Based Sensor With Diagonal Cylinder Metasurface of the Bound State in the Continuum. Photonic Sens. 2023, 13, 230232. [Google Scholar] [CrossRef]
- Huo, Y.Y.; Zhang, X.; Yan, M.; Sun, K.; Jiang, S.Z.; Ning, T.Y.; Zhao, L.N. Highly-sensitive sensor based on toroidal dipole governed by bound state in the continuum in dielectric non-coaxial core-shell cylinder. Opt. Express 2022, 30, 19030–19041. [Google Scholar] [CrossRef]
- Chen, H.C.; Pan, T.Q.; Zhang, Z.Y. Electromagnetic multipolar quasi-bound states in the continuum for optical sensing. Opt. Commun. 2022, 525, 128862. [Google Scholar] [CrossRef]
- Liu, H.; Wang, K.; Gao, J.X.; Liu, M.; Zhang, H.Y.; Zhang, Y.P. Dirac semimetal and an all dielectric based tunable ultrasensitive terahertz sensor with multiple bound states in the continuum. Opt. Express 2022, 30, 46471–46486. [Google Scholar] [CrossRef]
- Samadi, M.; Abshari, F.; Algorri, J.F.; Roldan-Varona, P.; Rodriguez-Cobo, L.; Lopez-Higuera, J.M.; Sanchez-Pena, J.M.; Zografopoulos, D.C.; Dell’Olio, F. All-Dielectric Metasurface Based on Complementary Split-Ring Resonators for Refractive Index Sensing. Photonics 2022, 9, 130. [Google Scholar] [CrossRef]
- Ma, S.L.; Wen, S.S.; Mi, X.W.; Zhao, H.P. Terahertz optical modulator and highly sensitive terahertz sensor governed by bound states in the continuum in graphene-dielectric hybrid metamaterial. Opt. Commun. 2023, 536, 129398. [Google Scholar] [CrossRef]
- Wang, J.; Kuhne, J.; Karamanos, T.; Rockstuhl, C.; Maier, S.A.; Tittl, A. All-Dielectric Crescent Metasurface Sensor Driven by Bound States in the Continuum. Adv. Funct. Mater. 2021, 31, 2104652. [Google Scholar] [CrossRef]
- Zhao, J.; Wang, J.X.; Gao, L.Z.; Qiu, W.B. High-Sensitivity Sensing in All-Dielectric Metasurface Driven by Quasi-Bound States in the Continuum. Nanomaterials 2023, 13, 505. [Google Scholar] [CrossRef]
- Zhou, Y.; Luo, M.; Zhao, X.Y.; Li, Y.X.; Wang, Q.; Liu, Z.R.; Guo, J.H.; Guo, Z.H.; Liu, J.J.; Wu, X. Asymmetric tetramer metasurface sensor governed by quasi-bound states in the continuum. Nanophotonics 2023, 12, 1295–1307. [Google Scholar] [CrossRef]
- Wang, K.; Liu, H.; Li, Z.K.; Liu, M.; Zhang, Y.P.; Zhang, H.Y. All-dielectric metasurface-based multimode sensing with symmetry-protected and accidental bound states in the continuum. Results Phys. 2023, 46, 106276. [Google Scholar] [CrossRef]
- Maksimov, D.N.; Gerasimov, V.S.; Romano, S.; Polyutov, S.P. Refractive index sensing with optical bound states in the continuum. Opt. Express 2020, 28, 38907–38916. [Google Scholar] [CrossRef]
- Zhang, H.R.; Wang, T.; Tian, J.Y.; Sun, J.C.; Li, S.X.; De Leon, I.; Zaccaria, R.P.; Peng, L.; Gao, F.; Lin, X.; et al. Quasi-BIC laser enabled by high-contrast grating resonator for gas detection. Nanophotonics 2022, 11, 297–304. [Google Scholar] [CrossRef]
- Shi, C.Y.; Hu, J.H.; Liu, X.H.; Liang, J.F.; Zhao, J.J.; Han, H.Y.; Zhu, Q.F. Double-layer symmetric gratings with bound states in the continuum for dual-band high-Q optical sensing. Beilstein J. Nanotechnol. 2022, 13, 1408–1417. [Google Scholar] [CrossRef]
- Wang, Q.; Jiang, J.X.; Wang, L.; Yin, X.Y.; Yan, X.; Zhu, A.S.; Qiu, F.M.; Zhang, K.K. An asymmetric grating refractive index sensor generating quasi-bound states in the continuum with high figure of merit and temperature self-compensation. J. Phys. D Appl. Phys. 2022, 55, 155103. [Google Scholar] [CrossRef]
- Feng, G.; Chen, Z.H.; Wang, Y.; Liu, X.; Liu, Y.S.; Liu, X.; Sun, F.; Yang, Y.B.; Chen, S.Q. Enhanced Fano resonance for high-sensitivity sensing based on bound states in the continuum. Chin. Opt. Lett. 2023, 21, 031202. [Google Scholar] [CrossRef]
- Ndao, A.; Hsu, L.Y.; Cai, W.; Ha, J.H.; Park, J.; Contractor, R.; Lo, Y.W.; Kant, B. Differentiating and quantifying exosome secretion from a single cell using quasi-bound states in the continuum. Nanophotonics 2020, 9, 1081–1086. [Google Scholar] [CrossRef]
- Quotane, I.; Amrani, M.; Ghouila-Houri, C.; El Boudouti, E.; Krutyansky, L.; Piwakowski, B.; Pernod, P.; Talbi, A.; Djafari-Rouhani, B. A Biosensor Based on Bound States in the Continuum and Fano Resonances in a Solid-Liquid-Solid Triple Layer. Crystals 2022, 12, 707. [Google Scholar] [CrossRef]
- Wang, L.L.; Cao, J.; Li, X.W.; Zhao, Y.L.; Shi, H.; Fu, L.P.; Liu, D.J.; Liu, F. Quasi-BICs Enabled Proximity Sensing Based on Metal Complementary H-Shaped Arrays at Terahertz Frequencies. IEEE Photonics J. 2022, 14, 1–8. [Google Scholar] [CrossRef]
- Kodigala, A.; Lepetit, T.; Gu, Q.; Bahari, B.; Fainman, Y.; Kante, B. Lasing action from photonic bound states in continuum. Nature 2017, 541, 196–199. [Google Scholar] [CrossRef] [PubMed]
- Yin, X.F.; Jin, J.C.; Soljacic, M.; Peng, C.; Zhen, B. Observation of topologically enabled unidirectional guided resonances. Nature 2020, 580, 467–471. [Google Scholar] [CrossRef] [PubMed]
- Zhao, C.; Chen, W.J.; Wei, J.X.; Deng, W.J.; Yan, Y.Z.; Zhang, Y.Z.; Qiu, C.W. Electrically Tunable and Robust Bound States in the Continuum Enabled by 2D Transition Metal Dichalcogenide. Adv. Opt. Mater. 2022, 10, 2201634. [Google Scholar] [CrossRef]
- Zhang, Z.Y.; Lan, Z.H.; Xie, Y.Z.; Chen, M.L.N.; Sha, W.E.I.; Xu, Y. Bound Topological Edge State in the Continuum for All-Dielectric Photonic Crystals. Phys. Rev. Appl. 2021, 16, 064036. [Google Scholar] [CrossRef]
- An, Y.; Fu, T.; Guo, C.; Pei, J.; Ouyang, Z. Superbound state in photonic bandgap and its application to generate complete tunable SBS-EIT, SBS-EIR and SBS-Fano. Opt. Express 2023, 31, 20572–20585. [Google Scholar] [CrossRef]
- Jin, J.C.; Yin, X.F.; Ni, L.F.; Soljacic, M.; Zhen, B.; Peng, C. Topologically enabled ultrahigh-Q guided resonances robust to out-of-plane scattering. Nature 2019, 574, 501–504. [Google Scholar] [CrossRef]
- Mohammed, N.A.; Khedr, O.E.; El-Rabaie, E.M.; Khalaf, A.A.M. Literature Review: On-Chip Photonic Crystals and Photonic Crystal Fiber for Biosensing and Some Novel Trends. IEEE Access 2022, 10, 47419–47436. [Google Scholar] [CrossRef]
- Goyal, A.K.; Dutta, H.S.; Pal, S. Recent advances and progress in photonic crystal-based gas sensors. J. Phys. D Appl. Phys. 2017, 50, 203001. [Google Scholar] [CrossRef]
- Wuxi Laixing CNC Machine Tool Co., Ltd. Available online: http://www.lxjichuang.com/product-show.asp?id=331 (accessed on 25 July 2023).
Disclaimer/Publisher’s Note: The statements, opinions and data contained in all publications are solely those of the individual author(s) and contributor(s) and not of MDPI and/or the editor(s). MDPI and/or the editor(s) disclaim responsibility for any injury to people or property resulting from any ideas, methods, instructions or products referred to in the content. |
© 2023 by the authors. Licensee MDPI, Basel, Switzerland. This article is an open access article distributed under the terms and conditions of the Creative Commons Attribution (CC BY) license (https://creativecommons.org/licenses/by/4.0/).