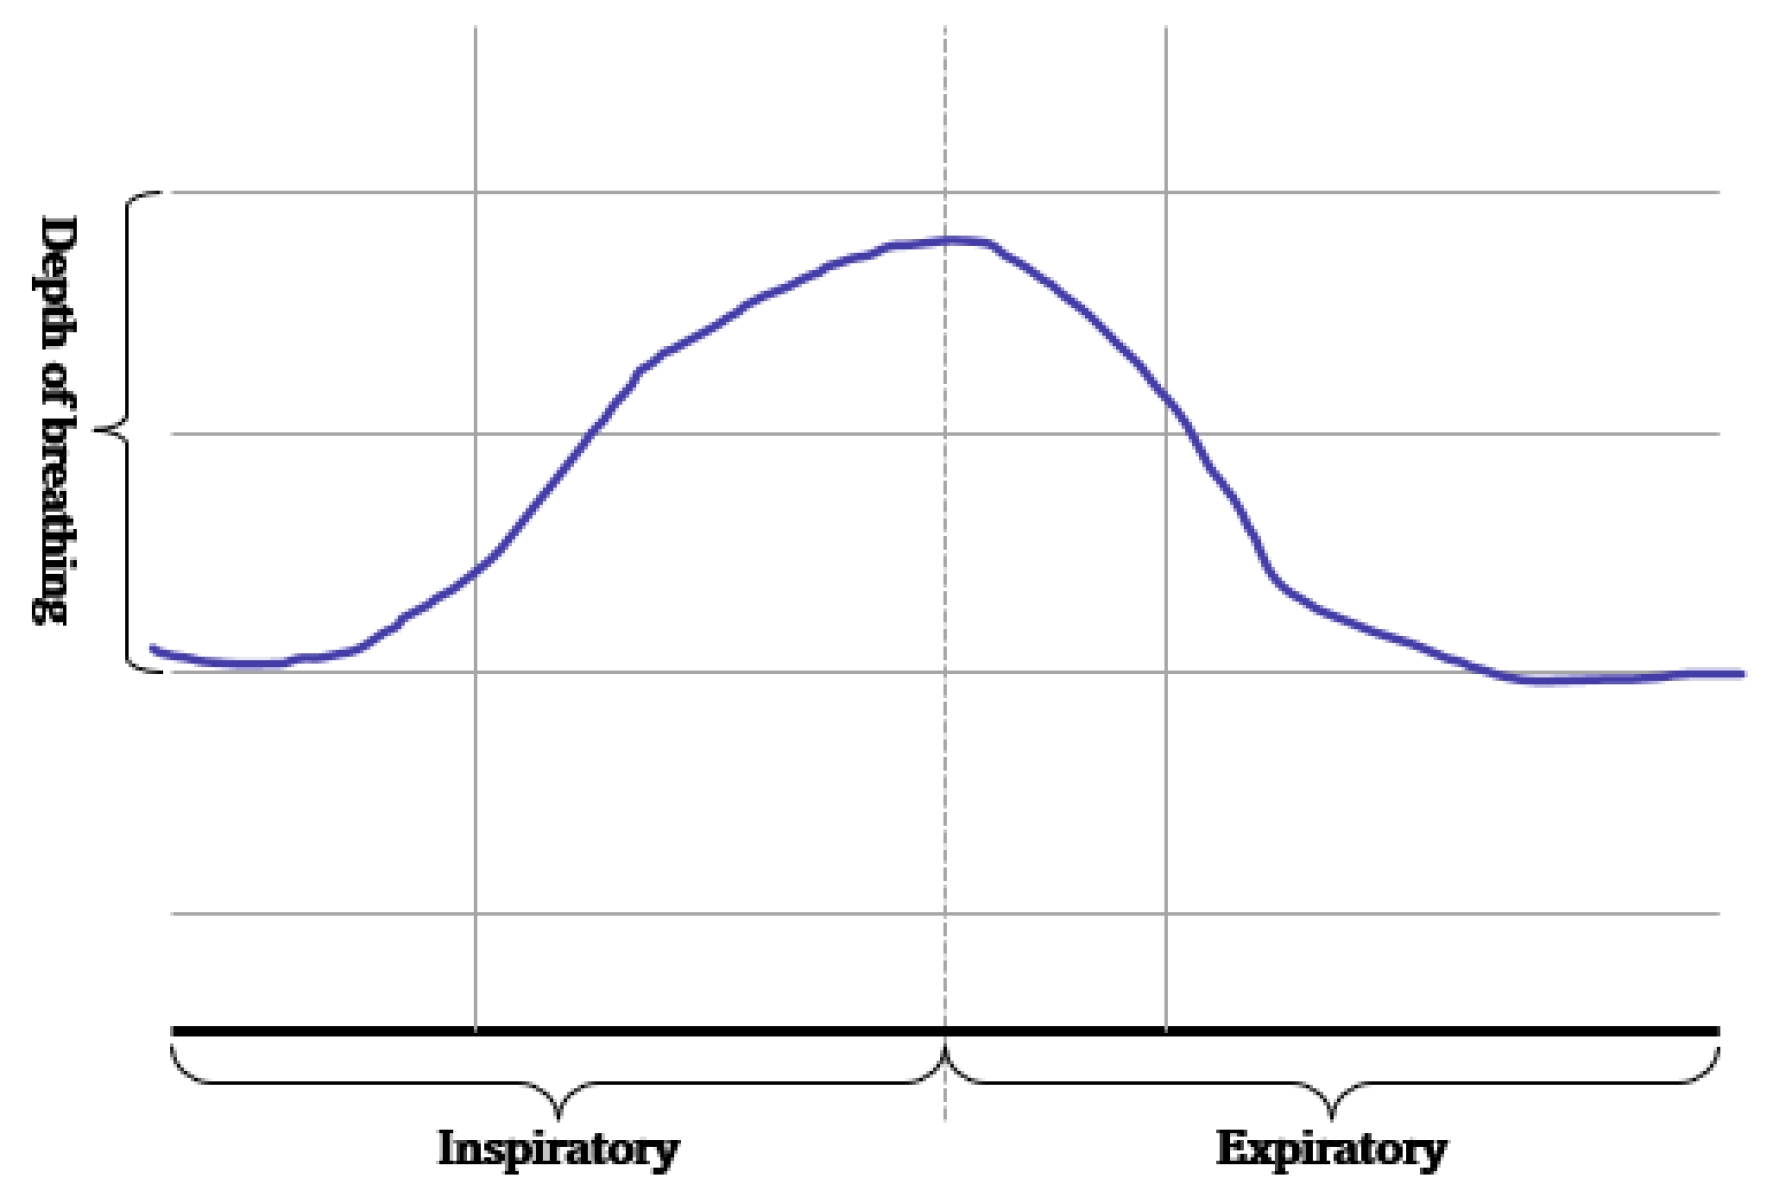
Article

Detection of Multiple Respiration Patterns Based on 1D SNN from Continuous Human Breathing Signals and the Range Classification Method for Each Respiration Pattern

1
Department of Computer Engineering, Gachon University, Seongnam 13120, Republic of Korea
2
Neowine Co., Ltd., Seongnam 13595, Republic of Korea
*
Author to whom correspondence should be addressed.
Sensors 2023, 23(11), 5275; https://doi.org/10.3390/s23115275
Submission received: 30 April 2023 / Revised: 27 May 2023 / Accepted: 30 May 2023 / Published: 1 June 2023
(This article belongs to the Section Biosensors)

Abstract

:
Human respiratory information is being used as an important source of biometric information that can enable the analysis of health status in the healthcare domain. The analysis of the frequency or duration of a specific respiration pattern and the classification of respiration patterns in the corresponding section for a certain period of time are important for the utilization of respiratory information in various ways. Existing methods require window slide processing to classify sections for each respiration pattern from the breathing data for a certain time period. In this case, when multiple respiration patterns exist within one window, the recognition rate can be lowered. To solve this problem, a 1D Siamese neural network (SNN)-based human respiration pattern detection model and a merge-and-split algorithm for the classification of multiple respiration patterns in each region for all respiration sections are proposed in this study. When calculating the accuracy based on intersection over union (IOU) for the respiration range classification result for each pattern, the accuracy was found to be improved by approximately 19.3% compared with the existing deep neural network (DNN) and 12.4% compared with a 1D convolutional neural network (CNN). The accuracy of detection based on the simple respiration pattern was approximately 14.5% higher than that of the DNN and 5.3% higher than that of the 1D CNN.

1. Introduction

Respiratory information of humans is being utilized not only for disease diagnosis, but also in various fields related to health, such as healthcare. Several studies are being conducted, including management of bronchiectasis, diagnosis of sleep apnea, analysis of respiration movements, and research on COVID-19’s respiratory symptoms. These studies aim to improve diagnosis, treatment, and management methods in the medical field through the collection, analysis, and interpretation of breathing data [1,2,3,4]. To obtain meaningful respiratory information, recognition and analysis of the respiration patterns from the breathing signal data collected through the measuring device are necessary [5]. Traditionally, a belt-type measuring device with a sensor attached is used to collect breathing signals. However, in this study, breathing data were collected using a non-contact mmWave sensor. Non-contact respiration measurement has the advantage of providing accurate breathing data while increasing patient convenience and safety, and it is used in various medical and research fields [6,7,8,9,10].
The mmWave-sensor-based non-contact method may have lower accuracy than traditional contact-type sensors when noise is inserted due to the existence of an obstacle between the sensor and the body, a change in posture, or the influence of the surrounding environment. On the other hand, the contact sensor-based method attaches the sensor to the body, so it can cause insomnia or sleep disorders, which can cause errors in the acquisition of breathing data. Therefore, to address this problem, studies on artificial-intelligence-based pattern recognition techniques—such as deep neural networks (DNNs) and 1D convolutional neural networks (CNNs)—have been conducted to classify respiration patterns using deep learning methods for breathing data acquired from non-contact sensors [11,12,13].
Previous pattern recognition studies for sleep apnea and other respiration patterns have used data with a fixed input size [14,15]. Recently, various types of information on respiration have been used in the field of healthcare and health examination. Therefore, not only the detection of simple respiration patterns, but also recognition and classification techniques for various respiration patterns—such as the continuous range of the homogeneous respiration pattern, or the ratio of specific respiration patterns in the entire respiration—are required.
In particular, a sliding window method should be used to detect respiration patterns learned from the breathing data measured for a long time period via conventional methods. Interference between different respiration patterns, increased analysis complexity, and signal ambiguity can decrease the accuracy of recognition in respiration translation systems, particularly when multiple patterns are present in one window [16,17]. In other words, one specific respiration pattern must be found within the range of the search unit (one window), but if several respiration patterns exist within the range, it may be misrecognized as another respiration pattern and reduce the overall recognition rate. Furthermore, human respiration patterns are categorized based on the features of respiration cycles and are displayed in various forms, making it difficult to define them with simple threshold values. Even if it is the same respiration pattern, each person may have slightly different respiration patterns.
To solve this problem, this paper proposes a 1D Siamese neural network (SNN) model that can detect specific respiration patterns by comparing the similarity between the input respiration pattern and the basic respiration pattern, along with a novel algorithm that merges consecutive isomorphic pattern ranges and divides other consecutive pattern ranges when there are multiple respiration patterns in the detection target area.
The SNN model is one of the few-shot learning methods that can learn from only a small amount of data and exhibits the advantage of being able to measure the similarity of classes that are not participants in learning [18,19]. To apply this to respiration pattern recognition, the existing SNN structure is used, and all layers for 2D data processing are composed of 1D data processing layers. In the proposed method, the input size of the 1D SNN model is divided into four types (600, 300, 200, and 100) to improve the recognition rate when multiple breathing patterns exist within the search range. This serves to merge or separate the front and rear ranges by applying MASRP while reducing the search range when multiple breathing patterns exist within the search range.
The proposed method improved the classification accuracy of respiration patterns that did not participate in learning. Furthermore, even when changes in respiration patterns within a continuous breathing period were observed, accurate detection of the range was feasible through the application of the proposed merge-and-split for respiration pattern (MASRP) algorithm. The proposed method exhibits substantial accuracy improvement in range classification and respiration pattern detection, as per the experimental observations.

2. Related Research

2.1. Breathing Signal

As shown in Figure 1, the breathing signal rises during inhalation and descends during exhalation. The amplitude of the breathing signal is determined by the depth of the breath. Furthermore, the period of the signal increases with the duration of the breath [20].
These breathing signals appear in various forms depending on the type of breath, and in the medical field they are divided into eupnea, bradypnea, tachypnea, and apnea, based on the number of breaths per minute [21]. The results measured by the mmWave sensor for four respiration patterns and one movement state are shown in Figure 2.

2.2. Pattern Recognition Methods of Signal Data Based on Deep Learning

2.2.1. Deep Neural Network (DNN)

A deep neural network (DNN) refers to a neural network composed of two or more hidden layers based on the concept of a multilayer perceptron (MLP). Each layer of the DNN is composed of a defined number of neurons (or nodes), and all neurons are fully connected to one another [22,23,24,25]. DNN learning is a process of updating the weights between connected neurons and is performed by minimizing the value of the loss function through gradient descent [26]. In the case of an image, the input size is in the form of h × w; however, the input size for the 1D signal is configured in the form of 1 × w.

2.2.2. One-Dimensional (1D) Convolutional Neural Network (CNN)

In general, a convolutional neural network (CNN) is a neural network that has been studied for object detection or recognition based on image data. The convolutional layer uses an N × M 2D kernel to extract image features. The features extracted through the convolution of several layers are finally connected to the fully connected layer to perform classification [27].
Since the breathing signal is composed of a one-dimensional signal rather than an image, the two-dimensional image data are transformed to learn them, based on a CNN-based neural network. However, in this case, meaningless features may be generated due to the forced data transformation. This may lead to deterioration in the performance of the neural network. Therefore, constructing a convolutional neural network suitable for 1D data characteristics is necessary [28,29,30,31,32].
In the 1D CNN for learning 1D data, the convolution layer receives a vector type as an input and performs convolution using a 1 × m kernel. Because of this, the feature map is also extracted in the form of one-dimensional data. Therefore, it can be used for learning the breathing signal data. The process of extraction of a feature map by the convolutional layer of a 1D CNN for the classification of the input signal data is similar to the process employed by the convolutional layer of a 2D CNN. Next, the features that undergo the max-pooling process are composed of a fully connected layer for classification, and the shape is the same as that of a 2D CNN [33,34,35]. Appropriately setting hyperparameters such as the depth of the neural network and the size and number of kernels according to the characteristics of the input data is important. Therefore, the process of optimizing hyperparameters using an optimization algorithm is crucial.

2.2.3. Siamese Neural Network (SNN)

A Siamese neural network (SNN) is a neural network composed of two identical CNN-based networks with exactly the same parameters and weights. This model is used in environments where it is difficult to obtain sufficient data for a particular class, or when objects that the model has not learned must be classified [18,36,37,38]. The SNN-based method can predict the class to which a small or once-seen object belongs by using a model trained on other data. To solve these environmental problems, one-shot learning or few-shot learning has been employed [39,40,41,42]. As shown in Figure 3, this model calculates and compares vectors by applying the same weight to two input images. When training is performed, if the two input images are the same, the similarity is assigned as 1; if they are different, it is assigned as 0.

2.2.4. Distance Function

When classifying or recognizing objects, many deep learning models need to be able to distinguish similarities and differences between input objects. The similarities and differences between these objects are abstracted into the concept of distance. In other words, in case of similarity between objects, the distance is close, whereas if there are many differences, the distance is long. A distance function is a function that considers two vectors as inputs and calculates the distance between two points [43,44]. Applying these distance functions according to the characteristics of the data is important for model performance. Furthermore, the distances in the same class are short, whereas the distances in different classes are long.
In an SNN, the model structure differs depending on the distance function that is used to calculate the distance between two embedding vectors [45,46]. Figure 4 shows the model structure when a distance-based metric is used. Distance-based metrics include Euclidean distance, Manhattan distance, and Hamming distance [47,48]. This model structure maps similarity based on a fully connected layer, because the size of the input vector and the size of the output vector are the same. Figure 5 shows the model structure when a similarity-based metric is used. Since this model structure uses cosine similarity or dot-product similarity, the size of the output vector is always 1, regardless of the size of the input vector; therefore, this structure does not require separate mapping [49,50].

3. Proposed Method for the Multiple Respiration Patterns and Each Pattern’s Range Classification Based on a 1D SNN

The existing 1D-CNN-based respiration pattern detection method exhibits suitable performance in detecting one respiration pattern for each type based on the breathing data. However, if there are multiple respiration patterns in the continuous breathing data, classifying and analyzing the ranges for each respiration pattern is difficult, and classification errors may exist. To solve these problems in this study, we propose a 1D-SNN-based respiration pattern recognition model that can be applied even when learning data collection and detection of objects that do not participate in learning are difficult. The reason for approaching the respiration pattern classification method with a 1D SNN model is based on the idea that the most similar respiration pattern can be classified as a target by comparing the similarity between the feature-embedding vectors of the target data and the feature-embedding vectors of the query data. In addition, in the pattern detection result for continuous breathing data, we propose a merge-and-split for respiration pattern (MASRP) algorithm that merges if the contact area is the same pattern and separates it in case of a different pattern.

3.1. Limitations of Existing Research

DNNs (which are traditional machine learning algorithms) and the recent 1D-CNN-based respiration pattern recognition methods are valid recognition methods when classifying one respiration pattern per input datum. However, if two or more respiration patterns are included in the input data, the recognition rate may be reduced, and results that are not included in the ground truth may appear due to the threshold value. Owing to this problem, when dividing a range by the respiration pattern in the breathing data of a certain range, it can be located in a range containing multiple patterns during the sliding window search, as shown in Figure 6. Figure 6 exhibits an erroneous recognition result between the eupnea and apnea sections. Therefore, the section classification for each respiration pattern may appear as an erroneous result.
Table 1 shows the results of recognizing data containing two respiration patterns in one section using a 1D CNN. Here, even if the two patterns representing the highest probability values are used as classification results, they appear as different results from the actual ground truth. Cases due to recognition errors are displayed in red in Table 1.

3.2. Our Proposed Method

The structure of the 1D SNN that we propose for multi-respiration-pattern recognition is based on the Siamese network structure. It is modified to allow 1D data to be input to certain layers to process signal data rather than images. The employed distance metrics include the cosine similarity and Manhattan distance. A method with high accuracy is selected for determining the similarity of breathing signal data. The proposed model structure is shown in Figure 7. Breathing data arrive at a rate of 20 data/s through the mmWave radar sensor, and a model with an input size is developed to achieve the best performance (the model with the highest accuracy is a structure with a cosine similarity distance matric and three CBRM blocks with an input size of 300 in 15 s).
As shown in Figure 7, the convolution + batch normalization + ReLU + max pooling (CBRM) unit is composed of a 1D convolution layer, batch normalization, ReLU function, and max-pooling layer. To determine the optimal depth for each input datum size, CBRM units were configured from 2 to 5, and each experiment was conducted accordingly.
In the learning process, the degree of similarity is determined by using cosine similarity for two different feature vectors obtained by inputting two input data to the encoder of the proposed model. The model is trained by inputting the calculated similarity and label values to the BCEWithLogitsLoss function. At this time, the label value is 1 for the same type of breathing and 0 for different types of breathing. BCEWithLogitsLoss is a combination of a sigmoid layer and binary cross-entropy loss, as shown in Equation (1) [51,52,53]. Here, x represents the label value, y represents the model prediction value, N represents the batch size, and w represents the weight.
( x , y ) = L = { l 1 , ... , l N } T , l n = w n [ y n log σ ( x n ) + ( 1 y n ) log ( 1 σ ( x n ) ) ]
The proposed 1D SNN model consists of Conv1D and MaxPool1D for processing one-dimensional data, as shown in Figure 7. The size of the input, the kernel size of the convolution layer, and the number of kernels are determined through additional experiments, and the optimization of the kernel size uses the harmony search algorithm proposed in the existing 1D-CNN-based respiration pattern recognition research [54]. The neural network architecture of the 1D SNN is constructed using these 1D CNN parameters by combining two 1D CNN models of types A and B. Table 2 shows the structure of the proposed human multiple respiration pattern recognition model.
Table 3 and Table 4 show the DNN and 1D CNN models, respectively, that were applied to detect the existing respiration patterns.
The inference process of the proposed 1D SNN model is shown in Figure 8. Five basic respiration patterns (non-augmented respiration patterns) are input into the previously proposed model, and the resulting feature vectors are all stored in the database. For inference, the feature vector is obtained by inputting the input data for query to the learned model. Subsequently, it calculates the cosine similarity using the feature vector for the query and each feature vector previously stored in the database, and then it returns the respiration pattern with the highest similarity as the detection result.
The 1D-SNN-based respiration pattern learning model (T) proposed in Figure 7 is trained using a fixed-length (m × 1) breathing dataset. The learning model takes two inputs as pairs, and the learning process classifies five basic respiration patterns using cosine similarity and the BCEWithLogitsLoss loss function on the feature-embedding vector of the input data. For model training, the similarity between the same types of respiration patterns is set to 1, and the similarity between different types of respiration patterns is set to 0.
As shown in Figure 8, the proposed SNN-based inference model calculates the cosine similarity between the embedding vectors (B1, …, B5) for each of the five basic respiration patterns and the embedding vector (R) of the query data of fixed length (m × 1) passed through the same model T, trained by the learning model T. The respiration pattern of the query data is detected by selecting the embedding vector from {B1, …, B5} whose similarity with the embedding vector R of the query data is the highest. This method determines which of the five respiration patterns is most similar to R.
Among the hyperparameters of the proposed 1D SNN, the items that influence the recognition accuracy of respiration patterns include the input size, number of layers, and distance metric. The hyperparameters of the 1D CNN constituting the 1D SNN were designed based on the size and number of kernels obtained through previous 1D-CNN-based respiration pattern recognition research [55,56,57]. The distance metric was selected as the result of calculating the accuracy by applying the Manhattan distance and cosine similarity methods to the same model.
Figure 9 is a model structure based on Manhattan distance, and after passing through the first fully connected layer it exhibits an N-dimensional vector. When two inputs are provided here, the distance can be obtained using Equation (2) for the two outputs. Subsequently, the similarity is measured by processing the last fully connected layer. Figure 10 shows a model structure based on cosine similarity, and after processing the final fully connected layer, an N-dimensional vector is obtained. When two inputs (A and B) are provided, the similarity is obtained using Equation (3).
Manhattan   Distance = d ( A , B ) = i = 1 n | a i b i |
Cos ine   similarity : = S c ( A , B ) = c o s ( θ ) = ( A B ) / A B  
The model configuration to determine the optimized architecture of the proposed model is configured as shown in Table 5. In the model architecture, the layer implies the number of 1D CBRMs, and it is composed of 2–5 for each input size. When designing the model, the minimum kernel size of the 1D convolution layer was set to 6, and when determining the number of layers, the size of the flattened feature vector was set to 64 or more after all of the input data had passed through the CBRM unit. The number of FC layers was configured according to the size of the flattened vector: four if the size was 1024 or more, three if the size was 512 or more, and two if the size was 64 or more. Output dim refers to the size of the feature vector (output dim = 32) after passing all of the layers before cosine similarity calculation.

3.3. Merging and Splitting Method of the Respiration Pattern Retrieval Range

In general, since the image consists of a background and an object, the objectness score and classification probability are high only at the location of the learned object. Furthermore, since the breathing data consist of continuous patterns learned differently from the image, the probability values of the objectness score and classification are high in almost all locations. The sliding window method is used when detecting the continuous respiration pattern range using a 1D SNN. The stride is set to be the same as the input size. As per the results of the visualized output, several results are output within one continuous respiration pattern range, as shown in Figure 11.
In Figure 11, the detection result is labeled as “Respiration type: Result”. The respiration type represents one of the five respiration patterns (eupnea, bradypnea, tachypnea, apnea, and movement). The result represents the degree of similarity. As shown in Figure 11b, the similarity decreases in the presence of multiple respiration patterns. If the similarity does not exceed the threshold value (set at 0.8 based on the experiments in this study), merging and splitting are performed by applying the merge-and-split for respiration pattern (MASRP) algorithm.
When there are two or more respiration patterns in the target area for respiration pattern detection, MASRP connects the same respiration pattern area in the front and back with the same respiration pattern. It separates the area when there are different types of respiration patterns in the front and back. The purpose of this process is to determine the stability and instability of breathing. This is achieved by calculating consecutive sections of the same respiration pattern and determining the number of specific respiration patterns and the length of each respiration pattern within the entire breathing section.
Each respiration pattern is displayed by matching colors in Figure 12. Eupnea is expressed in blue, bradypnea in yellow, tachypnea in red, apnea in cyan, and movement in green. To detect a section of a continuous respiration pattern, the corresponding respiration pattern is classified based on the procedure shown in Figure 12, and the MASRP algorithm is applied differently depending on whether the continuous respiration pattern is the same or different. To detect continuous breathing sections, as shown in Figure 12, the first input is used to detect respiration patterns in units of 600 (30 s).
Considering the execution procedure, Figure 12a presents the process of MASRP 1, and Figure 12b presents the process of MASRP 2. In Figure 12a, (1) presents the similarity values and respiration patterns based on the inputs presented to the 1D SNN model in units of 600 (30 s) from the input breathing data. The (2) in panel (a) shows the similarity value and respiration pattern found after inputting the data divided into 300 (15 s) units to the proposed 1D SNN model for the range where the similarity value in (1) is lower than the threshold. For the range in which the similarity value is lower than the threshold in (2), the range in (3) is divided into 200 (10 s) units and is inputted to the proposed 1D SNN model. In (3) in panel (a), if the two respiration patterns are the same, Algorithm 1 is employed to merge the corresponding areas into one area; (4) shows the result of executing Algorithm 1.
In Figure 12b, (1) shows the division of the input data size by 300 when the similarity obtained by using a 1D SNN model for respiration pattern recognition with an input data size of 600 falls below a certain threshold (in this case, 80); (2) shows the similarity obtained by inputting the divided data into a 1D SNN model with an input data size of 300 and dividing the input size by 200 when the similarity falls below a certain threshold. When dividing by 200, the division is based on 200 from the starting point and the ending point, and a 100-sized respiration pattern overlaps; (3) uses a 1D SNN model with an input size of 200 to obtain a 200-sized respiration pattern. If the two inputs have the same respiration pattern, applying the merging algorithm MASRP 1 yields the result shown in (4) in panel (a). However, if they have different respiration patterns, applying the partitioning algorithm MASRP 2 yields the result shown in (4) in panel (b). In this case, the left and right areas are divided according to the similarity ratio of the two respiration patterns.
Figure 13 describes Algorithm 1 (MASRP 1). Furthermore, as with (3) in Figure 12b, if the two respiration patterns are different, the overlapping range is cut into units of 100 (5 s), input to the proposed 1D SNN model, and divided into two ranges using Algorithm 2. Furthermore, the division criterion is the ratio of similarity of each respiration pattern existing in the range. Figure 14 describes Algorithm 2 (MASRP 2).
Algorithm 1 (MASRP 1): Algorithm to merge two ranges of the same overlapping pattern
Assign rleft of range 1 to r″left of range 3.
  • r″left = rleft
Assign r′right of range 2 to r″right of range 3.
  • r″right = r′right
Get range 3 as a result of merging range 1 and range 2.
The MASRP 1 algorithm merges two overlapping regions (range 1 and range 2) detected by the 1D SNN model when they have the same respiration pattern. During the merge process, as shown in ①, the rleft of range 1 is assigned to the r″left of range 3, and the r′right of range 2 is assigned to the r″right of range 3, as shown in ②. The merged result of range 1 and range 2 is represented as range 3, as shown in ③.
Algorithm 2 (MASRP 2): Algorithm to split the region when two ranges r and r’ detected with different patterns overlap one another
Calculate the length l of the overlapping ranges.
  • l = rright − r′left
After inputting the overlapping range l to the proposed 1D SNN model, divide l using the similarity value Sc, Sc′ (Sc is the similarity with the Range1 class; Sc′ is the similarity with the Range2 class) as a ratio value.
  • lr = l × {Sc/(Sc + Sc′)}, lr′ = l × {Sc′/(Sc + Sc′)}
Adjust rright and r′left using divided la and la′.
  • rright = rrightla′, rleft′ = rleft′ + la
MASRP 2 divides two regions based on the similarity ratio of the detected overlapping regions (range 1 and range 2) from the 1D SNN model when they have different respiration patterns. To do this, first, calculate the length l of the overlapped range, as in ①, and input it into the 1D SNN model to obtain the similarity Sc with the range l respiration pattern and the similarity Sc′ with the range 2 respiration pattern. Then, divide l into lr and lr′ by their respective similarity ratios, as in ②. Finally, as in ③, determine range 1 and range 2 by adjusting the rright of range l with lr′ and the r′left of range 2 with lr.

4. Experimental Results and Considerations

In this section, the breathing data collection environment for the experiment and the composition of the collected data are presented. The experimental results of the proposed 1D SNN respiration pattern classification model and the results of the application of existing methods (such as DNN and CNN) are compared and evaluated. The performance evaluation of the proposed 1D SNN evaluates the accuracy based on IOU by comparing the ground truth with the result of applying the proposed method to test the data on a trained model.
For comparison with the existing method, a respiration pattern recognition model was implemented with a DNN and a 1D CNN. Subsequently, the results of applying MASRP (DNN + MASRP, 1D CNN + MASRP) and IOU accuracy with the ground truth were calculated. We calculated the IOU between the result of the proposed method (1D SNN + MASRP) and the ground truth. Furthermore, we calculated the IOU between the results of applying MASRP to the existing methods (DNN, 1D CNN) and the ground truth. The proposed method was found to be superior to the existing methods.

4.1. Experimental Environment

The mmWave sensor shown in Figure 15 was used for the experiments in this study, and the specifications of each device are shown in Table 6. Each sensor is composed of an environment that can measure data through PC and UART communication [58].
Pertaining to the breathing signal collection environment using the mmWave sensor, as shown in Figure 16, a person lies in an upright position on a simple bed, and the mmWave sensor is installed at a location 20 cm away from the person’s chest to collect signals for five respiration patterns. Figure 17 shows an example of a breathing signal measured using the mmWave sensor.
In the aforementioned environment, data were collected using a breathing data measurement program, as shown in Figure 18. Breathing signal data were collected while inducing eupnea, bradypnea, tachypnea, apnea, and movement signals to be included.
The system environment for learning and testing the collected data was implemented on a PC, as shown in Table 7.

4.2. Organization of Training and Test Data

For training and testing purposes, a dataset was constructed using mmWave sensors for 10 people, collecting 30 breathing data per person for 30 min each. To prevent diversity and potential bias of data, 250 breathing data were collected from 7 out of 10 individuals for training purposes, while the remaining 50 breathing data were collected from the other 3 individuals for testing purposes. Figure 19 shows the structure of the raw data obtained from the mmWave sensor.
As shown in Figure 20, the respiration pattern range can be set via the annotation tool developed for this study. When the range is set, the center point (x) and length (width) information of the range are automatically entered in the labeling setting area. The screen displays the respiration rate per minute for the selected area. The respiration rate per minute is calculated according to the number of peaks in the set area after calculating the peak for the breathing signal. Finally, the ground truth for the respiration pattern area is set by clicking the “add” button after entering the class number information. By repeating this operation, annotation is performed on the continuous breathing data. After all labeling is completed, the save button may be clicked to save the breathing data file (.npy) and the annotation information (.txt) file.
The dataset created through annotation is shown in Table 8. The number of respiration patterns and the length of the data according to the ground-truth set are shown. Each breathing datum was cut into 30-minute lengths, and there were a total of 36,000 data points (20 data/s × 60 s × 30 min) within that range. Out of the entire dataset—consisting of 300 breathing data samples with a length of 30 min each—250 were used for training and 50 were used as test data. When configuring the training data loader for pattern classification, one pair of random positive pairs and one pair of random negative pairs that fit the set input size among the 250 training data were imported, as shown in Figure 21. When configuring the test data loader, one pair of random positive pairs and N pairs of random negative pairs were imported that fit the set input size among the 50 test data. In the case of the same respiration pattern, a positive pair features a label value of 1, and in the case of a different respiration pattern, a negative pair features a label value of 0.

4.3. Experiment and Evaluation

In this section, we performed 1:1 verification of respiration patterns for each input size and layer depth for the 1D SNN model, i.e., the proposed method. Furthermore, we also evaluated the classification accuracy of respiration patterns for each input size and layer depth. Through the classification of continuous breathing ranges, respiration patterns were first detected by applying the 1D SNN model, and they were subsequently classified into ranges of each respiration pattern based on application of MASRP to the detected areas. The final results of the application of MASRP and the ground truth were interpreted in terms of IOU to evaluate the accuracy of the proposed method.
In addition, the superiority of the proposed method was demonstrated by comparing the IOU between the ground truth and the final result of classification of the respiration pattern area through the application of MASRP to the results of respiration pattern recognition based on the existing DNN and 1D CNN methods.

4.3.1. Pattern Classification Experiments and Results

Experiments were conducted to determine the optimal input size for respiration interval detection of the proposed 1D-SNN-based model. The basic hyperparameters required for learning and testing are defined in Table 9. The basic hyperparameters include test trials, way, and num train. Here, test trials pertain to the number of samples required for comparison when conducting an experiment on the test dataset. Way is a parameter that adjusts the ratio of positive pairs to negative pairs when conducting the trials. Num train is a parameter that determines how many data will be randomly extracted and trained per epoch.
There were four different input data sizes: 100 (5 s), 200 (10 s), 300 (15 s), and 600 (30 s). Twenty pieces of data were collected per second from the mmWave radar sensor.
Cosine similarity and L1 distance were used as distance metrics, and each layer was configured to have 2–5 layers. For 20 epochs, if the maximum accuracy was not updated, learning was set to stop, and 400 × 5 (test trials × way) random data were imported in one test. The ratio of positive pairs to negative pairs was 1:5 (1:way). The total number of epochs was 200, and the batch size was set to 4096.
Table 10 shows the 1:1 verification accuracy for each metric and input data size. In the experimental results, the overall accuracy of the metric function using cosine similarity was higher than that using the Manhattan distance metric. Considering the accuracy of 1:1 verification, the model structure exhibiting the highest accuracy by input size showed the highest performance when the layer depth was set to three for the input sizes of 100, 300, and 600. At 200, it was slightly higher when the layer depth was four. The results of evaluating the retrieval accuracy with the model are shown in Table 11. The performance was the highest at the input size of 300, with 87.4% at the input size of 100, 92.0% at 200, 97.6% at 300, and 97.4% at 600. In this study, the input data size was sequentially selected as 600, 300, 200, and 100 to detect continuous respiration pattern ranges. At this time, the model with the highest top-1 accuracy was applied for each input data size.
Table 12 and Figure 22 show the accuracy and confusion matrix of each respiration pattern for the proposed method (1D-SNN) and existing methods for respiration pattern recognition results. The test data used to measure the accuracy of each respiration pattern consisted of a total of 2000 test datasets, each containing 400 respiration patterns, and the input data size was 300. In addition, Table 13 shows the recall, precision, and F1 scores for the respiration pattern recognition results of the proposed method and existing methods. As shown in Table 12, the experimental results revealed that the 1D SNN, 1D CNN, and DNN methods exhibited high accuracy in order. Therefore, the proposed MASRP algorithm was applied, with a focus on 1D SNN, 1D CNN, and DNN, to improve the classification accuracy of multiple respiration patterns in continuous breathing segments.

4.3.2. Evaluation of IOU accuracy for Merging and Splitting Results of Respiration Pattern Ranges

For the evaluation of the proposed method, first, a 1D SNN model was used to detect respiration patterns in the test dataset. The range merging and splitting processes were performed using the MASRP 1 and 2 algorithms proposed in Section 3.3 for the detection results. As shown in Figure 23, the ground-truth area of the test data and the results of the proposed method were compared in terms of the IOU across several samples. The error is indicated as the discrepancy area. The results of the ground truth and 1D SNN detection are visually displayed by overlaying colors for each respiration pattern.
Figure 23 shows the ground truth for the test data and the processing results obtained applying the 1D SNN and the MASRP algorithm on the test data. The inconsistency range shows the error between the ground truth and the detection results of the proposed method.
The accuracy of the aforementioned results can be changed according to the ignore threshold value during inference. This value is a threshold value for determining whether the model correctly detected the pattern range. As the value is smaller, multiple detection results may occur in one respiration pattern region, and the probability of false detection increases accordingly. Therefore, in this paper, a relatively high value of 0.8 was acquired, such that an appropriate number of detection results were obtained. If this value is set to be extremely high, holes may appear with a high frequency between the detected pattern areas. Inconsistent areas mostly occurred in the section where the respiration pattern changed. In particular, when the movement pattern area signal was similar to other respiration patterns, it was recognized as a respiration pattern, and the discrepancy was substantial.
The accuracy comparison of the proposed 1D-SNN-based detection method (1D SNN + MASRP) was conducted using 50 test data, as shown in Figure 24. For accuracy comparison, we calculated the IOU between the results of applying MASRP to the existing methods (1D CNN and DNN) and the ground truth. Thereafter, we calculated the IOU between the result of the proposed method (1D SNN + MASRP) and the ground truth. The method with high IOU exhibited high detection performance. Existing methods such as 1D CNN and DNN use pretrained models.
The results of applying MASRP to the proposed 1D SNN and the results of applying MASRP to existing methods were visualized, as shown in Figure 25. When the results of each pattern were observed, the proposed method appeared much less frequently than the existing methods in the inconsistent area. The existing methods also encountered the problem of recognizing a part of a specific pattern area as a completely different pattern from the ground truth.
Experiments were conducted on 50 test data, and the average IOU results of the proposed method and the existing methods are shown in Table 14. The proposed method exhibited approximately 12.4% higher accuracy than the 1D CNN method and 19.7% higher accuracy than the DNN method.

5. Conclusions

Recently, various studies have been conducted on the analysis of human sleep quality or sleep breathing disorders using artificial intelligence technology. Existing studies have mainly focused on simple classification of apnea patterns. However, recently, in the field of healthcare or sleep-related healthcare, research that recognizes various respiration patterns and the classification of simple respiration patterns has gained considerable interest. In particular, research on recognizing various respiration patterns from long-term continuous breathing data and extracting information such as frequency and duration for each respiration pattern requires attention. In this paper, we propose a neural network model that detects regions for each respiration pattern from long-term breathing data and an algorithm that merges and divides regions into regions where multiple respiration patterns exist.
The proposed neural network is based on 1D SNN. We designed a 1D SNN model that can detect respiration pattern regions from one-dimensional breathing data. In addition, a study was conducted to extract information such as the frequency and duration of each respiration pattern from the entire breathing dataset by applying a merge-and-split algorithm (MASRP) to the respiration pattern regions detected by the proposed model. In particular, the proposed method improves the performance by optimizing the main hyperparameters of 1D SNN through the harmony search algorithm and additional experiments. Since the 1D SNN classifies respiration patterns based on similarity, registering individual respiration patterns in the model can improve the detection accuracy. In addition, even with long-term breathing data, it is possible to identify the ratio and frequency of each respiration pattern in the data, which can be utilized in the medical field.
The data from 10 normal adults were used for learning and testing. Using the mmWave sensor, 30 cases of 30-minute-long data were measured for each person; that is, a total of 300 data were secured. Each datum was measured to include all five patterns of eupnea, bradypnea, tachypnea, apnea, and movement. To evaluate the performance of the proposed method and the existing respiration pattern recognition methods (1D CNN and DNN), the sliding window method was used to detect the respiration pattern area, and the accuracy of the detection results was compared with the IOU between the result of applying the proposed MASRP algorithm and the ground truth. As a result, the proposed method exhibited approximately 12.4% accuracy improvement over the 1D CNN method and approximately 19.7% accuracy improvement over the DNN method. In other words, the average accuracy of classification by respiration pattern confirmed that the proposed method was improved by approximately 14.5% over DNN and 5.3% over 1D CNN.
While proposing a classification method for respiration patterns with high accuracy, it is difficult to guarantee 100% accuracy, due to the possibility of multiple respiration patterns within the detection range. Comparing multiple respiration pattern components within the target detection window with the existing respiration patterns makes it difficult to ensure high accuracy. Therefore, we proposed a 1D SNN model based on the similarity of embedding vectors for respiration pattern features in our proposed method, to improve the accuracy. Additionally, we increased the classification accuracy by applying the proposed MASRP algorithm when multiple respiration patterns existed in the detection range. In this case, we divided the detection range into detailed sections and applied the 1D SNN to each section. After division, when multiple respiration patterns existed in the last detailed section, we divided the section into “before and after” respiration ranges based on the similarity ratio of each respiration pattern, and then merged them. Therefore, it is still difficult to guarantee 100% accuracy.

Author Contributions

Conceptualization, G.-T.H.; funding acquisition, G.-T.H.; investigation, J.-W.H. and G.-T.H.; methodology, J.-W.H. and G.-T.H.; implementation and testing, J.-W.H.; writing—original draft, J.-W.H.; writing—review and editing, G.-T.H.; algorithm support and visualization, S.-H.K.; project administration, G.-T.H.; formal analysis, G.-T.H.; validation, G.-T.H.; supervision, G.-T.H. All authors have read and agreed to the published version of the manuscript.

Funding

This work was supported by a National Research Foundation of Korea (NRF) grant funded by the Korean government (MSIT) (No. NRF-2022R1F1A1062980).

Institutional Review Board Statement

This study was conducted in accordance with the Declaration of Helsinki and approved by the Institutional Review Board (or Ethics Committee) of Gachon University in South Korea (protocol code 1044396-202302-HR-029-01 approved on 9 March 2023).

Informed Consent Statement

Informed consent was obtained from all subjects involved in the study.

Data Availability Statement

Not applicable.

Acknowledgments

The authors appreciate Zong Woo Geem for his help in preparing this manuscript.

Conflicts of Interest

The authors declare no conflict of interest.

References

  1. Zhu, H.; Lai, J.; Liu, B.; Wen, Z.; Xiong, Y.; Li, H.; Zhou, Y.; Fu, Q.; Yu, G.; Yan, X.; et al. Automatic Pulmonary Auscultation Grading Diagnosis of Coronavirus Disease 2019 in China with Artificial Intelligence Algorithms: A Cohort Study. Comput. Methods Programs Biomed. 2022, 213, 106500. [Google Scholar] [CrossRef]
  2. Liu, B.; Wen, Z.; Zhu, H.; Lai, J.; Wu, J.; Ping, H.; Liu, W.; Yu, G.; Zhang, J.; Liu, Z.; et al. Energy-Efficient Intelligent Pulmonary Auscultation for Post COVID-19 Era Wearable Monitoring Enabled by Two-Stage Hybrid Neural Network. In Proceedings of the 2022 IEEE International Symposium on Circuits and Systems (ISCAS), Austin, TX, USA, 27 May 2022–1 June 2022; pp. 2220–2224. [Google Scholar]
  3. Tiew, P.Y.; Thng, K.X.; Chotirmall, S.H. Clinical aspergillus Signatures in COPD and bronchiectasis. J. Fungi 2022, 8, 480. [Google Scholar] [CrossRef]
  4. Fagundes, N.C.F.; Minervini, G.; Alonso, B.F.; Nucci, L.; Grassia, V.; D’Apuzzo, F.; Puigdollers, A.; Perillo, L.; Flores-Mir, C. Patient-reported outcomes while managing obstructive sleep apnea with oral appliances: A scoping review. J. Evid.-Based Dent. Pract. 2023, 23, 101786. [Google Scholar] [CrossRef] [PubMed]
  5. Rehman, M.; Shah, R.A.; Khan, M.B.; Shah, S.A.; AbuAli, N.A.; Yang, X.; Alomainy, A.; Imran, M.A.; Abbasi, Q.H. Improving machine learning classification accuracy for breathing abnormalities by enhancing dataset. Sensors 2021, 21, 6750. [Google Scholar] [CrossRef] [PubMed]
  6. Fang, Z.; Wang, W.; Wang, J.; Liu, B.; Tang, K.; Lou, L.; Heng, C.-H.; Wang, C.; Zheng, Y. Integrated Wideband Chip-Scale RF Transceivers for Radar Sensing and UWB Communications: A Survey. IEEE Circuits Syst. Mag. 2022, 22, 40–76. [Google Scholar] [CrossRef]
  7. Zhai, Q.; Han, X.; Han, Y.; Yi, J.; Wang, S.; Liu, T. A Contactless On-Bed Radar System for Human Respiration Monitoring. IEEE Trans. Instrum. Meas. 2022, 71, 1–10. [Google Scholar] [CrossRef]
  8. Rohman, B.P.A.; Rudrappa, M.T.; Shargorodskyy, M.; Herschel RNishimoto, M. Moving Human Respiration Sign Detection Using mm-Wave Radar via Motion Path Reconstruction. In Proceedings of the 2021 International Conference on Radar, Antenna, Microwave, Electronics, and Telecommunications (ICRAMET), Bandung, Indonesia, 23–24 November 2021; pp. 196–200. [Google Scholar]
  9. Li, C.; Lubecke, V.M.; Boric-Lubecke, O.; Lin, J. A Review on Recent Advances in Doppler Radar Sensors for Noncontact Healthcare Monitoring. IEEE Trans. Microw. Theory Technol. 2013, 61, 2046–2060. [Google Scholar] [CrossRef]
  10. Islam, S.M.M.; Motoyama, N.; Pacheco, S.; Lubecke, V.M. Non-Contact Vital Signs Monitoring for Multiple Subjects Using a Millimeter Wave FMCW Automotive Radar. In Proceedings of the 2020 IEEE/MTT-S International Microwave Symposium (IMS), Los Angeles, CA, USA, 4–6 August 2020. [Google Scholar] [CrossRef]
  11. Tran, V.P.; Al-Jumaily, A.A.; Islam, S.M.S. Doppler Radar-Based Non-Contact Health Monitoring for Obstructive Sleep Apnea Diagnosis: A Comprehensive Review. Big Data Cogn. Comput. 2019, 3, 3. [Google Scholar] [CrossRef] [Green Version]
  12. Kim, M.-G.; Pan, S.B. Deep Learning based on 1-D Ensemble Networks using ECG for Real-Time User Recognition. IEEE Trans. Ind. Inform. 2019, 15, 5656–5663. [Google Scholar] [CrossRef]
  13. Lee, S.-M.; Yoon, S.M.; Cho, H. Human activity recognition from accelerometer data using Convolutional Neural Network. In Proceedings of the IEEE International Conference on Big Data and Smart Computing (BigComp), Jeju, Republic of Korea, 13–16 February 2017. [Google Scholar]
  14. McClure, K.; Erdreich, B.; Bates, J.H.T.; McGinnis, R.S.; Masquelin, A.; Wshah, S. Classification and detection of breathing patterns with wearable sensors and deep learning. Sensors 2020, 20, 6481. [Google Scholar] [CrossRef]
  15. Van Steenkiste, T.; Groenendaal, W.; Ruyssinck, J.; Dreesen, P.; Klerkx, S.; Smeets, C. Systematic comparison of respiratory signals for the automated detection of sleep apnea. In Proceedings of the 2018 40th Annual International Conference of the IEEE Engineering in Medicine and Biology Society (EMBC), Honolulu, HI, USA, 18–21 July 2018. [Google Scholar]
  16. Du, J. Understanding of Object Detection Based on CNN Family and YOLO. J. Phys. Conf. Ser. 2018, 1004, 012029. [Google Scholar] [CrossRef]
  17. Ćorović, A.; Ilić, V.; Ðurić, S.; Marijan, M.; Pavković, B. The Real-Time Detection of Traffic Participants Using YOLO Algorithm. In Proceedings of the 26th Telecommunications Forum(TELFOR), Belgrade, Serbia, 20–21 November 2018; pp. 1–4. [Google Scholar]
  18. Koch, G.; Zemel, R.; Salakhutdinov, R. Siamese neural networks for one-shot image recognition. ICML Deep. Learn. Workshop 2015, 2, 1. [Google Scholar]
  19. Chen, X.; He, K. Exploring simple siamese representation learning. In Proceedings of the IEEE/CVF Conference on Computer Vision and Pattern Recognition, Nashville, TN, USA, 20–25 June 2021. [Google Scholar]
  20. West, J.B. Respiratory Physiology: The Essentials; Lippincott Williams & Wilkins: Philadelphia, PA, USA, 2012. [Google Scholar]
  21. Loughlin, P.C.; Sebat, F.; Kellett, J.G. Respiratory Rate: The Forgotten Vital Sign—Make It Count! Jt. Comm. J. Qual. Patient Saf. 2018, 44, 494–499. [Google Scholar] [CrossRef] [PubMed]
  22. Szegdy, C.; Toshev, A.; Erhan, D. Deep Neural Network for Object Detection. Adv. Neural Inf. Process. Syst. 2013, 2553–2561. [Google Scholar] [CrossRef]
  23. Huang, Y.; Sun, S.; Duan, X.; Chen, Z. A Study on Deep Neural Networks Framework. In Proceedings of the 2016 IEEE Advanced Information Management, Communicates, Electronic and Automation Control Conference (IMCEC), Xi’an, China, 3–5 October 2016. [Google Scholar] [CrossRef]
  24. Zhang, J.; Zheng, Y.; Qi, D.; Li, R.; Yi, X. DNN-Based Prediction Model for Spatio-Temporal Data. In Proceedings of the 24th ACM SIGSPATIAL International Conference on Advances in Geographic Information Systems, Burlingame, CA, USA, 31 October–3 November 2016; pp. 1–4. [Google Scholar] [CrossRef]
  25. Bayraci, S.; Susuz, O. Deep Neural Network(DNN) Based Classification Model in Application to Loan Default Prediction. Theor. Appl. Econ. 2019, 4, 75–84. [Google Scholar]
  26. Ruder, S. An overview of gradient descent optimization algorithms. arXiv 2016, arXiv:1609.04747. [Google Scholar]
  27. Zhao, B.; Lu, H.; Chen, S.; Liu, J.; Wu, D. Convolutional neural networks for time series classification. J. Syst. Eng. Electron. 2017, 28, 162–169. [Google Scholar] [CrossRef]
  28. Kiranyaz, S.; Avci, O.; Abdeljaber, O.; Ince, T.; Gabbouj, M.; Inman, D.J. 1D convolutional neural networks and applications: A survey. Mech. Syst. Signal Process. 2021, 151, 107398. [Google Scholar] [CrossRef]
  29. Zeng, X.; YangJunjie, W.O.; Wang, Y. Gated Bi-directional CNN for Object Detection. Eur. Conf. Comput. Vis 2016, 14, 354–369. [Google Scholar]
  30. Jana, G.C.; Sharma, R.; Agrawal, A. A 1D-CNN-Spectrogram Based Approach for Seizure Detection from EEG Signal. Procedia Comput. Sci. 2020, 167, 403–412. [Google Scholar] [CrossRef]
  31. Mitiche, I.; Nesbitt, A.; Conner, S.; Boreham, P.; Morison, G. 1D-CNN based real-time fault detection system for power asset diagnostics. IET Gener. Transm. Distrib. 2020, 14, 5766–5773. [Google Scholar] [CrossRef]
  32. Cho, H.; Yoon, S.M. Divide and Conquer-Based 1D CNN Human Activity Recognition Using Test Data Sharpening. Sensors 2018, 18, 1055. [Google Scholar] [CrossRef] [PubMed] [Green Version]
  33. Taejun, K.; Lee, J.; Nam, J. Sample-Level CNN Architectures for Music Auto-Tagging Using Raw Waveforms. In Proceedings of the IEEE International Conference on Acoustics, Speech and Signal Processing (ICASSP), Calgary, AB, Canada, 15–20 April 2018. [Google Scholar] [CrossRef]
  34. Zhang, Q.; Zhou, D.; Zeng, X. HeartID: A Multiresolution Convolutional Neural Network for ECG-Based Biometric Human Identification in Smart Health Applications. IEEE Access Body Area Netw. 2017, 5, 11805–11816. [Google Scholar] [CrossRef]
  35. Wang, Y.; Yao, Q.; Kwok, J.T.; Ni, L.M. Generalizing from a few examples: A survey on few-shot learning. ACM Comput. Surv. (Csur) 2020, 53, 1–34. [Google Scholar] [CrossRef]
  36. Zhang, C.; Liu, W.; Ma, H.; Fu, H. Siamese neural network based gait recognition for human identification. In Proceedings of the 2016 IEEE International Conference on Acoustics, Speech and Signal Processing (ICASSP), Shanghai, China, 20–25 March 2016. [Google Scholar] [CrossRef]
  37. An, N.; Yan, W.Q. Multitarget Tracking Using Siamese Neural Networks. ACM Trans. Multimed. Comput. Commun. Appl. 2021, 17, 1–16. [Google Scholar] [CrossRef]
  38. Ostertag, C.; Beurton-Aimar, M. Matching ostraca fragments using a siamese neural network. Pattern Recognit. Lett. 2020, 131, 336–340. [Google Scholar] [CrossRef]
  39. Shorfuzzaman, M.; Hossain, M.S. MetaCOVID: A Siamese neural network framework with contrastive loss for n-shot diagnosis of COVID-19 patients. Pattern Recognit. 2021, 113, 107700. [Google Scholar] [CrossRef]
  40. Zhou, X.; Liang, W.; Shimizu, S.; Ma, J.; Jin, Q. Siamese Neural Network Based Few-Shot Learning for Anomaly Detection in Industrial Cyber-Physical Systems. IEEE Trans. Ind. Inform. 2020, 17, 5790–5798. [Google Scholar] [CrossRef]
  41. Santoro, A.; Bartunov, S.; Botvinick, M.; Wierstra, D.; Lillicrap, T. Meta-learning with memory-augmented neural networks. Int. Conf. Mach. Learning. PMLR 2016, 48, 1842–1850. [Google Scholar]
  42. Kulis, B. Metric learning: A survey. Found. Trends® Mach. Learn. 2013, 5, 287–364. [Google Scholar] [CrossRef]
  43. Weller-Fahy, D.J.; Borghetti, B.J.; Sodemann, A.A. Sodemann. A survey of distance and similarity measures used within network intrusion anomaly detection. IEEE Commun. Surv. Tutor 2014, 17, 70–91. [Google Scholar] [CrossRef]
  44. Yıldırım, Ö.; Baloglu, U.B.; Acharya, U.R. A deep convolutional neural network model for automated identification of abnormal EEG signals. Neural Comput. Appl. 2018, 32, 15857–15868. [Google Scholar] [CrossRef]
  45. Chen, S.; Bin, M.; Zhang, K. On the similarity metric and the distance metric. Theor. Comput. Sci. 2009, 410, 2365–2376. [Google Scholar] [CrossRef] [Green Version]
  46. Suo, Q.; Ma, F.; Yuan, Y.; Huai, M.; Zhong, W.; Gao, J.; Zhang, A. Deep patient similarity learning for personalized healthcare. IEEE Trans. Nanobiosci. 2018, 17, 219–227. [Google Scholar] [CrossRef]
  47. Ahonen, T.; Hadid, A.; Pietikainen, M. Face description with local binary patterns: Application to face recognition. IEEE Trans. Pattern Anal. Mach. Intell. 2006, 28, 2037–2041. [Google Scholar] [CrossRef]
  48. Weinberger, K.Q.; Saul, L.K. Distance metric learning for large margin nearest neighbor classification. J. Mach. Learn. Res. 2009, 10, 207–244. [Google Scholar]
  49. Wojke, N.; Bewley, A. Deep cosine metric learning for person re-identification. In Proceedings of the 2018 IEEE winter conference on applications of computer vision (WACV), Lake Tahoe, NV, USA, 12–15 March 2018. [Google Scholar]
  50. Kaya, M.; Bilge, H. Deep metric learning: A survey. Symmetry 2019, 11, 1066. [Google Scholar] [CrossRef] [Green Version]
  51. Lawhern, V.J.; Solon, A.J.; Waytowich, N.R.; Gordon, S.M.; Hung, C.P.; Lance, B.J. EEGNet: A compact convolutional neural network for EEG-based brain–computer interfaces. J. Neural Eng. 2018, 15, 056013. [Google Scholar] [CrossRef] [Green Version]
  52. Liu, P.J.; Saleh, M.; Pot, E.; Goodrich, B.; Sepassi, R.; Kaiser, L.; Shazeer, N. Generating wikipedia by summarizing long sequences. arXiv 2018, arXiv:1801.10198. [Google Scholar]
  53. Paszke, A.; Gross, S.; Massa, F.; Lerer, A.; Bradbury, J.; Chanan, G. Pytorch: An imperative style, high-performance deep learning library. Adv. Neural Inf. Process. Syst. 2019, 32, 8024–8035. [Google Scholar]
  54. Kim, S.-H.; Geem, Z.W.; Han, G.-T. Hyperparameter optimization method based on harmony search algorithm to improve performance of 1D CNN human respiration pattern recognition system. Sensors 2020, 20, 3697. [Google Scholar] [CrossRef] [PubMed]
  55. Dubey, S.R.; Chakraborty, S.; Roy, S.K.; Mukherjee, S.; Singh, S.K.; Chaudhuri, B.B. diffGrad: An Optimization Method for Convolutional Neural Networks. IEEE Trans. Neural Networks Learn. Syst. 2019, 31, 4500–4511. [Google Scholar] [CrossRef] [PubMed] [Green Version]
  56. Florea, A.-C.; Andonie, R. Weighted Random Search for Hyperparameter Optimization. Int. J. Comput. Commun. Control. 2019, 14, 432–445. [Google Scholar] [CrossRef]
  57. Kim, S.H.; Han, G.T. 1D CNN based human respiration pattern recognition using ultra wideband radar. In Proceedings of the 2019 International Conference on Artificial Intelligence in Information and Communication (ICAIIC), Okinawa, Japan, 11–13 February 2019. [Google Scholar]
  58. TI mmWave Labs—Vital Signs Measurement (Version 1.2), User Guide; Texas Instruments: Dallas, TX, USA, 2017.
Figure 1. Signals generated according to inhalation, exhalation, and the depth of breathing.
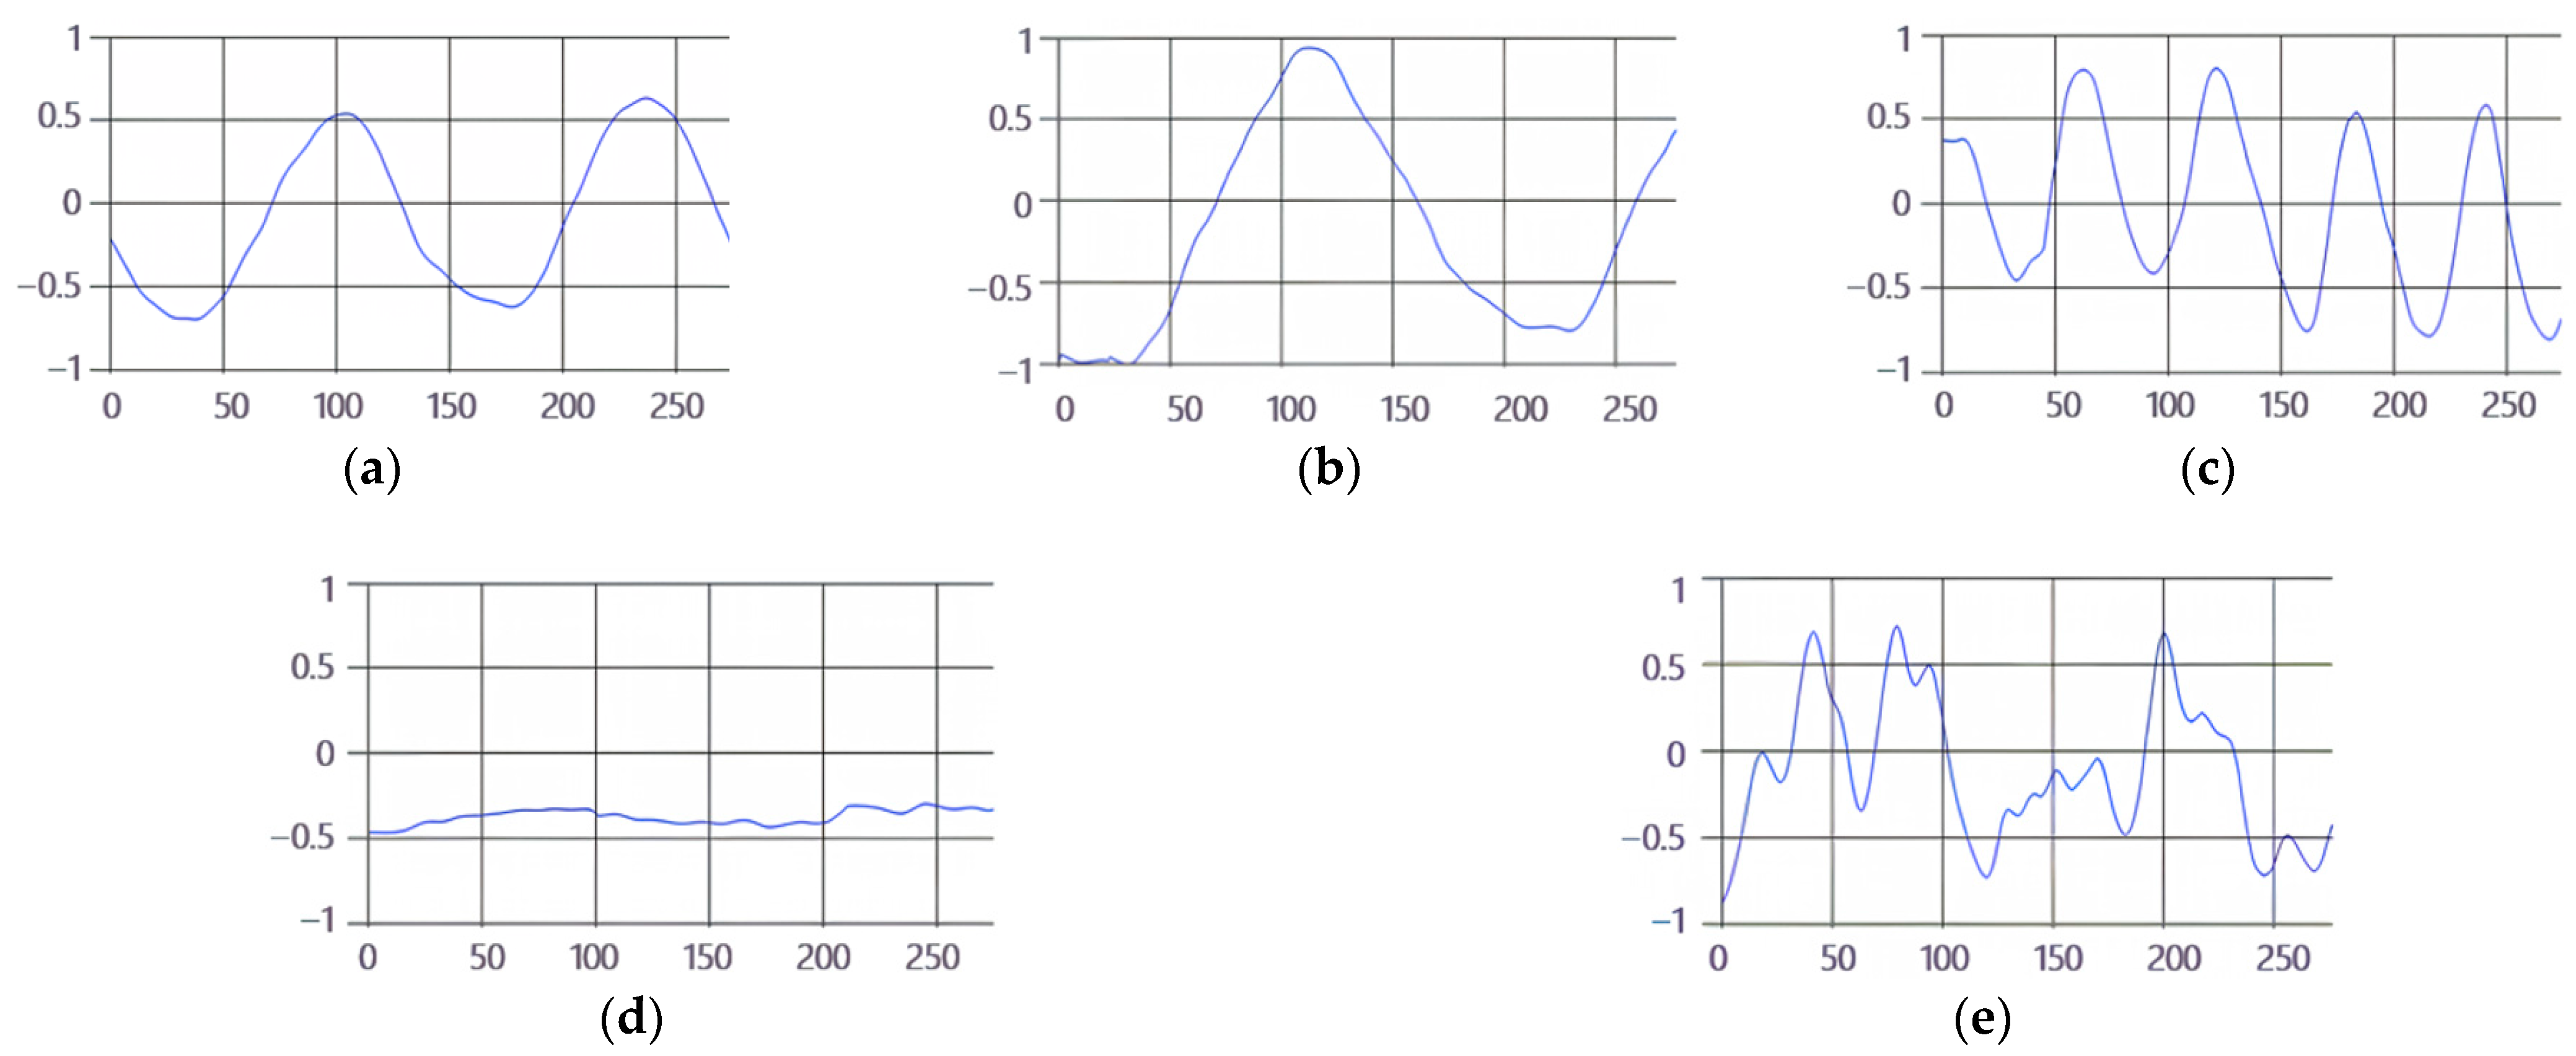
Sensors 23 05275 g001
Figure 2. 
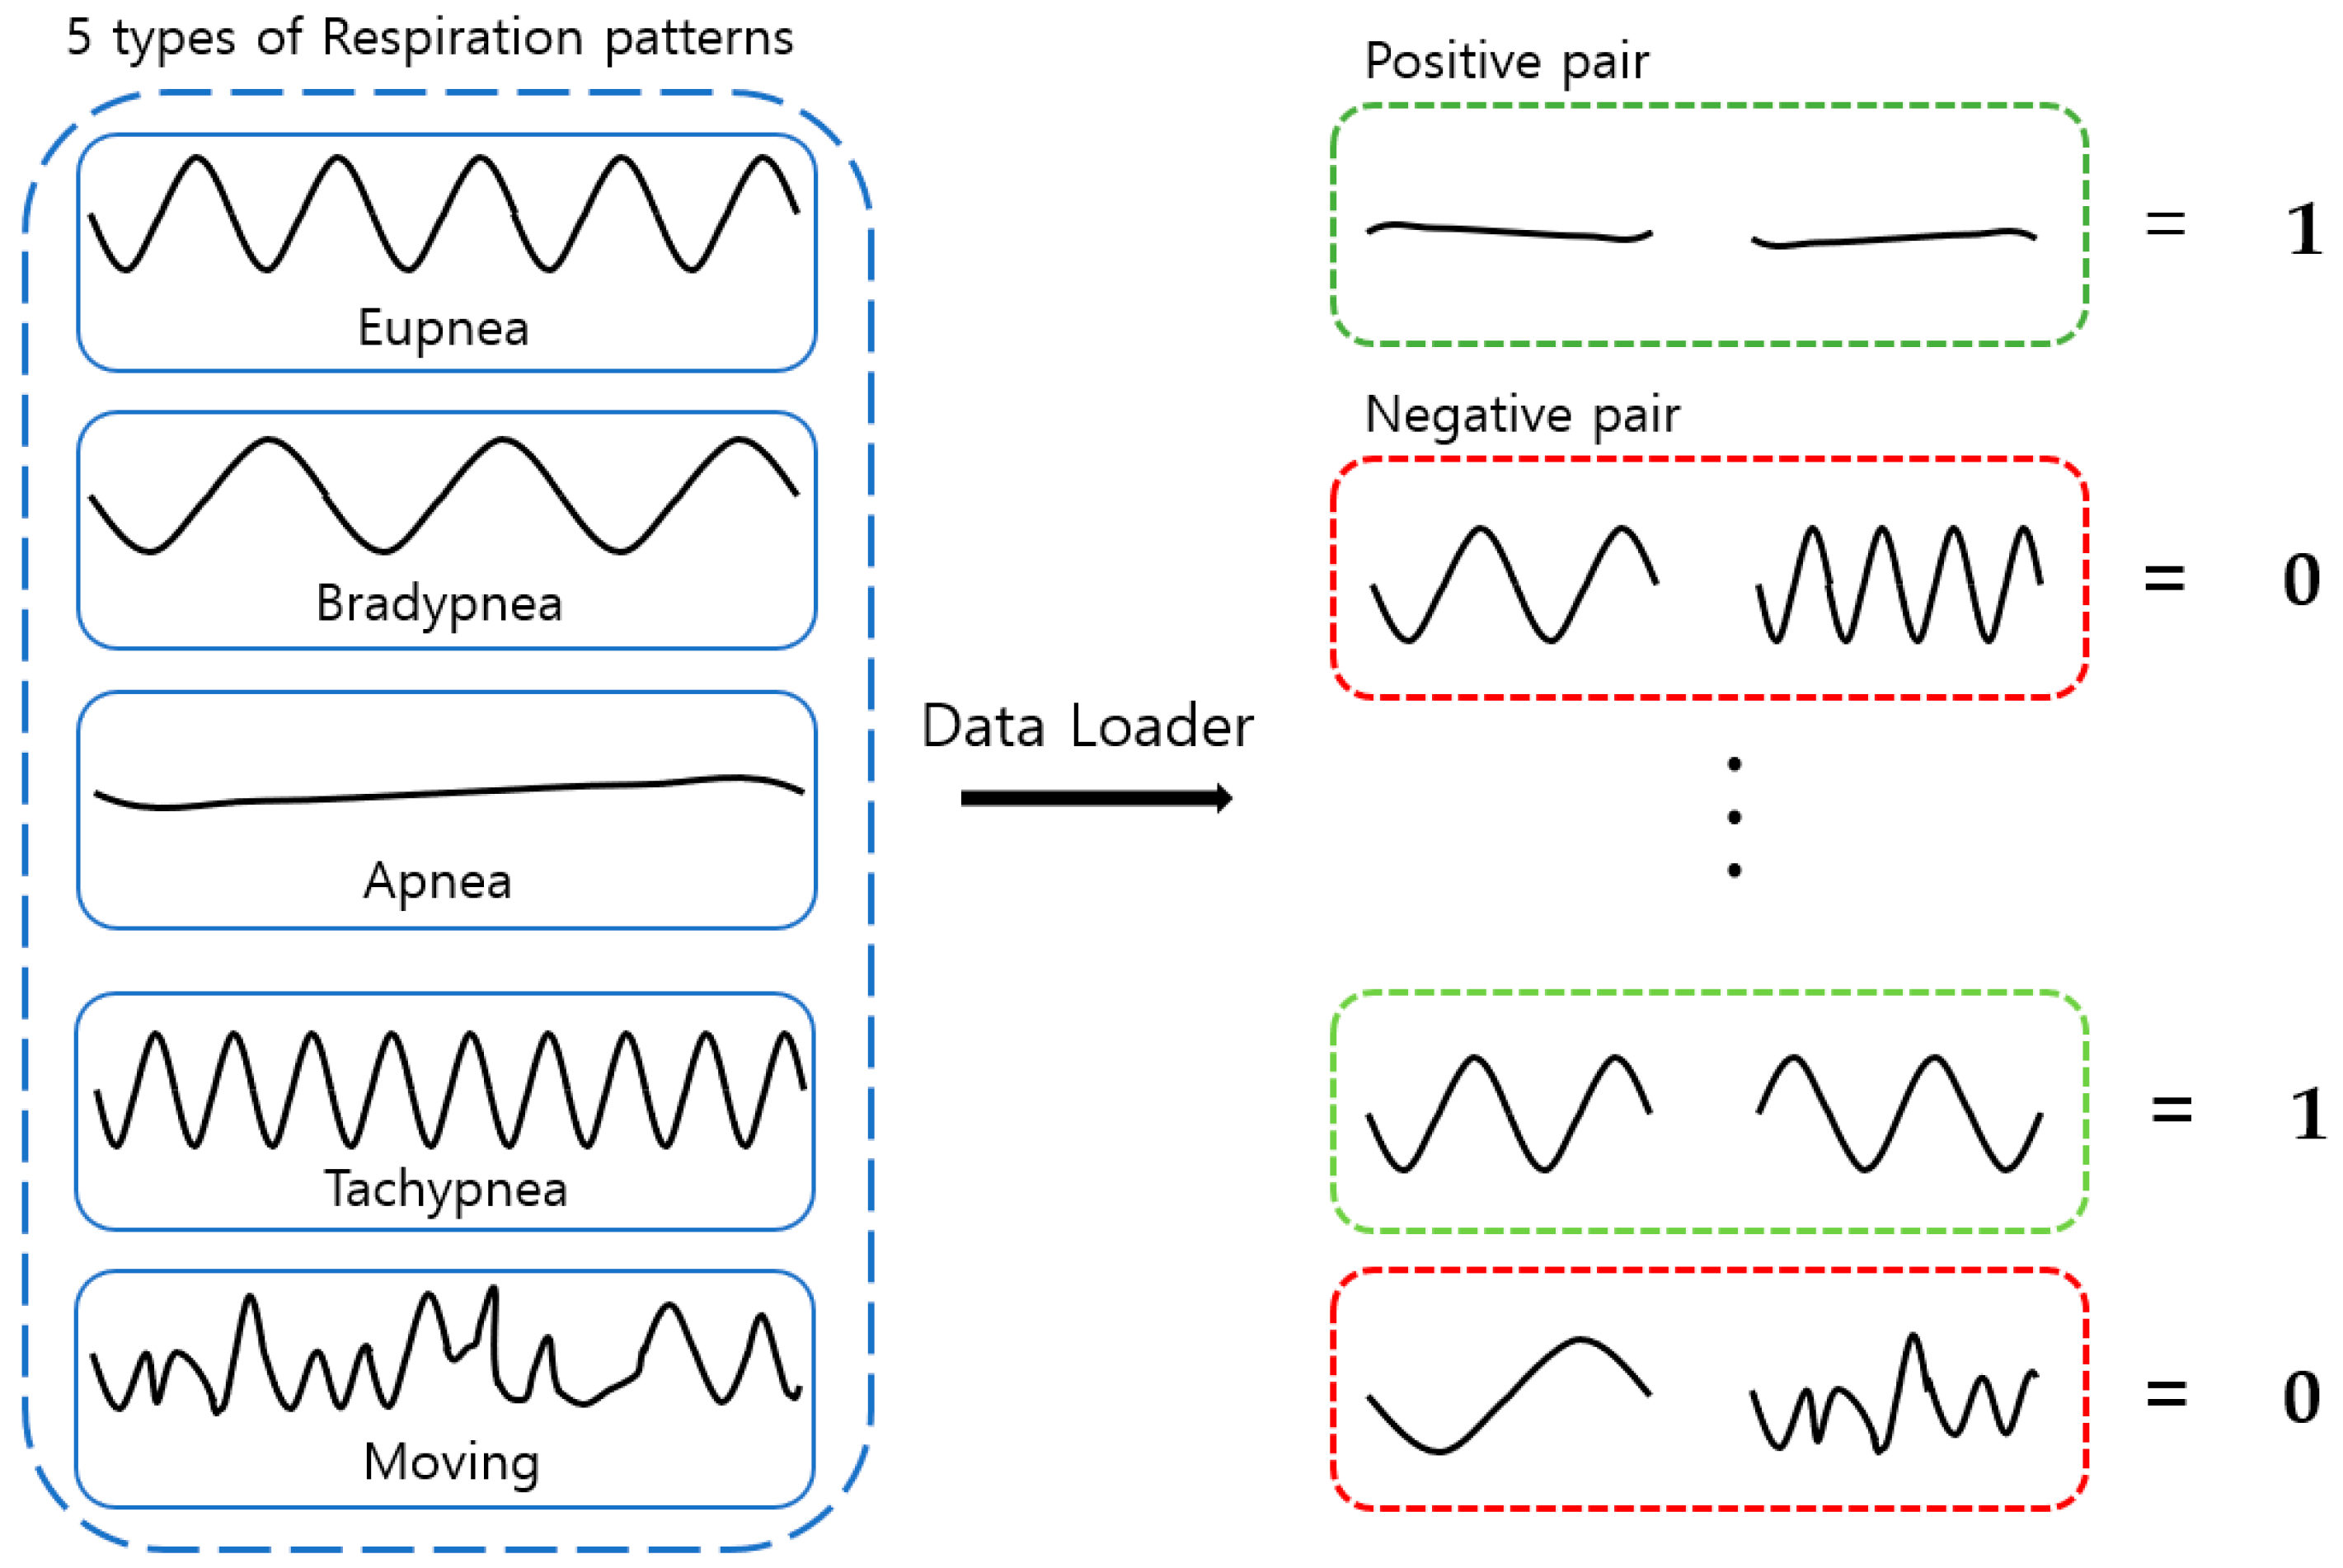
Types of respiration measured by the mmWave sensor: (a) eupnea, (b) bradypnea, (c) tachypnea, (d) apnea, (e) movement.
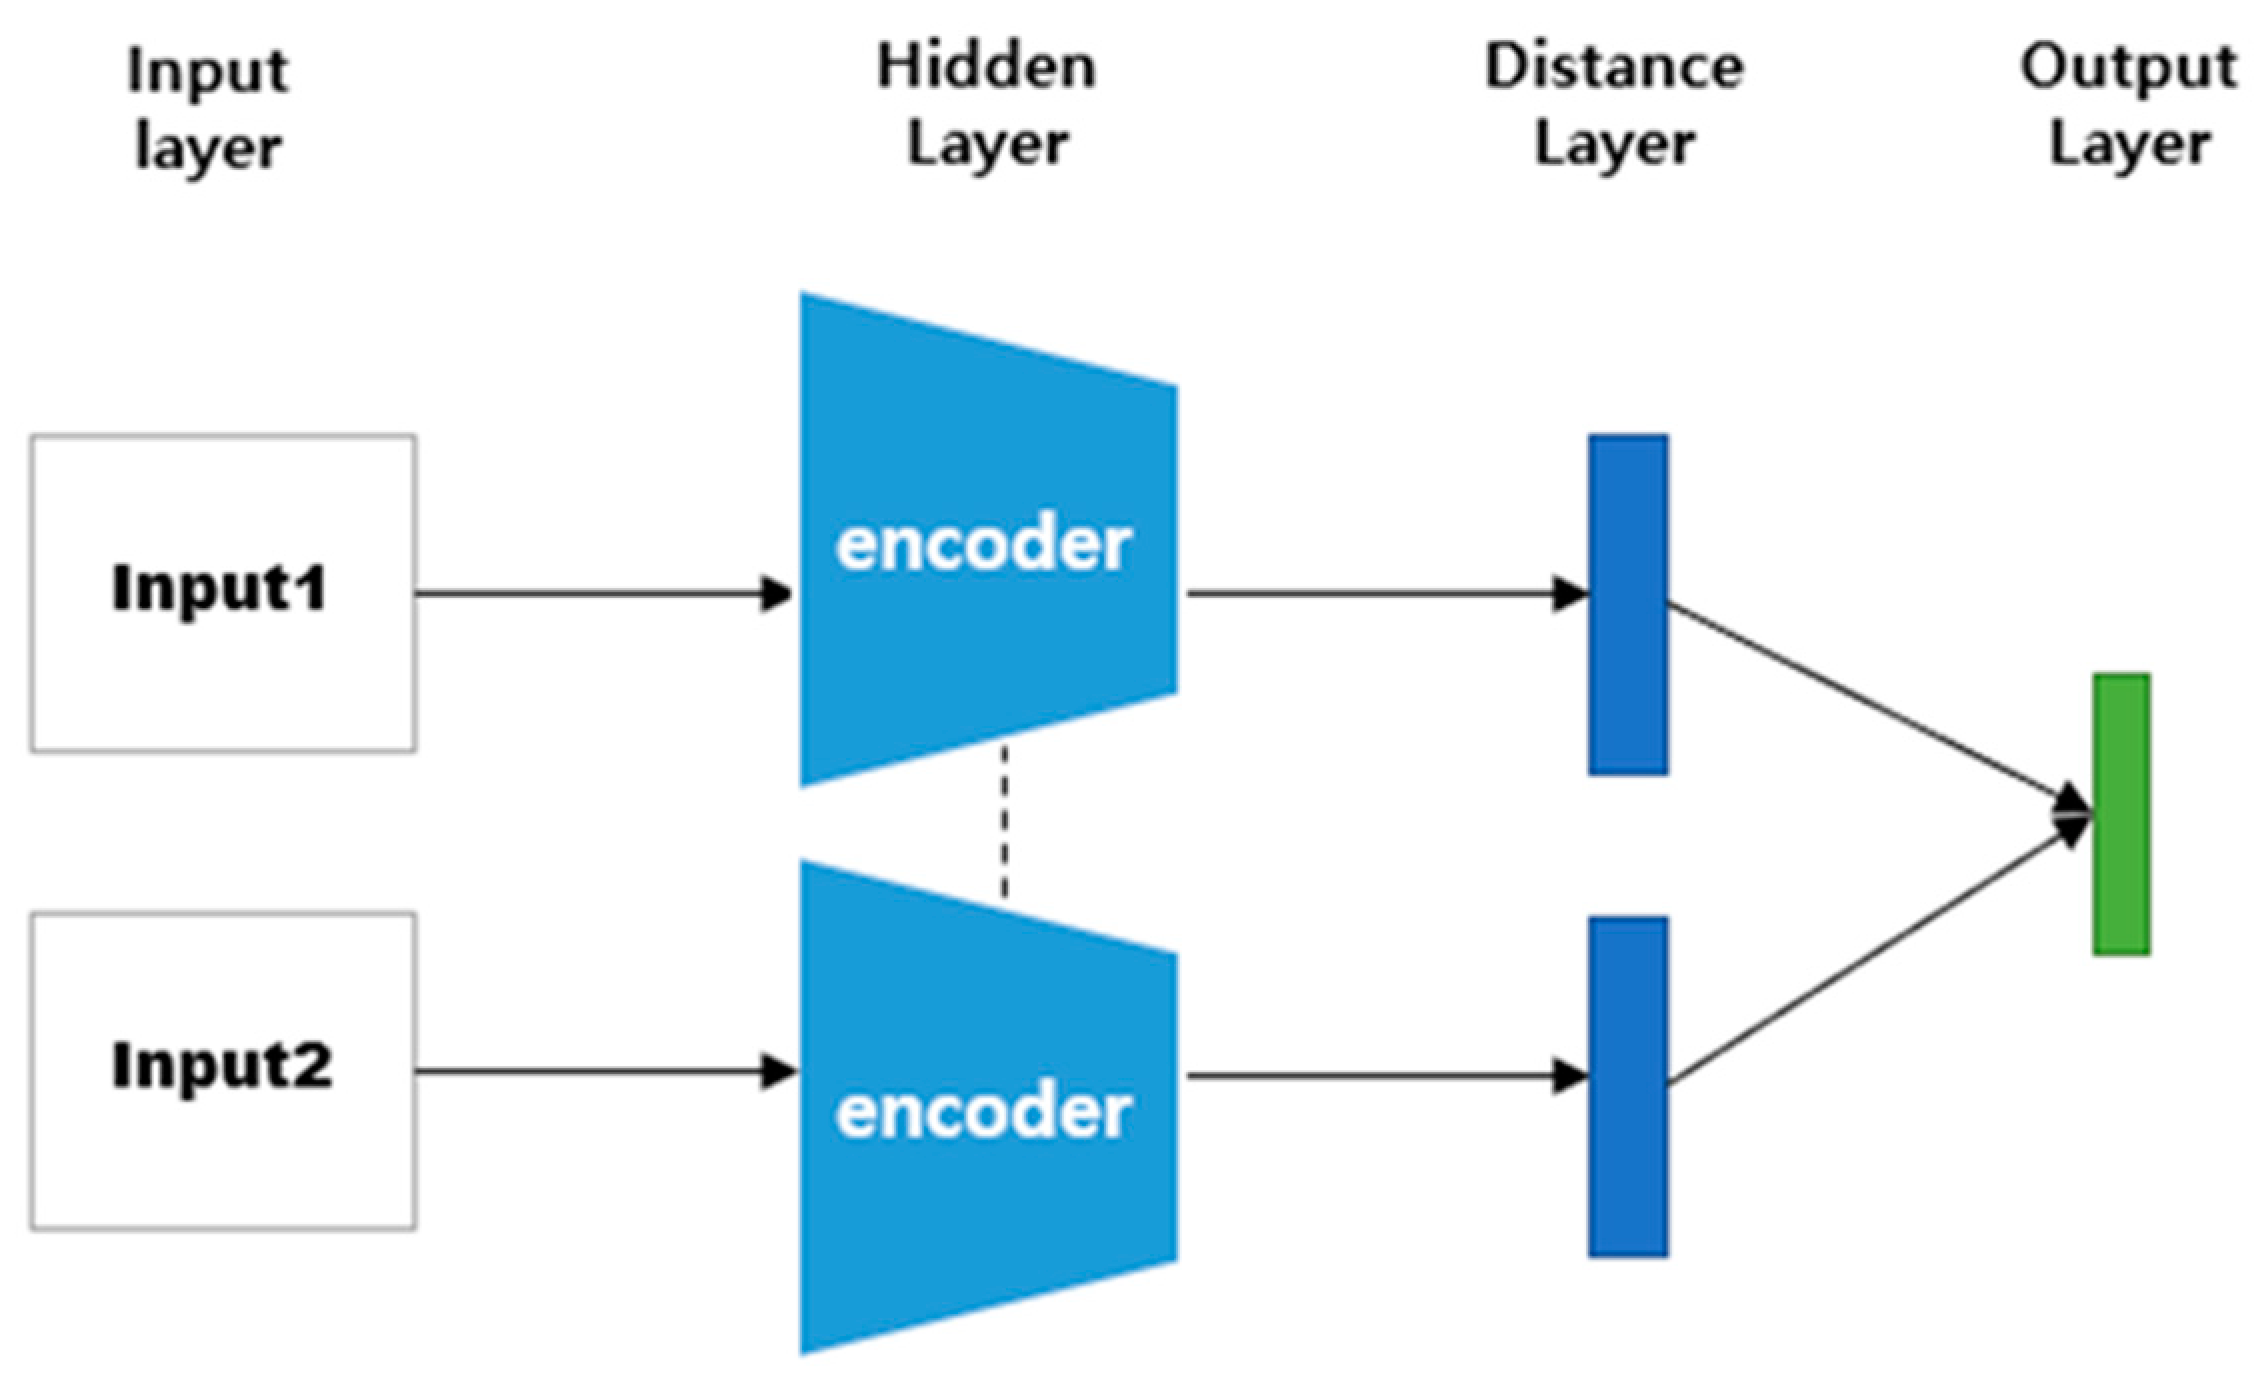
Sensors 23 05275 g002
Figure 3. SNN architecture.
Sensors 23 05275 g003
Figure 4. Model structure based on distance metrics.
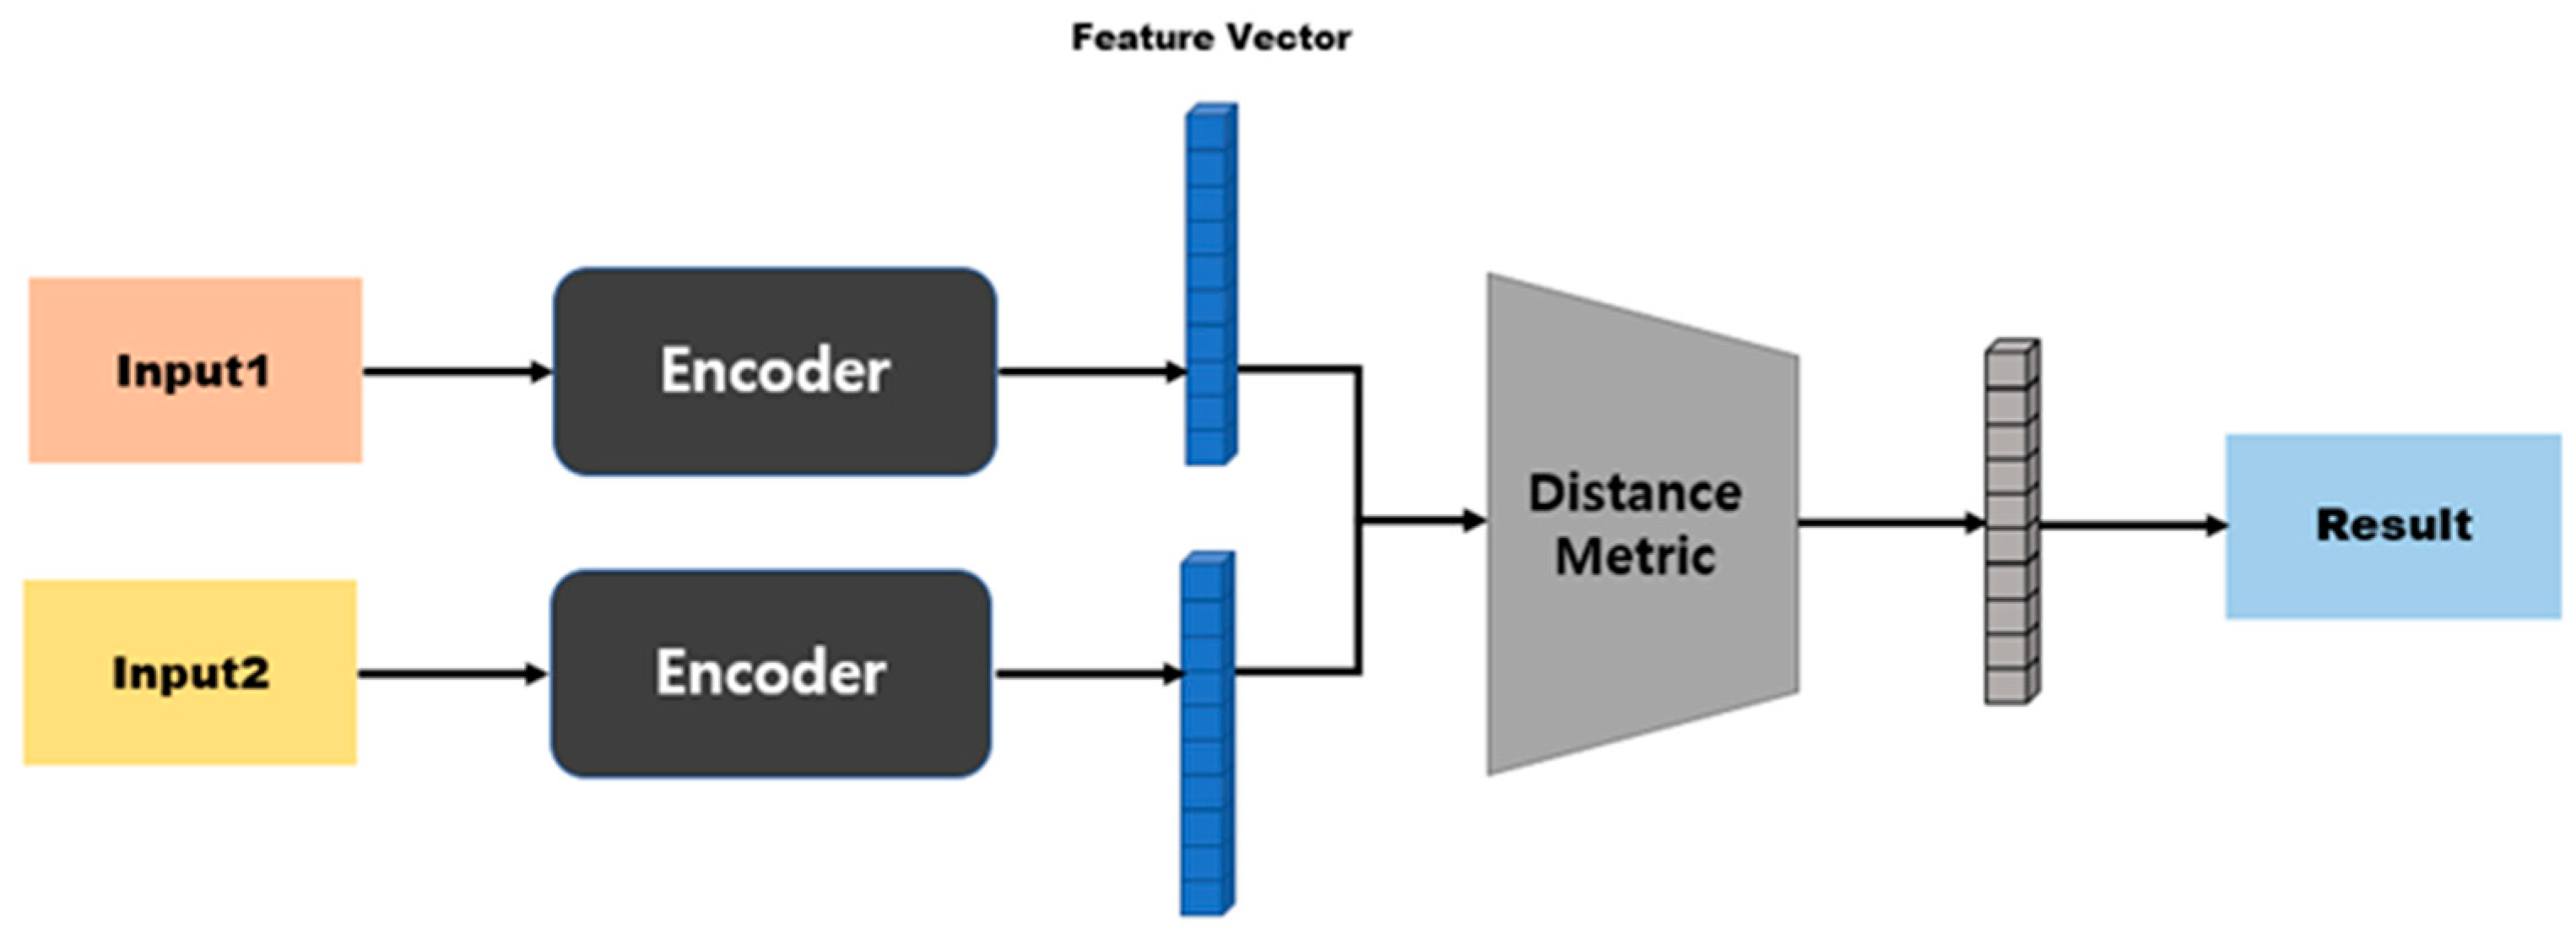
Sensors 23 05275 g004
Figure 5. Model structure based on similarity metrics.
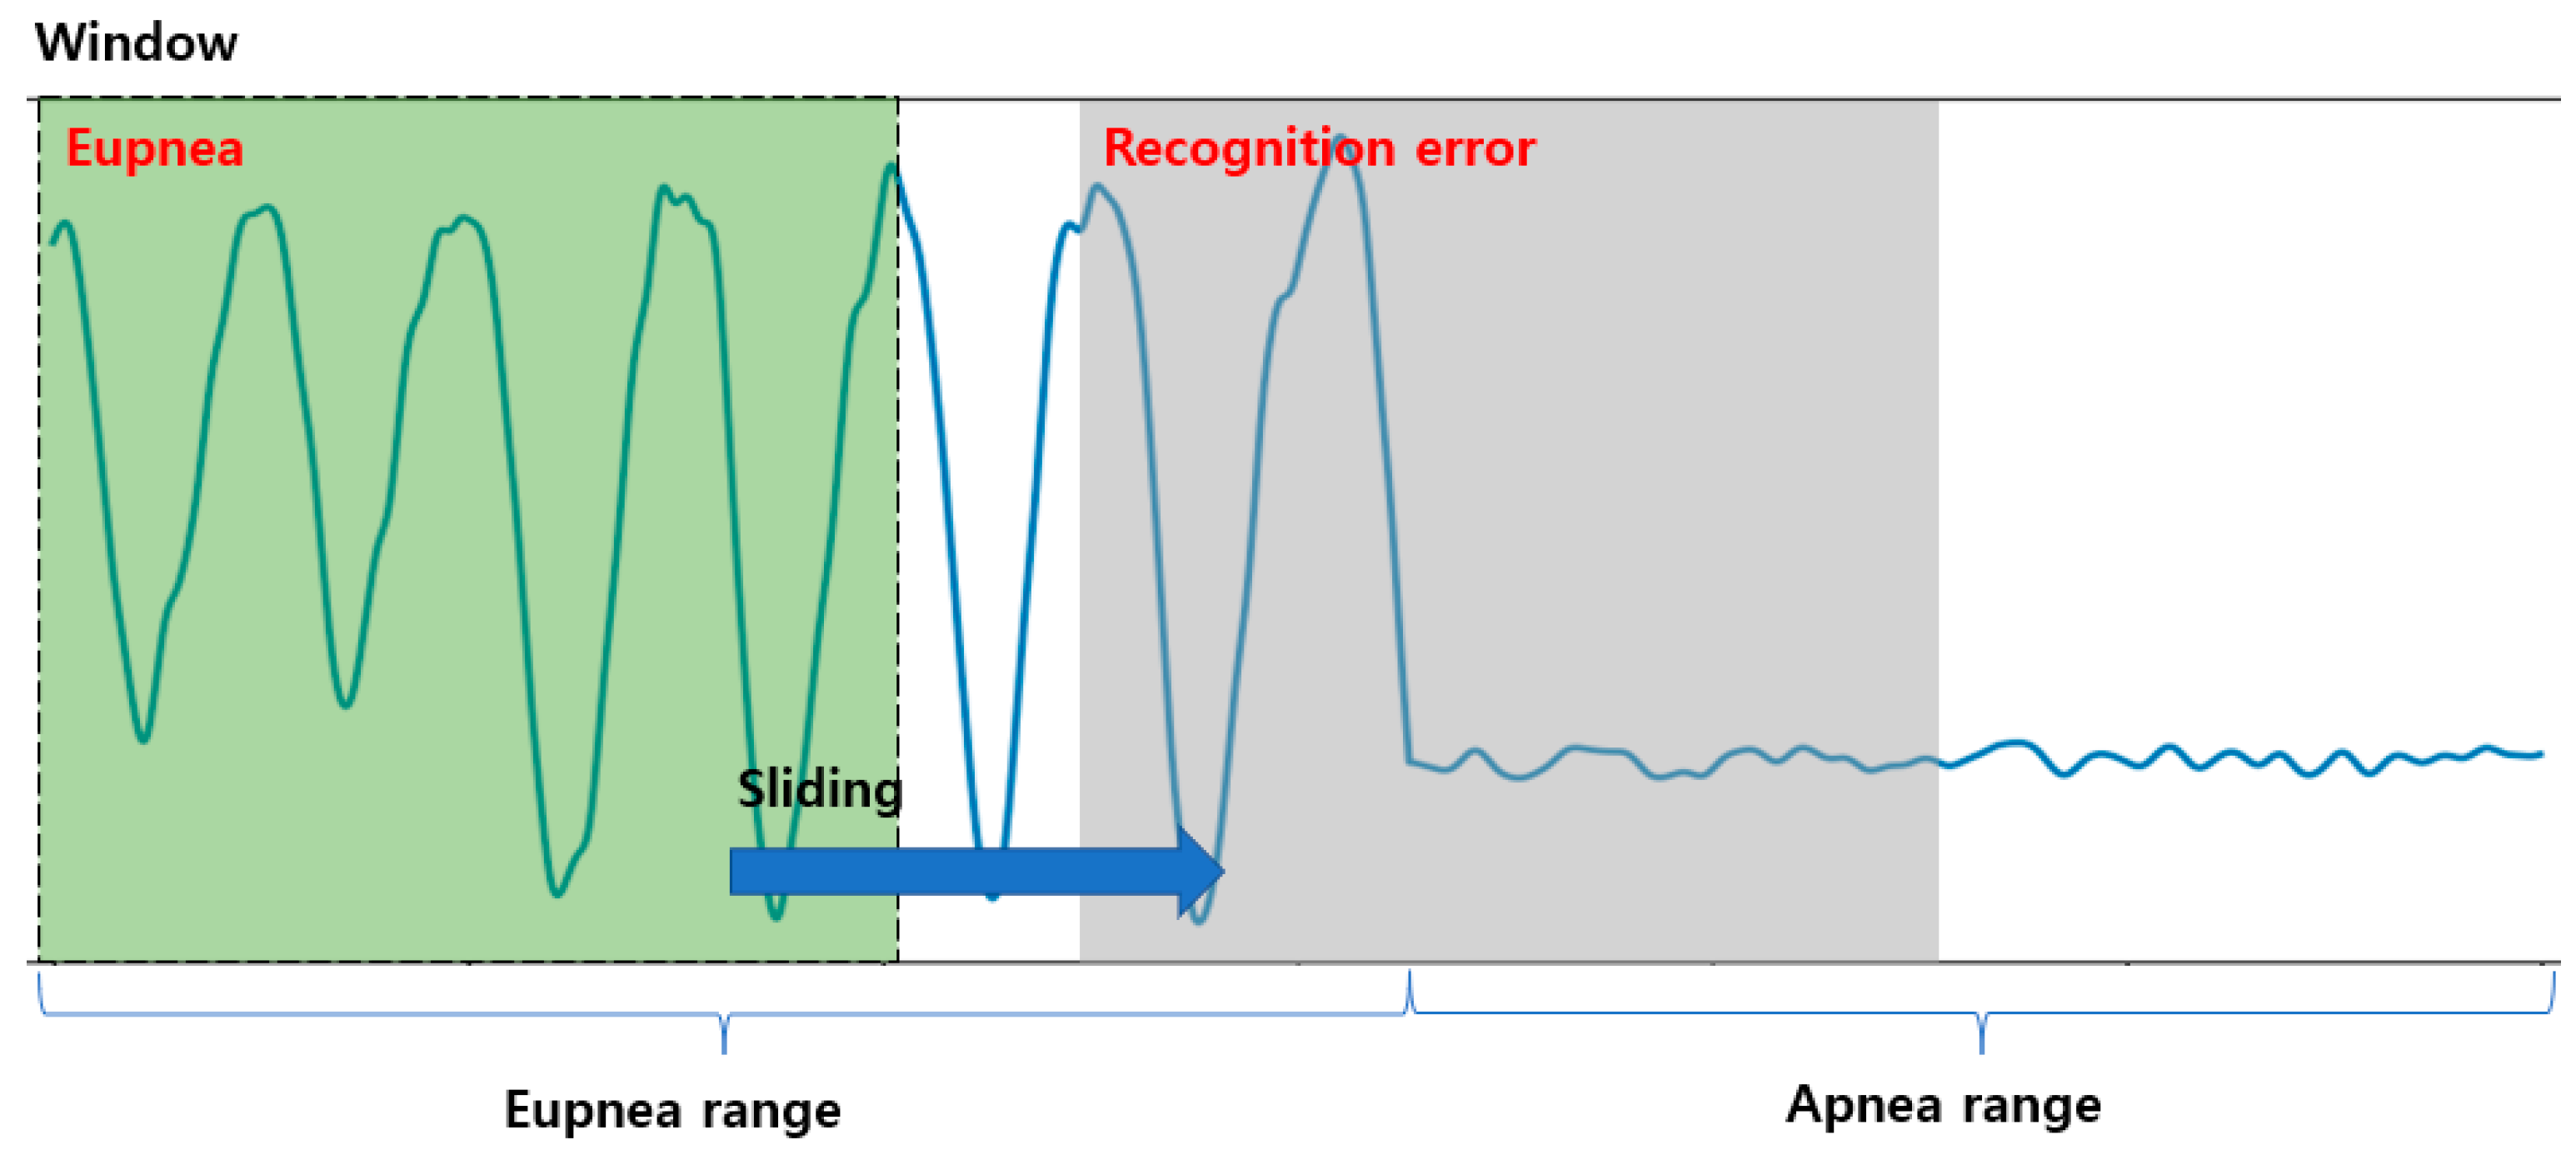
Sensors 23 05275 g005
Figure 6. Example of detection of a region with multiple respiration patterns using a 1D CNN and the sliding window method.
Sensors 23 05275 g006
Figure 7. Proposed 1D SNN training model for respiration pattern retrieval.
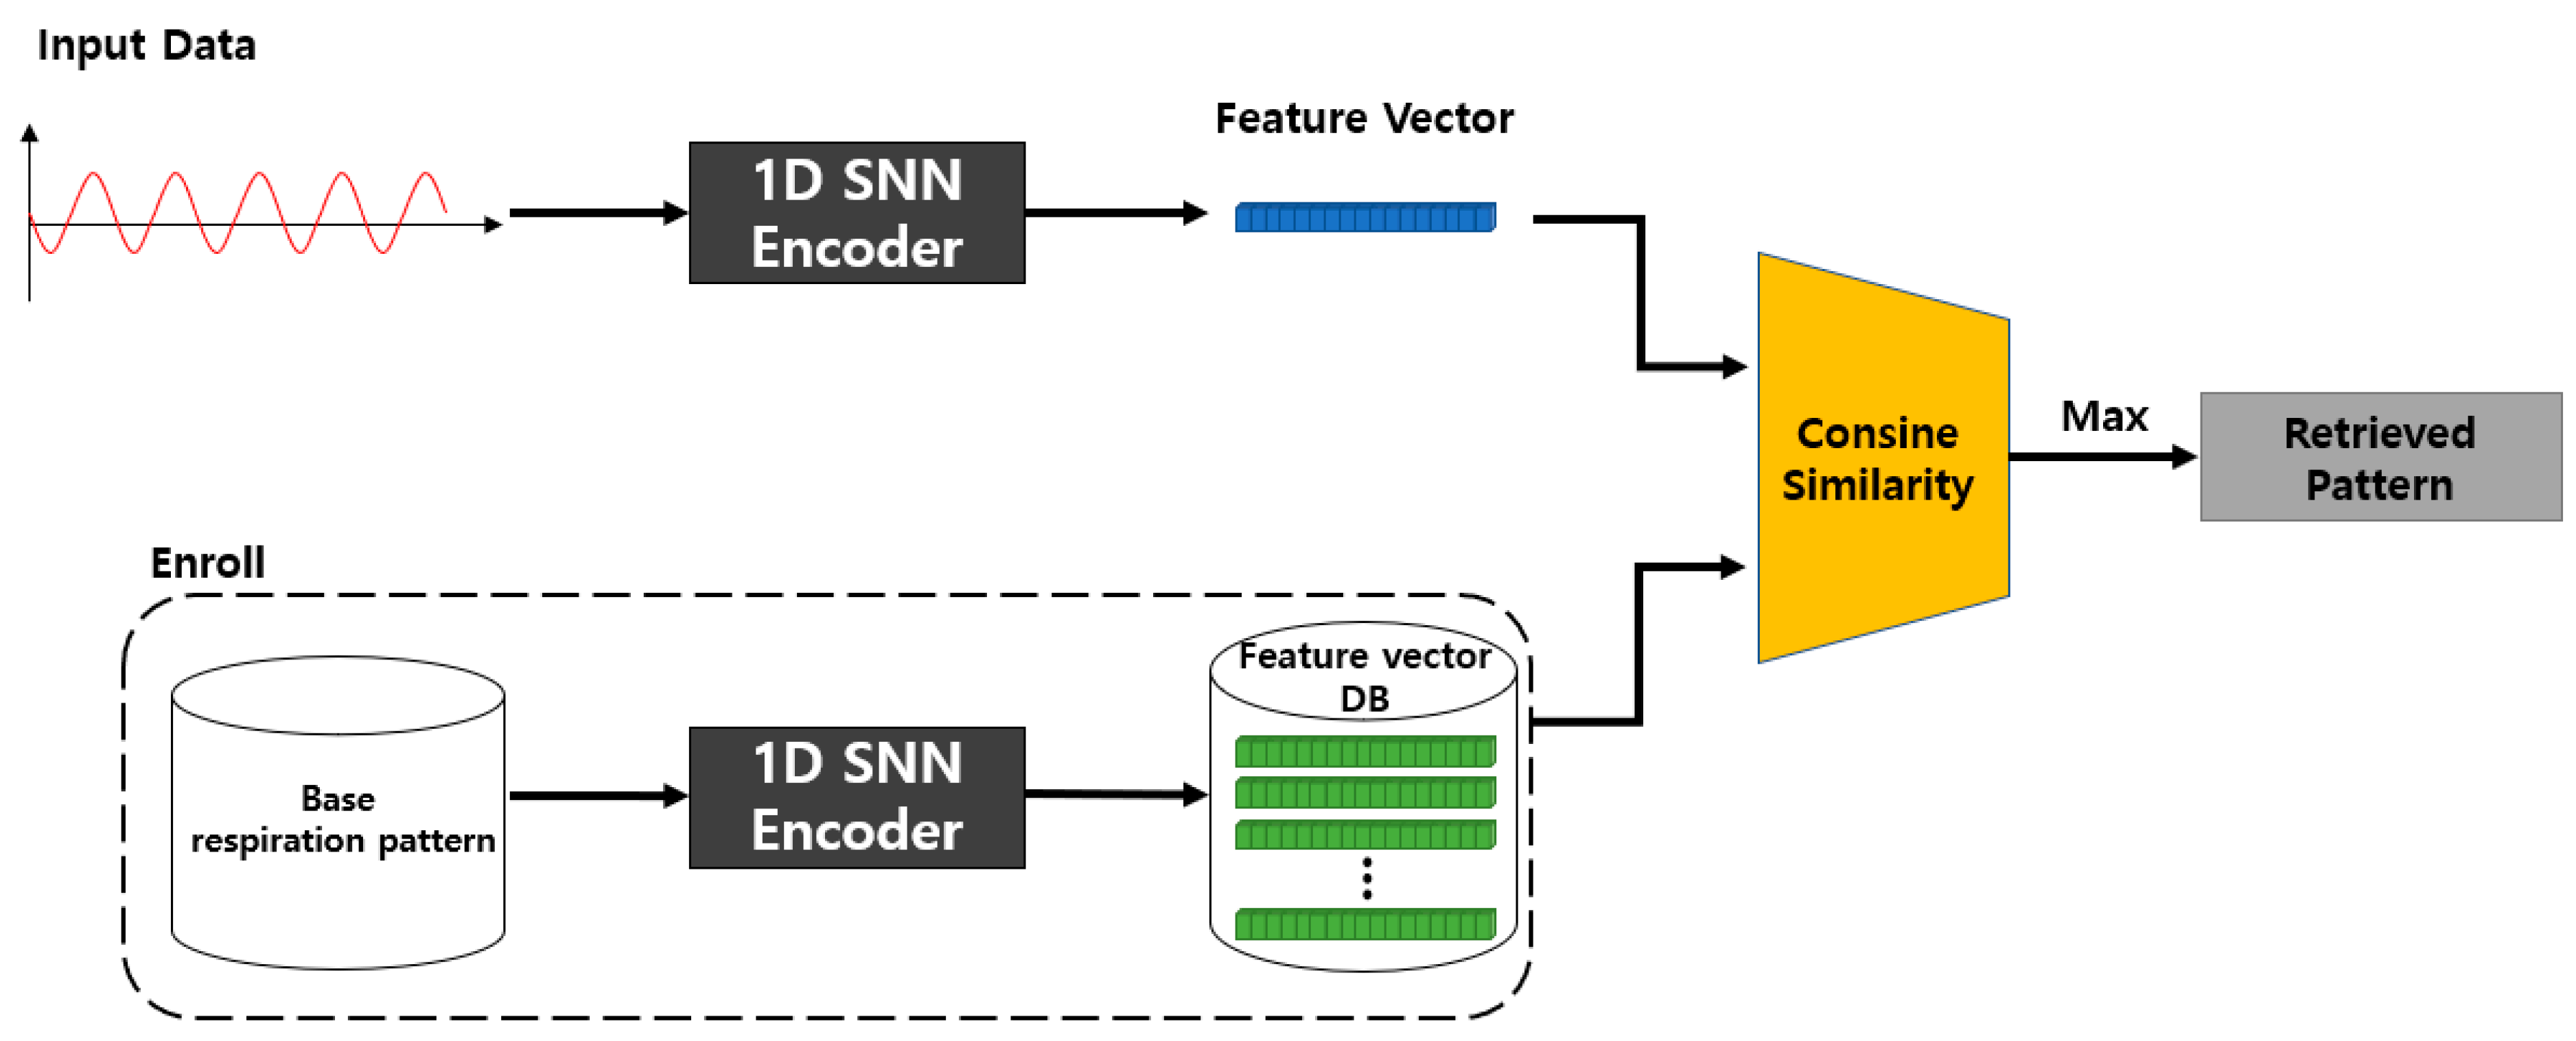
Sensors 23 05275 g007
Figure 8. Proposed 1D SNN inference model.
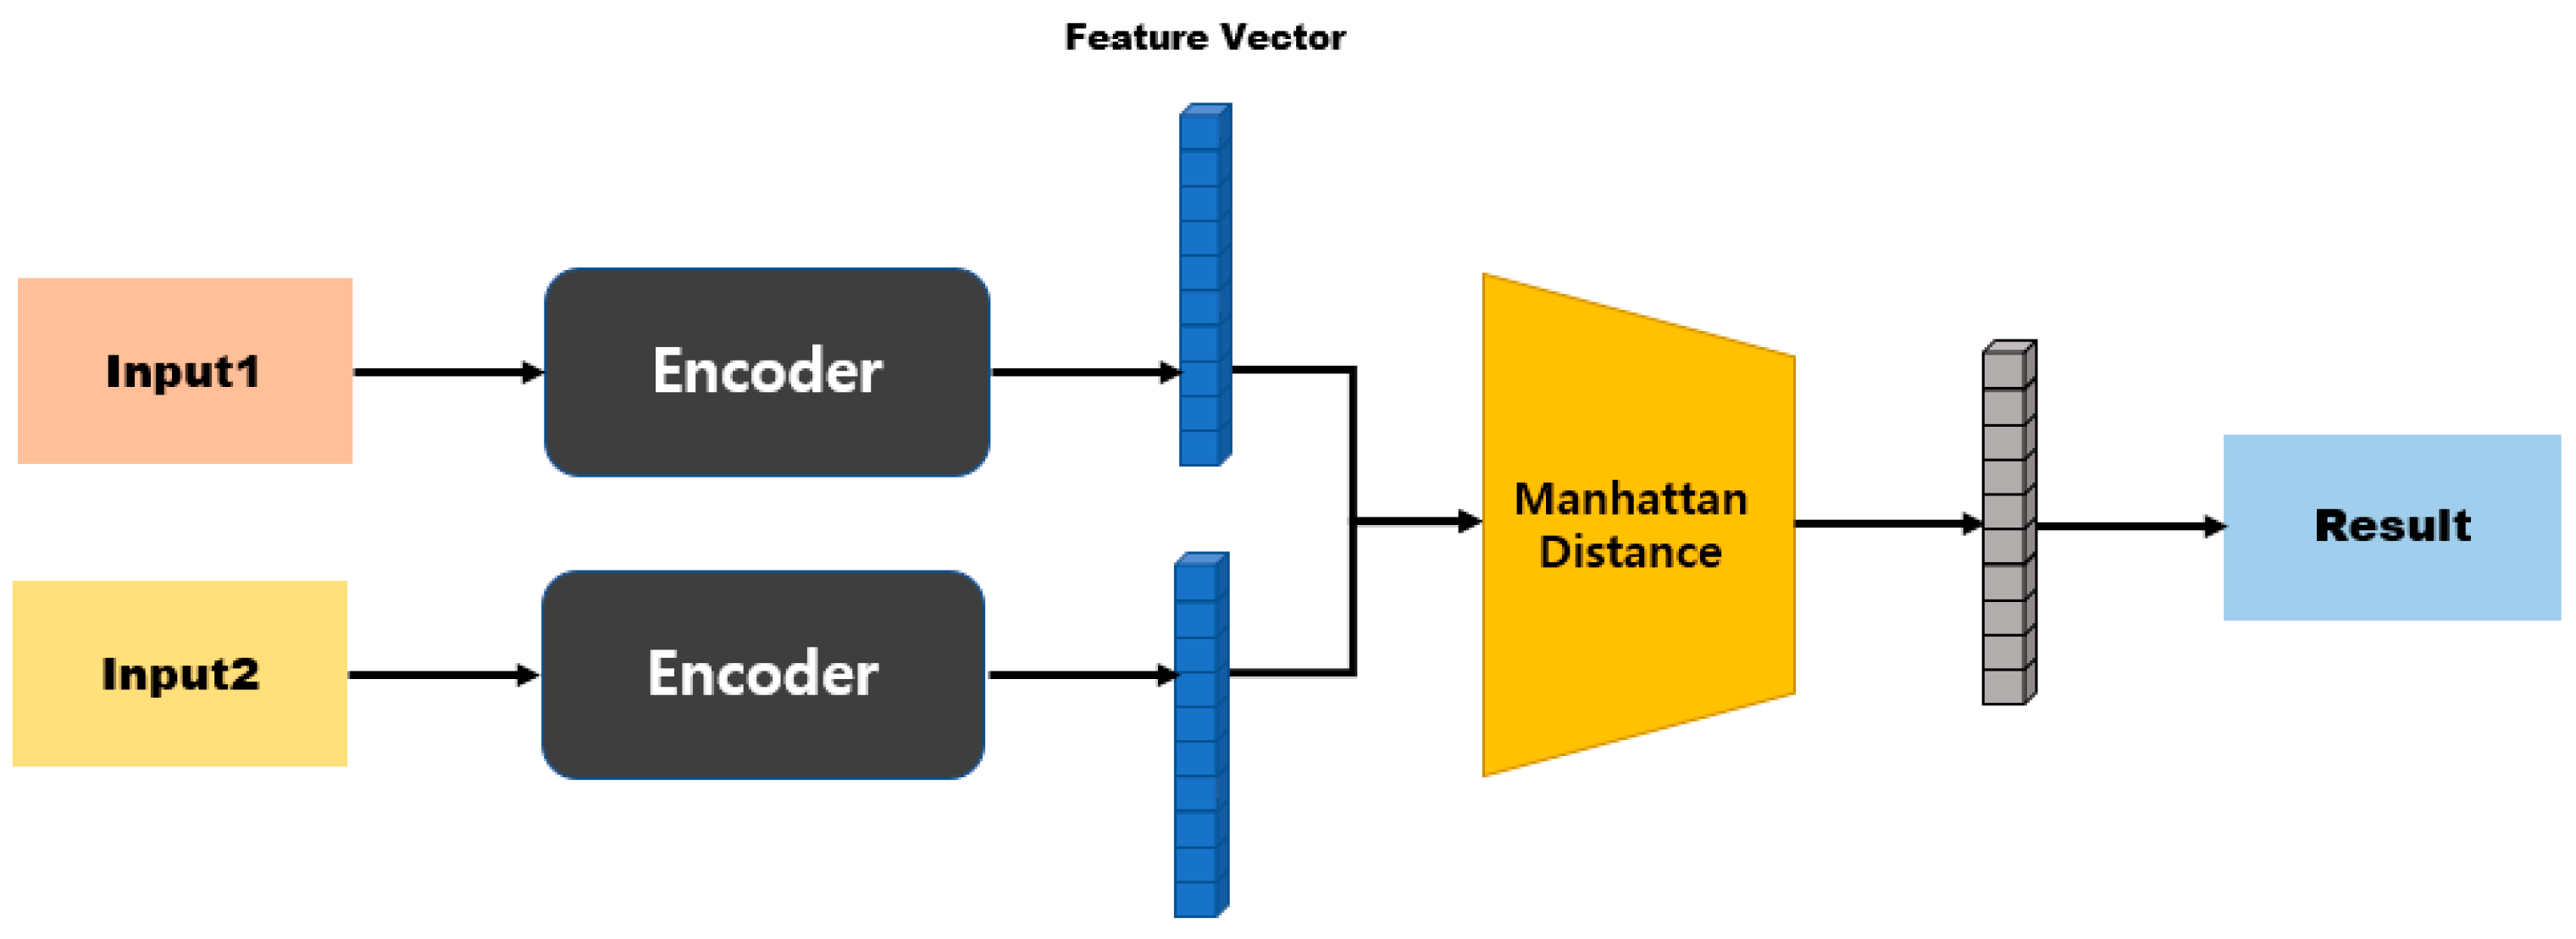
Sensors 23 05275 g008
Figure 9. Manhattan-distance-based model structure.
Sensors 23 05275 g009
Figure 10. Cosine-similarity-based model structure.
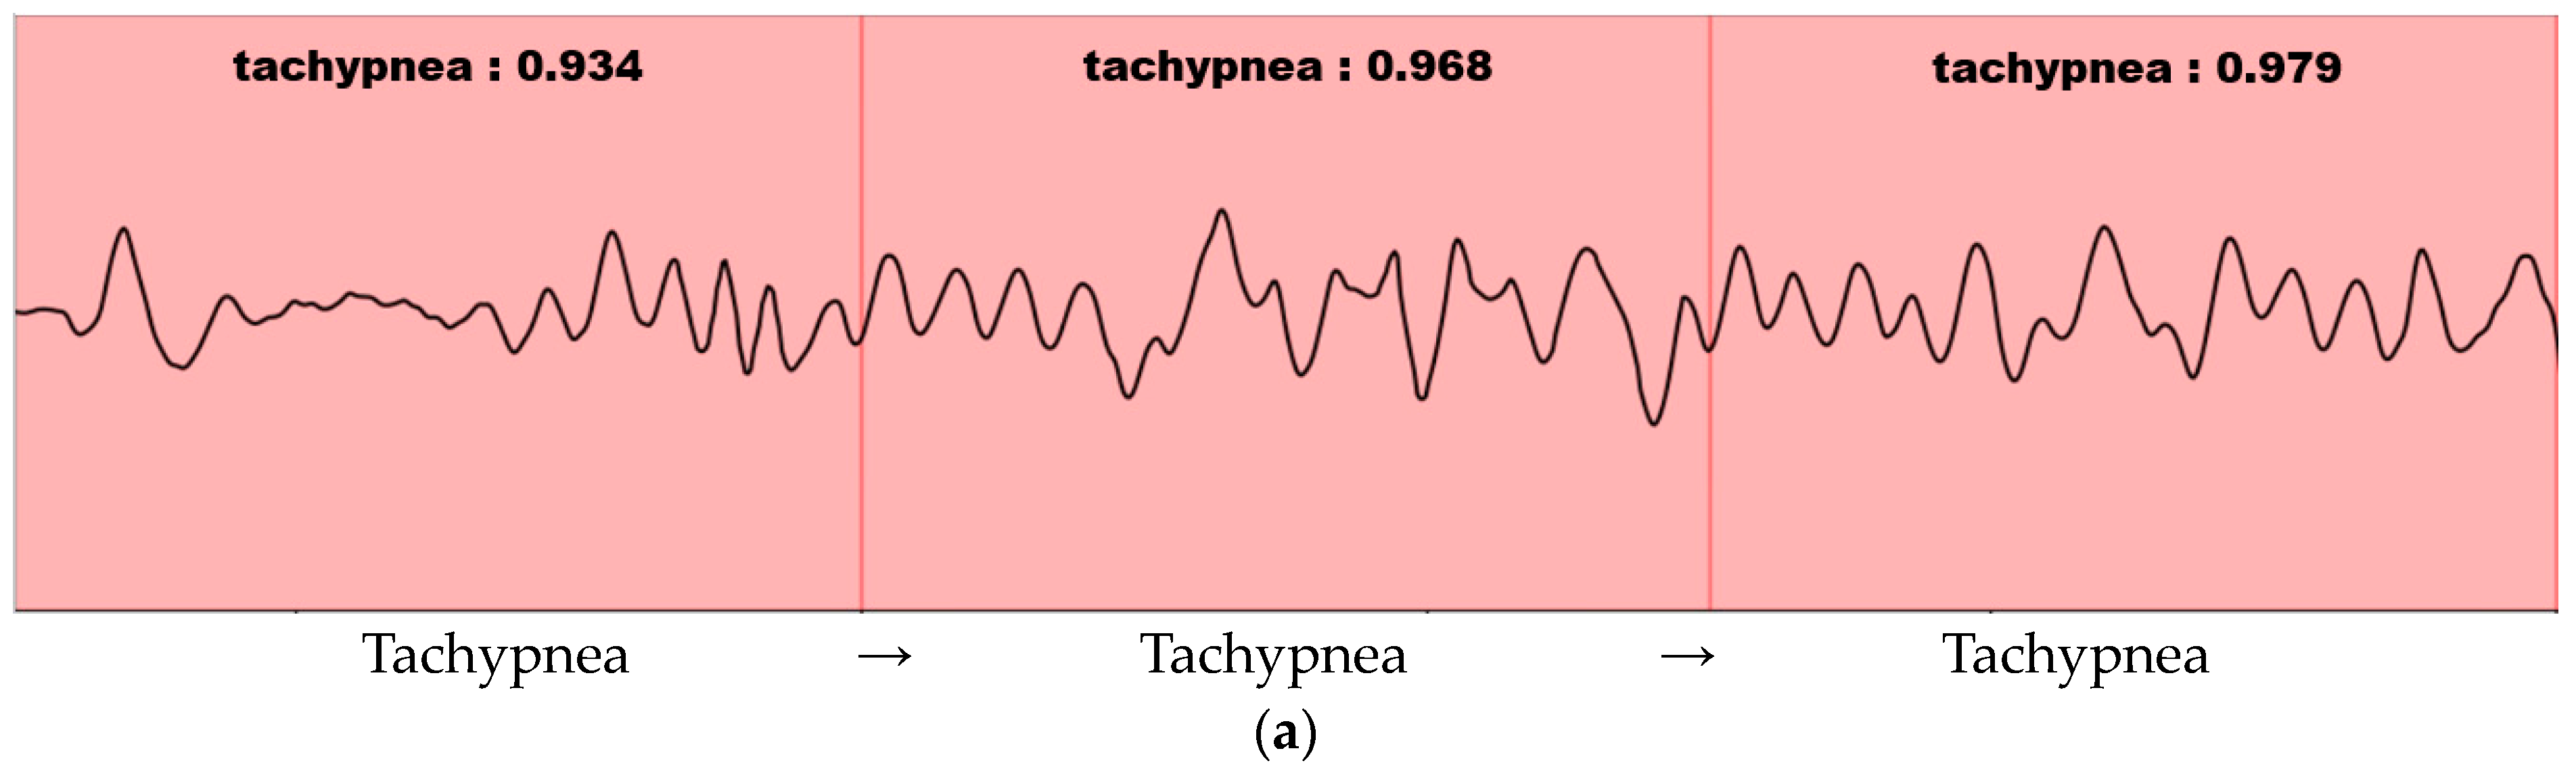
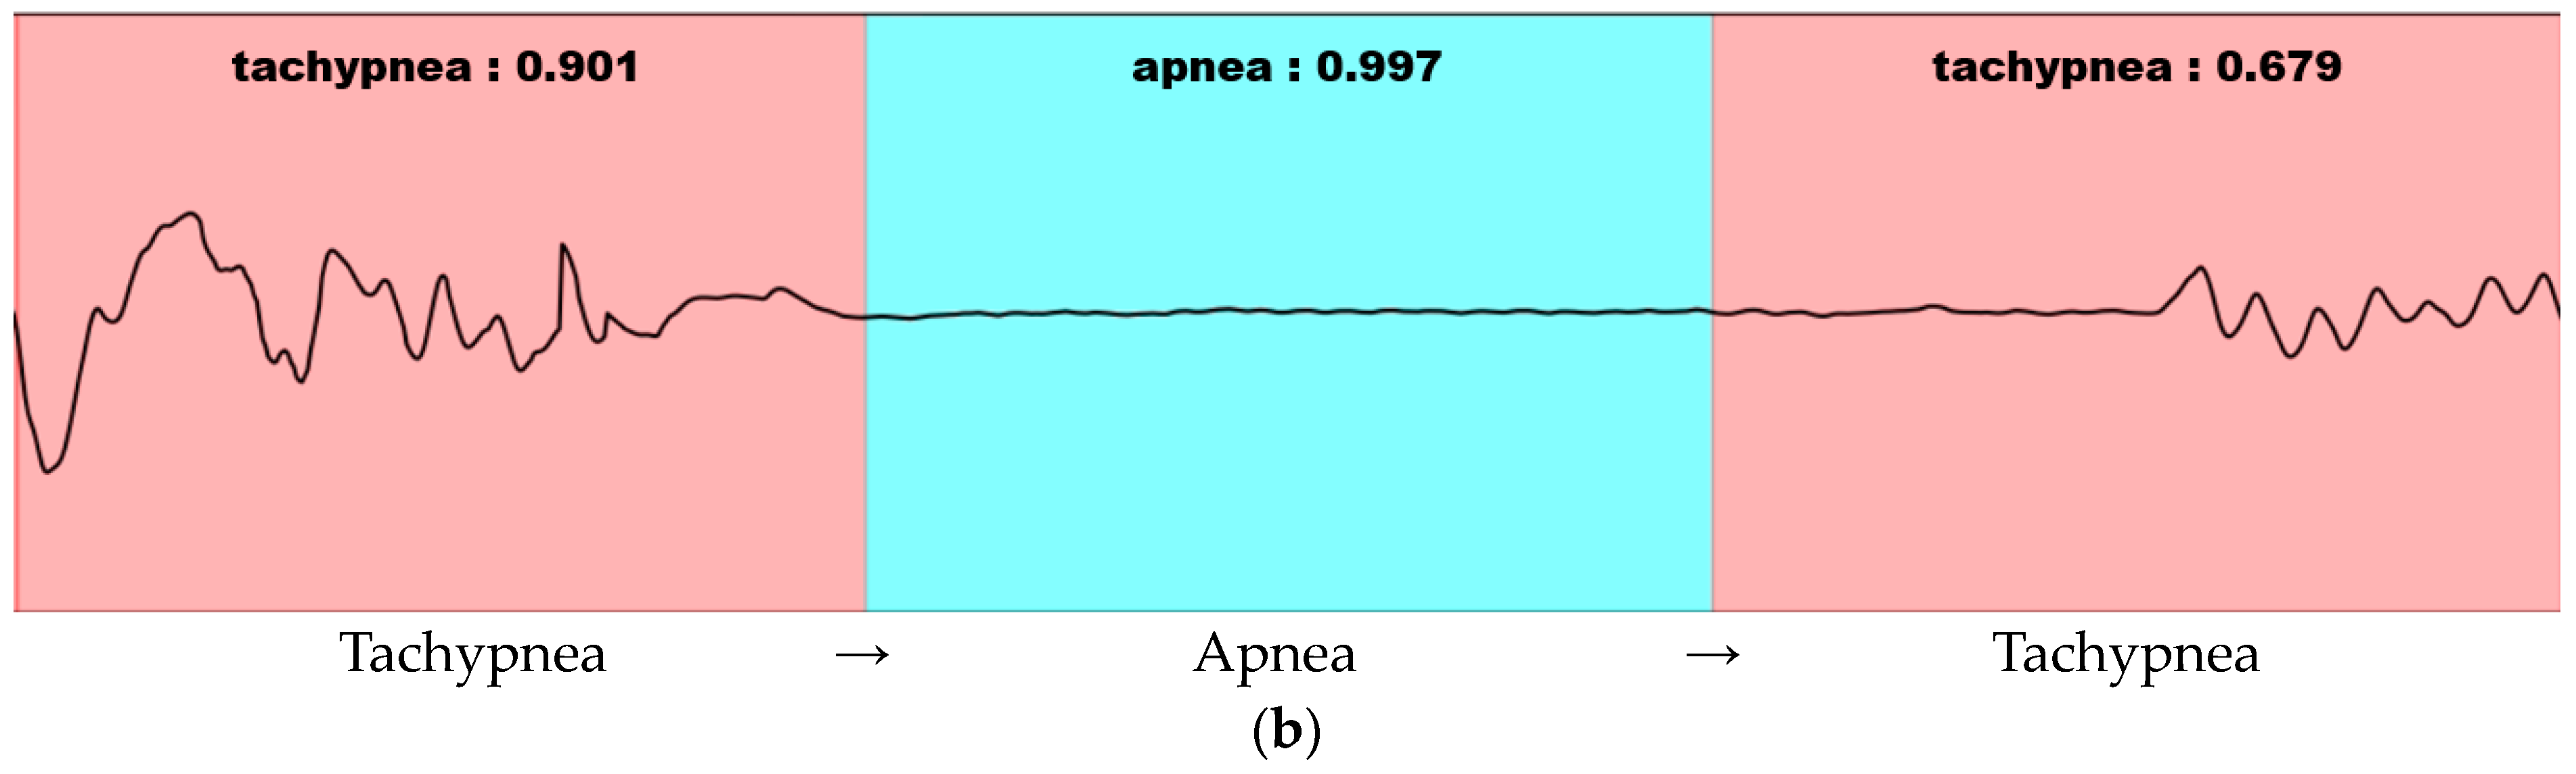
Sensors 23 05275 g010
Figure 11. Visualization of 1D-SNN-based respiration pattern recognition results in a continuous breathing range: (a) Detection result in the range where the respiration pattern does not change. (b) Detection result in the range where the respiration pattern changes. Pink indicates tachypnea and blue indicates apnea.
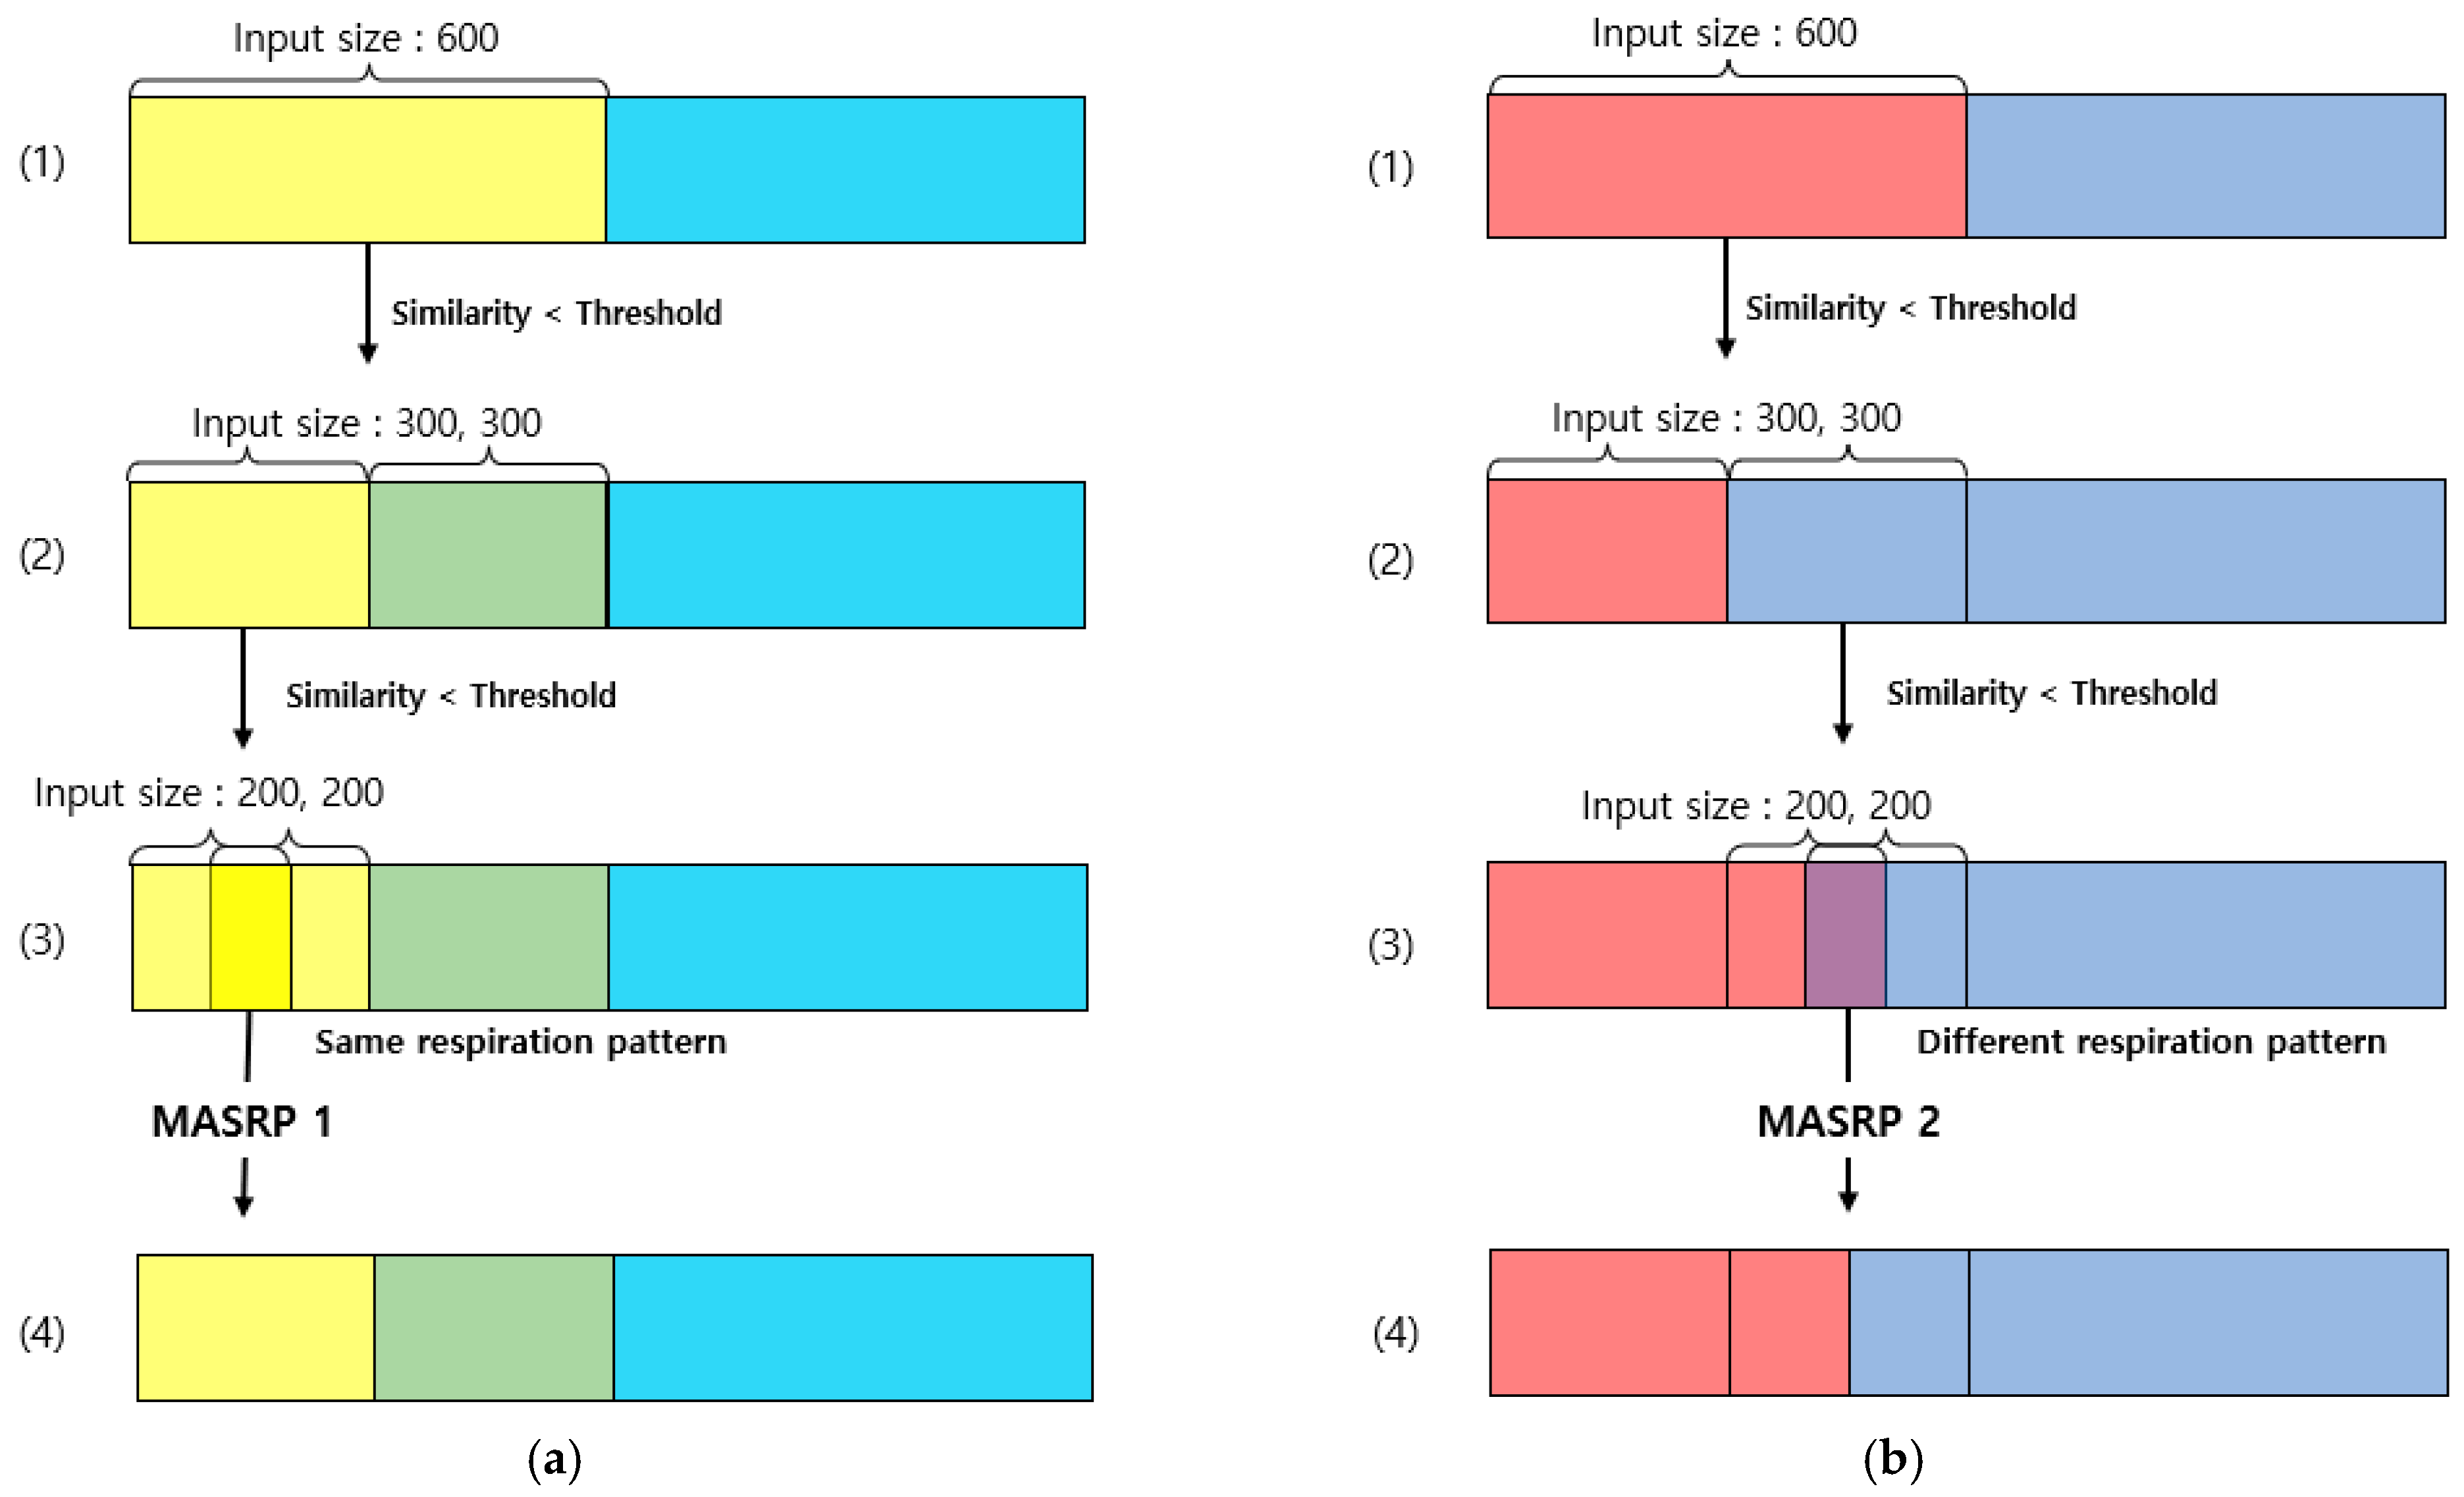
Sensors 23 05275 g011aSensors 23 05275 g011b
Figure 12. Examples of merging and splitting performed on the respiration pattern recognition results of the 1D SNN: (a) Process of applying MASRP 1. (b) Process of applying MASRP 2. Each color is a respiration pattern, and (1)–(4) indicate the stages of merging and splitting.
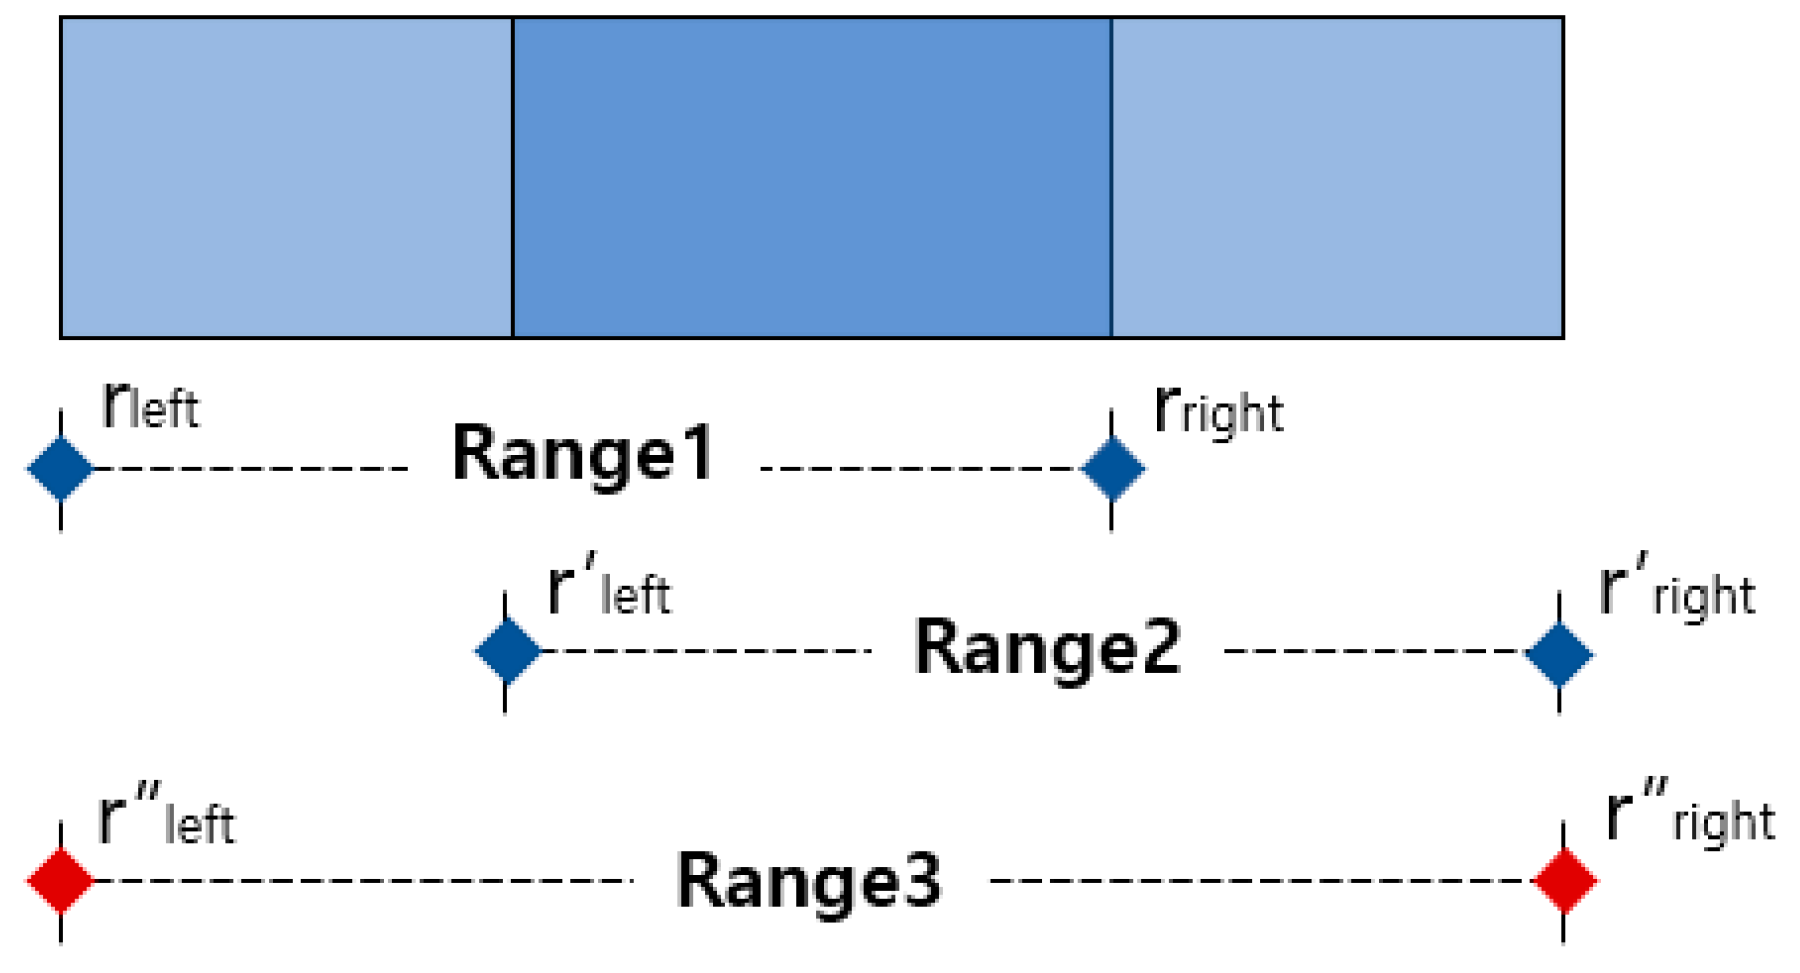
Sensors 23 05275 g012
Figure 13. Example of application of an algorithm that merges overlapping ranges of the same pattern. The red dot indicates the range of merged result.
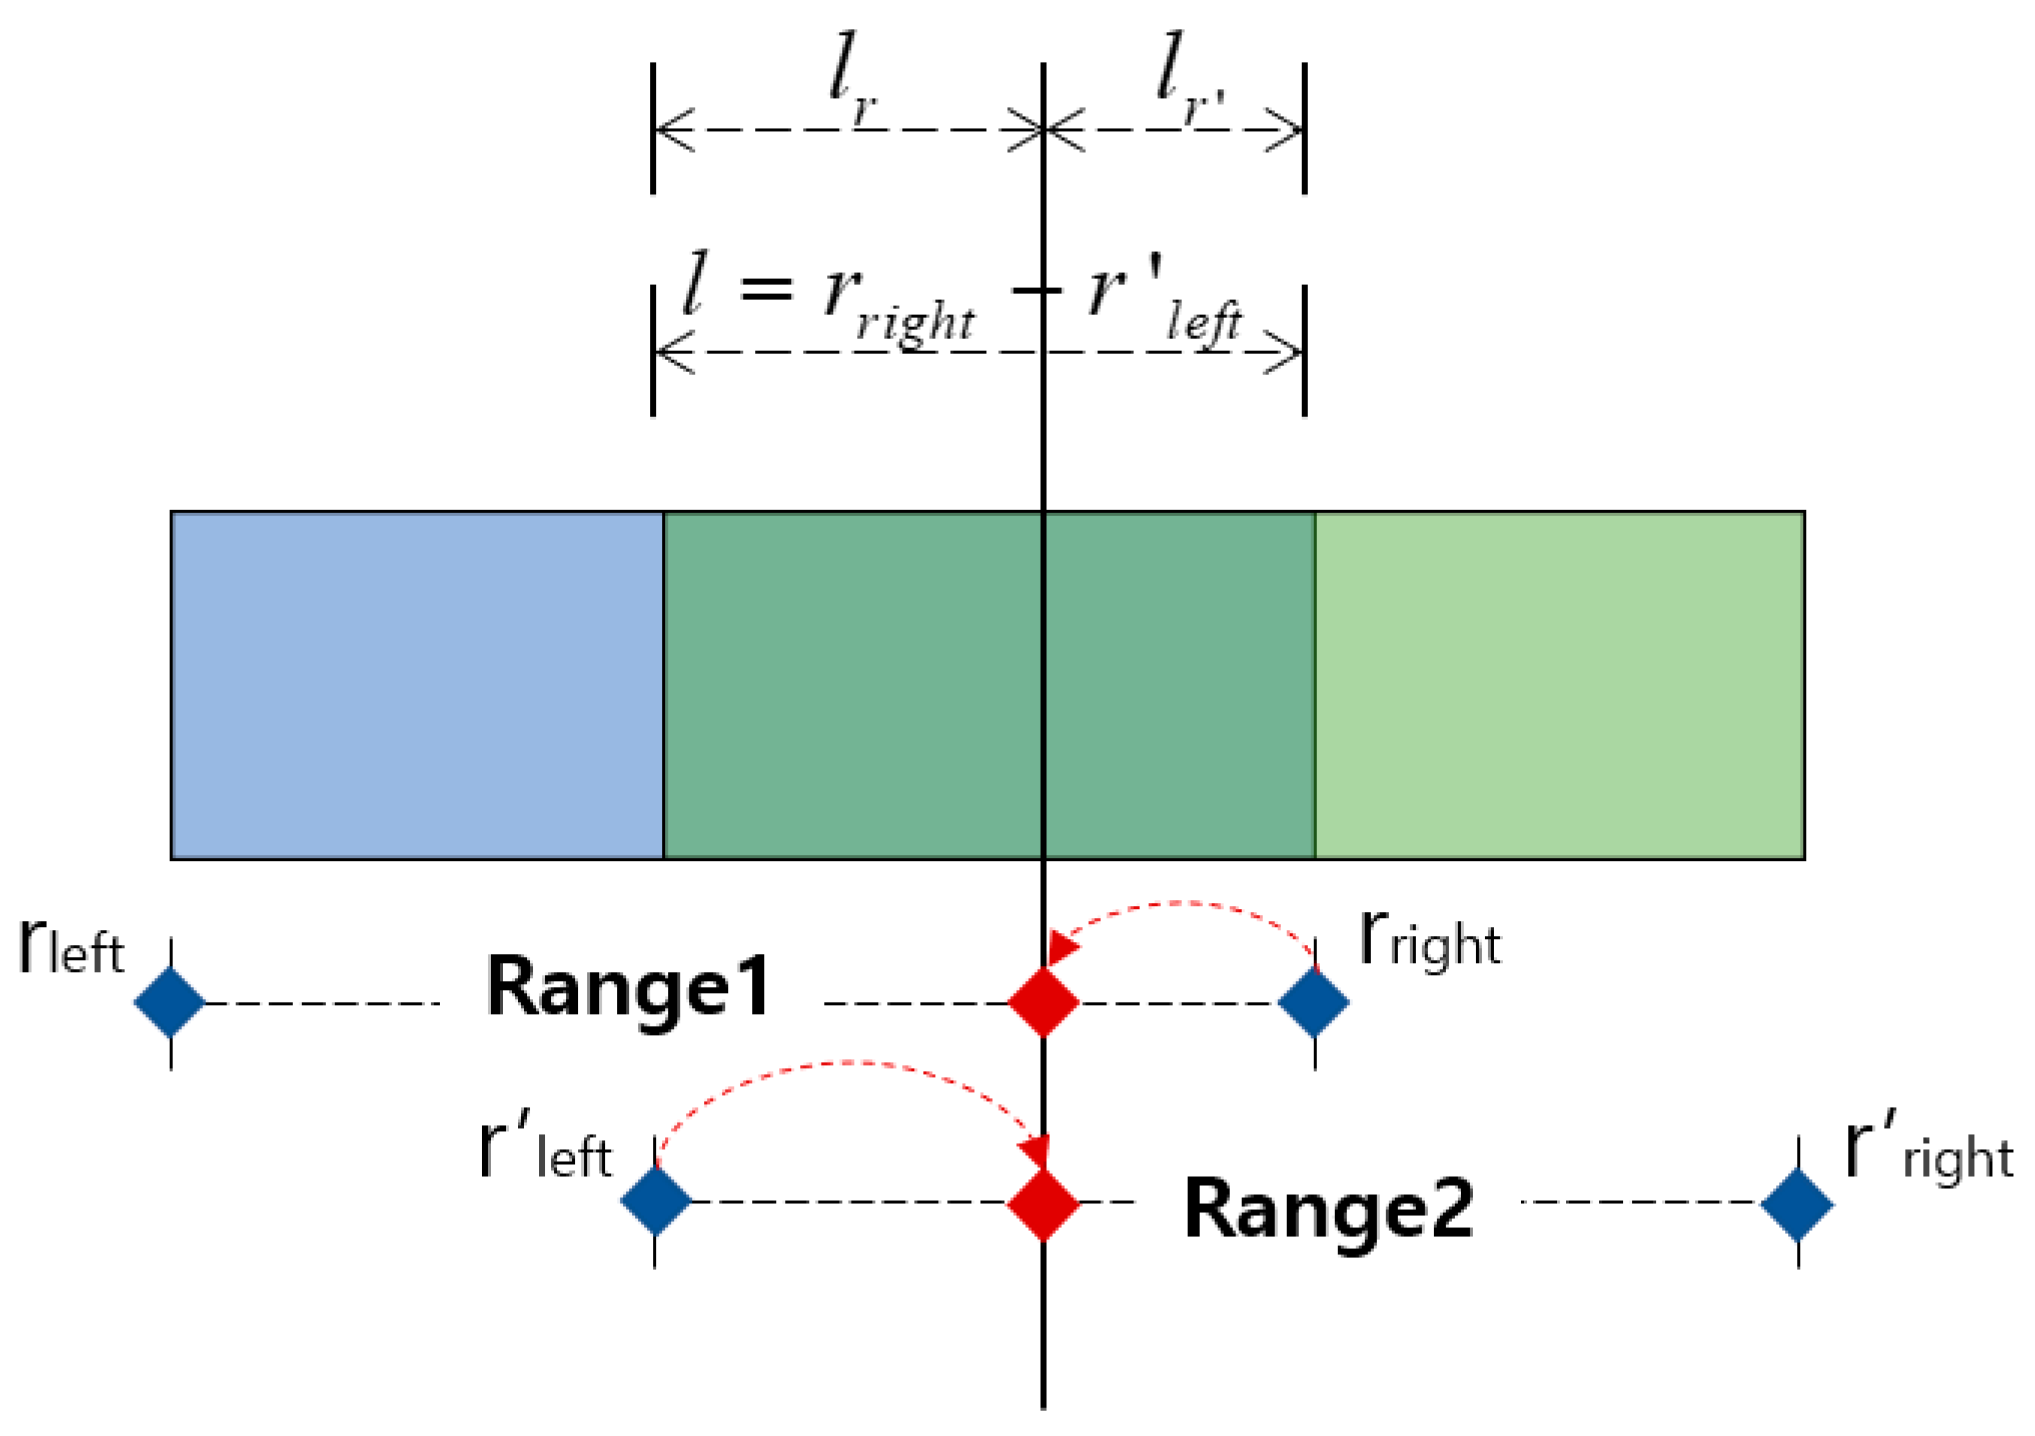
Sensors 23 05275 g013
Figure 14. Example of the splitting algorithm’s performance when two different patterns overlap one another as a result of detection. The red dot indicates the range of split result.
Sensors 23 05275 g014
Figure 15. The mmWave sensor used to collect breathing signal data.
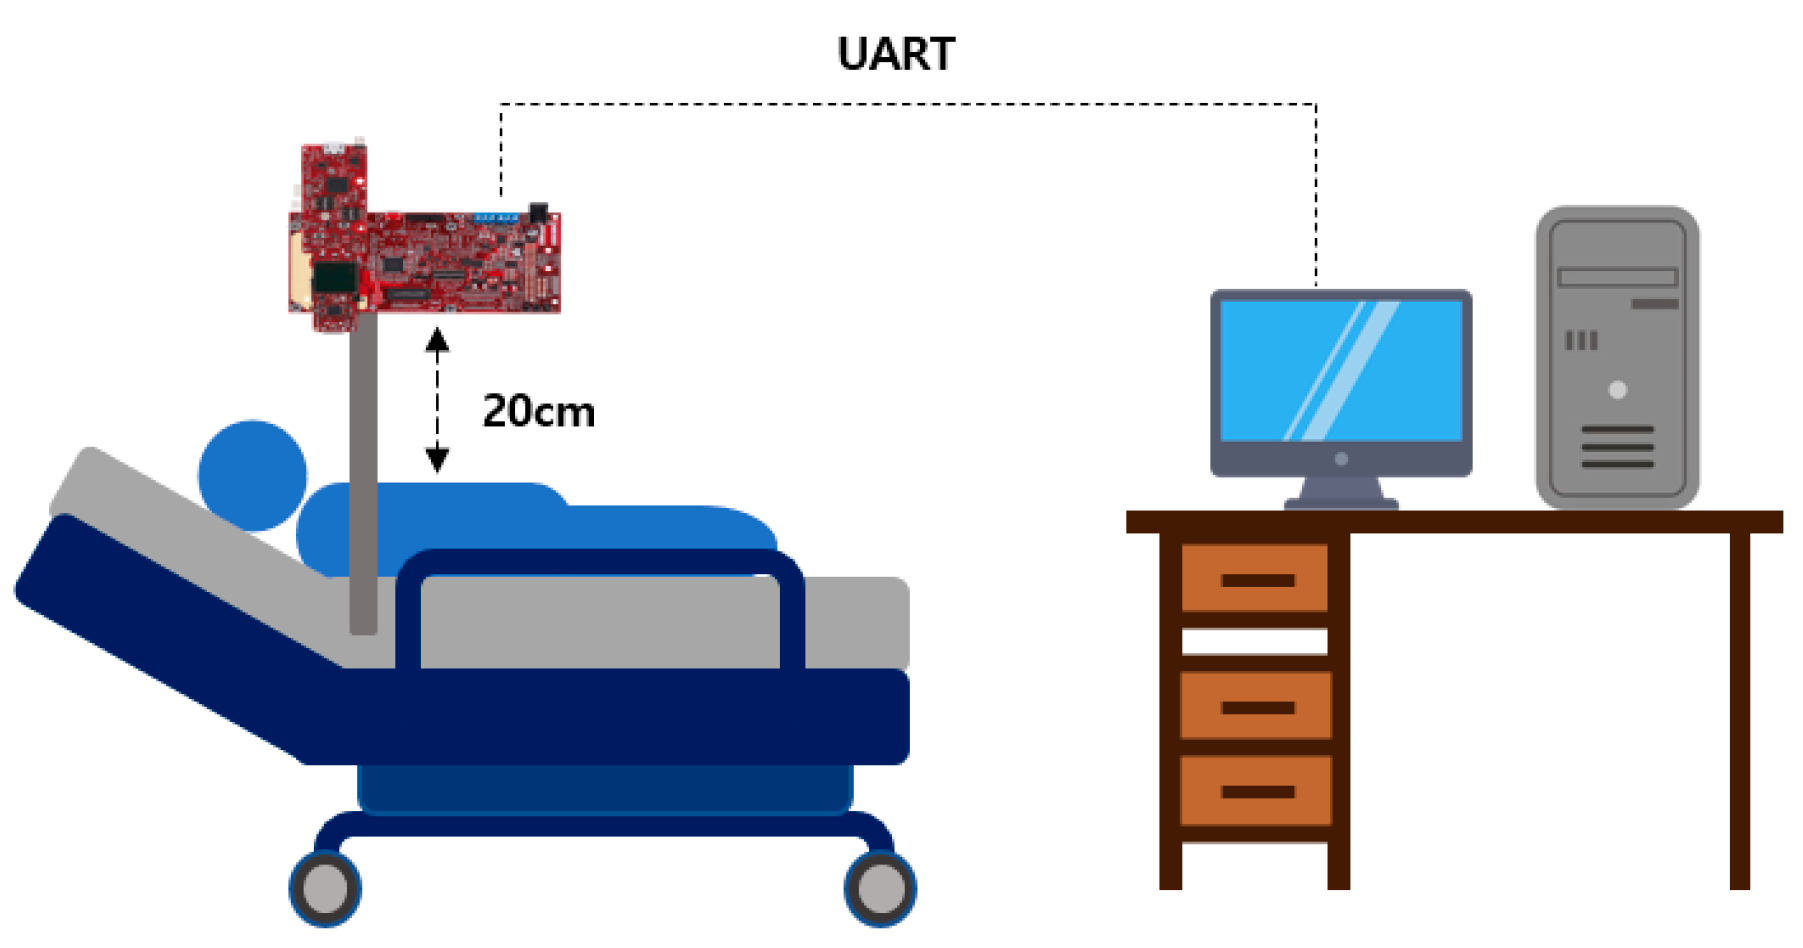
Sensors 23 05275 g015
Figure 16. The mmWave sensor installation environment for collecting breathing signal data.
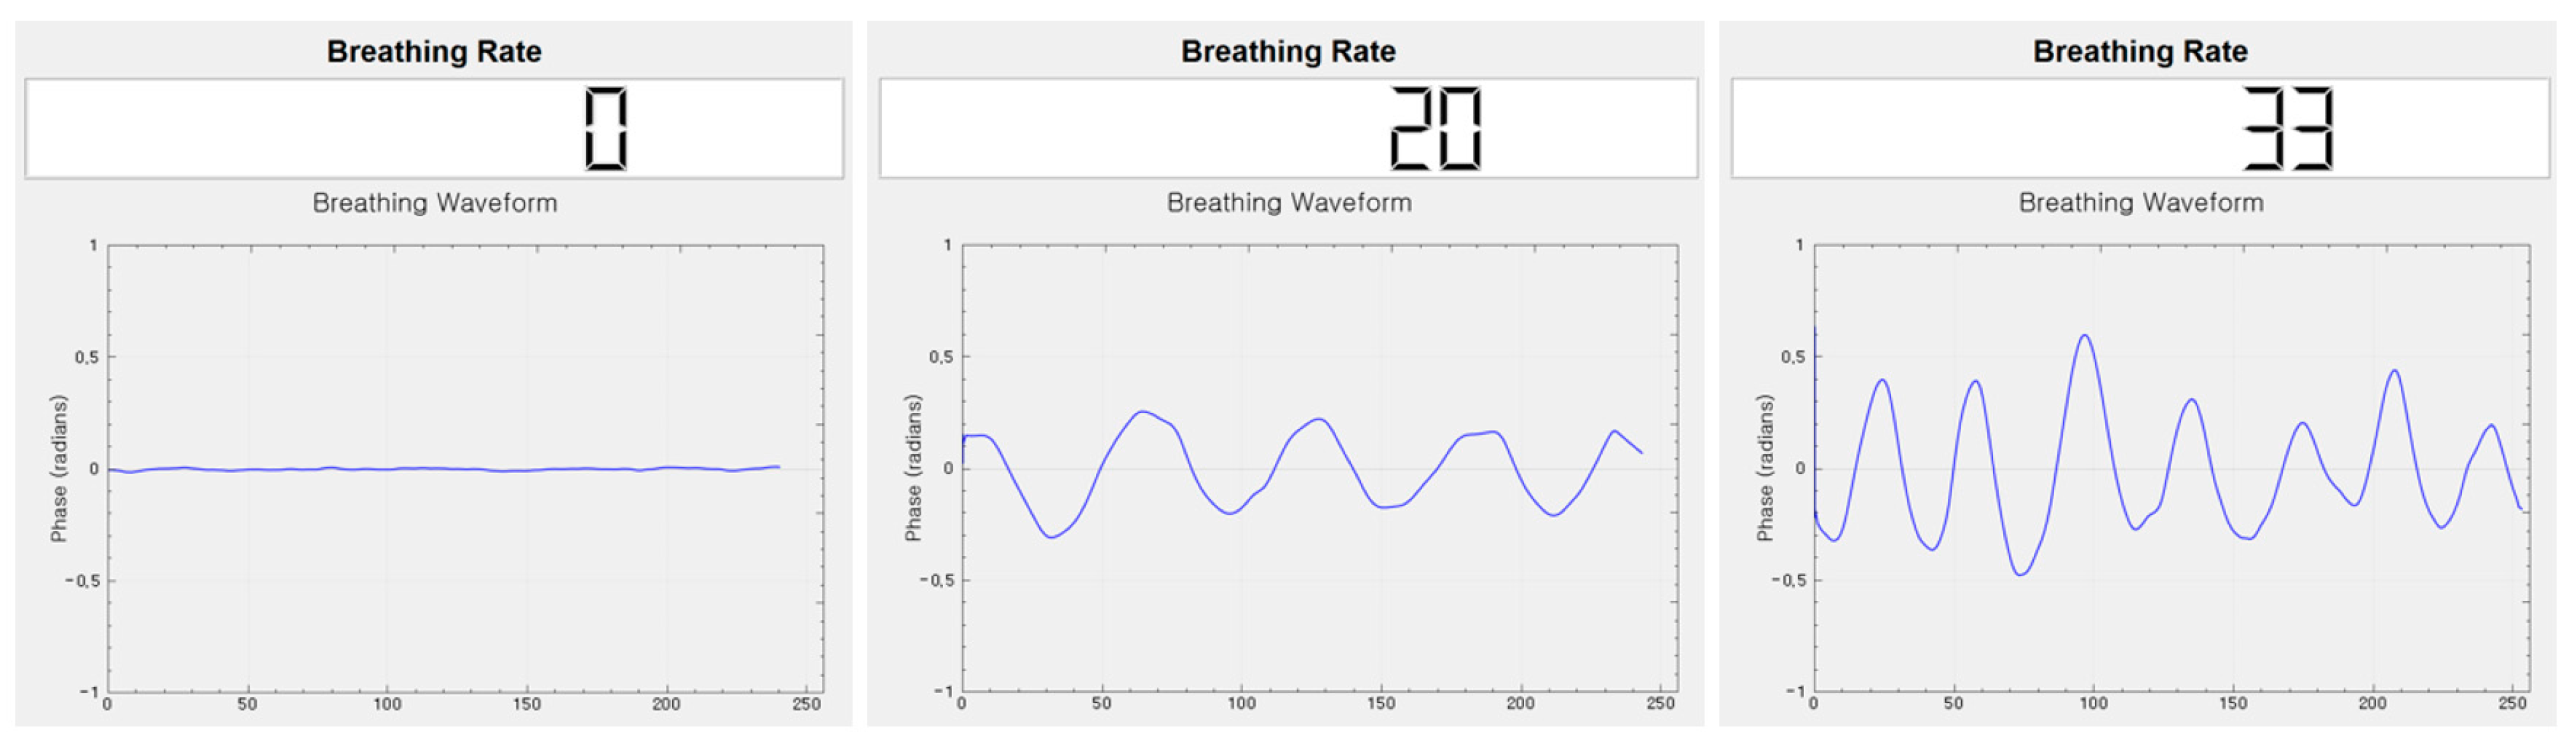
Sensors 23 05275 g016
Figure 17. Example of a breathing signal measured with the mmWave sensor.
Sensors 23 05275 g017
Figure 18. Breathing data collection program using the mmWave sensor.
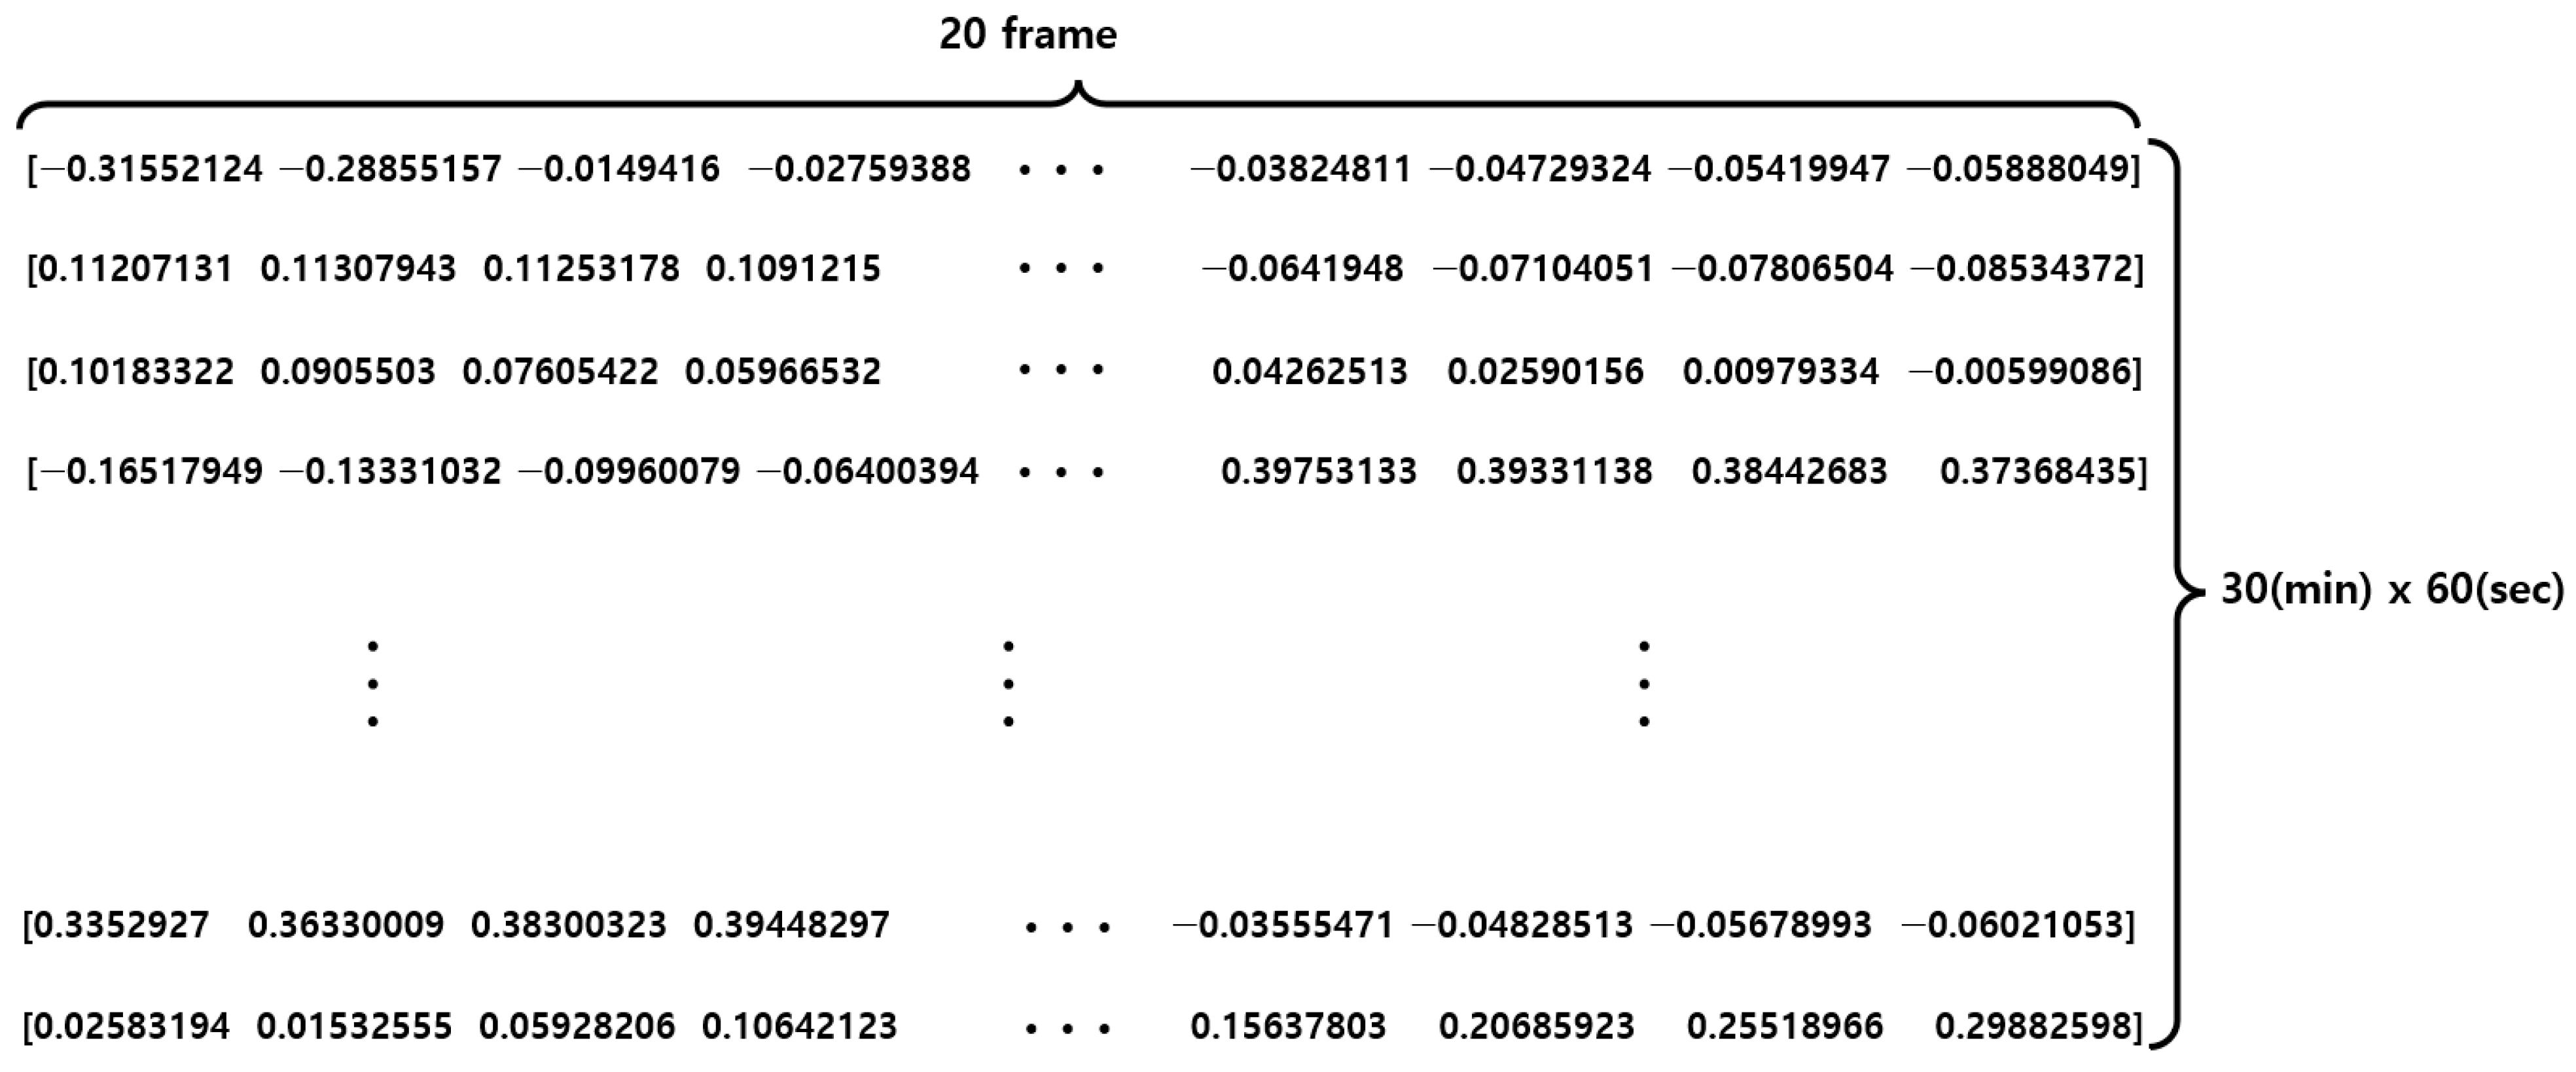
Sensors 23 05275 g018
Figure 19. Raw data structure of the mmWave sensor.
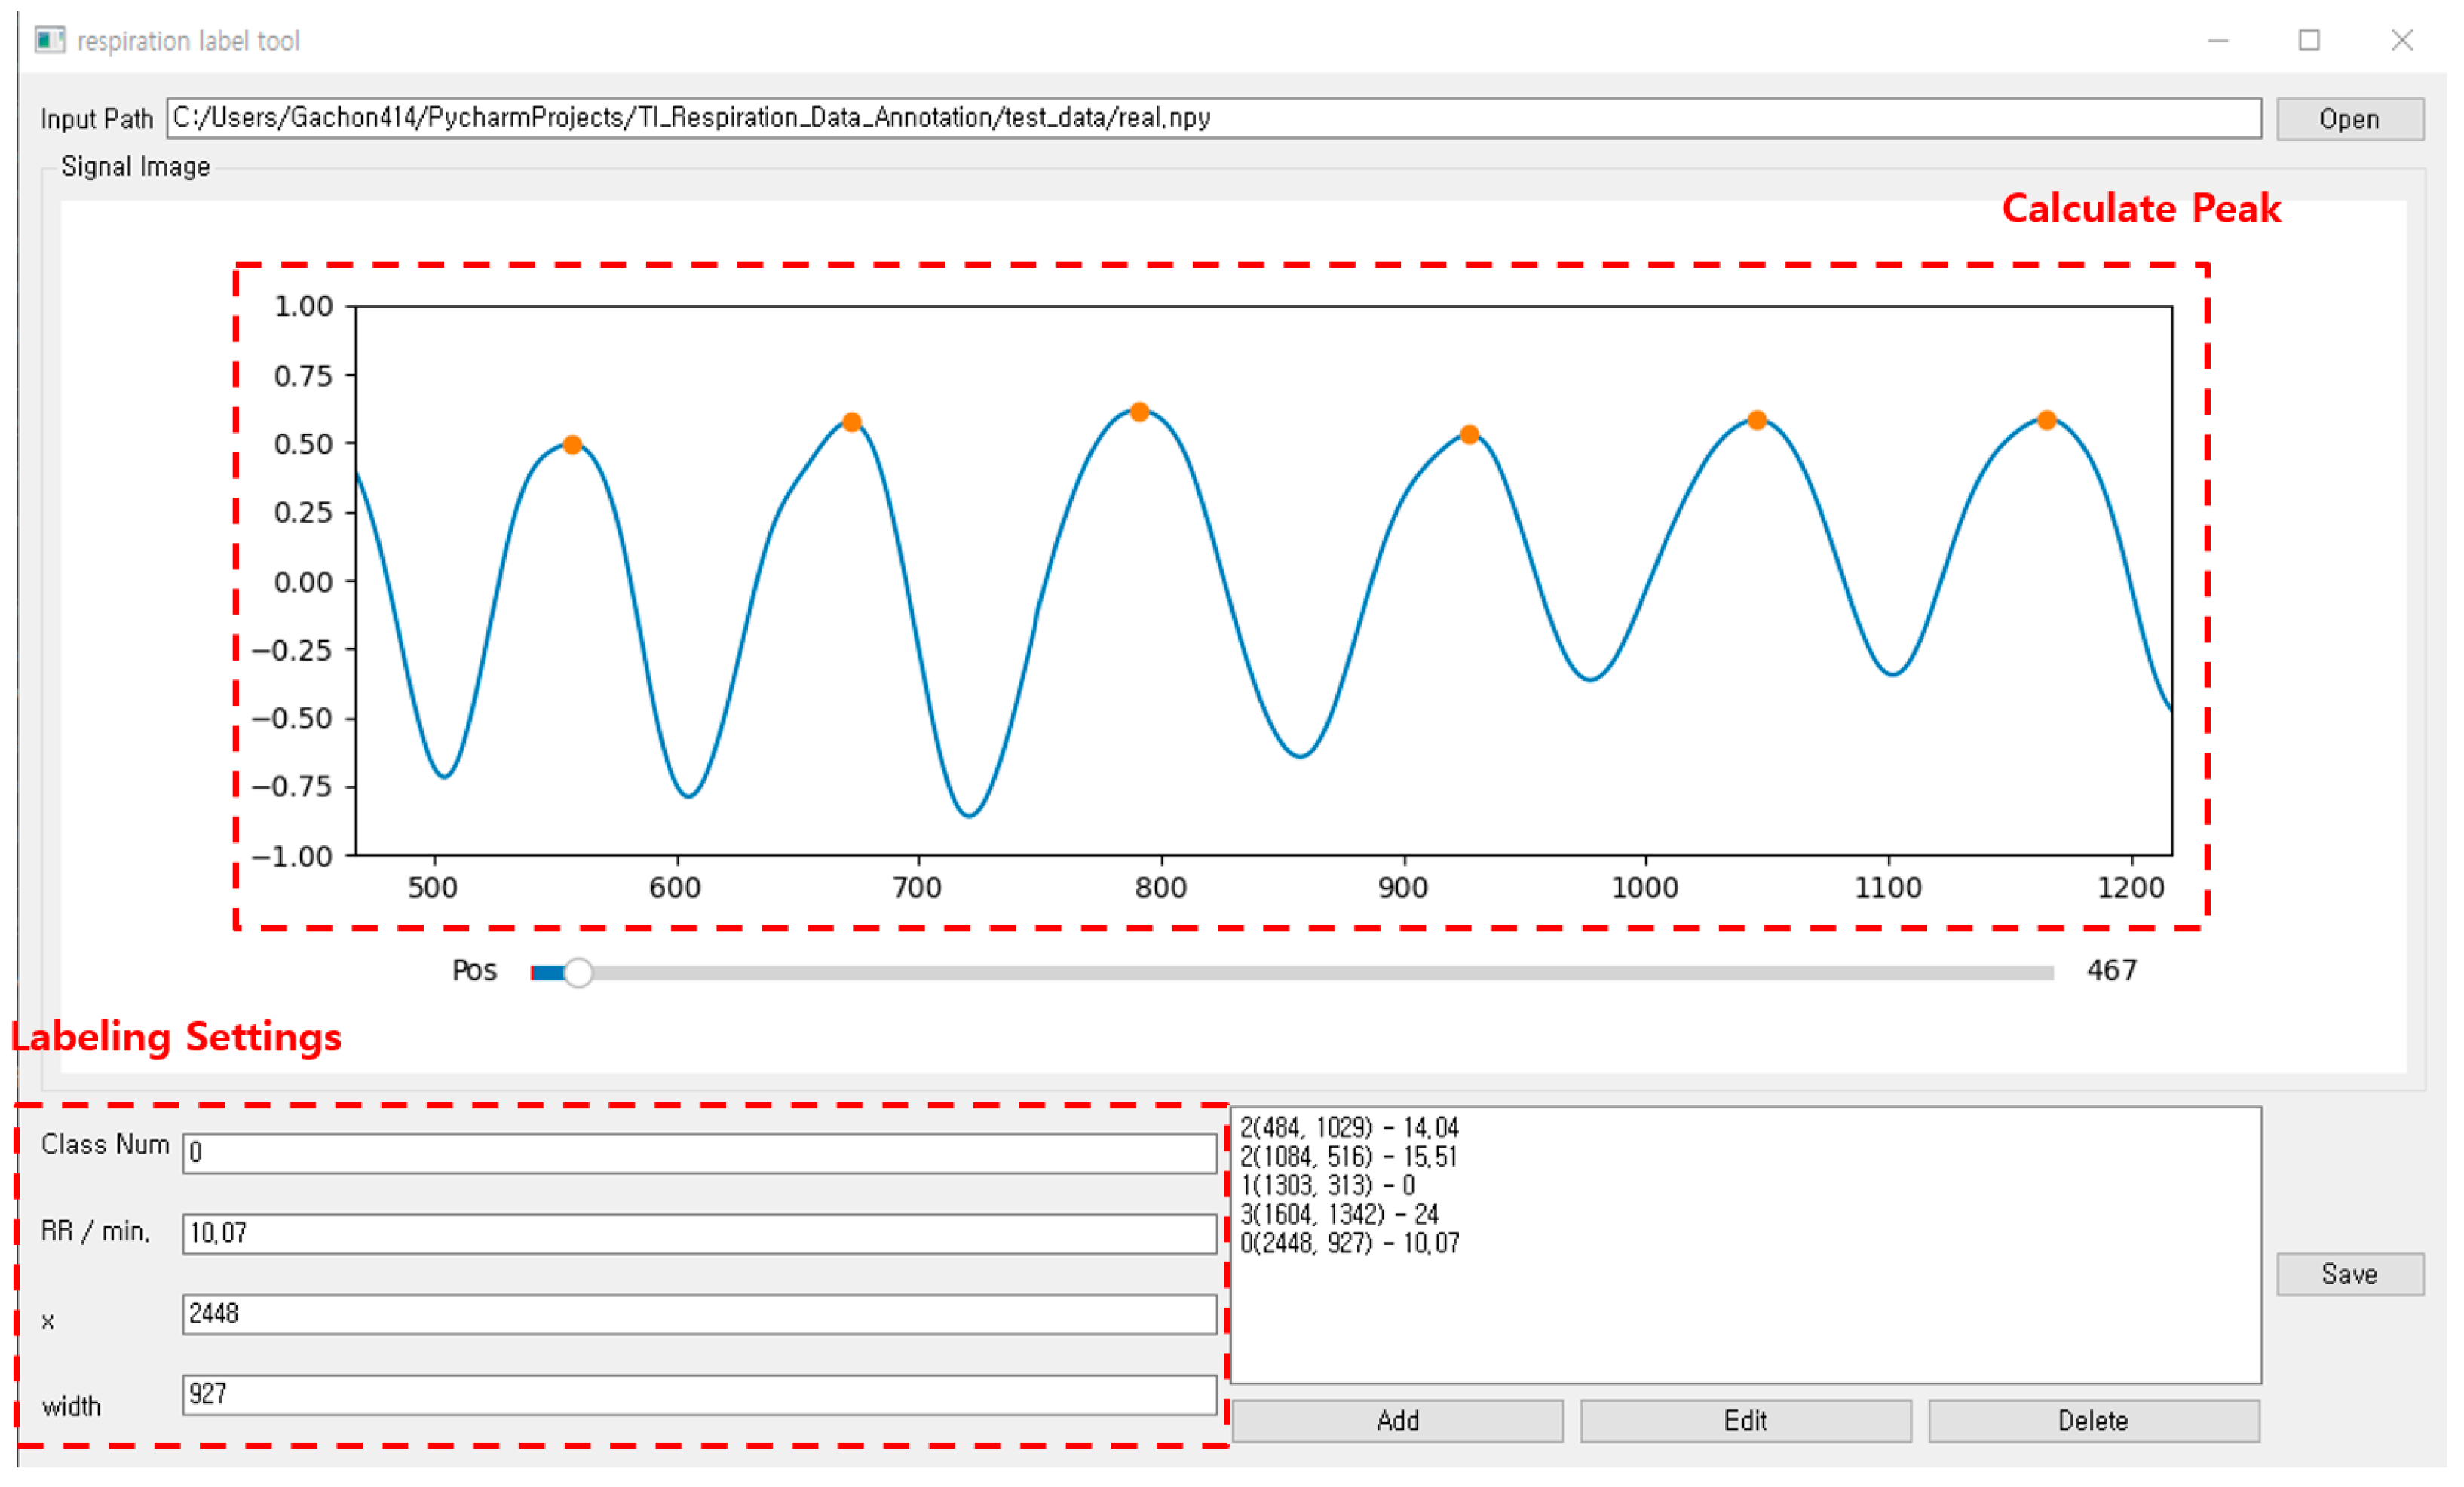
Sensors 23 05275 g019
Figure 20. Annotation tool for breathing data pattern area designation and labeling.
Sensors 23 05275 g020
Figure 21. Training and testing data loaders.
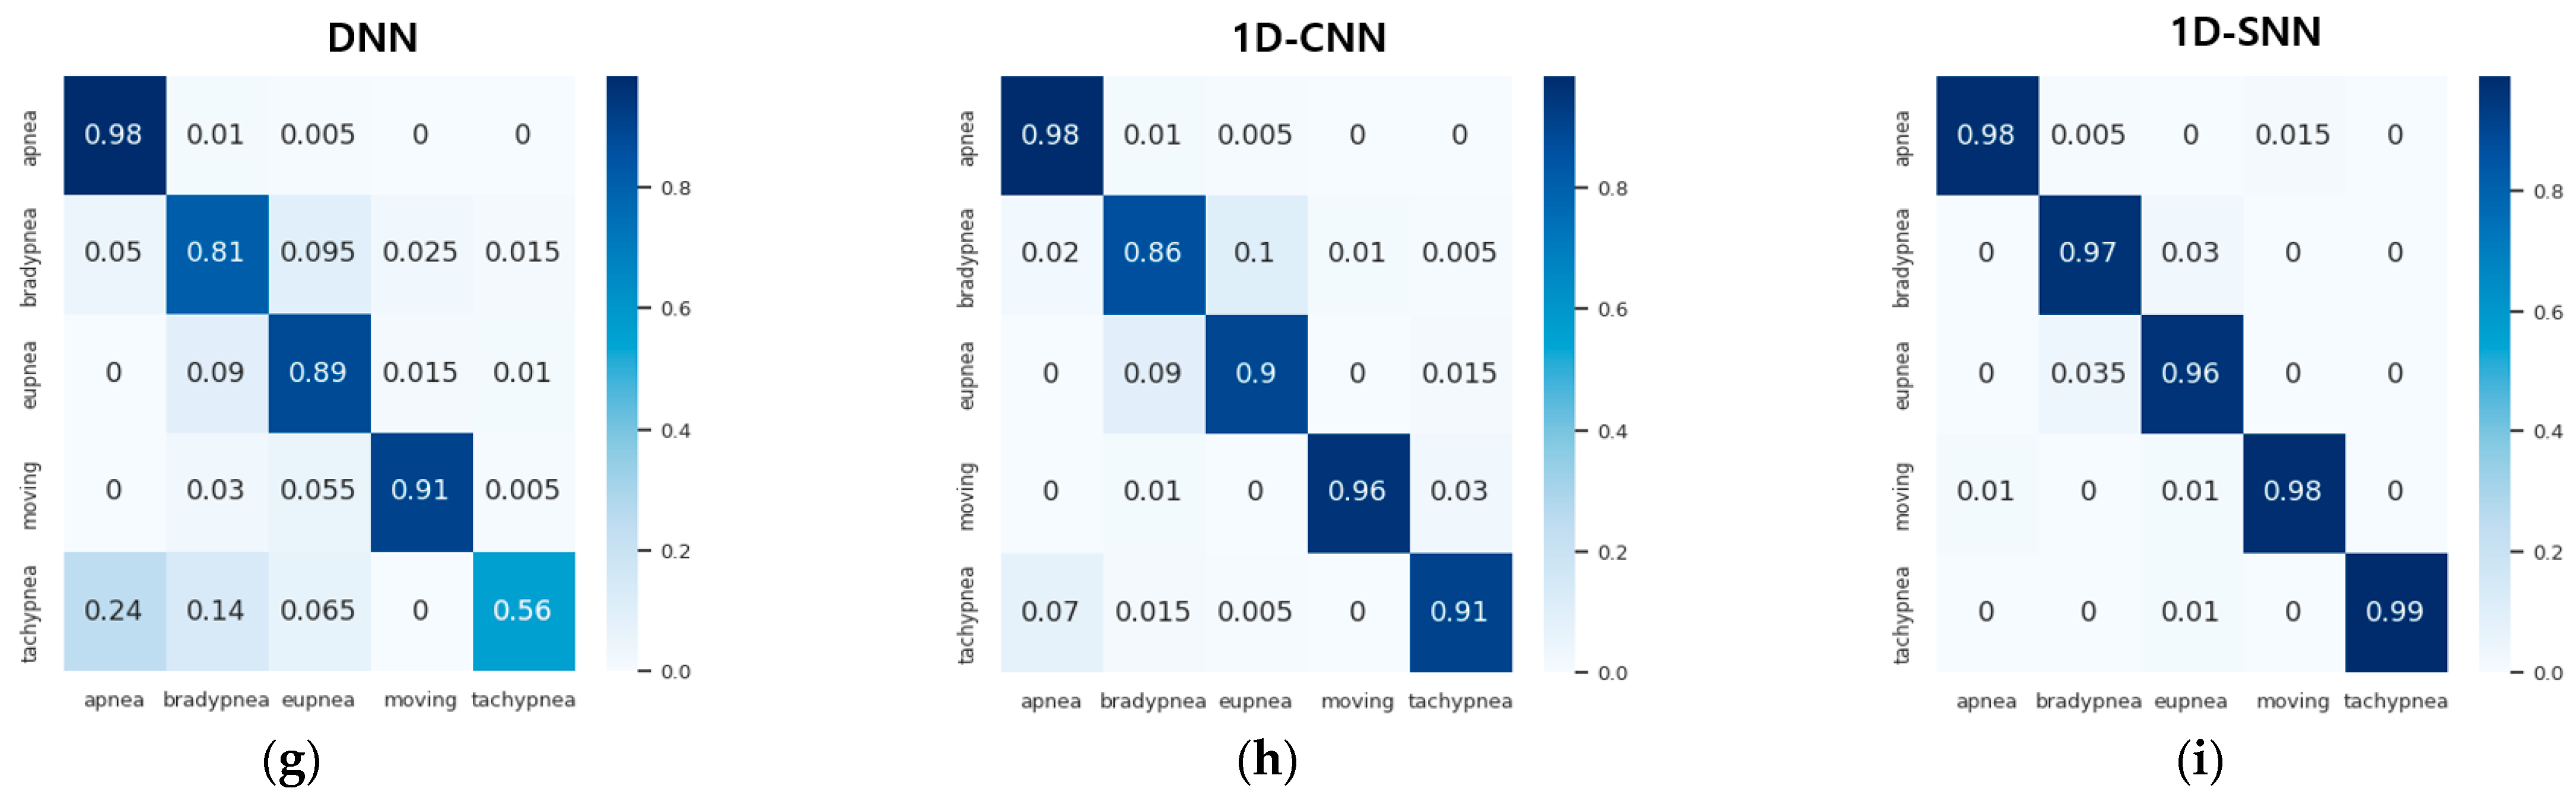
Sensors 23 05275 g021
Figure 22. Confusion matrix comparison of pattern recognition results between the proposed method and existing methods: (a) XGBoost method, (b) decision tree method, (c) SVM method, (d) RNN method, (e) LSTM method, (f) GRU method, (g) DNN method, (h) 1D CNN method, (i) 1D SNN method.
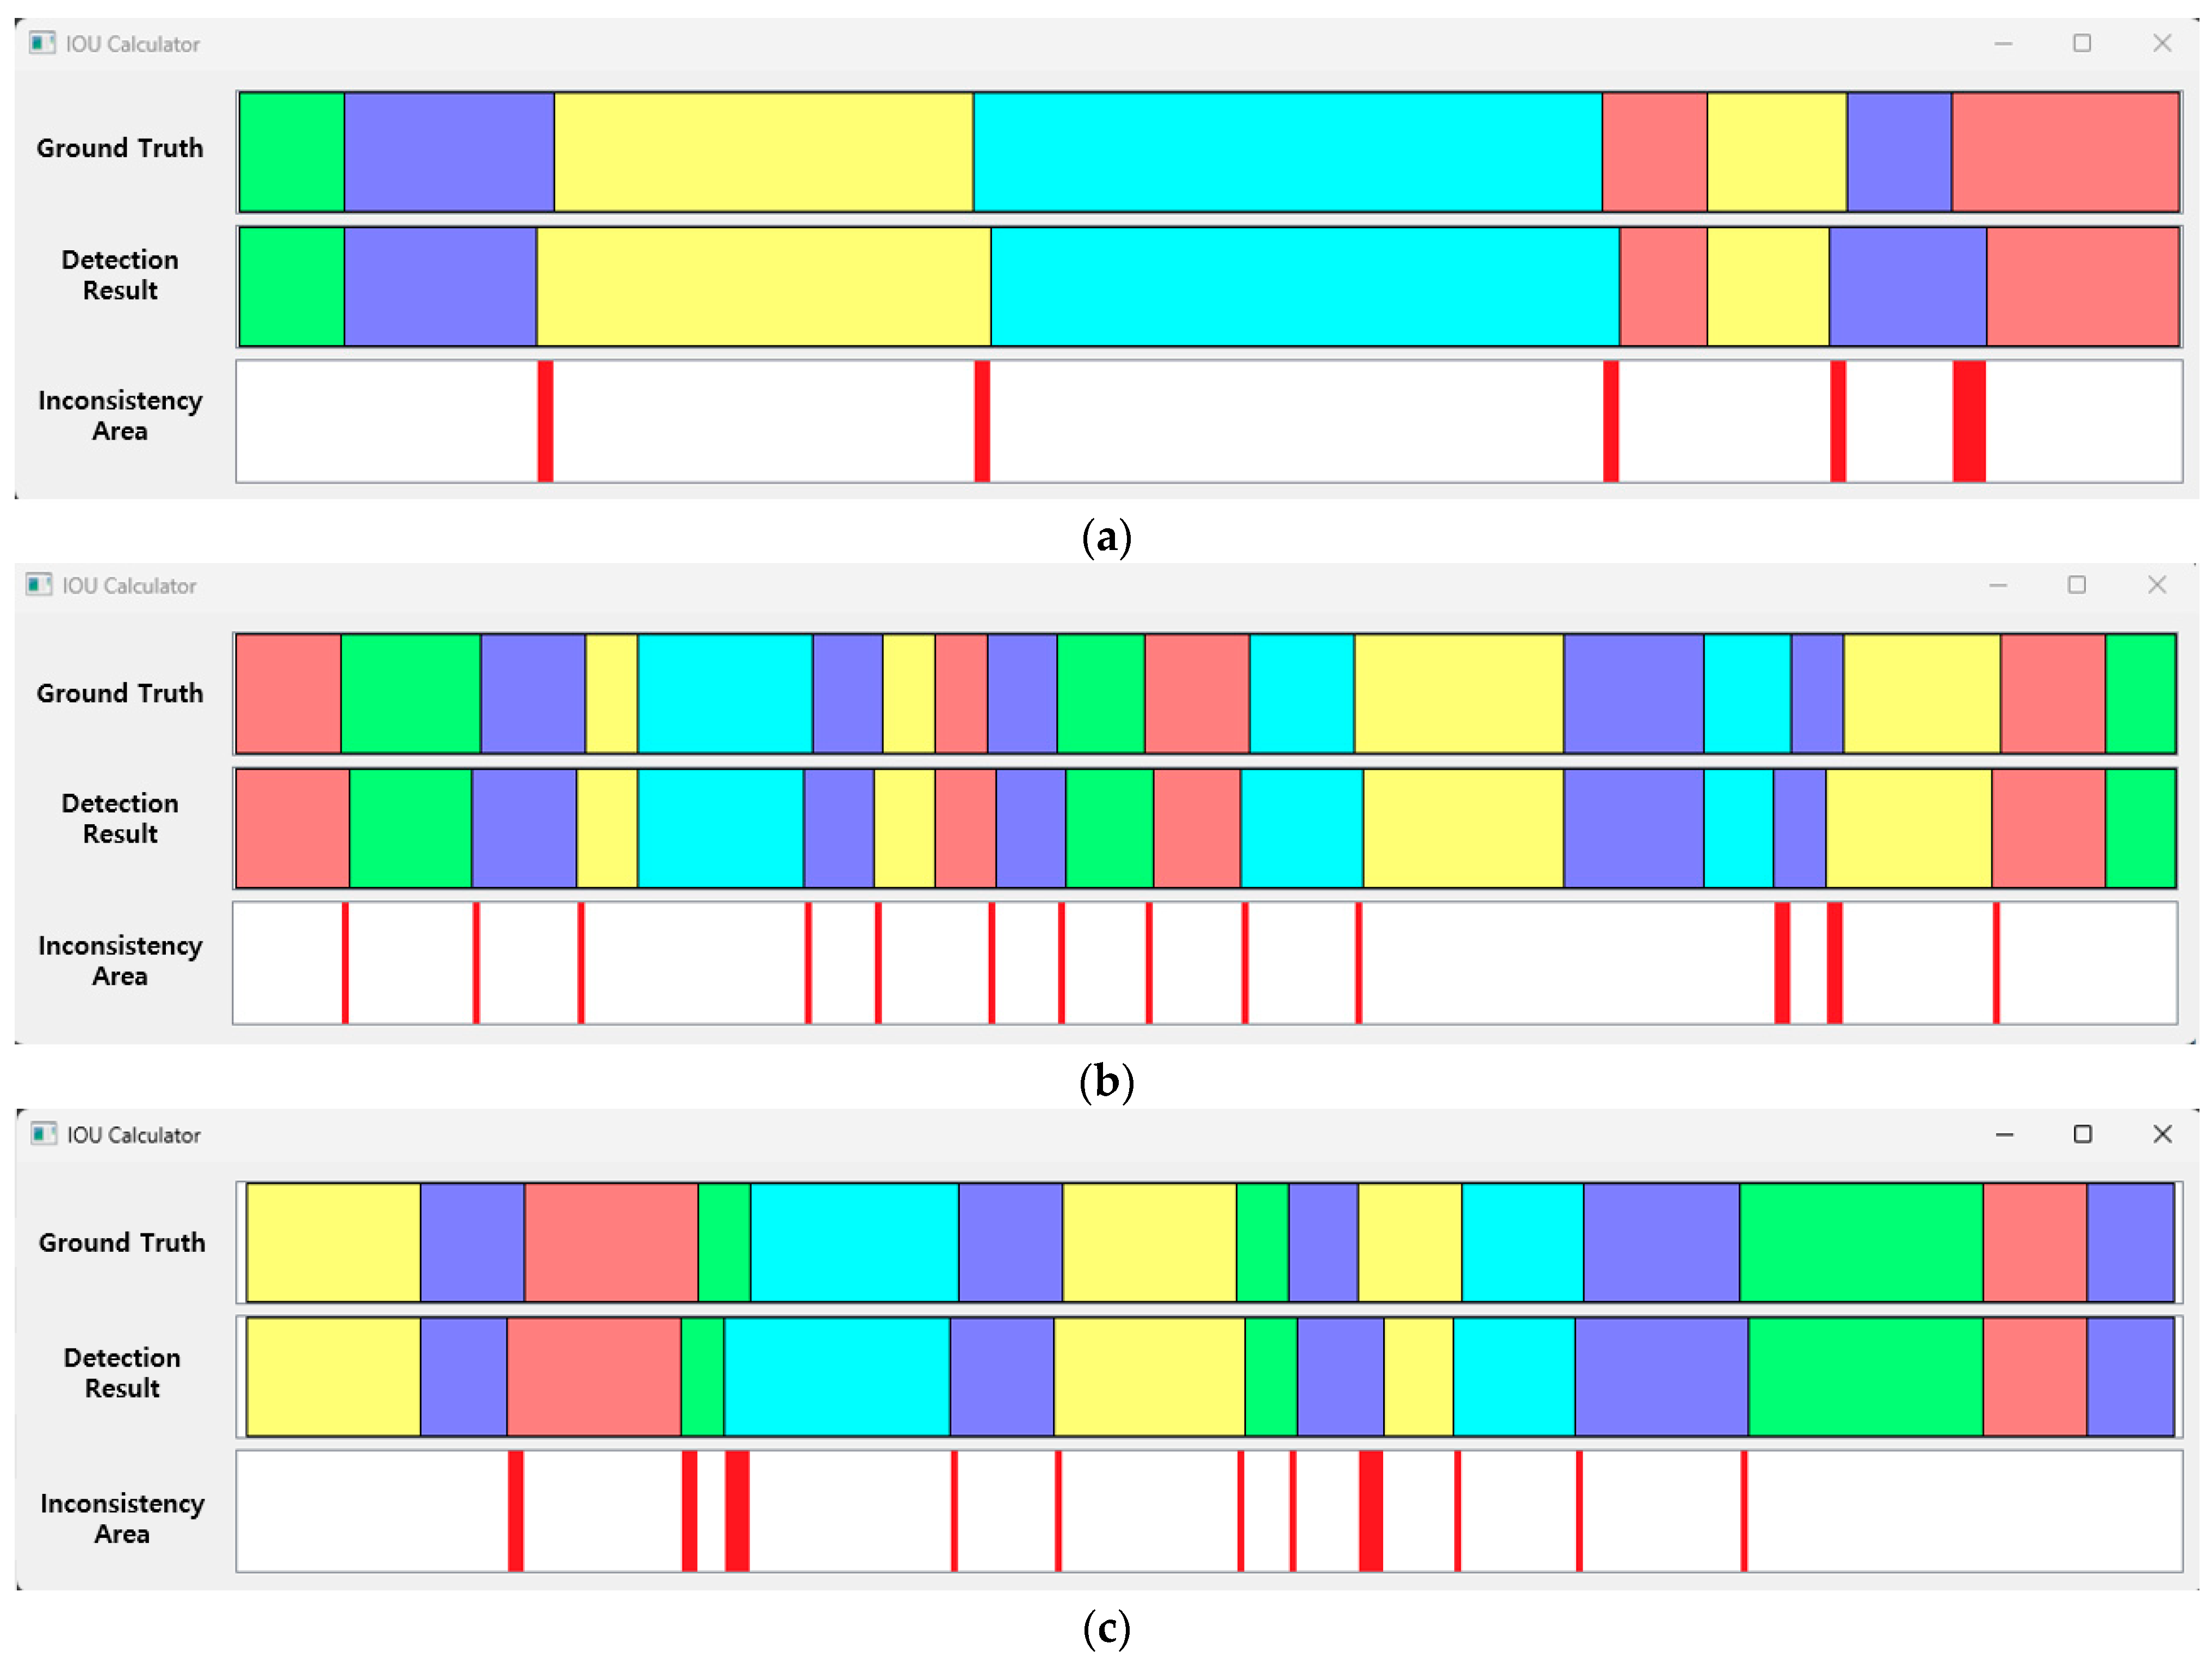
Sensors 23 05275 g022aSensors 23 05275 g022b
Figure 23. IOU samples between the ground truth of the test data and the detection results of the proposed method (respiration pattern visualization: eupnea = blue, bradypnea = yellow, tachypnea = red, apnea = cyan, movement = green). (a) IOU: 94.6%, (b) IOU: 93.3%, (c) IOU: 92.4%.
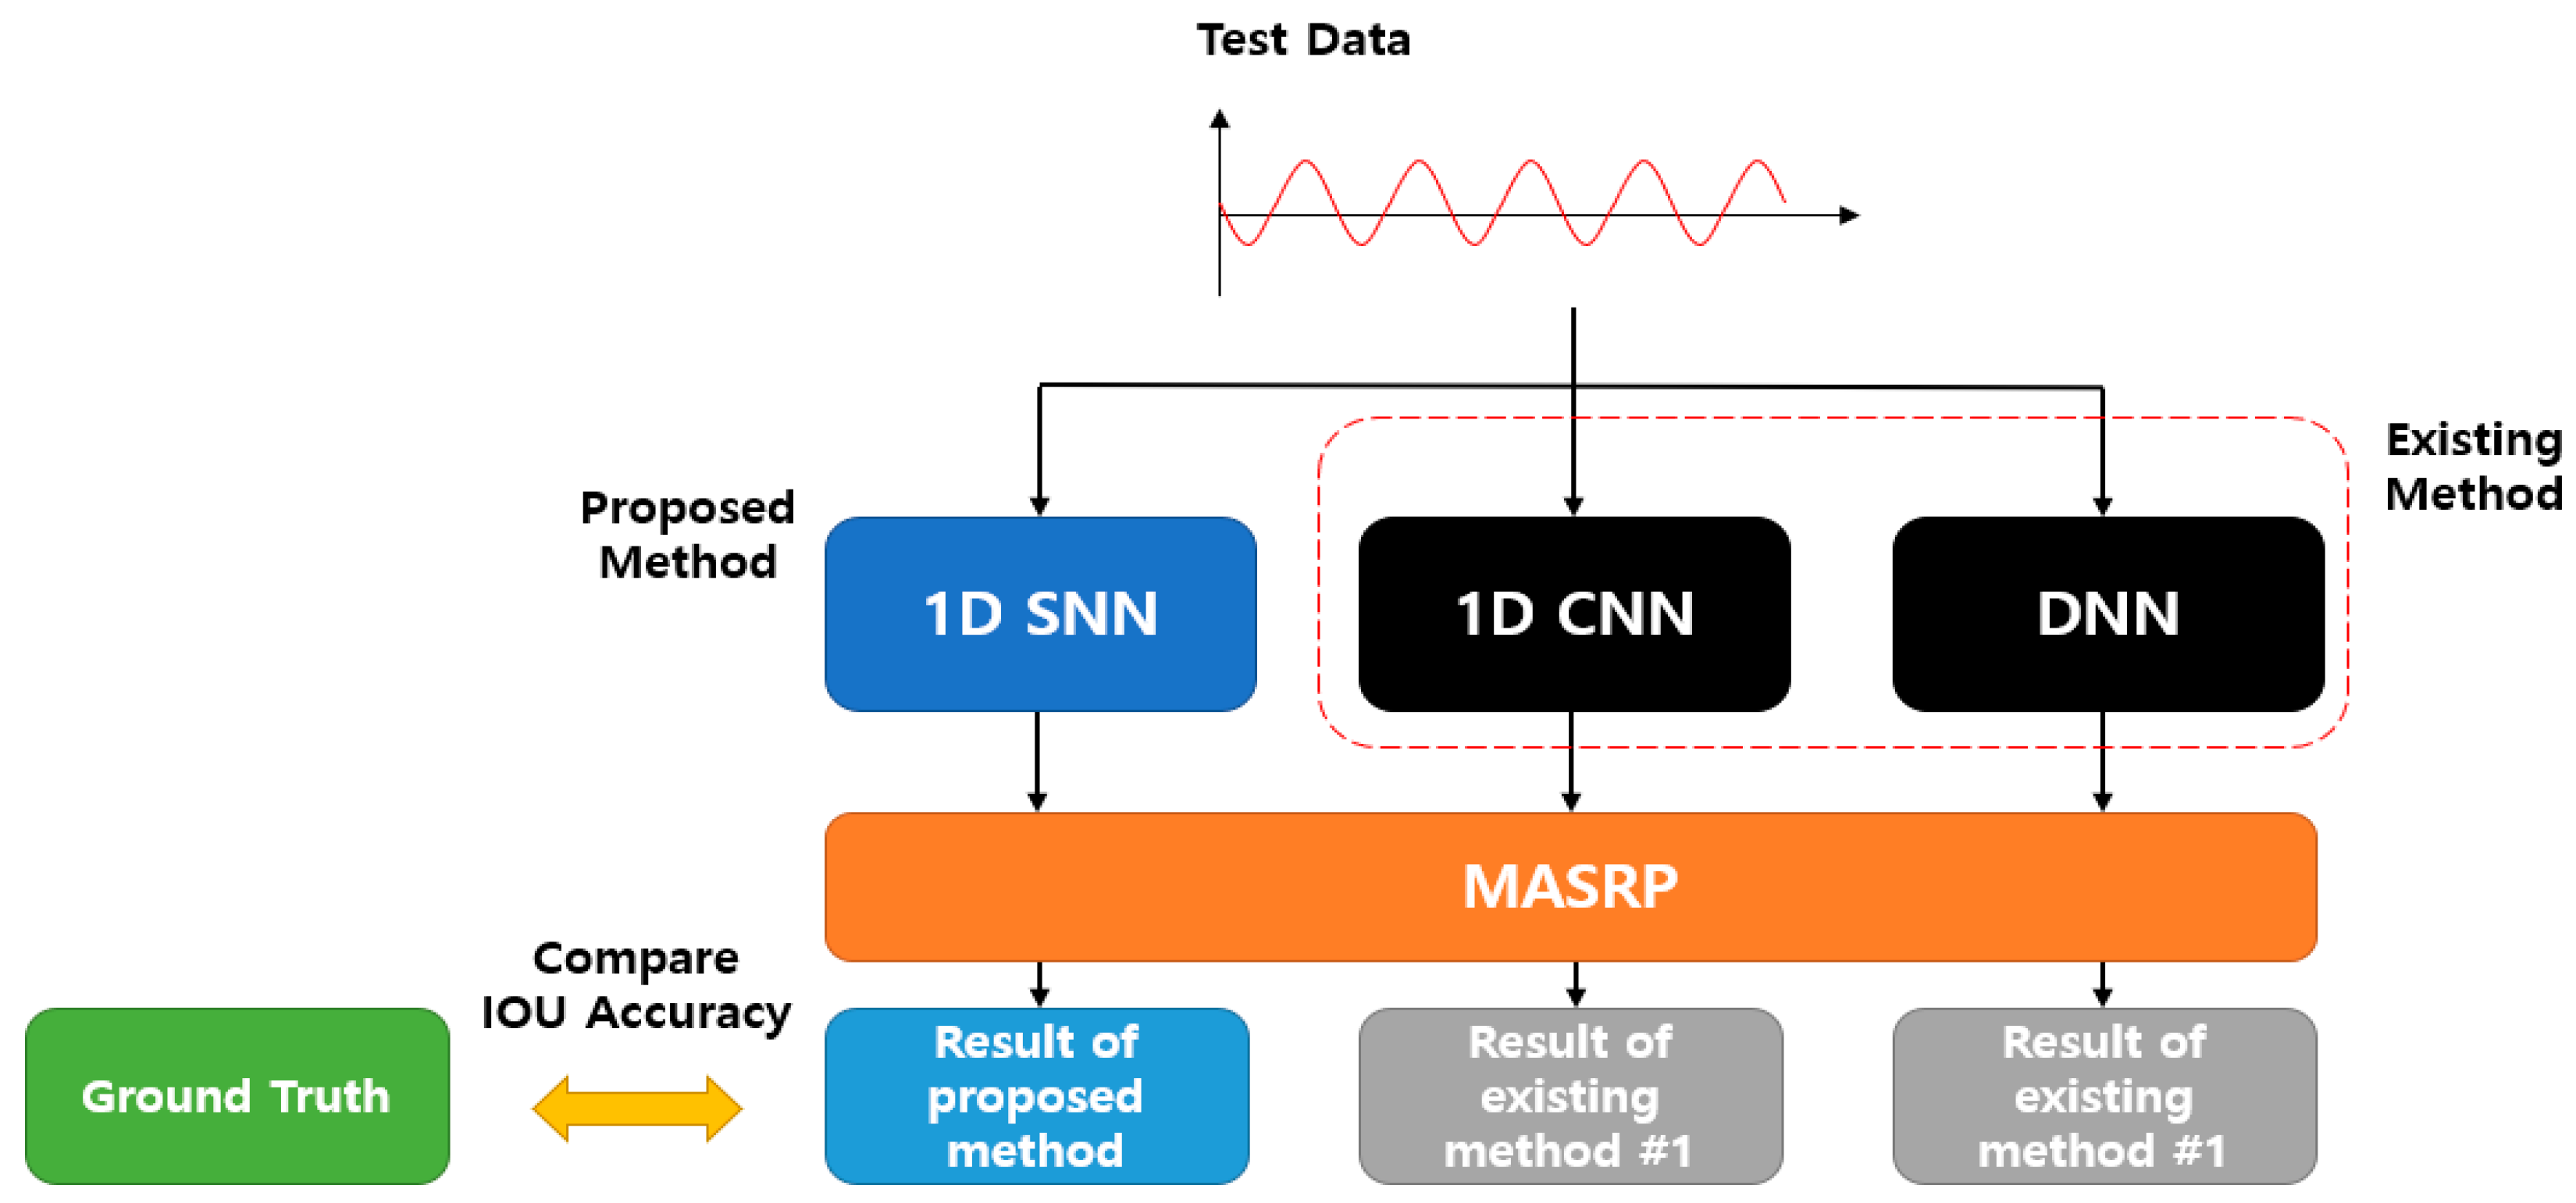
Sensors 23 05275 g023
Figure 24. IOU accuracy comparison evaluation method between the existing and proposed methods.
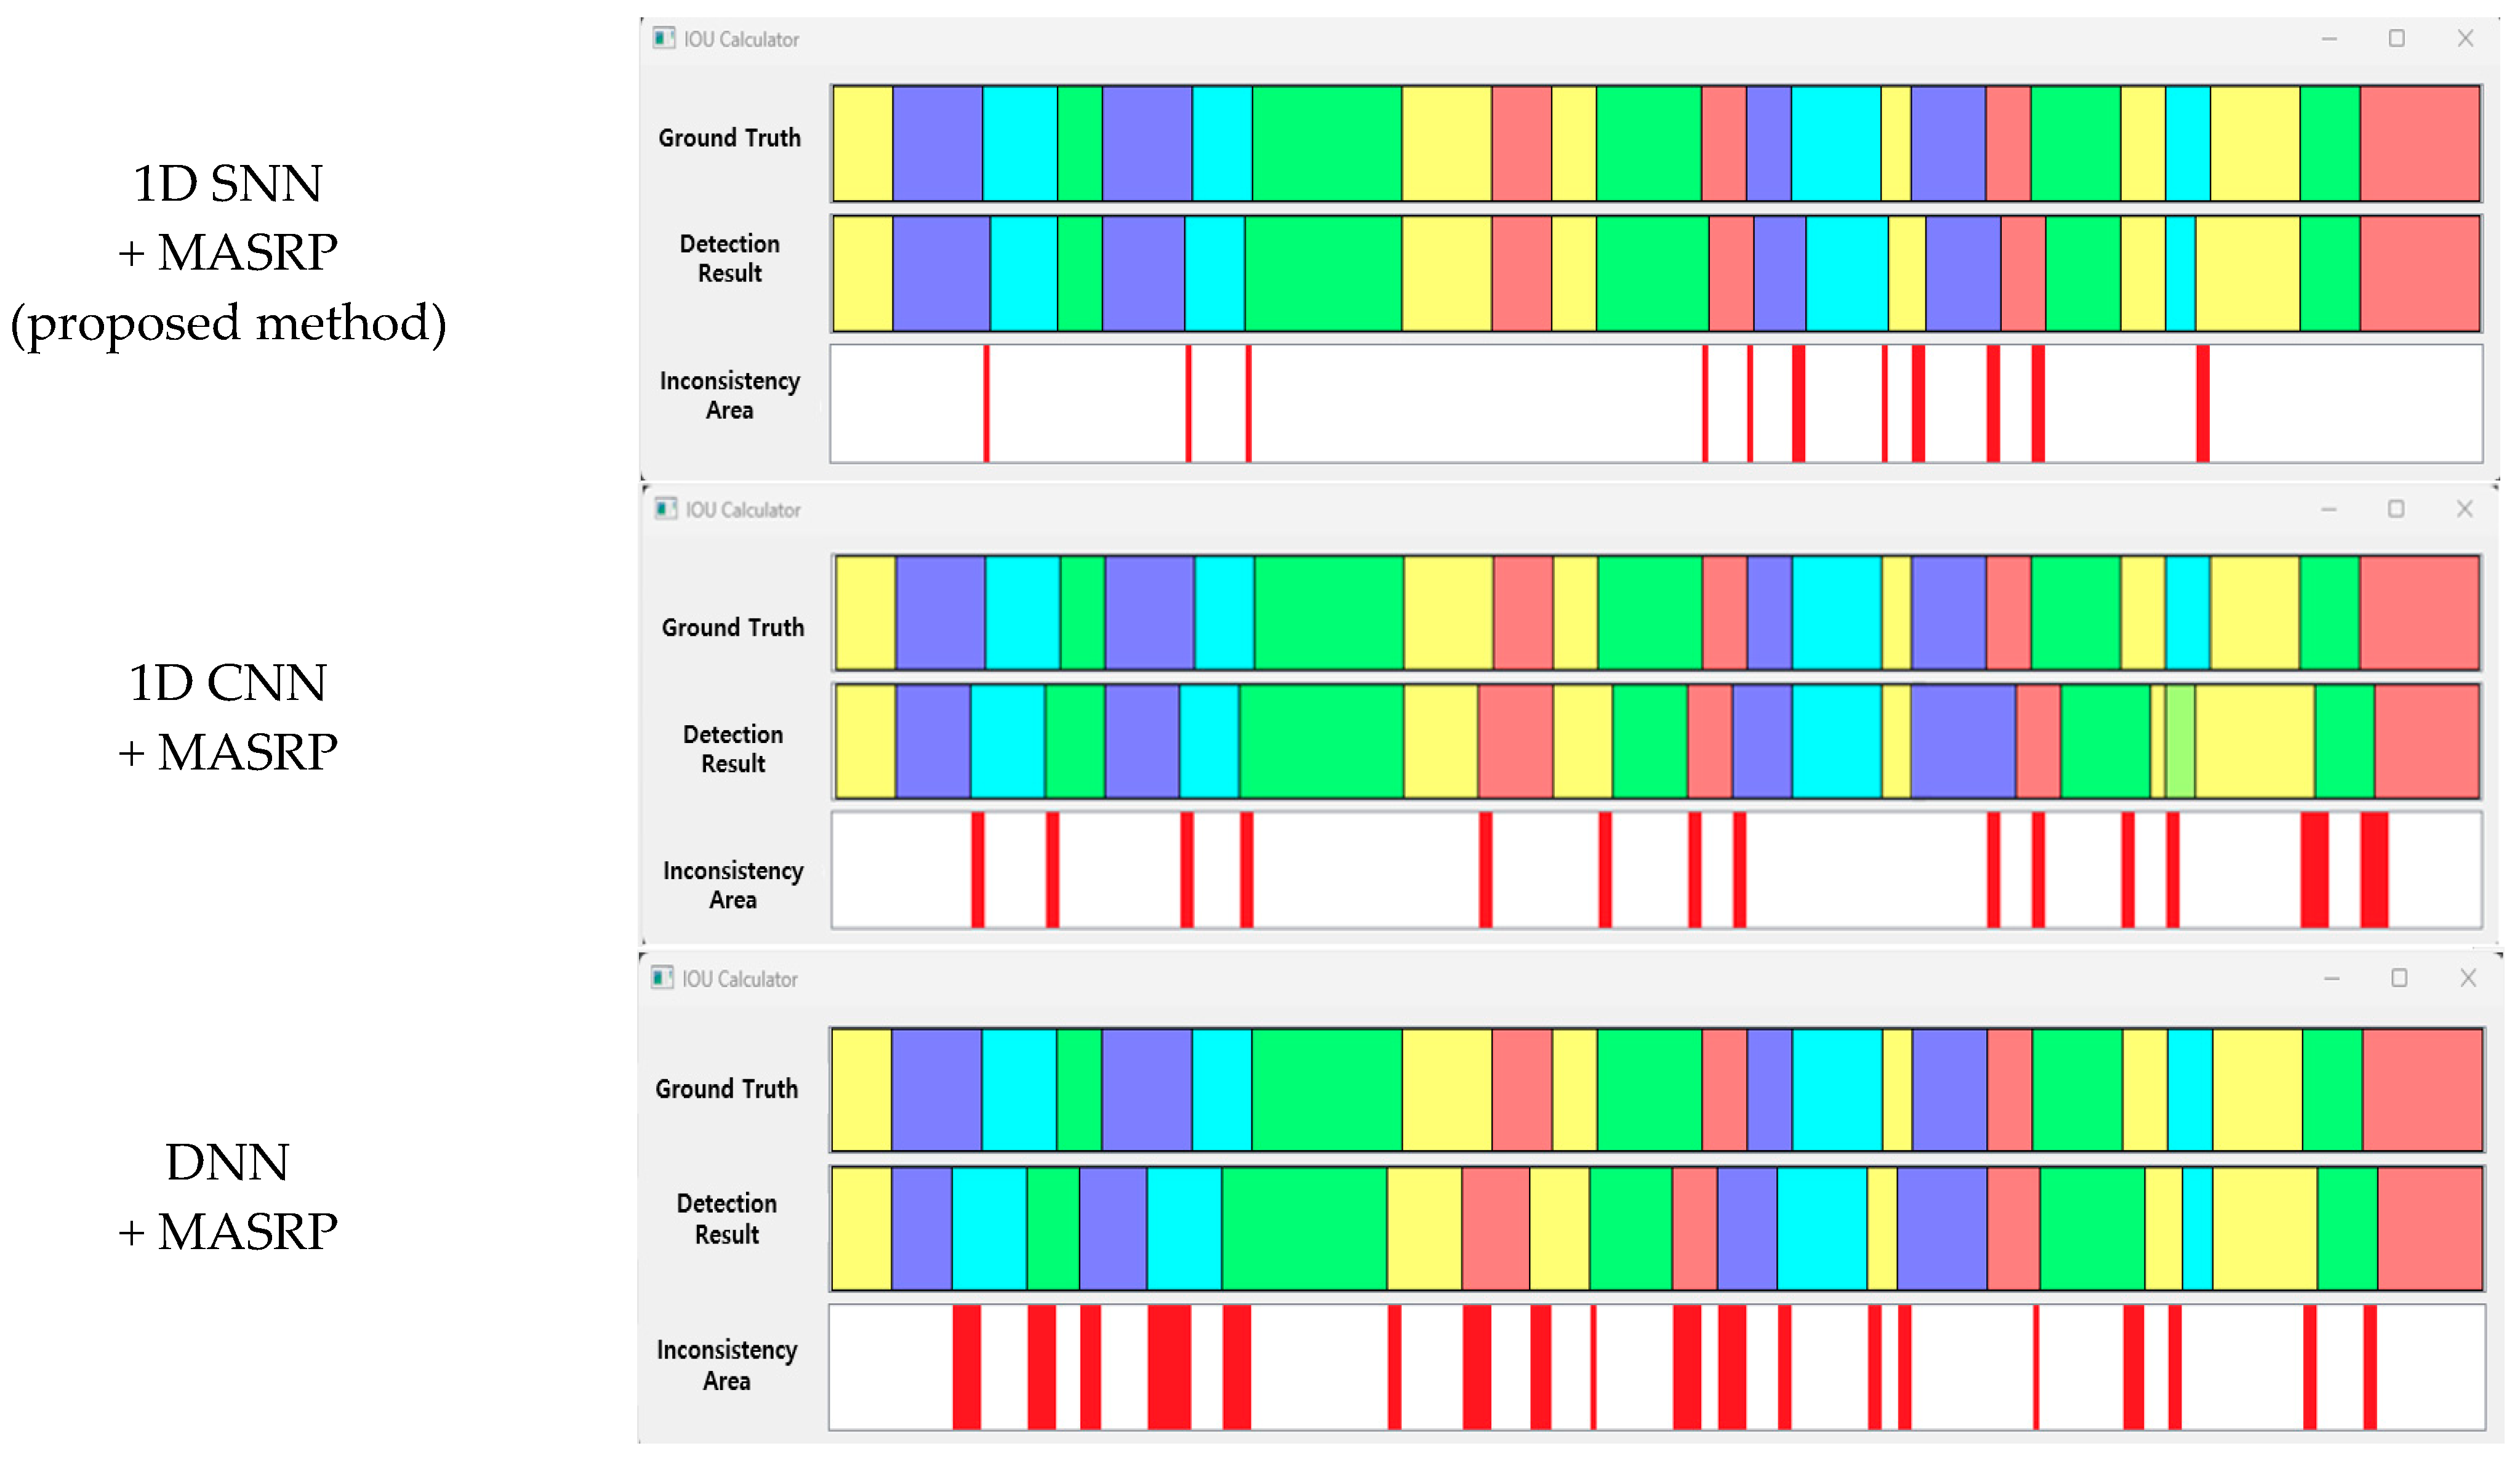
Sensors 23 05275 g024
Figure 25. Visualization of samples for IOU accuracy comparison between the existing method and the proposed methods (eupnea: blue, bradypnea: yellow, tachypnea: red, apnea: cyan, movement: green).
Sensors 23 05275 g025
Table 1. Error examples from the results retrieved in the respiration range containing multiple patterns (E: eupnea, B: bradypnea, T: tachypnea, A: apnea, M: movement). Error recognition is shown in red, and normal recognition is shown in blue.
Multiple
Patterns
(Ground Truth)
Input Breathing SignalsProbability Value for Each Pattern Retrieved from the Multiple Respiration Pattern Range
EBTAM
E-ASensors 23 05275 i0010.210.610.020.120.04
E-MSensors 23 05275 i0020.180.090.270.040.42
B-TSensors 23 05275 i0030.510.10.210.030.15
T-ASensors 23 05275 i0040.040.010.630.20.12
A-MSensors 23 05275 i0050.020.030.210.080.66
Table 2. Proposed 1D SNN architecture for detecting respiration patterns.
LayerType AFiltersSize/StrideType B
0Conv1D6420 × 1/1Conv1D
1BatchNorm1D64 BatchNorm1D
2ReLU ReLU
3MaxPool1D 2 × 1/2MaxPool1D
4Conv1D3220 × 1/1Conv1D
5BatchNorm1D32 BatchNorm1D
6ReLU ReLU
7MaxPool1D 2 × 1/2MaxPool1D
8Conv1D1620 × 1/1Conv1D
9BatchNorm1D16 BatchNorm1D
10ReLU ReLU
11MaxPool1D 2 × 1/2MaxPool1D
12FC FC
13FC FC
14FC FC
15Cosine similarity (embedding vector of type A; embedding vector of type B)
Table 3. Existing DNN architecture for detecting respiration patterns.
LayerTypeInput SizeOutput Size
0Linear300256
1BatchNorm1D256
2ReLU
3Linear256128
4BatchNorm1D128
5ReLU
6Linear12864
7BatchNorm1D64
8ReLU
9Linear6432
10BatchNorm1D32
11ReLU
12Linear325
13BatchNorm1D5
14ReLU
15Softmax55
Table 4. Existing 1D CNN architecture for detecting respiration patterns.
LayerType AFiltersSize/Stride
0Conv1D25620 × 1/1
1BatchNorm1D256
2ReLU
3MaxPool1D 2 × 1/2
4Conv1D12820 × 1/1
5BatchNorm1D128
6ReLU
7MaxPool1D 2 × 1/2
8Conv1D6410 × 1/1
9BatchNorm1D64
10ReLU
11MaxPool1D 2 × 1/2
12Dropout 0.4
13FC
14FC
15FC
16Softmax
Table 5. Layer configuration diagram according to the input size for the proposed model.
SizeLayerArchitectureOutput Dim.
1002CBRMCBRMFCFC---32
3CBRMCBRMCBRMFCFC--
2002CBRMCBRMFCFCFC--
3CBRMCBRMCBRMFCFC--
4CBRMCBRMCBRMCBRMFCFC-
3002CBRMCBRMFCFCFCFC-
3CBRMCBRMCBRMFCFCFC-
4CBRMCBRMCBRMCBRMFCFC-
6002CBRMCBRMFCFCFC--
3CBRMCBRMCBRMFCFCFCFC
4CBRMCBRMCBRMCBRMFCFCFC
5CBRMCBRMCBRMCBRMCBRMFCFC
Table 6. The mmWave sensor specifications for breathing data measurement.
ItemSpecification
Maximum detection range20 m
Frequency range60–64 GHz
Elevation FOV±60°
Gain5 dBi
Azimuth FOV±60°
Table 7. Learning and testing system environment of the proposed 1D SNN.
ItemSpecification
CPUIntel Core i7-10700K
GPUNVIDIA GeForce RTX 3090Ti
RAM64 GB
O/SUbuntu20.04
Deep learning frameworkPyTorch
Program languagePython3.8
CUDA/CuDNN11.3/8.1.3
IDEPyCharm
Other librariesPyQT5, Python-Opencv
Table 8. Results of annotation based on the ground truth for each breathing dataset.
No. of DataData LengthNumber of E PatternNumber of T PatternsNumber of B PatternsNumber of A
Patterns
Number of M
Patterns
120 (data) × 60 (s) × 30 (min) =
36,000
63235
233121
363312
452311
552421
......
29872352
29956644
30043446
(E: eupnea, T: tachypnea, B: bradypnea, A: apnea, M: movement).
Table 9. Definition of SNN hyperparameters.
HyperparametersDefinitionDefined Parameters
Test trialsTest one-shot trials400
WayWays in the one-shot trials5
Num trainRespiration values in training dataset90,000
Batch sizeRespiration values in each batch of data4096
Num workersSub-processes to use for data loading4
ShuffleWhether to shuffle the dataset between epochsTrue
EpochsEpochs to train200
Init momentumInitial layer-wise momentum value0.5
Lr patienceNumber of epochs to wait before reducing lr1
Train patienceNumber of epochs to wait before stopping train20
Table 10. The 1:1 verification accuracy per input data size and metric.
Input Data SizeMetricLayerAccuracy
100Cosine similarity282.19
382.81
Manhattan distance271.56
381.56
200Cosine similarity291.56
390.94
492.50
Manhattan distance280.63
382.81
484.06
300Cosine similarity296.56
398.44
493.44
Manhattan distance280.63
388.13
486.56
600Cosine similarity297.81
398.05
496.56
595.31
Manhattan distance256.88
366.13
489.06
586.56
Table 11. Top-1 accuracy for respiration pattern detection according to the input size and layer depth.
Input Data SizeLayerAccuracy
100287.4
384.2
200291.6
392.0
491.8
300295.6
397.6
491.8
600297.0
397.4
496.2
595.4
Table 12. Comparison of accuracy for each respiration pattern between the proposed method and existing methods.
MethodApneaBradypneaEupneaMovementTachypneaAvg. (%)
XGBoost0.930.590.760.890.8380.1
Decision tree0.810.410.550.560.4756.3
SVM0.990.520.880.970.1469.9
RNN0.940.730.870.840.5879.5
LSTM0.820.680.930.80.6577.5
GRU0.850.620.810.620.6470.8
DNN0.980.810.890.910.5683.2
1D CNN0.980.860.900.960.9192.3
1D SNN0.980.970.960.980.9997.6
Table 13. Comparison of precision, recall, and F1 score between the proposed method and the existing methods for each respiration pattern.
MethodPrecisionRecallF1 Score
XGBoost0.8010.8010.801
Decision tree0.5670.5590.563
SVM0.7180.7010.709
RNN0.7980.7940.796
LSTM0.7810.7750.778
GRU0.7070.7070.707
DNN0.8460.830.838
1D CNN0.9240.9230.923
1D SNN0.9770.9770.977
Table 14. Average IOU accuracy of the proposed method and the existing methods for test data.
No.1D SNN + MASRP
(Proposed Method)
1D CNN + MASRPDNN + MASRP
193.1%81.4%72.8%
293.6%83.9%76.4%
392.8%78.6%71.4%
495.2%84.7%78.9%
594.7%83.4%71.8%
4993.4%80.2%73.6%
5092.5%79.8%70.4%
Avg.93.9%81.5%74.2%
Disclaimer/Publisher’s Note: The statements, opinions and data contained in all publications are solely those of the individual author(s) and contributor(s) and not of MDPI and/or the editor(s). MDPI and/or the editor(s) disclaim responsibility for any injury to people or property resulting from any ideas, methods, instructions or products referred to in the content.

