
Solid-Phase Optical Sensing Techniques for Sensitive Virus Detection

 , ,
, , 
Abstract
1. Introduction
2. Solid-Phase Optical Sensors and Their Applications in Virus Detection
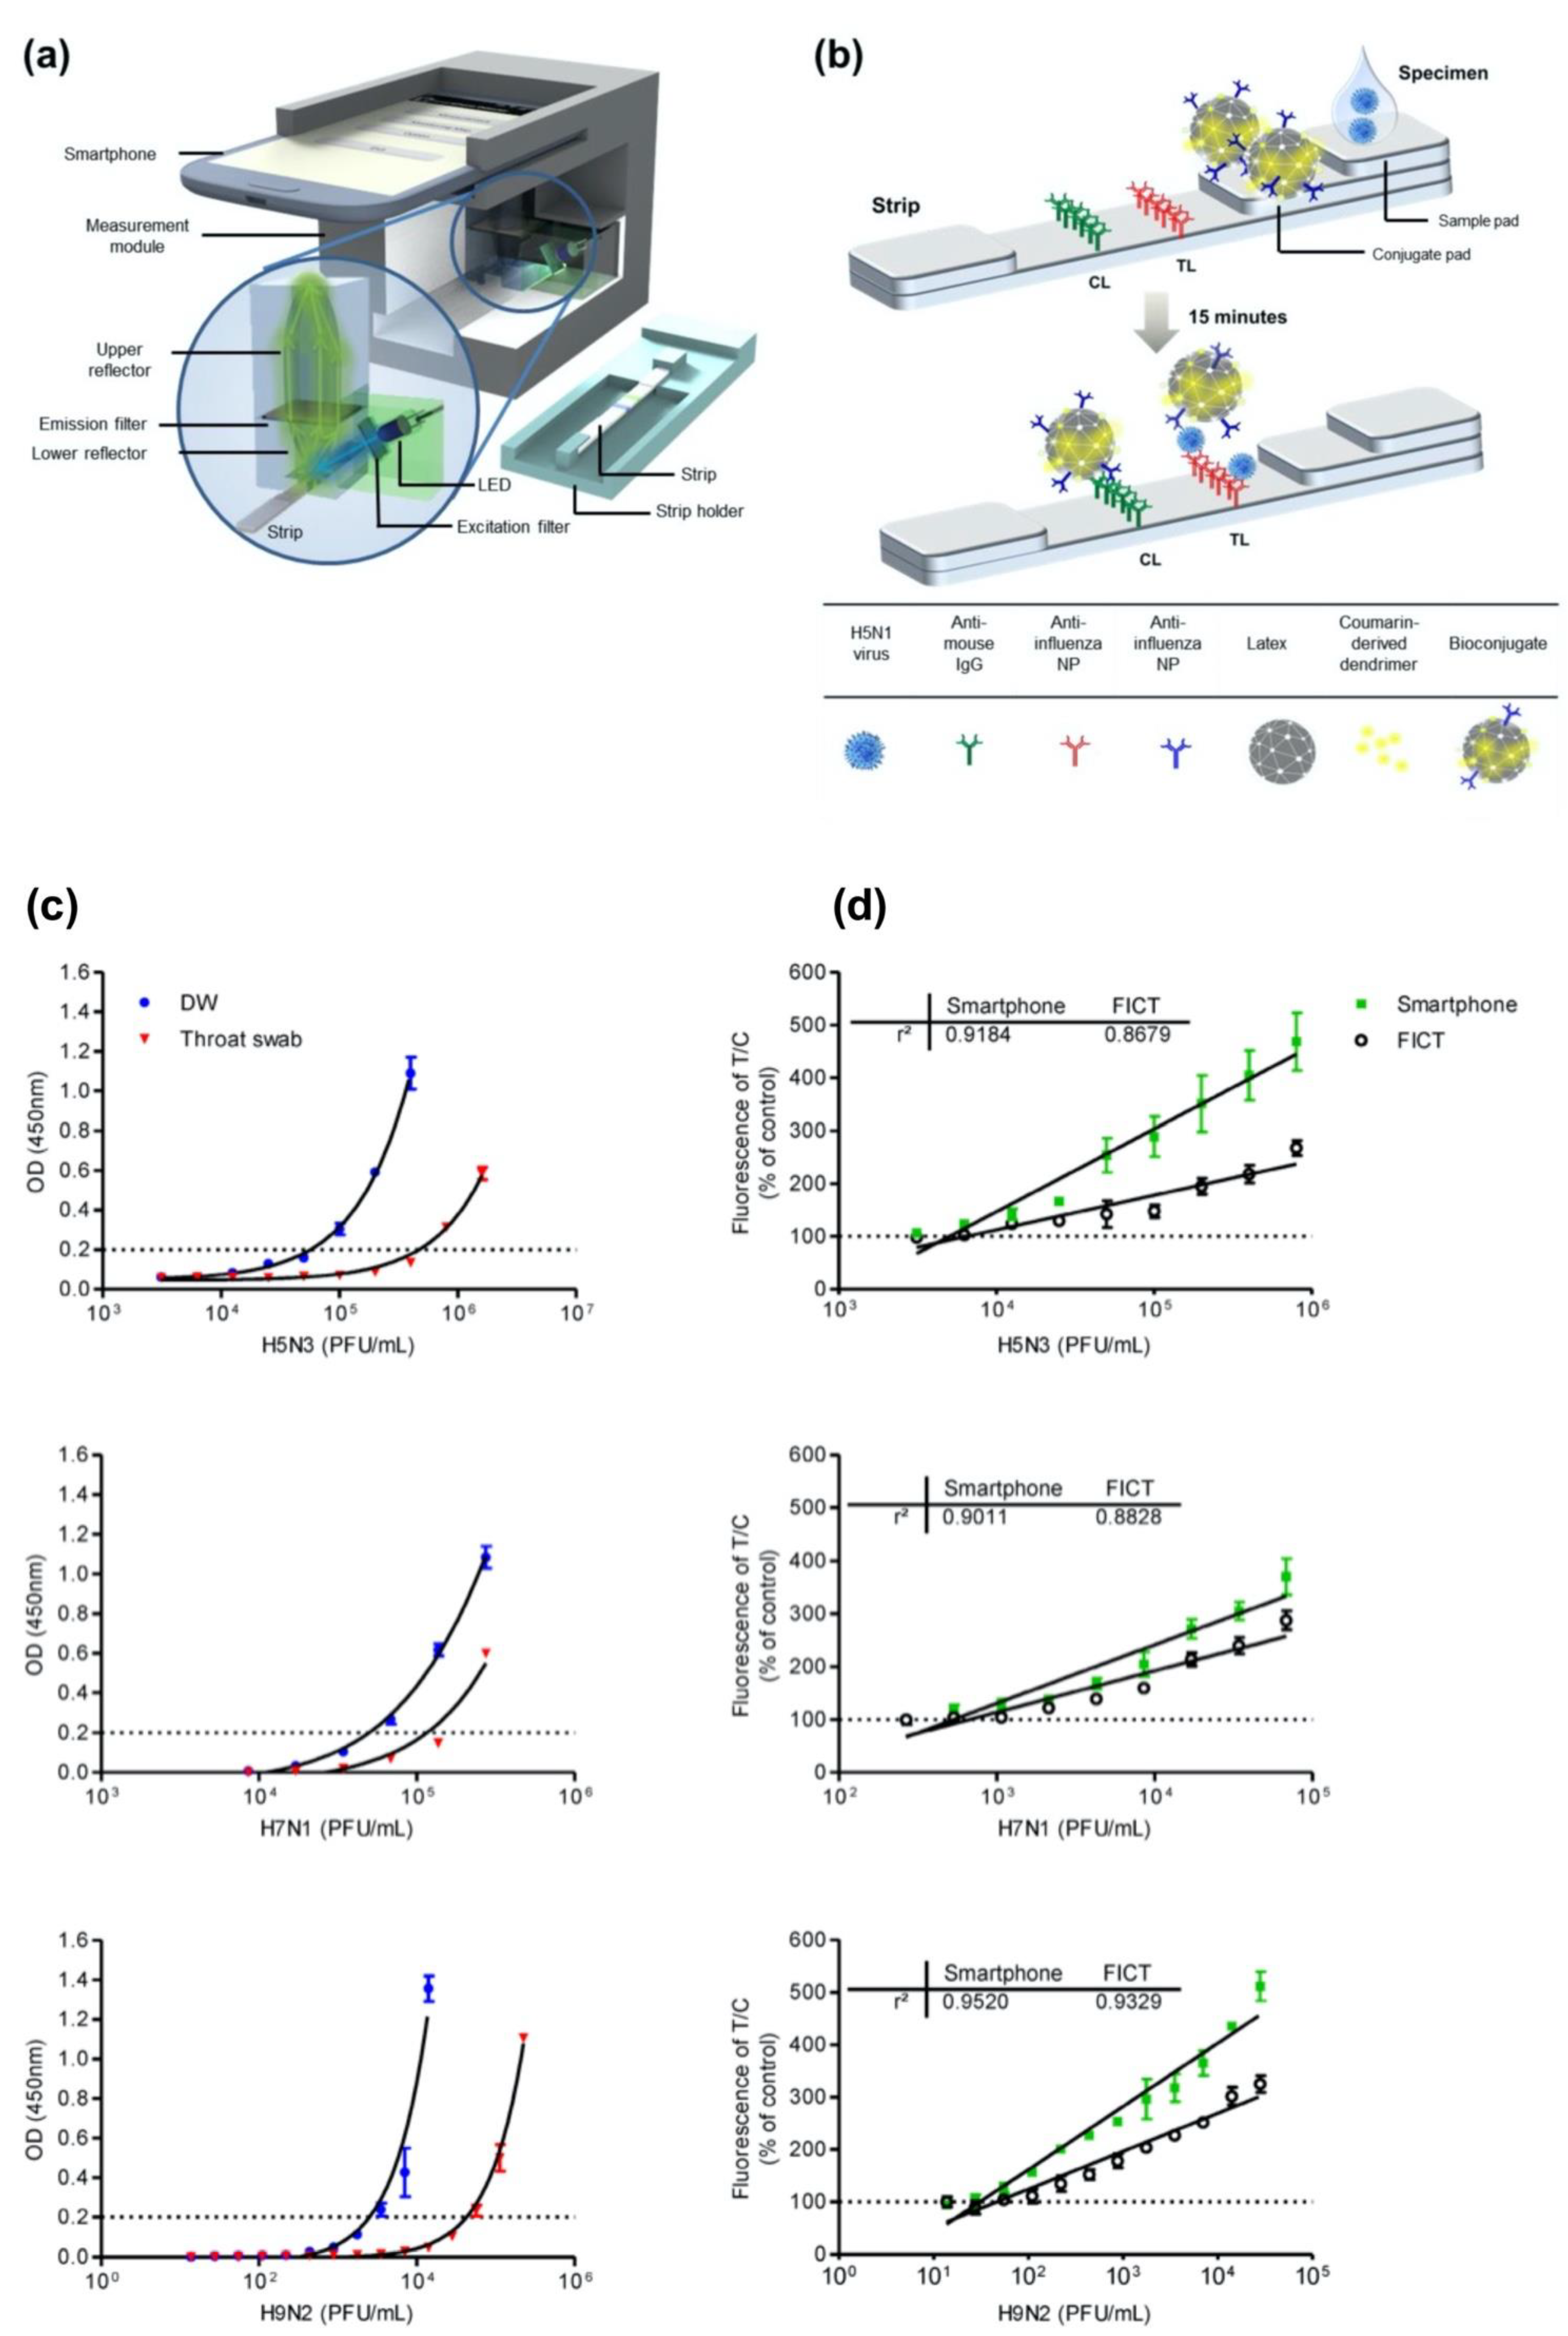
2.1. Fluorescence-Based Optical Sensors for Virus Detection
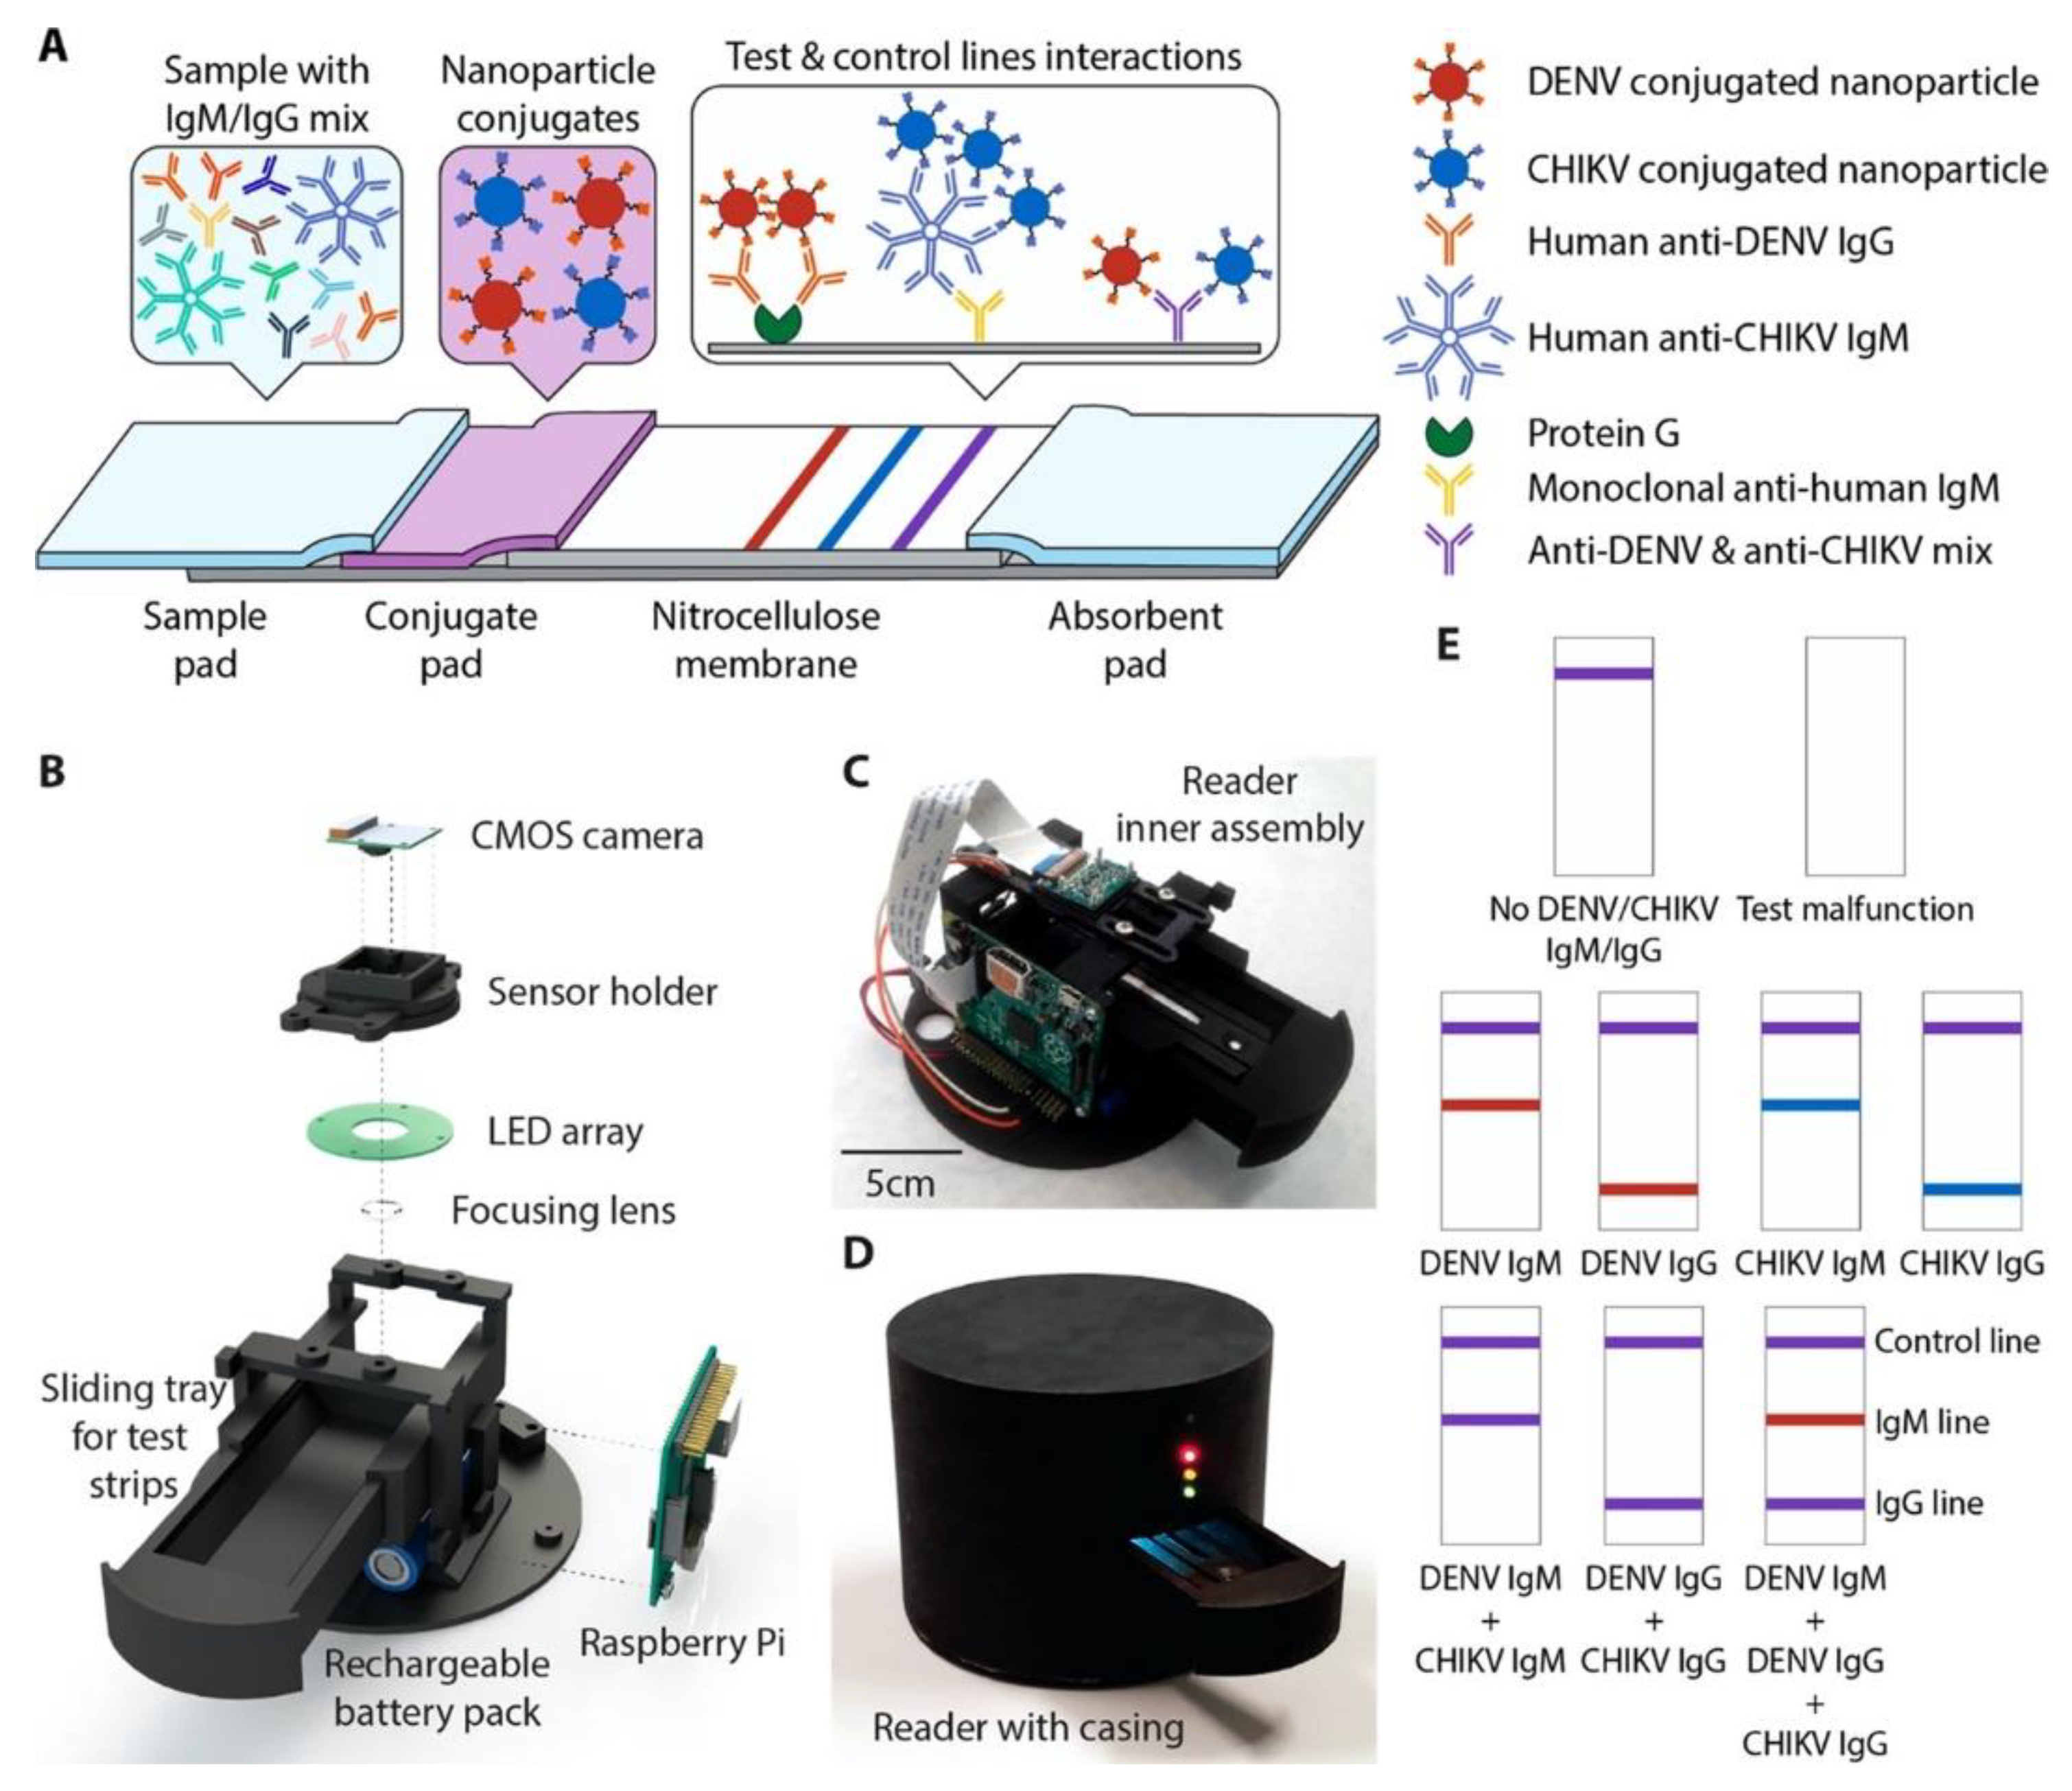
2.2. Colorimetric Biosensors for Virus Detection
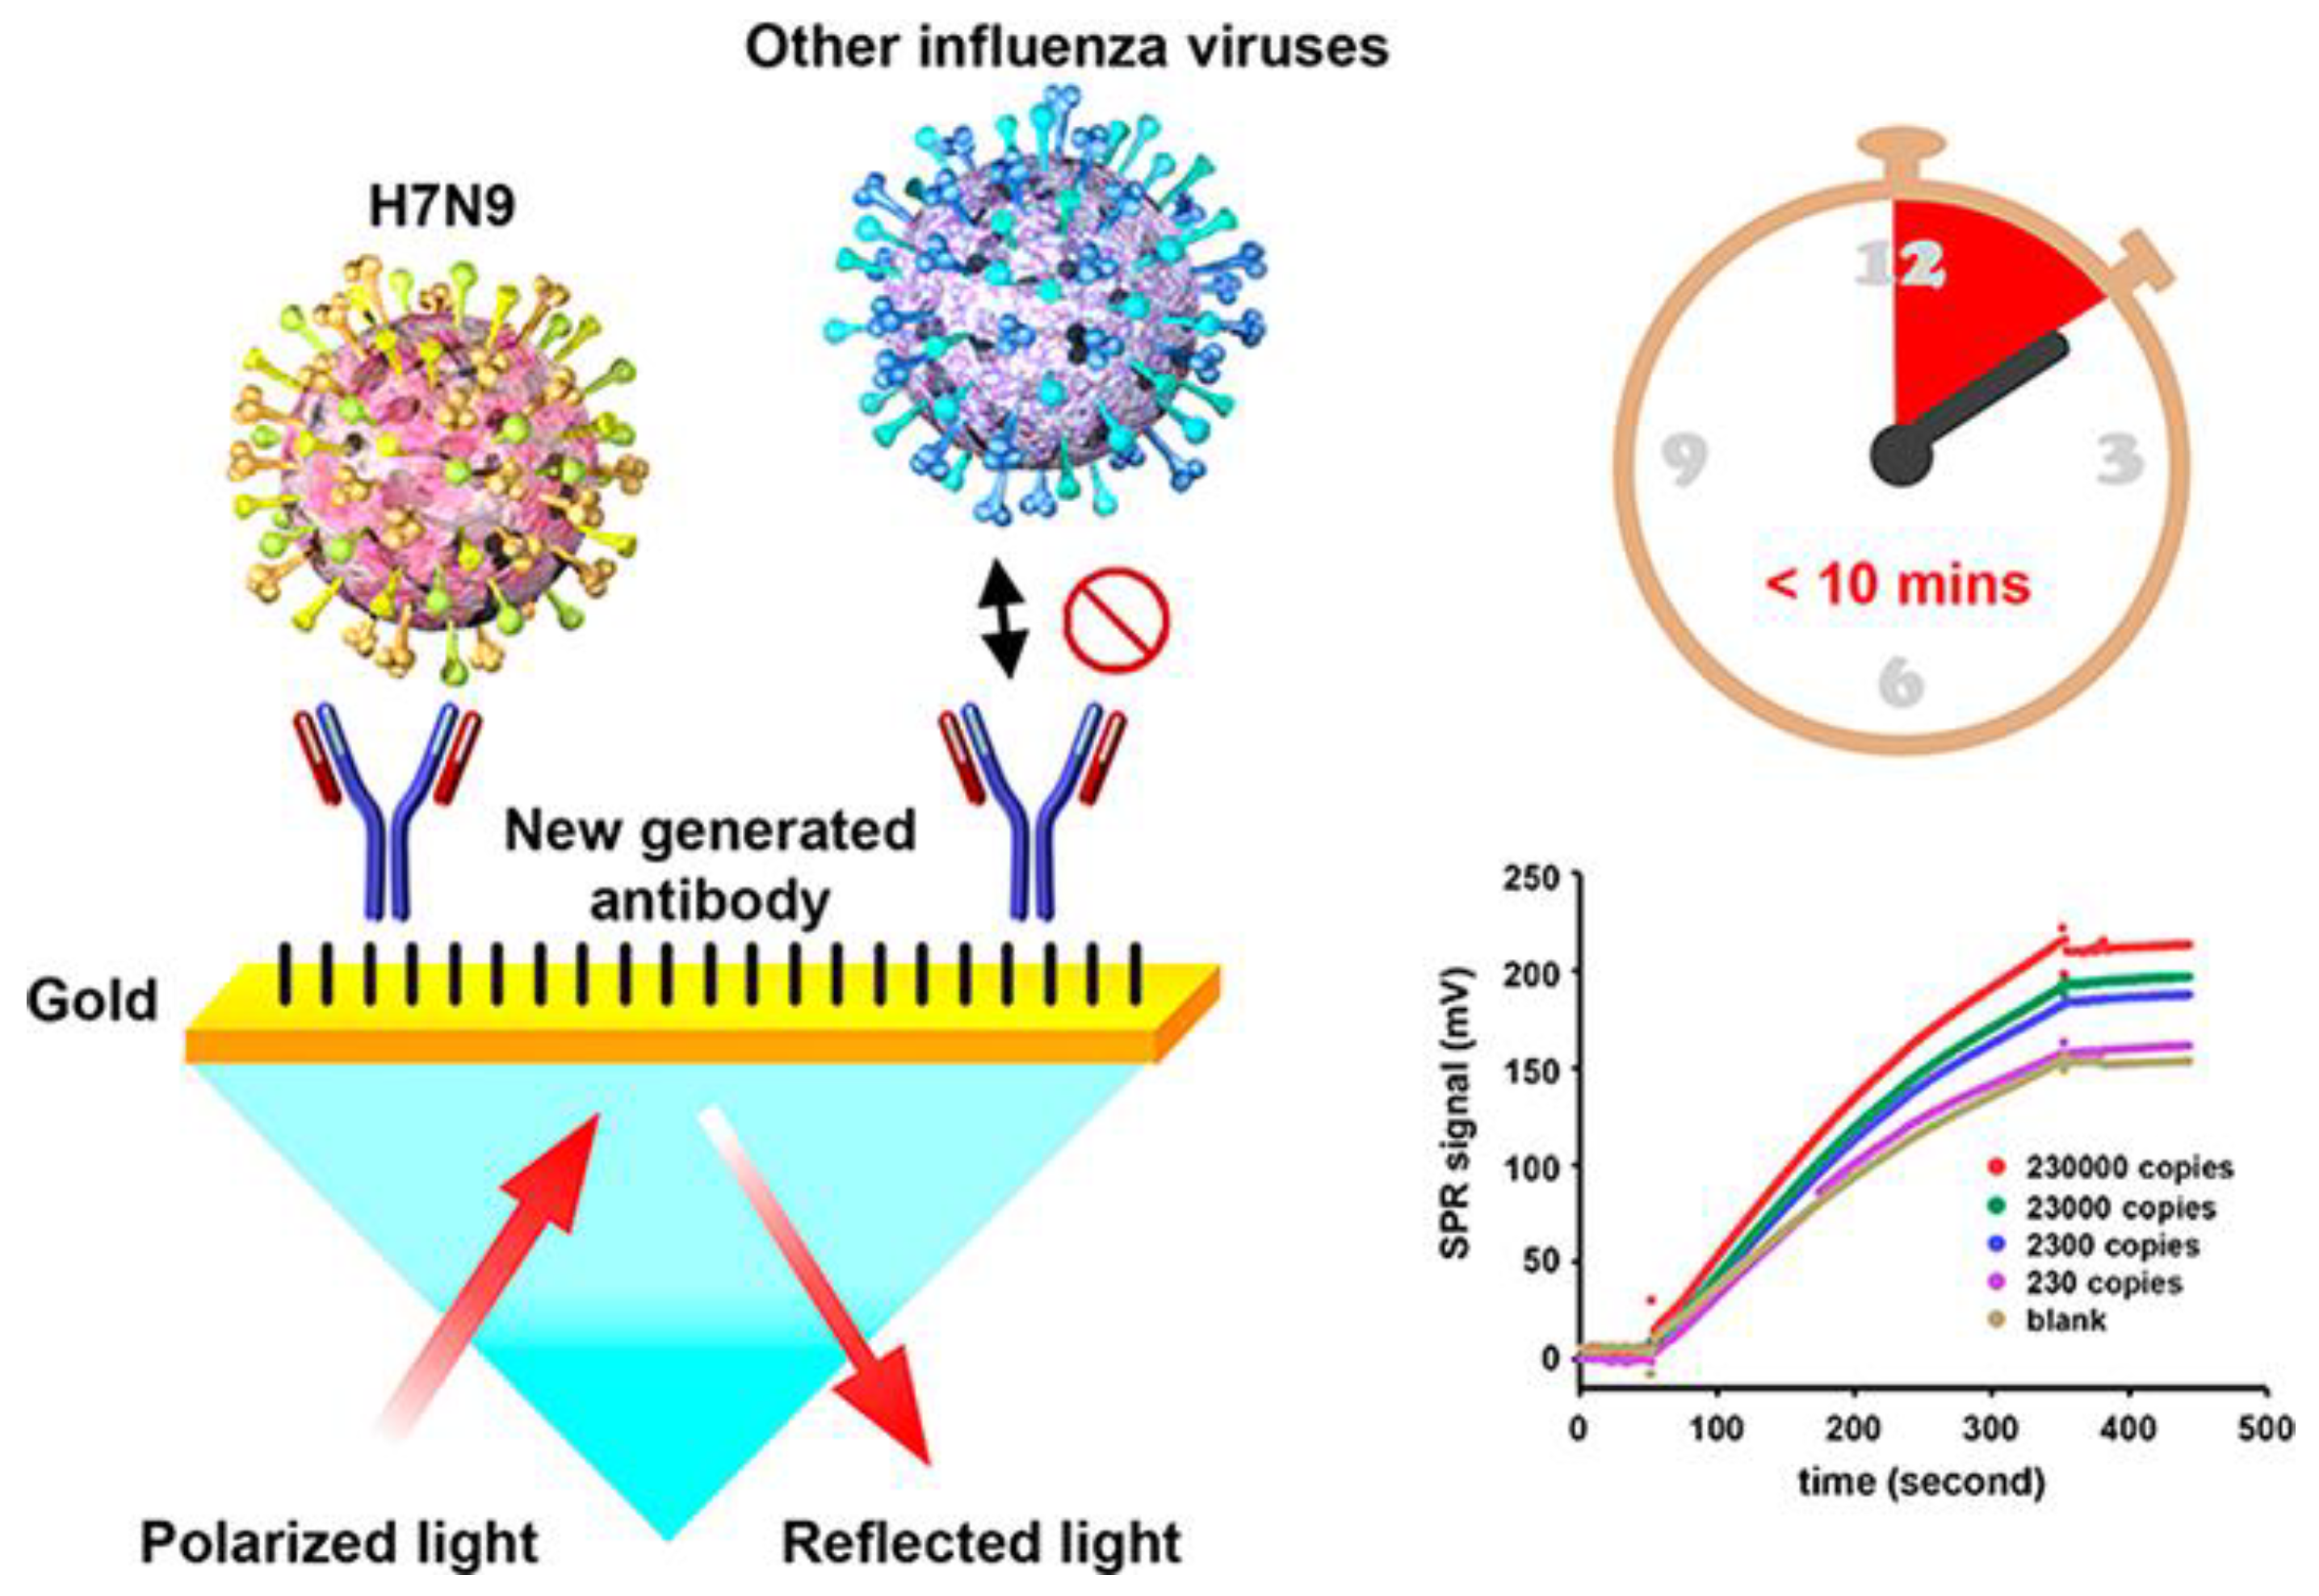
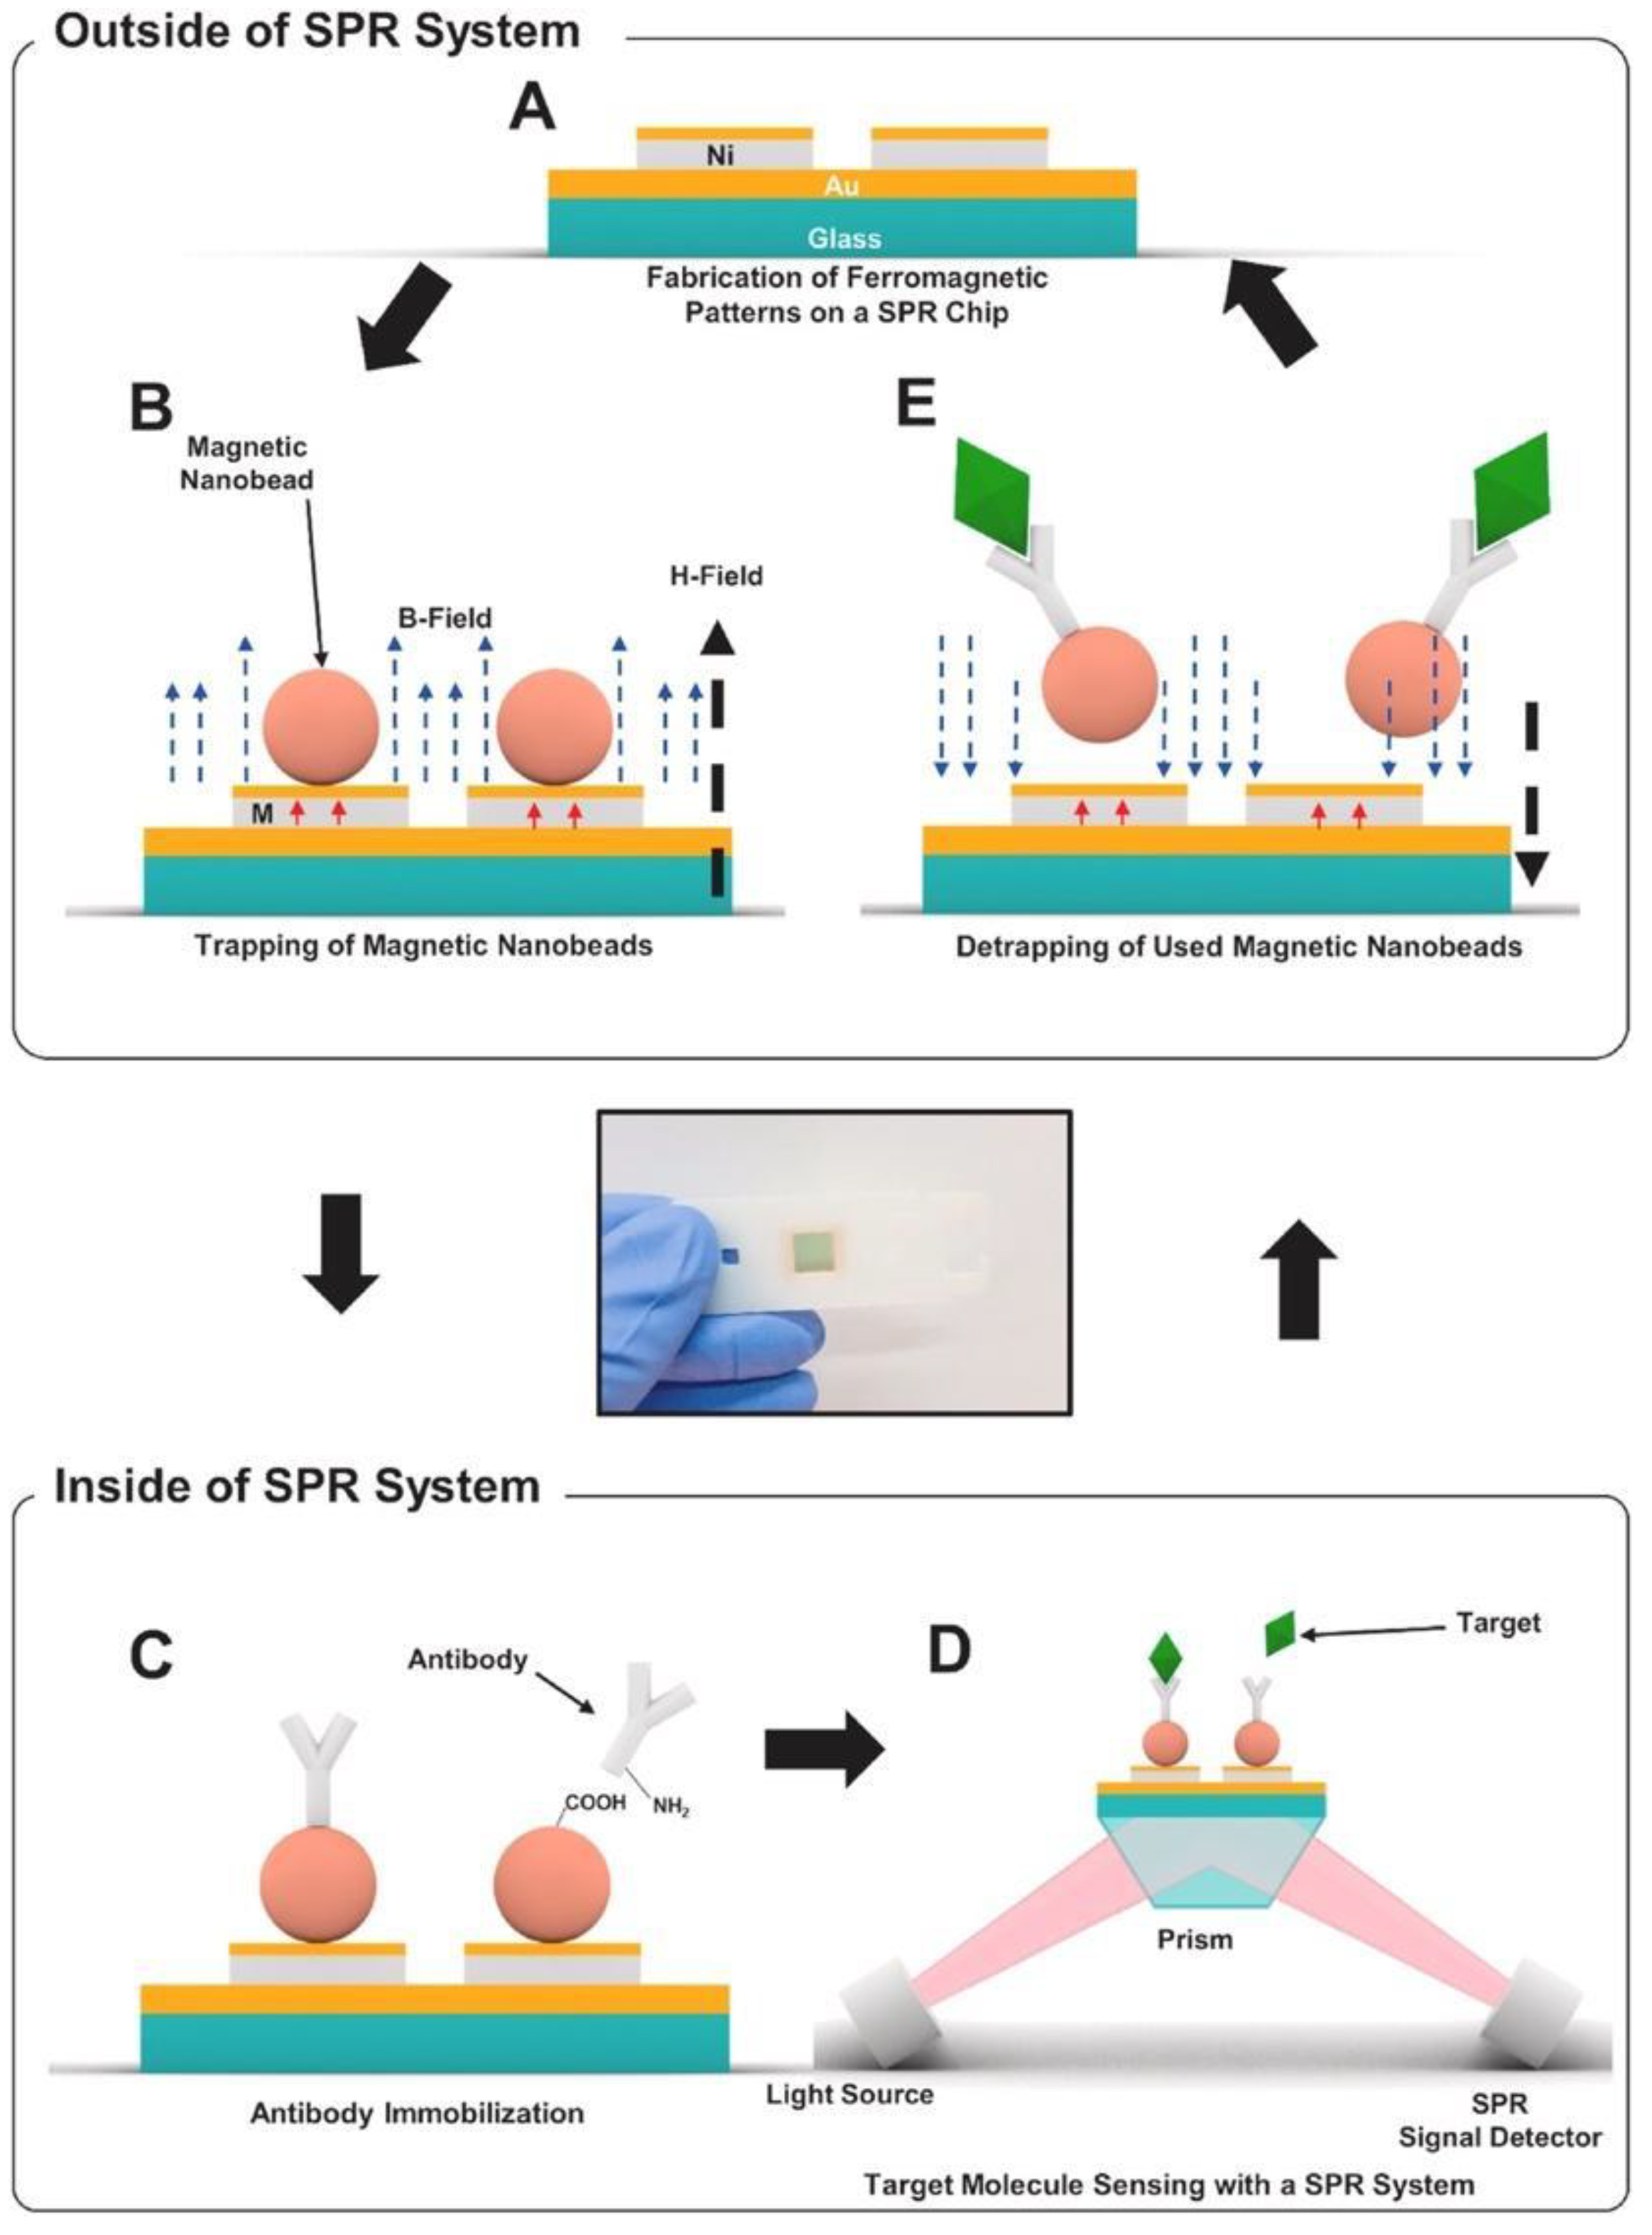
2.3. Virus Detection with Surface Plasmon Resonance and Localized Surface Plasmon Resonance
2.4. Virus Detection with Surface-Enhanced Raman Scattering
2.5. Optical Resonators for Virus Detection
2.6. Interferometry-Based Sensor Platforms

2.7. Virus Diagnostics Applications of SP-IRIS
3. Conclusions
Author Contributions
Funding
Institutional Review Board Statement
Informed Consent Statement
Data Availability Statement
Acknowledgments
Conflicts of Interest
References
- COVID19-Map—Johns Hopkins Coronavirus Resource Center. Available online: https://coronavirus.jhu.edu/map.html (accessed on 9 March 2023).
- Raoult, D.; Mouffok, N.; Bitam, I.; Piarroux, R.; Drancourt, M. Plague: History and contemporary analysis. J. Infect. 2013, 66, 18–26. [Google Scholar] [CrossRef] [PubMed]
- Harris, J.B.; LaRocque, R.C.; Qadri, F.; Ryan, E.T.; Calderwood, S.B. Cholera. Lancet 2012, 379, 2466–2476. [Google Scholar] [CrossRef] [PubMed]
- Saunders-Hastings, P.R.; Krewski, D. Reviewing the history of pandemic influenza: Understanding patterns of emergence and transmission. Pathogens 2016, 5, 66. [Google Scholar] [CrossRef]
- Sharp, P.M.; Hahn, B.H. Origins of HIV and the AIDS pandemic. Cold Spring Harb. Perspect. Med. 2011, 1, a006841. [Google Scholar] [CrossRef] [PubMed]
- Johnson, N.P.A.S.; Mueller, J. Updating the accounts: Global mortality of the 1918–1920 ‘Spanish’ influenza pandemic. Bull. Hist. Med. 2002, 76, 105–115. [Google Scholar] [CrossRef] [PubMed]
- Babic, N.; Garner, K.S.; Hirschhorn, J.W.; Zebian, R.; Nolte, F.S. Evaluation of Abbott ID NOW COVID-19 POC test performance characteristics and integration in the regional health network workflows to improve health care delivery. Clin. Biochem. 2021, 117, 69–73. [Google Scholar] [CrossRef]
- Steininger, C.; Kundi, M.; Aberle, S.W.; Aberle, J.H.; Popow-Kraupp, T. Effectiveness of Reverse Transcription-PCR, Virus Isolation, and Enzyme-Linked Immunosorbent Assay for Diagnosis of Influenza A Virus Infection in Different Age Groups. J. Clin. Microbiol. 2002, 40, 2051–2056. [Google Scholar] [CrossRef] [PubMed]
- Henrickson, K.J. Advances in the laboratory diagnosis of viral respiratory disease. Pediatr. Infect. Dis. J. 2004, 23, S6–S10. [Google Scholar] [CrossRef]
- Burrell, C.J.; Howard, C.R.; Murphy, F.A. Laboratory Diagnosis of Virus Diseases. Fenner White Med. Virol. 2017, 135–154. [Google Scholar] [CrossRef]
- Vainionpää, R.; Leinikki, P. Diagnostic Techniques: Serological and Molecular Approaches. Encycl. Virol. 2008, 29–37. [Google Scholar] [CrossRef]
- Tahamtan, A.; Ardebili, A. Real-time RT-PCR in COVID-19 detection: Issues affecting the results. Expert Rev. Mol. Diagn. 2020, 20, 453–454. [Google Scholar] [CrossRef] [PubMed]
- Sahajpal, N.S.; Mondal, A.K.; Njau, A.; Ananth, S.; Jones, K.; Ahluwalia, P.K.; Ahluwalia, M.; Jilani, Y.; Chaubey, A.; Hegde, M.; et al. Proposal of RT-PCR–Based Mass Population Screening for Severe Acute Respiratory Syndrome Coronavirus 2 (Coronavirus Disease 2019). J. Mol. Diagn. 2020, 22, 1294–1299. [Google Scholar] [CrossRef] [PubMed]
- Yüce, M.; Filiztekin, E.; Özkaya, K.G. COVID-19 diagnosis—A review of current methods. Biosens. Bioelectron. 2021, 172, 112752. [Google Scholar] [CrossRef] [PubMed]
- Dronina, J.; Samukaite-Bubniene, U.; Ramanavicius, A. Advances and insights in the diagnosis of viral infections. J. Nanobiotechnol. 2021, 19, 348. [Google Scholar] [CrossRef] [PubMed]
- Soh, J.H.; Balleza, E.; Abdul Rahim, M.N.; Chan, H.-M.; Mohd Ali, S.; Chuah, J.K.C.; Edris, S.; Atef, A.; Bahieldin, A.; Ying, J.Y.; et al. CRISPR-based systems for sensitive and rapid on-site COVID-19 diagnostics. Trends Biotechnol. 2022, 40, 1346–1360. [Google Scholar] [CrossRef]
- Drain, P.; Sulaiman, R.; Hoppers, M.; Lindner, N.M.; Lawson, V.; Ellis, J.E. Performance of the LumiraDx Microfluidic Immunofluorescence Point-of-Care SARS-CoV-2 Antigen Test in Asymptomatic Adults and Children. Am. J. Clin. Pathol. 2021, 157, 602–607. [Google Scholar] [CrossRef]
- Young, S.; Taylor, S.N.; Cammarata, C.L.; Varnado, K.G.; Roger-Dalbert, C.; Montano, A.; Griego-Fullbright, C.; Burgard, C.; Fernandez, C.; Eckert, K.; et al. Clinical Evaluation of BD Veritor SARS-CoV-2 Point-of-Care Test Performance Compared to PCR-Based Testing and versus the Sofia 2 SARS Antigen Point-of-Care Test. J. Clin. Microbiol. 2020, 59, e02338-20. [Google Scholar] [CrossRef]
- Chau, C.H.; Strope, J.D.; Figg, W.D. COVID-19 Clinical Diagnostics and Testing Technology. Pharmacother. J. Hum. Pharmacol. Drug Ther. 2020, 40, 857–868. [Google Scholar] [CrossRef]
- Merkoçi, A.; Li, C.; Lechuga, L.M.; Ozcan, A. COVID-19 biosensing technologies. Biosens. Bioelectron. 2021, 178, 113046. [Google Scholar] [CrossRef]
- Bhalla, N.; Jolly, P.; Formisano, N.; Estrela, P. Introduction to biosensors. Essays Biochem. 2016, 60, 1–8. [Google Scholar]
- Fan, X.; White, I.M.; Shopova, S.I.; Zhu, H.; Suter, J.D.; Sun, Y. Sensitive optical biosensors for unlabeled targets: A review. Anal. Chim. Acta 2008, 620, 8–26. [Google Scholar] [CrossRef] [PubMed]
- Damborský, P.; Švitel, J.; Katrlík, J. Optical biosensors. Essays Biochem. 2016, 60, 91–100. [Google Scholar]
- Masson, J.-F. Surface Plasmon Resonance Clinical Biosensors for Medical Diagnostics. ACS Sens. 2017, 2, 16–30. [Google Scholar] [CrossRef] [PubMed]
- Singh, A.K.; Mittal, S.; Das, M.; Saharia, A.; Tiwari, M. Optical biosensors: A decade in review. Alex. Eng. J. 2023, 67, 673–691. [Google Scholar] [CrossRef]
- Hejazi, M.S.; Pournaghi-Azar, M.H.; Ahour, F. Electrochemical detection of short sequences of hepatitis C 3a virus using a peptide nucleic acid-assembled gold electrode. Anal. Biochem. 2010, 399, 118–124. [Google Scholar] [CrossRef] [PubMed]
- Pournaghi-Azar, M.H.; Ahour, F.; Hejazi, M.S. Direct detection and discrimination of double-stranded oligonucleotide corresponding to hepatitis C virus genotype 3a using an electrochemical DNA biosensor based on peptide nucleic acid and double-stranded DNA hybridization. Anal. Bioanal. Chem. 2010, 397, 3581–3587. [Google Scholar] [CrossRef]
- Zheng, S.; Kim, D.-K.; Park, T.J.; Lee, S.J.; Lee, S.Y. Label-free optical diagnosis of hepatitis B virus with genetically engineered fusion proteins. Talanta 2010, 82, 803–809. [Google Scholar] [CrossRef]
- Gupta, B.D.; Shrivastav, A.M.; Usha, S.P. Surface Plasmon Resonance-Based Fiber Optic Sensors Utilizing Molecular Imprinting. Sensors 2016, 16, 1381. [Google Scholar] [CrossRef]
- Nanjunda, S.B.; Seshadri, V.N.; Krishnan, C.; Rath, S.; Arunagiri, S.; Bao, Q.; Helmerson, K.; Zhang, H.; Jain, R.; Sundarrajan, A.; et al. Emerging nanophotonic biosensor technologies for virus detection. Nanophotonics 2022, 11, 5041–5059. [Google Scholar] [CrossRef]
- Meeseepong, M.; Ghosh, G.; Shrivastava, S.; Lee, N.-E. Fluorescence-Enhanced Microfluidic Biosensor Platform Based on Magnetic Beads with Highly Stable ZnO Nanorods for Biomarker Detection. ACS Appl. Mater. Interfaces 2023, 15, 21754–21765. [Google Scholar] [CrossRef]
- Hsu, C.; Yang, Y.; Kannisto, E.; Zeng, X.; Yu, G.; Patnaik, S.K.; Dy, G.K.; Reid, M.E.; Gan, Q.; Wu, Y. Simultaneous Detection of Tumor Derived Exosomal Protein−MicroRNA Pairs with an Exo-PROS Biosensor for Cancer Diagnosis. ACS Nano 2023, 17, 8108–8122. [Google Scholar] [CrossRef] [PubMed]
- Peltomaa, R.; Glahn-Martínez, B.; Benito-Peña, E.; Moreno-Bondi, M.C. Optical Biosensors for Label-Free Detection of Small Molecules. Sensors 2018, 18, 4126. [Google Scholar] [CrossRef] [PubMed]
- Khansili, N.; Rattu, G.; Krishna, P.M. Label-free optical biosensors for food and biological sensor applications. Sens. Actuators B Chem. 2018, 265, 35–49. [Google Scholar] [CrossRef]
- Daaboul, G.G.; Lopez, C.A.; Yurt, A.; Goldberg, B.B.; Connor, J.H.; Ünlü, M.S. Label-free optical biosensors for virus detection and characterization. IEEE J. Sel. Top. Quantum Electron. 2012, 18, 1422–1433. [Google Scholar] [CrossRef]
- Nava, G.; Zanchetta, G.; Giavazzi, F.; Buscaglia, M. Label-free optical biosensors in the pandemic era. Nanophotonics 2022, 11, 4159–4181. [Google Scholar] [CrossRef]
- Calvo-Lozano, O.; García-Aparicio, P.; Raduly, L.Z.; Estévez, M.C.; Berindan-Neagoe, I.; Ferracin, M.; Lechuga, L.M. One-Step and Real-Time Detection of microRNA-21 in Human Samples for Lung Cancer Biosensing Diagnosis. Anal. Chem. 2022, 94, 14659–14665. [Google Scholar] [CrossRef]
- Mehrotra, P. Biosensors and their applications—A review. J. Oral Biol. Craniofacial Res. 2016, 6, 153–159. [Google Scholar] [CrossRef] [PubMed]
- Celiker, T.; Ghorbanizamani, F.; Moulahoum, H.; Guler Celik, E.; Tok, K.; Zihnioglu, F.; Cicek, C.; Sertoz, R.; Arda, B.; Goksel, T.; et al. Fluorescent bioassay for SARS-CoV-2 detection using polypyrene-g-poly(ε-caprolactone) prepared by simultaneous photoinduced step-growth and ring-opening polymerizations. Microchim. Acta 2022, 189, 202. [Google Scholar] [CrossRef]
- Sharma, A.; Mishra, R.K.; Goud, K.Y.; Mohamed, M.A.; Kummari, S.; Tiwari, S.; Li, Z.; Narayan, R.; Stanciu, L.A.; Marty, J.L. Optical biosensors for diagnostics of infectious viral disease: A recent update. Diagnostics 2021, 11, 2083. [Google Scholar] [CrossRef]
- Kulzer, F.; Orrit, M. Single-Molecule Optics. Annu. Rev. Phys. Chem. 2004, 55, 585–611. [Google Scholar] [CrossRef]
- Shirani, M.; Kalantari, H.; Khodayar, M.J.; Kouchak, M.; Rahbar, N. A novel strategy for detection of small molecules based on aptamer/gold nanoparticles/graphitic carbon nitride nanosheets as fluorescent biosensor. Talanta 2020, 219, 121235. [Google Scholar] [CrossRef] [PubMed]
- Salama, A.M.; Yasin, G.; Zourob, M.; Lu, J. Fluorescent Biosensors for the Detection of Viruses Using Graphene and Two-Dimensional Carbon Nanomaterials. Biosensors 2022, 12, 460. [Google Scholar] [CrossRef] [PubMed]
- Clegg, R.M. Fluorescence resonance energy transfer. Curr. Opin. Biotechnol. 1995, 6, 103–110. [Google Scholar] [CrossRef] [PubMed]
- Maddali, H.; Miles, C.E.; Kohn, J.; O’Carroll, D.M. Optical Biosensors for Virus Detection: Prospects for SARS-CoV-2/COVID-19. ChemBioChem 2021, 22, 1176–1189. [Google Scholar] [CrossRef]
- Sharma, A.; Khan, R.; Catanante, G.; Sherazi, T.A.; Bhand, S.; Hayat, A.; Marty, J.L. Designed Strategies for Fluorescence-Based Biosensors for the Detection of Mycotoxins. Toxins 2018, 10, 197. [Google Scholar] [CrossRef]
- Ekiz-Kanik, F.; Sevenler, D.D.; Ünlü, N.L.; Chiari, M.; Ünlü, M.S. Surface chemistry and morphology in single particle optical imaging. Nanophotonics 2017, 6, 713–730. [Google Scholar] [CrossRef]
- Tai, J.; Fan, S.; Ding, S.; Ren, L. Gold Nanoparticles Based Optical Biosensors for Cancer Biomarker Proteins: A Review of the Current Practices. Front. Bioeng. Biotechnol. 2022, 10, 877193. [Google Scholar] [CrossRef]
- Orooji, Y.; Sohrabi, H.; Hemmat, N.; Oroojalian, F.; Baradaran, B.; Mokhtarzadeh, A.; Mohaghegh, M.; Karimi-Maleh, H. An Overview on SARS-CoV-2 (COVID-19) and Other Human Coronaviruses and Their Detection Capability via Amplification Assay, Chemical Sensing, Biosensing, Immunosensing, and Clinical Assays. Nano-Micro Lett. 2021, 13, 18. [Google Scholar] [CrossRef] [PubMed]
- Xiao, M.; Tian, F.; Liu, X.; Zhou, Q.; Pan, J.; Luo, Z.; Yang, M.; Yi, C. Virus Detection: From State-of-the-Art Laboratories to Smartphone-Based Point-of-Care Testing. Adv. Sci. 2022, 9, 2105904. [Google Scholar] [CrossRef]
- Jiang, D.; Tian, Y.; Zhang, Y.; Lu, X.; Xiao, D.; Zhou, C. One-step fast and label-free imaging array for multiplexed detection of trace avian influenza viruses. Anal. Chim. Acta 2021, 1171, 338645. [Google Scholar] [CrossRef]
- Hepp, C.; Shiaelis, N.; Robb, N.C.; Vaughan, A.; Matthews, P.C.; Stoesser, N.; Crook, D.; Kapanidis, A.N. Viral detection and identification in 20 min by rapid single-particle fluorescence in-situ hybridization of viral RNA. Sci. Rep. 2021, 11, 19579. [Google Scholar] [CrossRef] [PubMed]
- Shiaelis, N.; Tometzki, A.; Peto, L.; McMahon, A.; Hepp, C.; Bickerton, E.; Favard, C.; Muriaux, D.; Andersson, M.; Oakley, S.; et al. Virus Detection and Identification in Minutes Using Single-Particle Imaging and Deep Learning. ACS Nano 2023, 17, 697–710. [Google Scholar] [CrossRef] [PubMed]
- Yeo, S.J.; Choi, K.; Cuc, B.T.; Hong, N.N.; Bao, D.T.; Ngoc, N.M.; Le, M.Q.; Hang, N.L.K.; Thach, N.C.; Mallik, S.K.; et al. Smartphone-based fluorescent diagnostic system for highly pathogenic H5N1 viruses. Theranostics 2016, 6, 231–242. [Google Scholar] [CrossRef] [PubMed]
- Xu, S.; Ouyang, W.; Xie, P.; Lin, Y.; Qiu, B.; Lin, Z.; Chen, G.; Guo, L. Highly Uniform Gold Nanobipyramids for Ultrasensitive Colorimetric Detection of Influenza Virus. Anal. Chem. 2017, 89, 1617–1623. [Google Scholar] [CrossRef] [PubMed]
- Choi, Y.; Hwang, J.H.; Lee, S.Y. Recent Trends in Nanomaterials-Based Colorimetric Detection of Pathogenic Bacteria and Viruses. Small Methods 2018, 2, 1700351. [Google Scholar] [CrossRef]
- Wu, Y.; Feng, J.; Hu, G.; Zhang, E.; Yu, H.-H. Colorimetric Sensors for Chemical and Biological Sensing Applications. Sensors 2023, 23, 2749. [Google Scholar] [CrossRef]
- Mauriz, E. Recent Progress in Plasmonic Biosensing Schemes for Virus Detection. Sensors 2020, 20, 4745. [Google Scholar] [CrossRef]
- Khoris, I.M.; Chowdhury, A.D.; Li, T.-C.; Suzuki, T.; Park, E.Y. Advancement of capture immunoassay for real-time monitoring of hepatitis E virus-infected monkey. Anal. Chim. Acta 2020, 1110, 64–71. [Google Scholar] [CrossRef]
- Loynachan, C.N.; Thomas, M.R.; Gray, E.R.; Richards, D.A.; Kim, J.; Miller, B.S.; Brookes, J.C.; Agarwal, S.; Chudasama, V.; McKendry, R.A.; et al. Platinum Nanocatalyst Amplification: Redefining the Gold Standard for Lateral Flow Immunoassays with Ultrabroad Dynamic Range. ACS Nano 2018, 12, 279–288. [Google Scholar] [CrossRef]
- Wang, R.; Ongagna-Yhombi, S.Y.; Lu, Z.; Centeno-Tablante, E.; Colt, S.; Cao, X.; Ren, Y.; Cárdenas, W.B.; Mehta, S.; Erickson, D. Rapid Diagnostic Platform for Colorimetric Differential Detection of Dengue and Chikungunya Viral Infections. Anal. Chem. 2019, 91, 5415–5423. [Google Scholar] [CrossRef]
- Fen, Y.W.; Yunus, W.M.M.; Yusof, N.A.; Ishak, N.S.; Omar, N.A.S.; Zainudin, A.A. Preparation, characterization and optical properties of ionophore doped chitosan biopolymer thin film and its potential application for sensing metal ion. Optik 2015, 126, 4688–4692. [Google Scholar] [CrossRef]
- Zainudin, A.A.; Fen, Y.W.; Yusof, N.A.; Omar, N.A.S. Structural, optical and sensing properties of ionophore doped graphene based bionanocomposite thin film. Optik 2017, 144, 308–315. [Google Scholar] [CrossRef]
- Omar, N.A.S.; Fen, Y.W. Recent development of SPR spectroscopy as potential method for diagnosis of dengue virus E-protein. Sens. Rev. 2018, 38, 106–116. [Google Scholar] [CrossRef]
- Murali, S.; Rustandi, R.R.; Zheng, X.; Payne, A.; Shang, L. Applications of Surface Plasmon Resonance and Biolayer Interferometry for Virus-Ligand Binding. Viruses 2022, 14, 717. [Google Scholar] [CrossRef]
- Rasooly, A.; Herold, K.E. Biosensors and Biodetection: Methods and Protocols. In Methods in Molecular Biology; Humana Press: Clifton, NJ, USA, 2009; pp. v–ix. [Google Scholar]
- Caygill, R.L.; Blair, G.E.; Millner, P.A. A review on viral biosensors to detect human pathogens. Anal. Chim. Acta 2010, 681, 8–15. [Google Scholar] [CrossRef]
- Zheng, X.; Bi, C.; Li, Z.; Podariu, M.; Hage, D.S. Analytical methods for kinetic studies of biological interactions: A review. J. Pharm. Biomed. Anal. 2015, 113, 163–180. [Google Scholar] [CrossRef]
- Hassan, M.M.; Sium, F.S.; Islam, F.; Choudhury, S.M. A review on plasmonic and metamaterial based biosensing platforms for virus detection. Sens. Bio-Sens. Res. 2021, 33, 100429. [Google Scholar] [CrossRef]
- Pandey, P.S.; Raghuwanshi, S.K.; Shadab, A.; Ansari, M.T.I.; Tiwari, U.K.; Kumar, S. SPR Based Biosensing Chip for COVID-19 Diagnosis—A Review. IEEE Sens. J. 2022, 22, 13800–13810. [Google Scholar] [CrossRef]
- Chang, Y.-F.; Wang, W.-H.; Hong, Y.-W.; Yuan, R.-Y.; Chen, K.-H.; Huang, Y.-W.; Lu, P.-L.; Chen, Y.-H.; Chen, Y.-M.A.; Su, L.-C.; et al. Simple Strategy for Rapid and Sensitive Detection of Avian Influenza a H7N9 Virus Based on Intensity-Modulated SPR Biosensor and New Generated Antibody. Anal. Chem. 2018, 90, 1861–1869. [Google Scholar] [CrossRef]
- Yoo, H.; Shin, J.; Sim, J.; Cho, H.; Hong, S. Reusable surface plasmon resonance biosensor chip for the detection of H1N1 influenza virus. Biosens. Bioelectron. 2020, 168, 112561. [Google Scholar] [CrossRef]
- Shrivastav, A.M.; Cvelbar, U.; Abdulhalim, I. A comprehensive review on plasmonic-based biosensors used in viral diagnostics. Commun. Biol. 2021, 4, 70. [Google Scholar] [CrossRef] [PubMed]
- Taghipour, A.; Heidarzadeh, H. Design and Analysis of Highly Sensitive LSPR-Based Metal-Insulator-Metal Nano-Discs as a Biosensor for Fast Detection of SARS-CoV-2. Photonics 2022, 9, 542. [Google Scholar] [CrossRef]
- Puiu, M.; Bala, C. SPR and SPR Imaging: Recent Trends in Developing Nanodevices for Detection and Real-Time Monitoring of Biomolecular Events. Sensors 2016, 16, 870. [Google Scholar] [CrossRef]
- Kabashin, A.V.; Evans, P.; Pastkovsky, S.; Hendren, W.; Wurtz, G.A.; Atkinson, R.; Pollard, R.; Podolskiy, V.A.; Zayats, A.V. Plasmonic nanorod metamaterials for biosensing. Nat. Mater. 2009, 8, 867–871. [Google Scholar] [CrossRef] [PubMed]
- Couture, M.; Zhao, S.S.; Masson, J.-F. Modern surface plasmon resonance for bioanalytics and biophysics. Phys. Chem. Chem. Phys. 2013, 15, 11190–11216. [Google Scholar] [CrossRef]
- Guo, L.; Jackman, J.A.; Yang, H.-H.; Chen, P.; Cho, N.-J.; Kim, D.-H. Strategies for enhancing the sensitivity of plasmonic nanosensors. Nano Today 2015, 10, 213–239. [Google Scholar] [CrossRef]
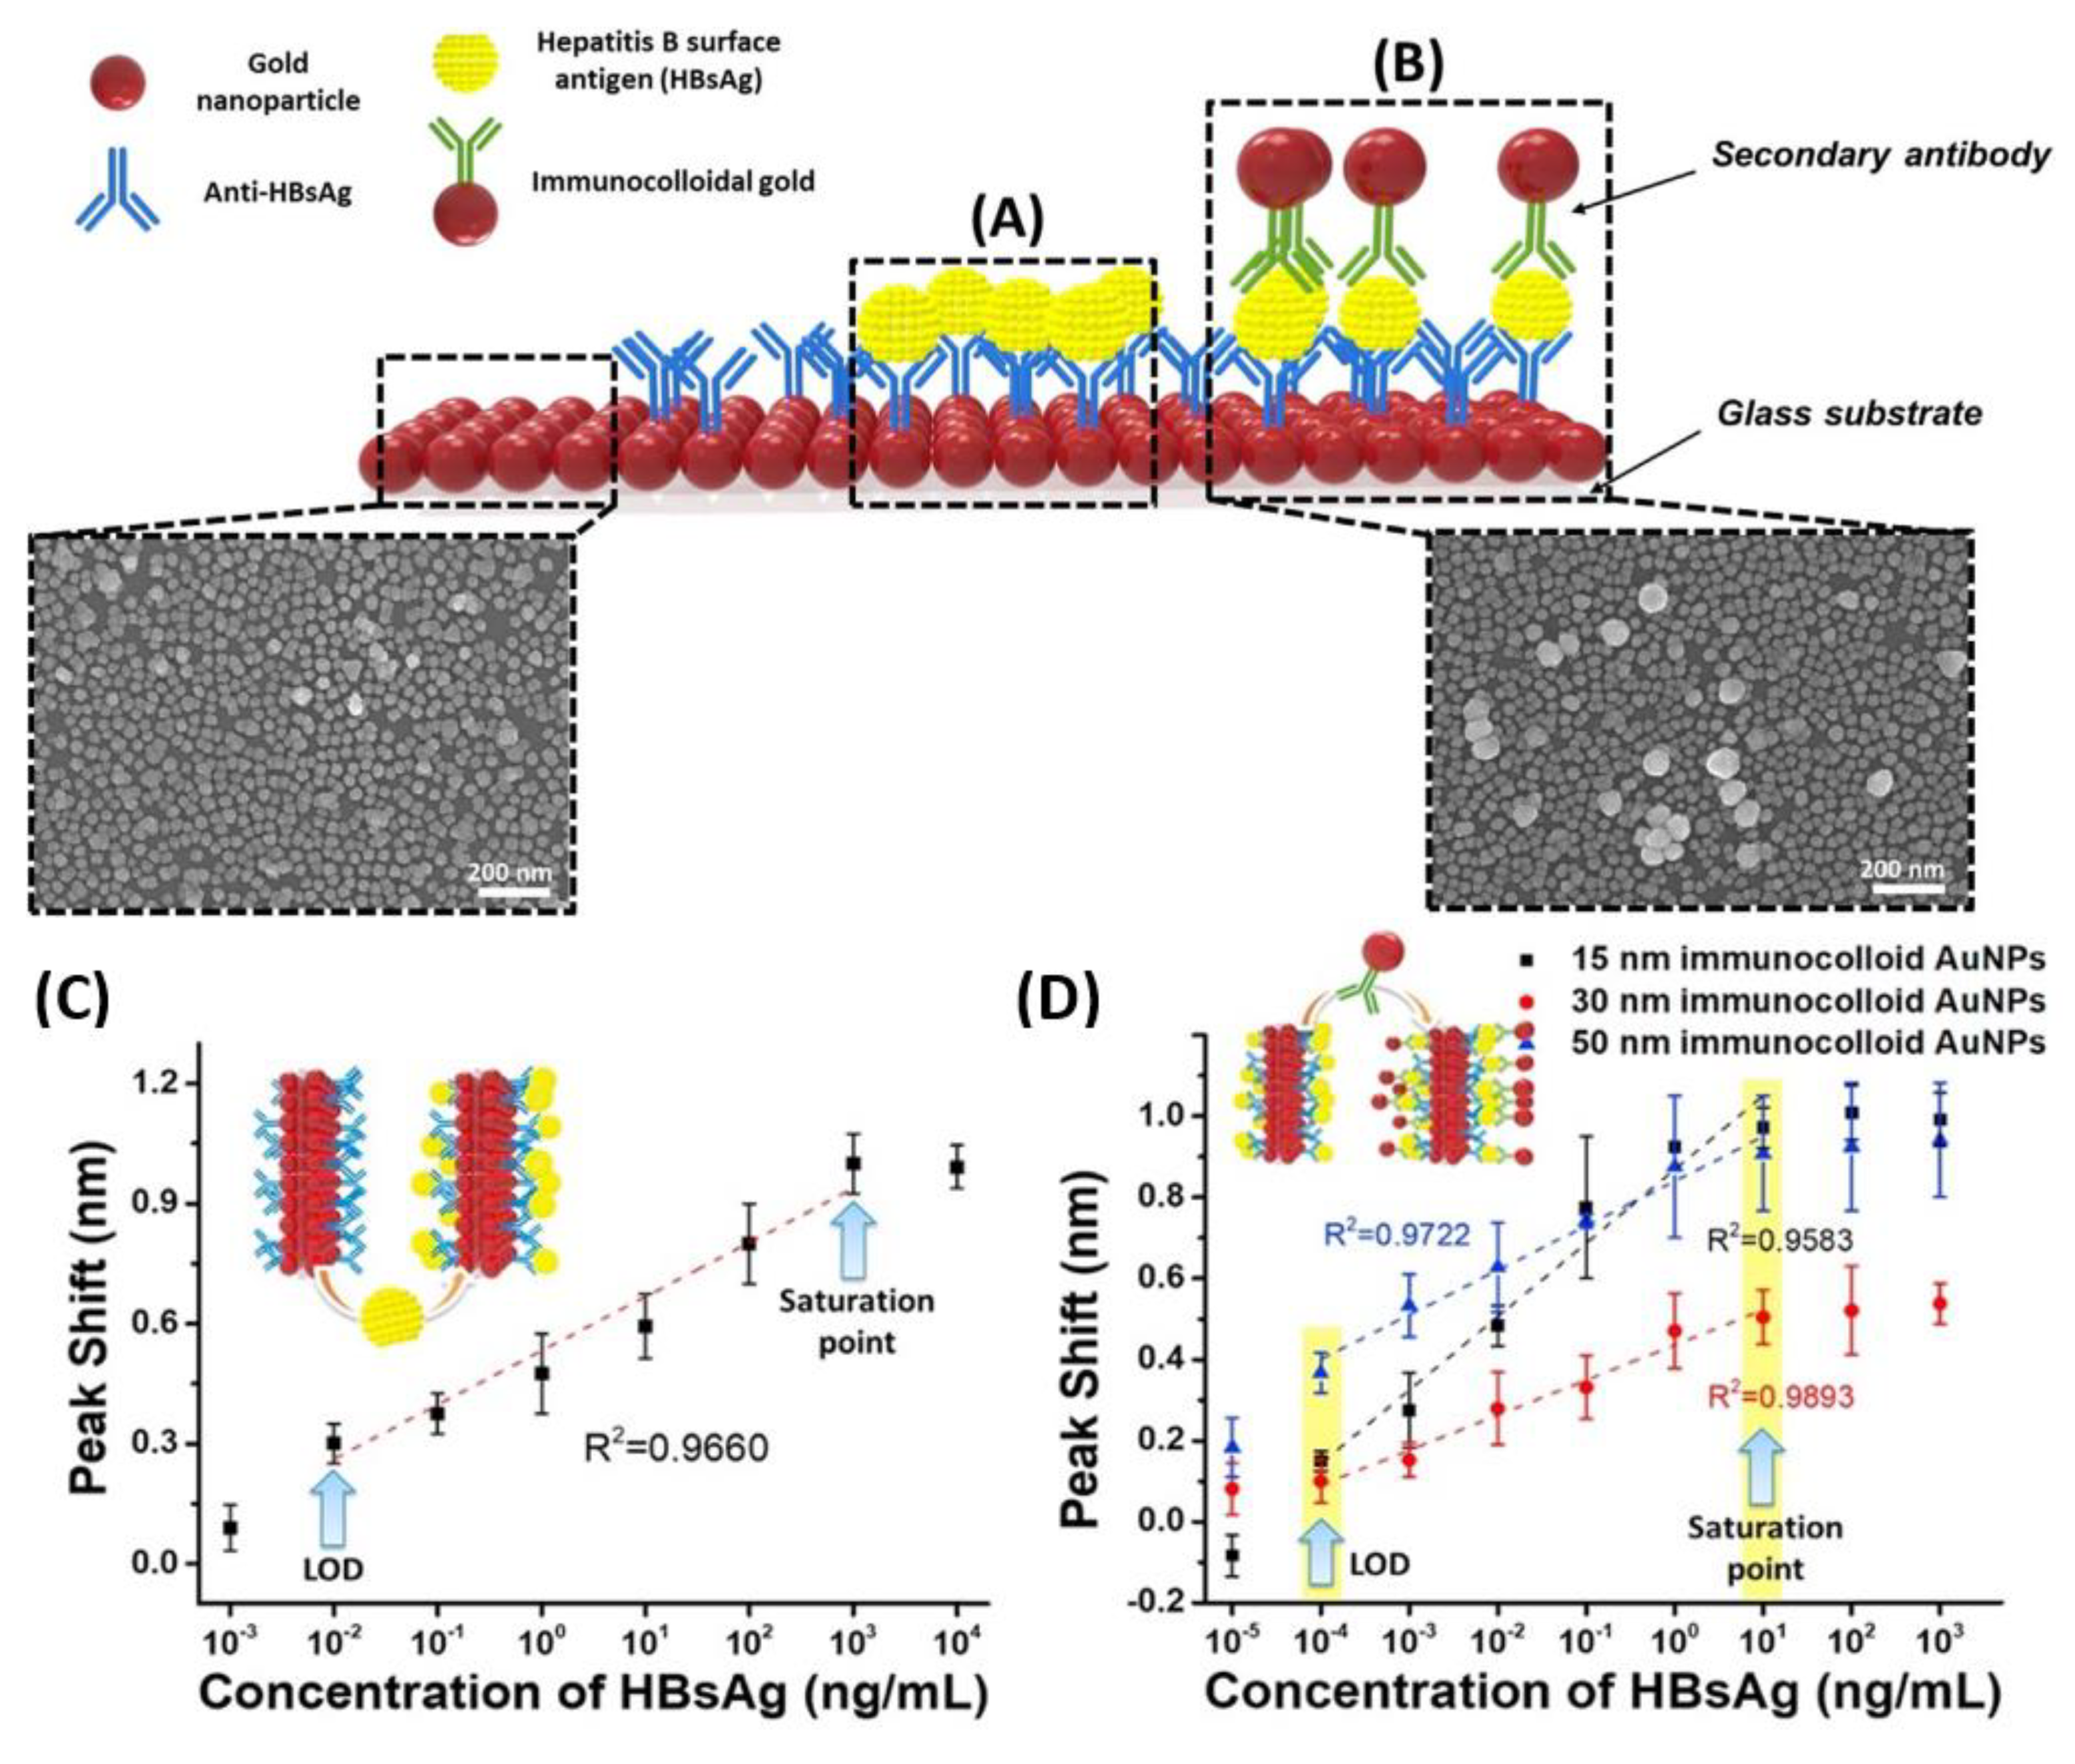
- Kim, J.; Oh, S.Y.; Shukla, S.; Hong, S.B.; Heo, N.S.; Bajpai, V.K.; Chun, H.S.; Jo, C.-H.; Choi, B.G.; Huh, Y.S.; et al. Heteroassembled gold nanoparticles with sandwich-immunoassay LSPR chip format for rapid and sensitive detection of hepatitis B virus surface antigen (HBsAg). Biosens. Bioelectron. 2018, 107, 118–122. [Google Scholar] [CrossRef] [PubMed]
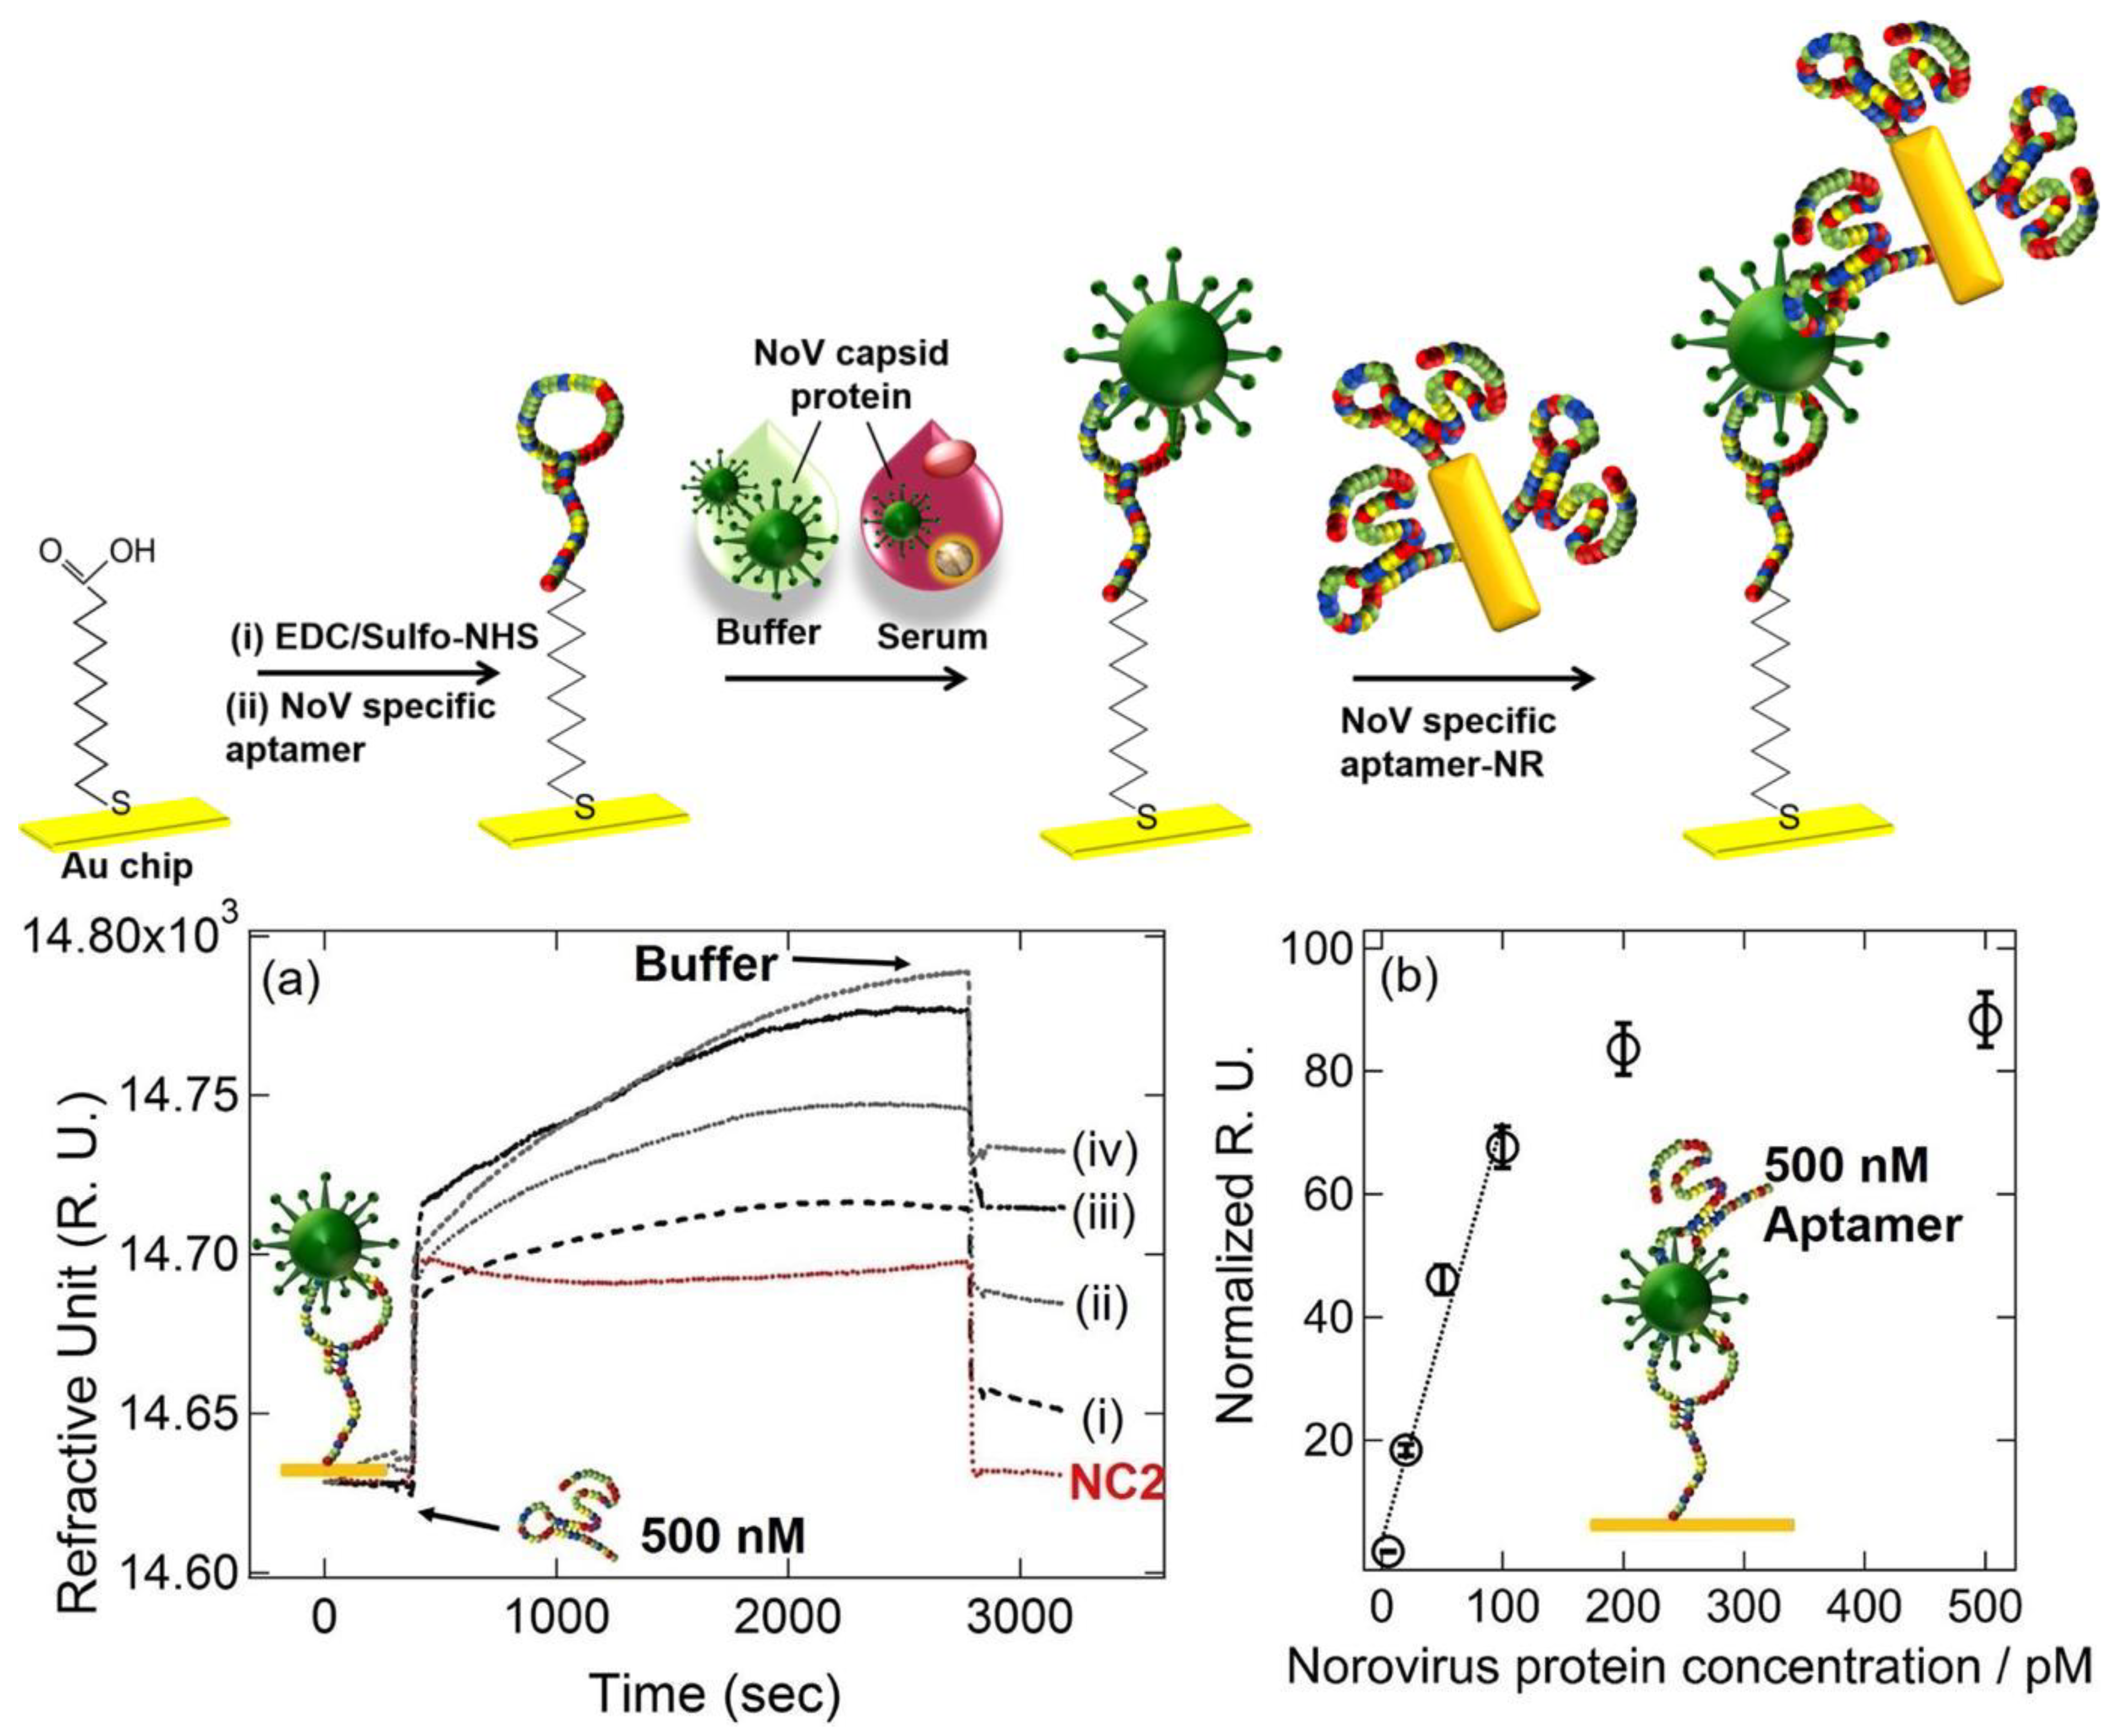
- Kim, S.; Lee, S.; Lee, H.J. An aptamer-aptamer sandwich assay with nanorod-enhanced surface plasmon resonance for attomolar concentration of norovirus capsid protein. Sens. Actuators B Chem. 2018, 273, 1029–1036. [Google Scholar] [CrossRef]
- Kenworthy, C.F.; Stoevelaar, L.P.; Alexander, A.J.; Gerini, G. Using the near field optical trapping effect of a dielectric metasurface to improve SERS enhancement for virus detection. Sci. Rep. 2021, 11, 6873. [Google Scholar] [CrossRef] [PubMed]
- Ali, A.; Nettey-Oppong, E.E.; Effah, E.; Yu, C.Y.; Muhammad, R.; Soomro, T.A.; Byun, K.M.; Choi, S.H. Miniaturized Raman Instruments for SERS-Based Point-of-Care Testing on Respiratory Viruses. Biosensors 2022, 12, 590. [Google Scholar] [CrossRef]
- Li, M.; Cushing, S.K.; Wu, N. Plasmon-enhanced optical sensors: A review. Analyst 2015, 140, 386–406. [Google Scholar] [CrossRef] [PubMed]
- Xia, J.; Li, W.; Sun, M.; Wang, H. Application of SERS in the Detection of Fungi, Bacteria and Viruses. Nanomaterials 2022, 12, 3572. [Google Scholar] [CrossRef]
- Mousavi, S.M.; Hashemi, S.A.; Rahmanian, V.; Kalashgrani, M.Y.; Gholami, A.; Omidifar, N.; Chiang, W.-H. Highly Sensitive Flexible SERS-Based Sensing Platform for Detection of COVID-19. Biosensors 2022, 12, 466. [Google Scholar] [CrossRef] [PubMed]
- Ambartsumyan, O.; Gribanyov, D.; Kukushkin, V.; Kopylov, A.; Zavyalova, E. SERS-Based Biosensors for Virus Determination with Oligonucleotides as Recognition Elements. Int. J. Mol. Sci. 2020, 21, 3373. [Google Scholar] [CrossRef] [PubMed]
- Saviñon-Flores, F.; Méndez, E.; López-Castaños, M.; Carabarin-Lima, A.; López-Castaños, K.A.; González-Fuentes, M.A.; Méndez-Albores, A. A Review on SERS-Based Detection of Human Virus Infections: Influenza and Coronavirus. Biosensors 2021, 11, 66. [Google Scholar] [CrossRef]
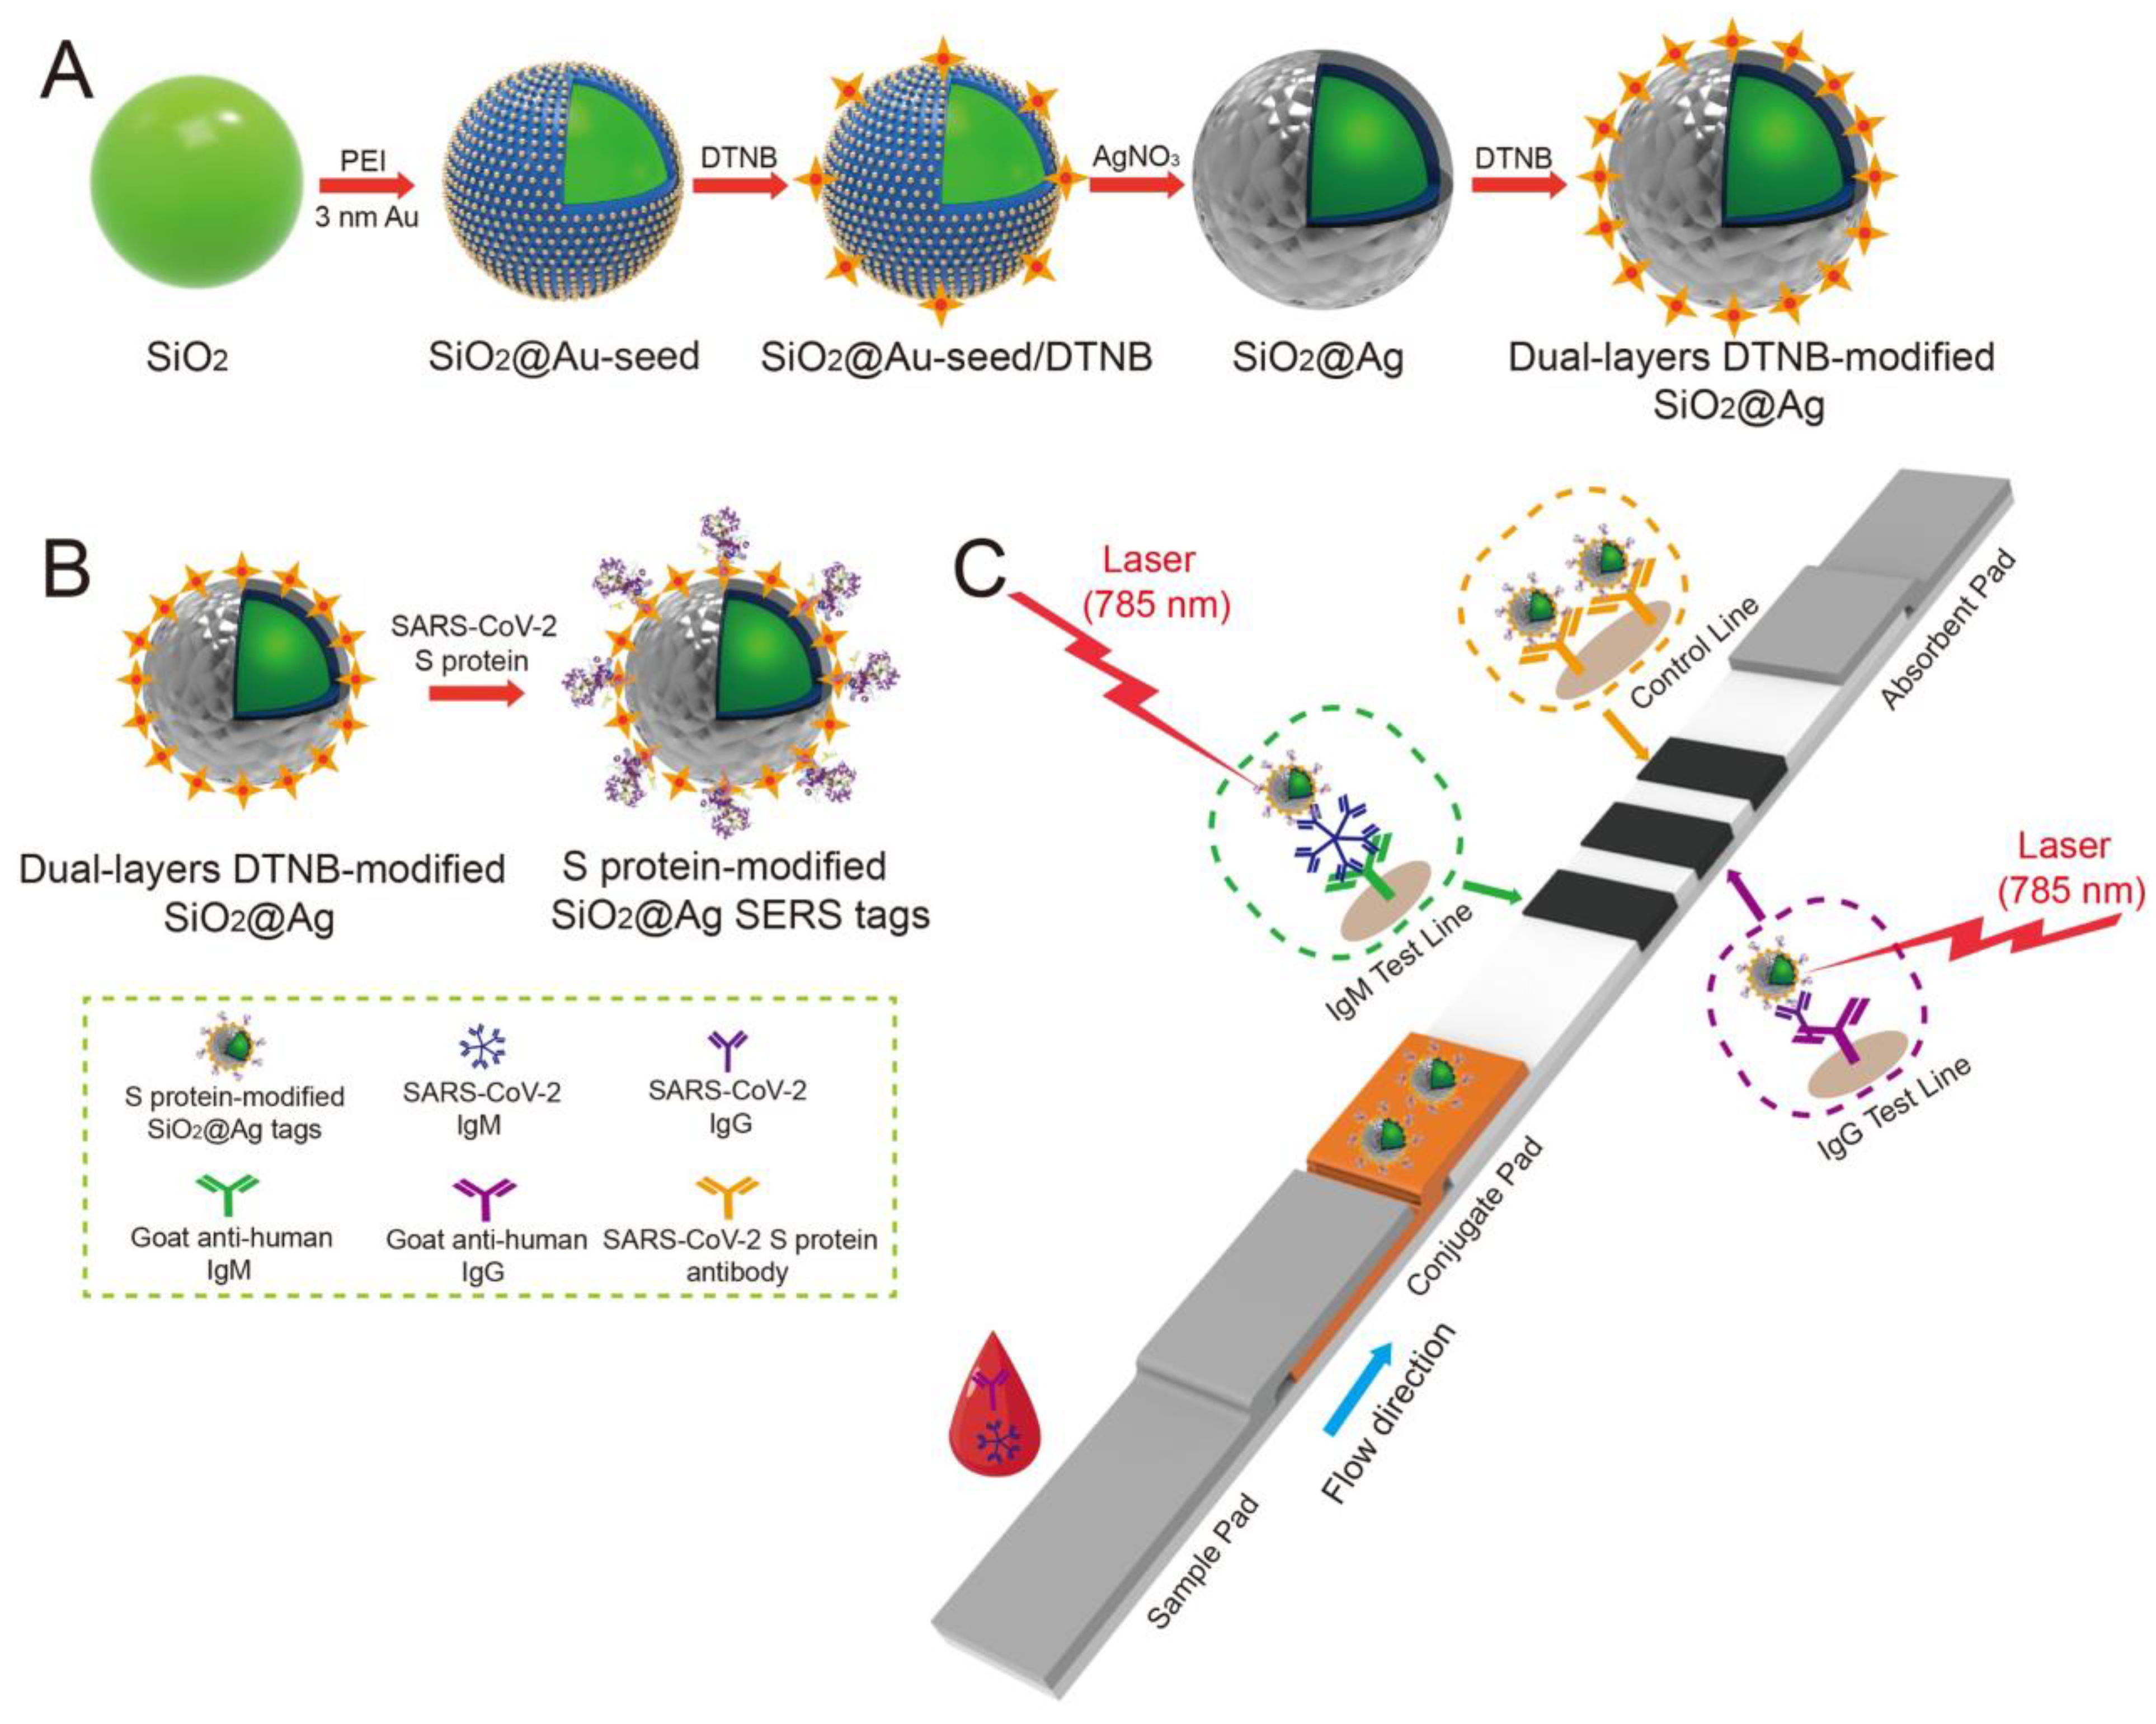
- Liu, H.; Dai, E.; Xiao, R.; Zhou, Z.; Zhang, M.; Bai, Z.; Shao, Y.; Qi, K.; Tu, J.; Wang, C.; et al. Development of a SERS-based lateral flow immunoassay for rapid and ultra-sensitive detection of anti-SARS-CoV-2 IgM/IgG in clinical samples. Sens. Actuators. B. Chem. 2021, 329, 129196. [Google Scholar] [CrossRef]
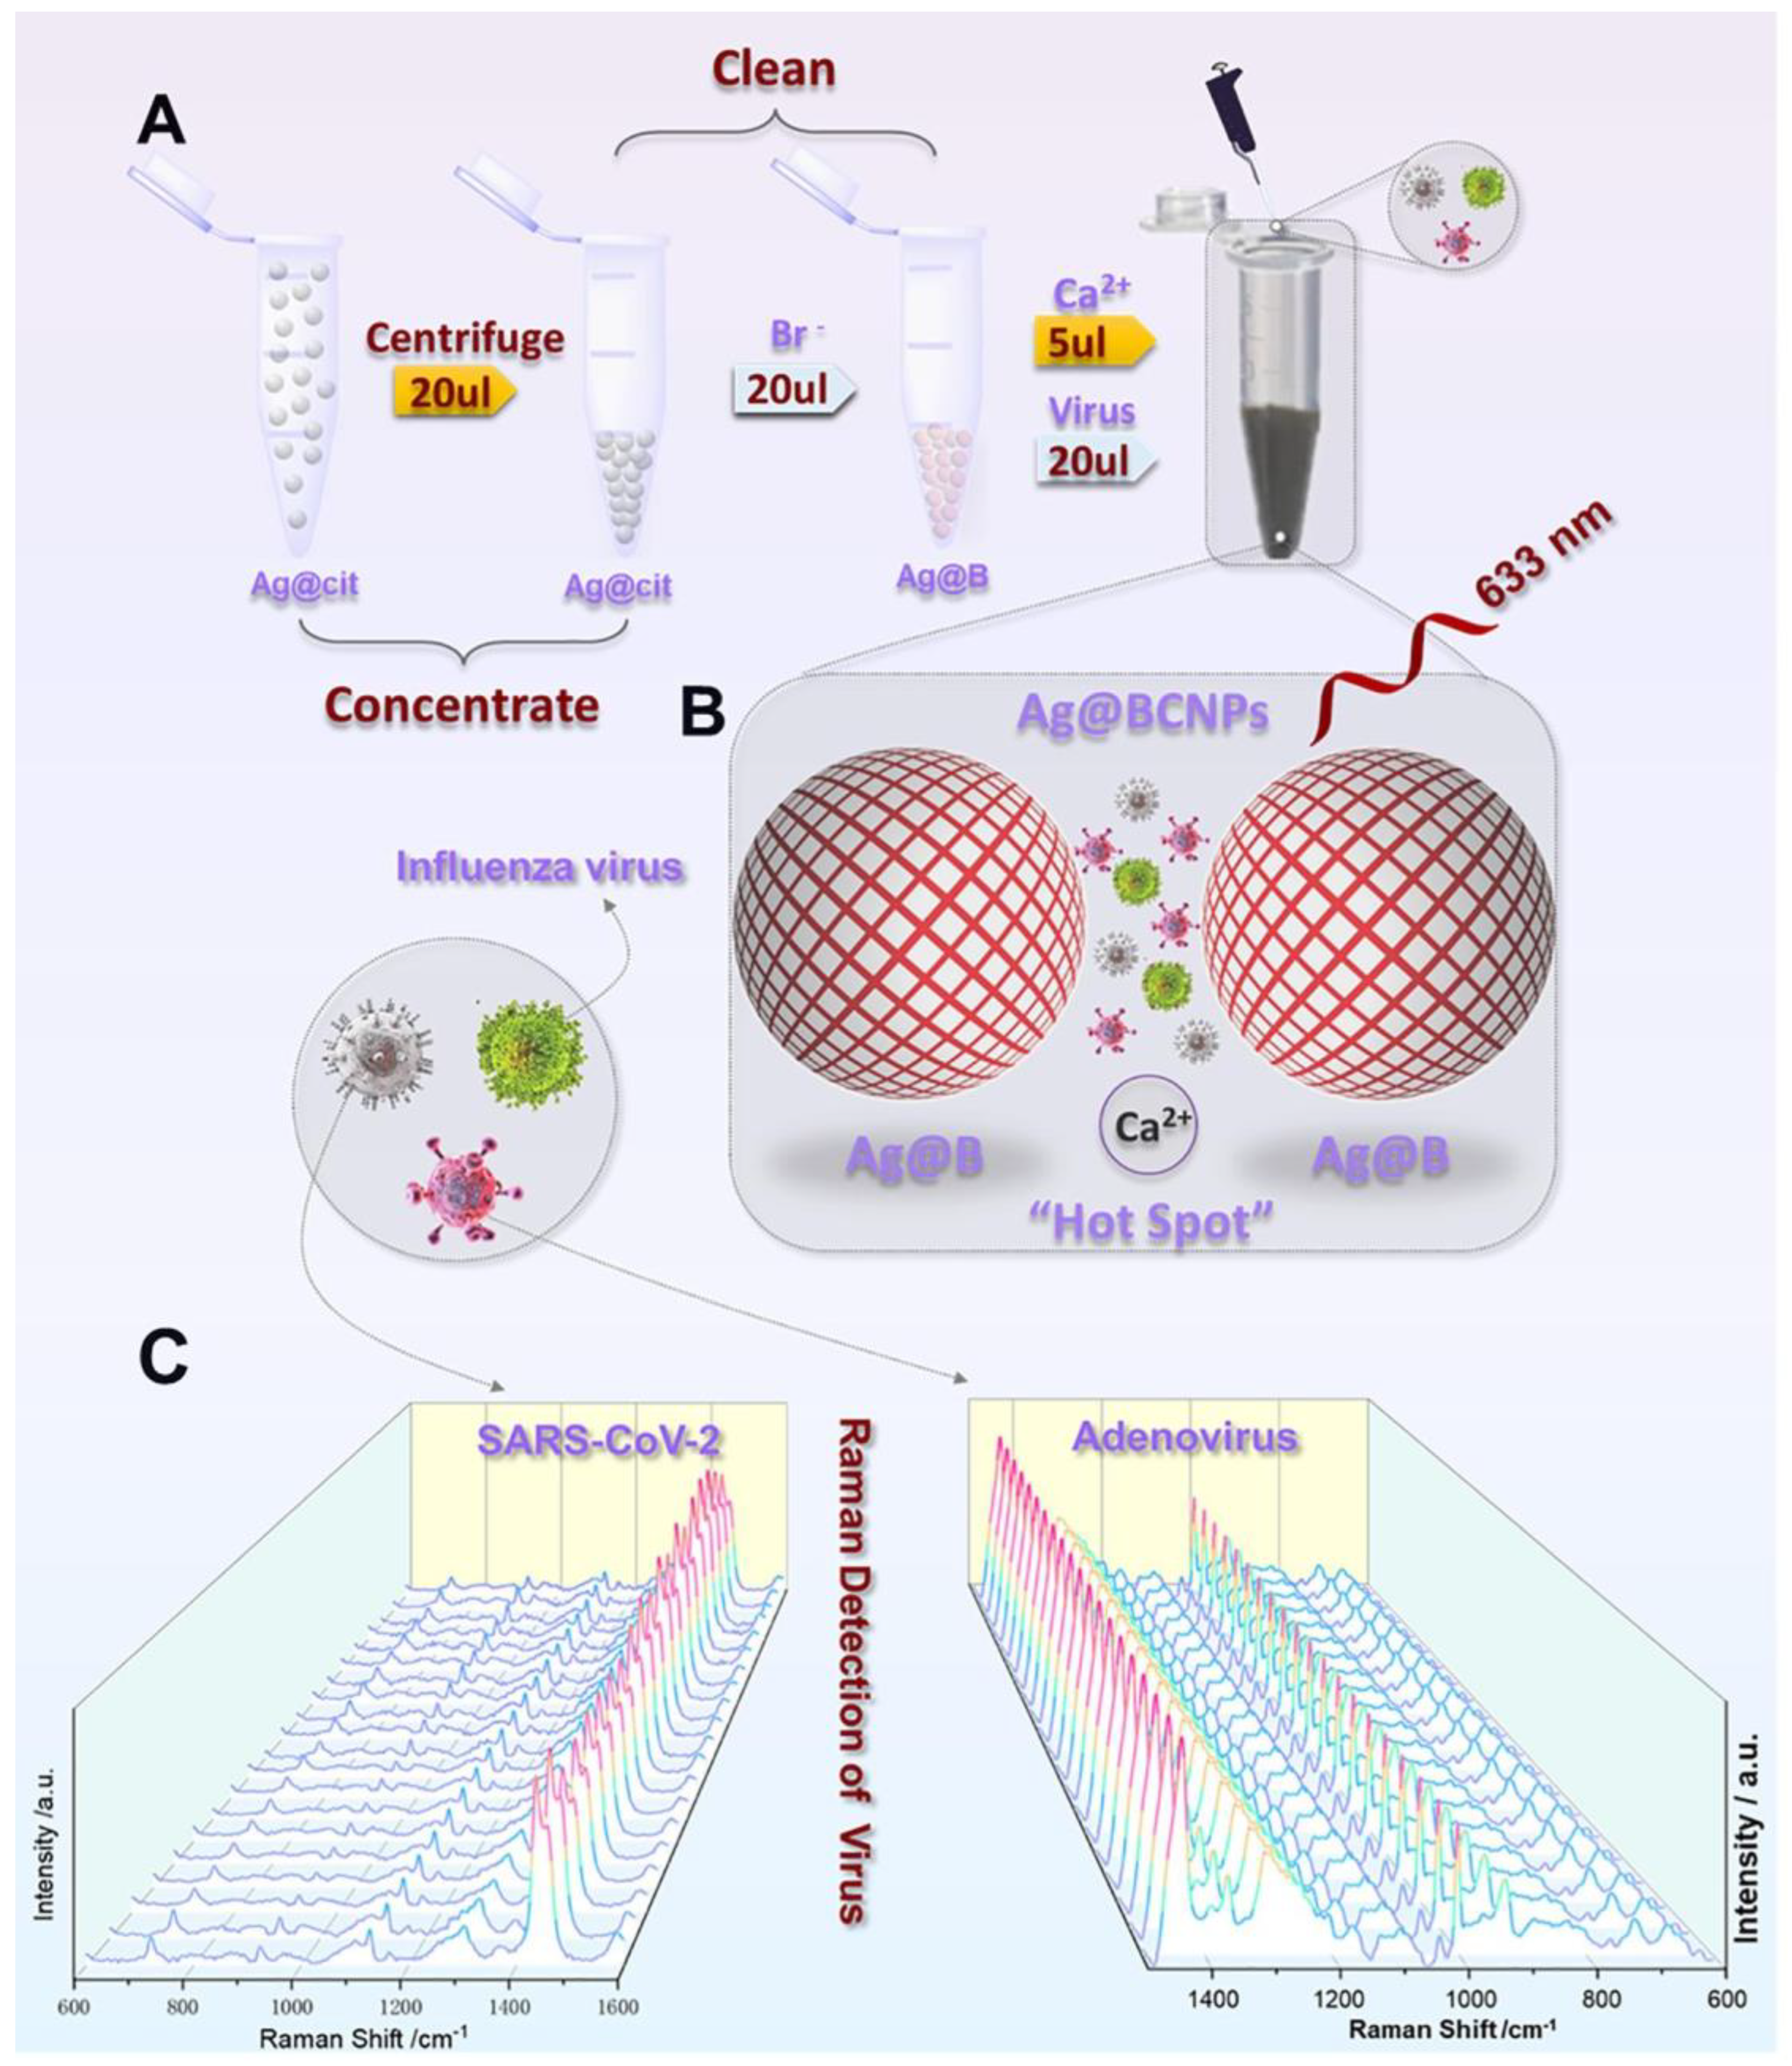
- Zhang, Z.; Li, D.; Wang, X.; Wang, Y.; Lin, J.; Jiang, S.; Wu, Z.; He, Y.; Gao, X.; Zhu, Z.; et al. Rapid detection of viruses: Based on silver nanoparticles modified with bromine ions and acetonitrile. Chem. Eng. J. 2022, 438, 135589. [Google Scholar] [CrossRef] [PubMed]
- Armani, D.K.; Kippenberg, T.J.; Spillane, S.M.; Vahala, K.J. Ultra-high-Q toroid microcavity on a chip. Nature 2003, 421, 925–928. [Google Scholar] [CrossRef]
- Iqbal, M.; Gleeson, M.A.; Spaugh, B.; Tybor, F.; Gunn, W.G.; Hochberg, M.; Baehr-Jones, T.; Bailey, R.C.; Gunn, L.C. Label-free biosensor arrays based on silicon ring resonators and high-speed optical scanning instrumentation. IEEE J. Sel. Top. Quantum Electron. 2010, 16, 654–661. [Google Scholar] [CrossRef]
- Baaske, M.; Vollmer, F. Optical resonator biosensors: Molecular diagnostic and nanoparticle detection on an integrated platform. ChemPhysChem 2012, 13, 427–436. [Google Scholar] [CrossRef]
- Ahmadi, H.; Heidarzadeh, H.; Taghipour, A.; Rostami, A.; Baghban, H.; Dolatyari, M.; Rostami, G. Evaluation of single virus detection through optical biosensor based on microsphere resonator. Optik 2014, 125, 3599–3602. [Google Scholar] [CrossRef]
- Vollmer, F.; Arnold, S.; Keng, D. Single virus detection from the reactive shift of a whispering-gallery mode. Proc. Natl. Acad. Sci. USA 2008, 105, 20701–20704. [Google Scholar] [CrossRef] [PubMed]
- Zhu, J.; Özdemir, Ş.K.; He, L.; Chen, D.-R.; Yang, L. Single virus and nanoparticle size spectrometry by whispering-gallery-mode microcavities. Opt. Express 2011, 19, 16195. [Google Scholar] [CrossRef] [PubMed]
- He, L.; Özdemir, Ş.K.; Zhu, J.; Kim, W.; Yang, L. Detecting single viruses and nanoparticles using whispering gallery microlasers. Nat. Nanotechnol. 2011, 6, 428–432. [Google Scholar] [CrossRef] [PubMed]
- Steglich, P.; Hülsemann, M.; Dietzel, B.; Mai, A. Optical Biosensors Based on Silicon-On-Insulator Ring Resonators: A Review. Molecules 2019, 24, 519. [Google Scholar] [CrossRef]
- Bogaerts, W.; de Heyn, P.; van Vaerenbergh, T.; de Vos, K.; Kumar Selvaraja, S.; Claes, T.; Dumon, P.; Bienstman, P.; van Thourhout, D.; Baets, R. Silicon microring resonators. Laser Photonics Rev. 2012, 6, 47–73. [Google Scholar] [CrossRef]
- Qavi, A.J.; Meserve, K.; Aman, M.J.; Vu, H.; Zeitlin, L.; Dye, J.M.; Froude, J.W.; Leung, D.W.; Yang, L.; Holtsberg, F.W.; et al. Rapid detection of an Ebola biomarker with optical microring resonators. Cell Rep. Methods 2022, 2, 100234. [Google Scholar] [CrossRef]
- Koo, B.; Jin, C.E.; Lee, T.Y.; Lee, J.H.; Park, M.K.; Sung, H.; Park, S.Y.; Lee, H.J.; Kim, S.M.; Kim, J.Y.; et al. An isothermal, label-free, and rapid one-step RNA amplification/detection assay for diagnosis of respiratory viral infections. Biosens. Bioelectron. 2017, 90, 187–194. [Google Scholar] [CrossRef]
- Kamat, V.; Rafique, A. Designing binding kinetic assay on the bio-layer interferometry (BLI) biosensor to characterize antibody-antigen interactions. Anal. Biochem. 2017, 536, 16–31. [Google Scholar] [CrossRef]
- Dzimianski, J.V.; Lorig-Roach, N.; O’Rourke, S.M.; Alexander, D.L.; Kimmey, J.M.; DuBois, R.M. Rapid and sensitive detection of SARS-CoV-2 antibodies by biolayer interferometry. Sci. Rep. 2020, 10, 21738. [Google Scholar] [CrossRef]
- Yurt, A.; Daaboul, G.G.; Connor, J.H.; Goldberg, B.B.; Ünlü, M.S. Single nanoparticle detectors for biological applications. Nanoscale 2012, 4, 715–726. [Google Scholar] [CrossRef] [PubMed]
- Mitra, A.; Ignatovich, F.; Novotny, L. Real-time optical detection of single human and bacterial viruses based on dark-field interferometry. Biosens. Bioelectron. 2012, 31, 499–504. [Google Scholar] [CrossRef]
- Daaboul, G.G.; Vedula, R.S.; Ahn, S.; Lopez, C.A.; Reddington, A.; Ozkumur, E.; Ünlü, M.S. LED-based Interferometric Reflectance Imaging Sensor for quantitative dynamic monitoring of biomolecular interactions. Biosens. Bioelectron. 2011, 26, 2221–2227. [Google Scholar] [CrossRef]
- Özkumur, E.; Needham, J.W.; Bergstein, D.A.; Gonzalez, R.; Cabodi, M.; Gershoni, J.M.; Goldberg, B.B.; Ünlü, M.S. Label-free and dynamic detection of biomolecular interactions for high-throughput microarray applications. Proc. Natl. Acad. Sci. USA 2008, 105, 7988–7992. [Google Scholar] [CrossRef]
- Özkumur, E.; Yalçin, A.; Cretich, M.; Lopez, C.A.; Bergstein, D.A.; Goldberg, B.B.; Chiari, M.; Ünlü, M.S. Quantification of DNA and protein adsorption by optical phase shift. Biosens. Bioelectron. 2009, 15, 167–172. [Google Scholar] [CrossRef]
- Ahn, S.; Freedman, D.S.; Massari, P.; Cabodi, M.; Ünlü, M.S. A Mass-Tagging Approach for Enhanced Sensitivity of Dynamic Cytokine Detection Using a Label-Free Biosensor. Langmuir 2013, 29, 5369–5376. [Google Scholar] [CrossRef] [PubMed]
- Marn, A.M.; Needham, J.; Chiodi, E.; Ünlü, M.S. Multiplexed, high-sensitivity measurements of antibody affinity using interferometric reflectance imaging sensor. Biosensors 2021, 11, 483. [Google Scholar] [CrossRef]
- Özkumur, E.; Ahn, S.; Yaçin, A.; Lopez, C.A.; Çevik, E.; Irani, R.J.; DeLisi, C.; Chiari, M.; Ünlü, M.S. Label-free microarray imaging for direct detection of DNA hybridization and single-nucleotide mismatches. Biosens. Bioelectron. 2010, 25, 1789–1795. [Google Scholar] [CrossRef]
- Ahn, S.; Huang, C.-L.; Ozkumur, E.; Zhang, X.; Chinnala, J.; Yalcin, A.; Bandyopadhyay, S.; Russek, S.; Unlü, M.S.; DeLisi, C.; et al. TATA binding proteins can recognize nontraditional DNA sequences. Biophys. J. 2012, 103, 1510–1517. [Google Scholar] [CrossRef]
- Lopez, C.A.; Daaboul, G.G.; Vedula, R.S.; Özkumur, E.; Bergstein, D.A.; Geisbert, T.W.; Fawcett, H.E.; Goldberg, B.B.; Connor, J.H.; Ünlü, M.S. Label-free multiplexed virus detection using spectral reflectance imaging. Biosens. Bioelectron. 2011, 26, 3432–3437. [Google Scholar] [CrossRef]
- Daaboul, G.G.; Yurt, A.; Zhang, X.; Hwang, G.M.; Goldberg, B.B.; Ünlü, M.S. High-throughput detection and sizing of individual low-index nanoparticles and viruses for pathogen identification. Nano Lett. 2010, 10, 4727–4731. [Google Scholar] [CrossRef] [PubMed]
- Cretich, M.; Pirri, G.; Damin, F.; Solinas, I.; Chiari, M. A new polymeric coating for protein microarrays. Anal. Biochem. 2004, 332, 67–74. [Google Scholar] [CrossRef] [PubMed]
- Seymour, E.; Ünlü, M.S.; Connor, J.H. A high-throughput single-particle imaging platform for antibody characterization and a novel competition assay for therapeutic antibodies. Sci. Rep. 2023, 13, 306. [Google Scholar] [CrossRef]
- Daaboul, G.G.; Lopez, C.A.; Chinnala, J.; Goldberg, B.B.; Connor, J.H.; Ünlü, M.S. Digital sensing and sizing of vesicular stomatitis virus pseudotypes in complex media: A model for ebola and marburg detection. ACS Nano 2014, 8, 6047–6055. [Google Scholar] [CrossRef]
- Monroe, M.R.; Daaboul, G.G.; Tuysuzoglu, A.; Lopez, C.A.; Little, F.F.; Ünlü, M.S. Single nanoparticle detection for multiplexed protein diagnostics with attomolar sensitivity in serum and unprocessed whole blood. Anal. Chem. 2013, 85, 3698–3706. [Google Scholar] [CrossRef] [PubMed]
- Daaboul, G.G.; Gagni, P.; Benussi, L.; Bettotti, P.; Ciani, M.; Cretich, M.; Freedman, D.S.; Ghidoni, R.; Ozkumur, A.Y.; Piotto, C.; et al. Digital Detection of Exosomes by Interferometric Imaging. Sci. Rep. 2016, 6, 37246. [Google Scholar] [CrossRef]
- Zaraee, N.; Kanik, F.E.; Bhuiya, A.M.; Gong, E.S.; Geib, M.T.; Lortlar Ünlü, N.; Ozkumur, A.Y.; Dupuis, J.R.; Ünlü, M.S. Highly sensitive and label-free digital detection of whole cell E. coli with Interferometric Reflectance Imaging. Biosens. Bioelectron. 2020, 162, 112258. [Google Scholar] [CrossRef]
- Ekiz Kanik, F.; Celebi, I.; Sevenler, D.; Tanriverdi, K.; Lortlar Ünlü, N.; Freedman, J.E.; Ünlü, M.S. Attomolar sensitivity microRNA detection using real-time digital microarrays. Sci. Rep. 2022, 12, 16220. [Google Scholar] [CrossRef]
- Scherr, S.M.; Daaboul, G.G.; Trueb, J.; Sevenler, D.; Fawcett, H.; Goldberg, B.; Connor, J.H.; Ünlü, S.M. Real-Time Capture and Visualization of Individual Viruses in Complex Media. ACS Nano 2016, 10, 2827–2833. [Google Scholar] [CrossRef]
- Scherr, S.M.; Freedman, D.S.; Agans, K.N.; Rosca, A.; Carter, E.; Kuroda, M.; Fawcett, H.E.; Mire, C.H.; Geisbert, T.W.; Ünlü, M.S.; et al. Disposable cartridge platform for rapid detection of viral hemorrhagic fever viruses. Lab Chip 2017, 17, 917–925. [Google Scholar] [CrossRef]
- Seymour, E.; Ünlü, N.L.; Carter, E.P.; Connor, J.H.; Ünlü, M.S. Configurable Digital Virus Counter on Robust Universal DNA Chips. ACS Sens. 2021, 6, 229–237. [Google Scholar] [CrossRef]
- Daaboul, G.G.; Freedman, D.S.; Scherr, S.M.; Carter, E.; Rosca, A.; Bernstein, D.; Mire, C.H.; Agans, K.N.; Hoenen, T.; Geisbert, T.W.; et al. Enhanced light microscopy visualization of virus particles from Zika virus to filamentous ebolaviruses. PLoS ONE 2017, 12, e0179728. [Google Scholar] [CrossRef] [PubMed]
- Yurdakul, C.; Avci, O.; Matlock, A.; Devaux, A.J.; Quintero, M.V.; Ozbay, E.; Davey, R.A.; Connor, J.H.; Karl, W.C.; Tian, L.; et al. High-Throughput, High-Resolution Interferometric Light Microscopy of Biological Nanoparticles. ACS Nano 2020, 14, 2002–2013. [Google Scholar] [CrossRef]
- Seymour, E.; Daaboul, G.G.; Zhang, X.; Scherr, S.M.; Lortlar Ünlü, N.; Connor, J.H.; Ünlü, M.S. DNA-Directed Antibody Immobilization for Enhanced Detection of Single Viral Pathogens. Anal. Chem. 2015, 87, 10505–10512. [Google Scholar] [CrossRef] [PubMed]
- Fu, Z.; Zeng, W.; Cai, S.; Li, H.; Ding, J.; Wang, C.; Chen, Y.; Han, N.; Yang, R. Porous Au@Pt nanoparticles with superior peroxidase-like activity for colorimetric detection of spike protein of SARS-CoV-2. J. Colloid Interface Sci. 2021, 604, 113–121. [Google Scholar] [CrossRef] [PubMed]
- Wang, C.; Yang, X.; Gu, B.; Liu, H.; Zhou, Z.; Shi, L.; Cheng, X.; Wang, S. Sensitive and Simultaneous Detection of SARS-CoV-2-Specific IgM/IgG Using Lateral Flow Immunoassay Based on Dual-Mode Quantum Dot Nanobeads. Anal. Chem. 2020, 92, 15542–15549. [Google Scholar] [CrossRef]
- Han, H.; Wang, C.; Yang, X.; Zheng, S.; Cheng, X.; Liu, Z.; Zhao, B.; Xiao, R. Rapid field determination of SARS-CoV-2 by a colorimetric and fluorescent dual-functional lateral flow immunoassay biosensor. Sens. Actuators B Chem. 2022, 351, 130897. [Google Scholar] [CrossRef]
- Kong, M.; Li, Z.; Wu, J.; Hu, J.; Sheng, Y.; Wu, D.; Lin, Y.; Li, M.; Wang, X.; Wang, S. A wearable microfluidic device for rapid detection of HIV-1 DNA using recombinase polymerase amplification. Talanta 2019, 205, 120155. [Google Scholar] [CrossRef]
- Xu, L.; Wang, R.; Kelso, L.C.; Ying, Y.; Li, Y. A target-responsive and size-dependent hydrogel aptasensor embedded with QD fluorescent reporters for rapid detection of avian influenza virus H5N1. Sens. Actuators B Chem. 2016, 234, 98–108. [Google Scholar] [CrossRef]
- Park, Y.; Ryu, B.; Ki, S.J.; Chen, M.; Liang, X.; Kurabayashi, K. Bioinspired Plasmo-virus for Point-of-Care SARS-CoV-2 Detection. Nano Lett. 2023, 23, 98–106. [Google Scholar] [CrossRef]
- Wang, X.; Li, S.; Qu, H.; Hao, L.; Shao, T.; Wang, K.; Xia, Z.; Li, Z.; Li, Q. SERS-based immunomagnetic bead for rapid detection of H5N1 influenza virus. Influenza Other Respi. Viruses 2023, 17, 1–7. [Google Scholar] [CrossRef] [PubMed]
- Zhu, H.; White, I.M.; Suter, J.D.; Zourob, M.; Fan, X. Opto-fluidic micro-ring resonator for sensitive label-free viral detection. Analyst 2008, 133, 356–360. [Google Scholar] [CrossRef]
- Auer, S.; Koho, T.; Uusi-Kerttula, H.; Vesikari, T.; Blazevic, V.; Hytönen, V.P. Rapid and sensitive detection of norovirus antibodies in human serum with a biolayer interferometry biosensor. Sens. Actuators B Chem. 2015, 221, 507–514. [Google Scholar] [CrossRef]
- Ymeti, A.; Greve, J.; Lambeck, P.V.; Wink, T.; Hövell, S.W.F.M.; Beumer, T.A.M.; Wijn, R.R.; Heideman, R.G.; Subramaniam, V.; Kanger, J.S. Fast, Ultrasensitive Virus Detection Using a Young Interferometer Sensor. Nano Lett. 2007, 7, 394–397. [Google Scholar] [CrossRef] [PubMed]


| Platform | Optical Sensing Technique | Application | Linear Range | LOD | Time | References |
|---|---|---|---|---|---|---|
| Porous Au@Pt nanoparticle for metallic nanozyme-catalysis | Colorimetric | S1 protein of SARS-CoV-2 | 10–100 ng/mL | 11 ng/mL | NR | [127] |
| SiO2@Au@QD nanobeads (NBs) labels in lateral flow immunoassay (LFIA) | Colorimetric–Fluorescent dual-mode | IgM and IgG in human serum | 101×–106× dilution of serum specimens | 1:106 dilution of serum specimens | 15 min | [128] |
| SiO2@Au/QD in LFIA | Colorimetric–Fluorescent dual-functional | S1 protein of SARS-CoV-2 and real virus | 0.05–1000 ng/mL protein | Colorimetric: 1 ng/mL protein, 7.06 × 10⁵ copies/mL virions, Fluorescence: 33 pg/mL protein, 1.02 × 10⁴ copies/mL virions | 30 min | [129] |
| Wearable microfluidic device with recombinase polymerase amplification (RPA) | Fluorescence | HIV-1 DNA | 102–105 copies/mL | 100 copies/mL | 24 min | [130] |
| Hydrogel aptasensor embedded with QD fluorescent reporters | Fluorescence | Avian influenza virus (AIV) H5N1 | 0.4–32 HAU | 0.4 HAU | 30 min | [131] |
| Intensity-modulated SPR | SPR | Avian influenza A H7N9 virus | NR | 144 copies/mL | NR | [71] |
| Magnetic particles based SPR | SPR | H1N1 influenza virus | 300 ng/mL–10 μg/mL | NR | 350 s | [72] |
| Gold nanoparticles based LSPR | LSPR | Hepatitis B surface antigen | 1 pg/mL to 1 μg/mL | 10 pg/mL | 10–15 min | [79] |
| Self-assembled plasmonic nanoprobe POC device | LSPR | SARS-CoV-2 | 1–1 × 10⁴ CFU/mL | 1.4 × 101 PFU/mL | 10 min | [132] |
| Gold nanorod-enhanced surface sandwich assay | SPR | Norovirus | 20–500 pM | 50 aM | NR | [80] |
| SiO2–Ag nanocomposite | SERS-based LFIA | COVID-19 virus | 10–0.001 ng/mL | 1 pg/mL | NR | [88] |
| Ag NPs | SERS | SARS-CoV-2 | NR | 100 PFU/test | 1–2 min | [89] |
| MBSIs@Ag-SERS | SERS | H5N1 influenza virus | 5.0 × 10⁶–5.0 × 10⁻⁷ TCID50/mL | 5.0 × 10⁻⁶ TCID50/mL | NR | [133] |
| Opto-fluidic ring-resonator-based sandwich assay | WGM microresonator | M13 filamentous bacteriophage | 2.3 × 10³–2.3 × 10¹⁰ PFU/mL | 2.3 × 10³ PFU/mL | NR | [134] |
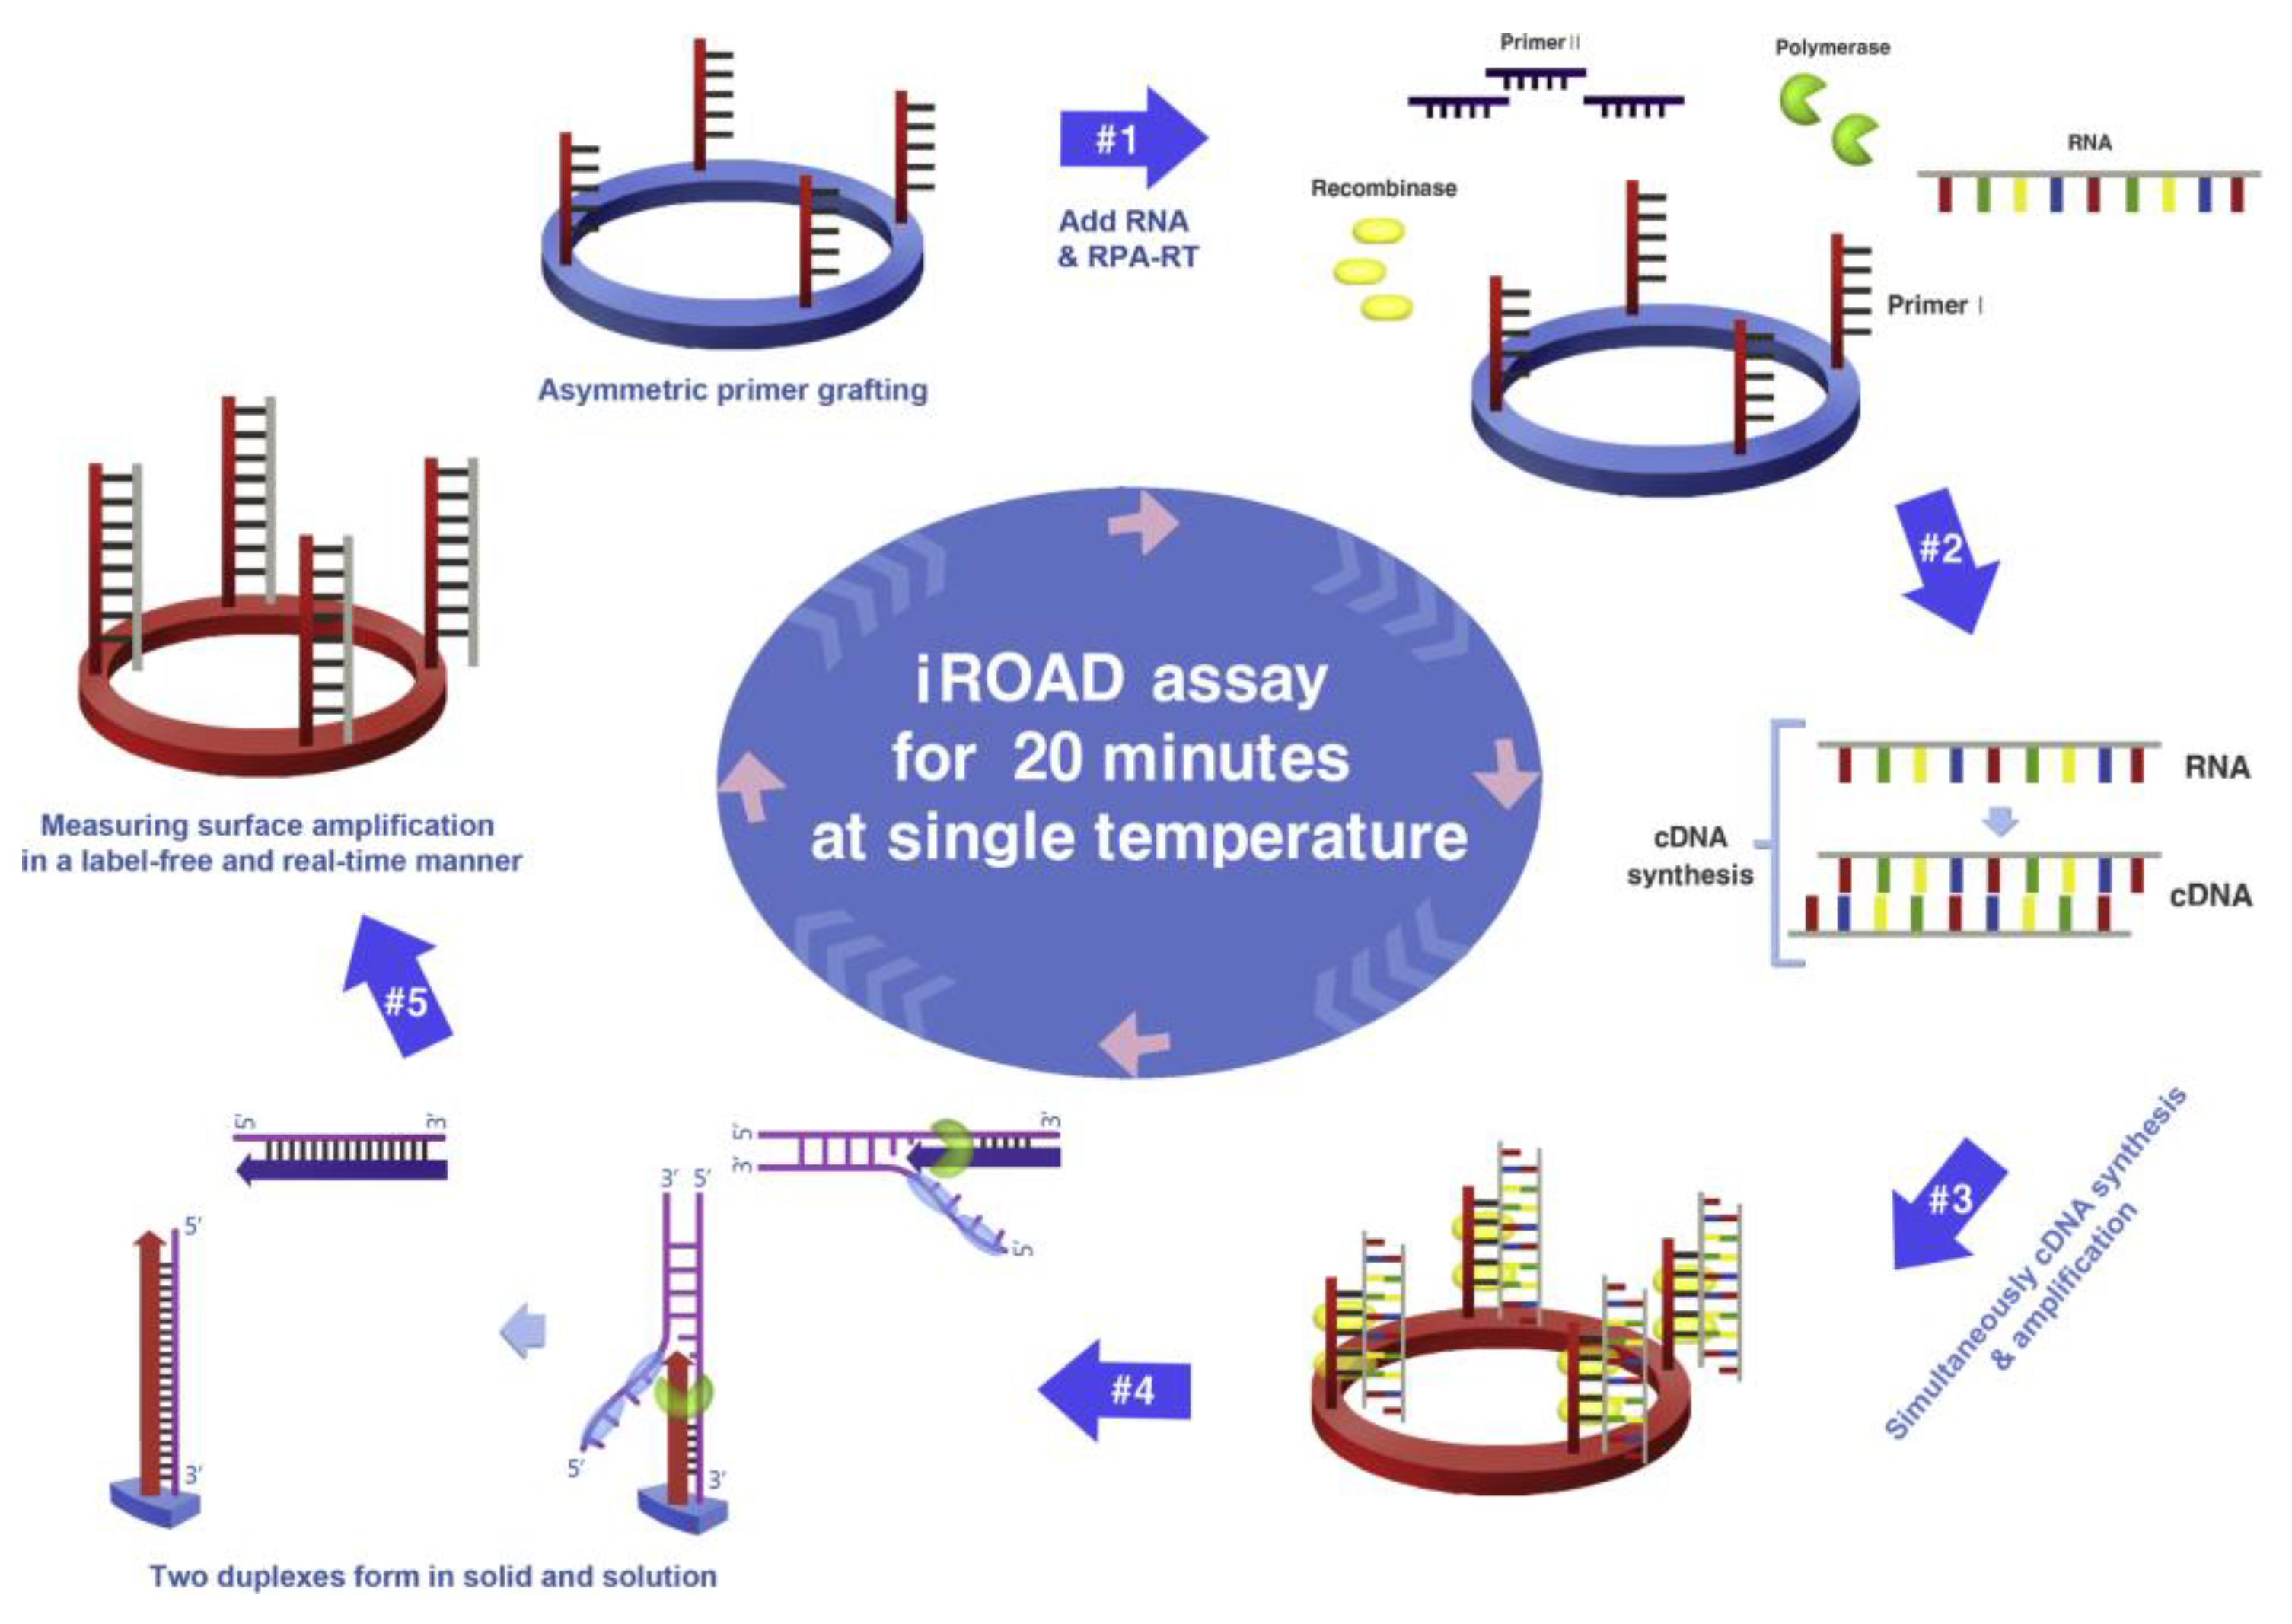
| One-step viral RNA amplification and detection—iROAD | Silicon microring resonator | Influenza A/B, human coronavirus (HCoV)-OC43/229E, or respiratory syncytial virus (RSV)-A/B | 2.5 × 101–2.5 × 10⁵ copies/reaction | 25 copies/reaction | <20 min | [100] |
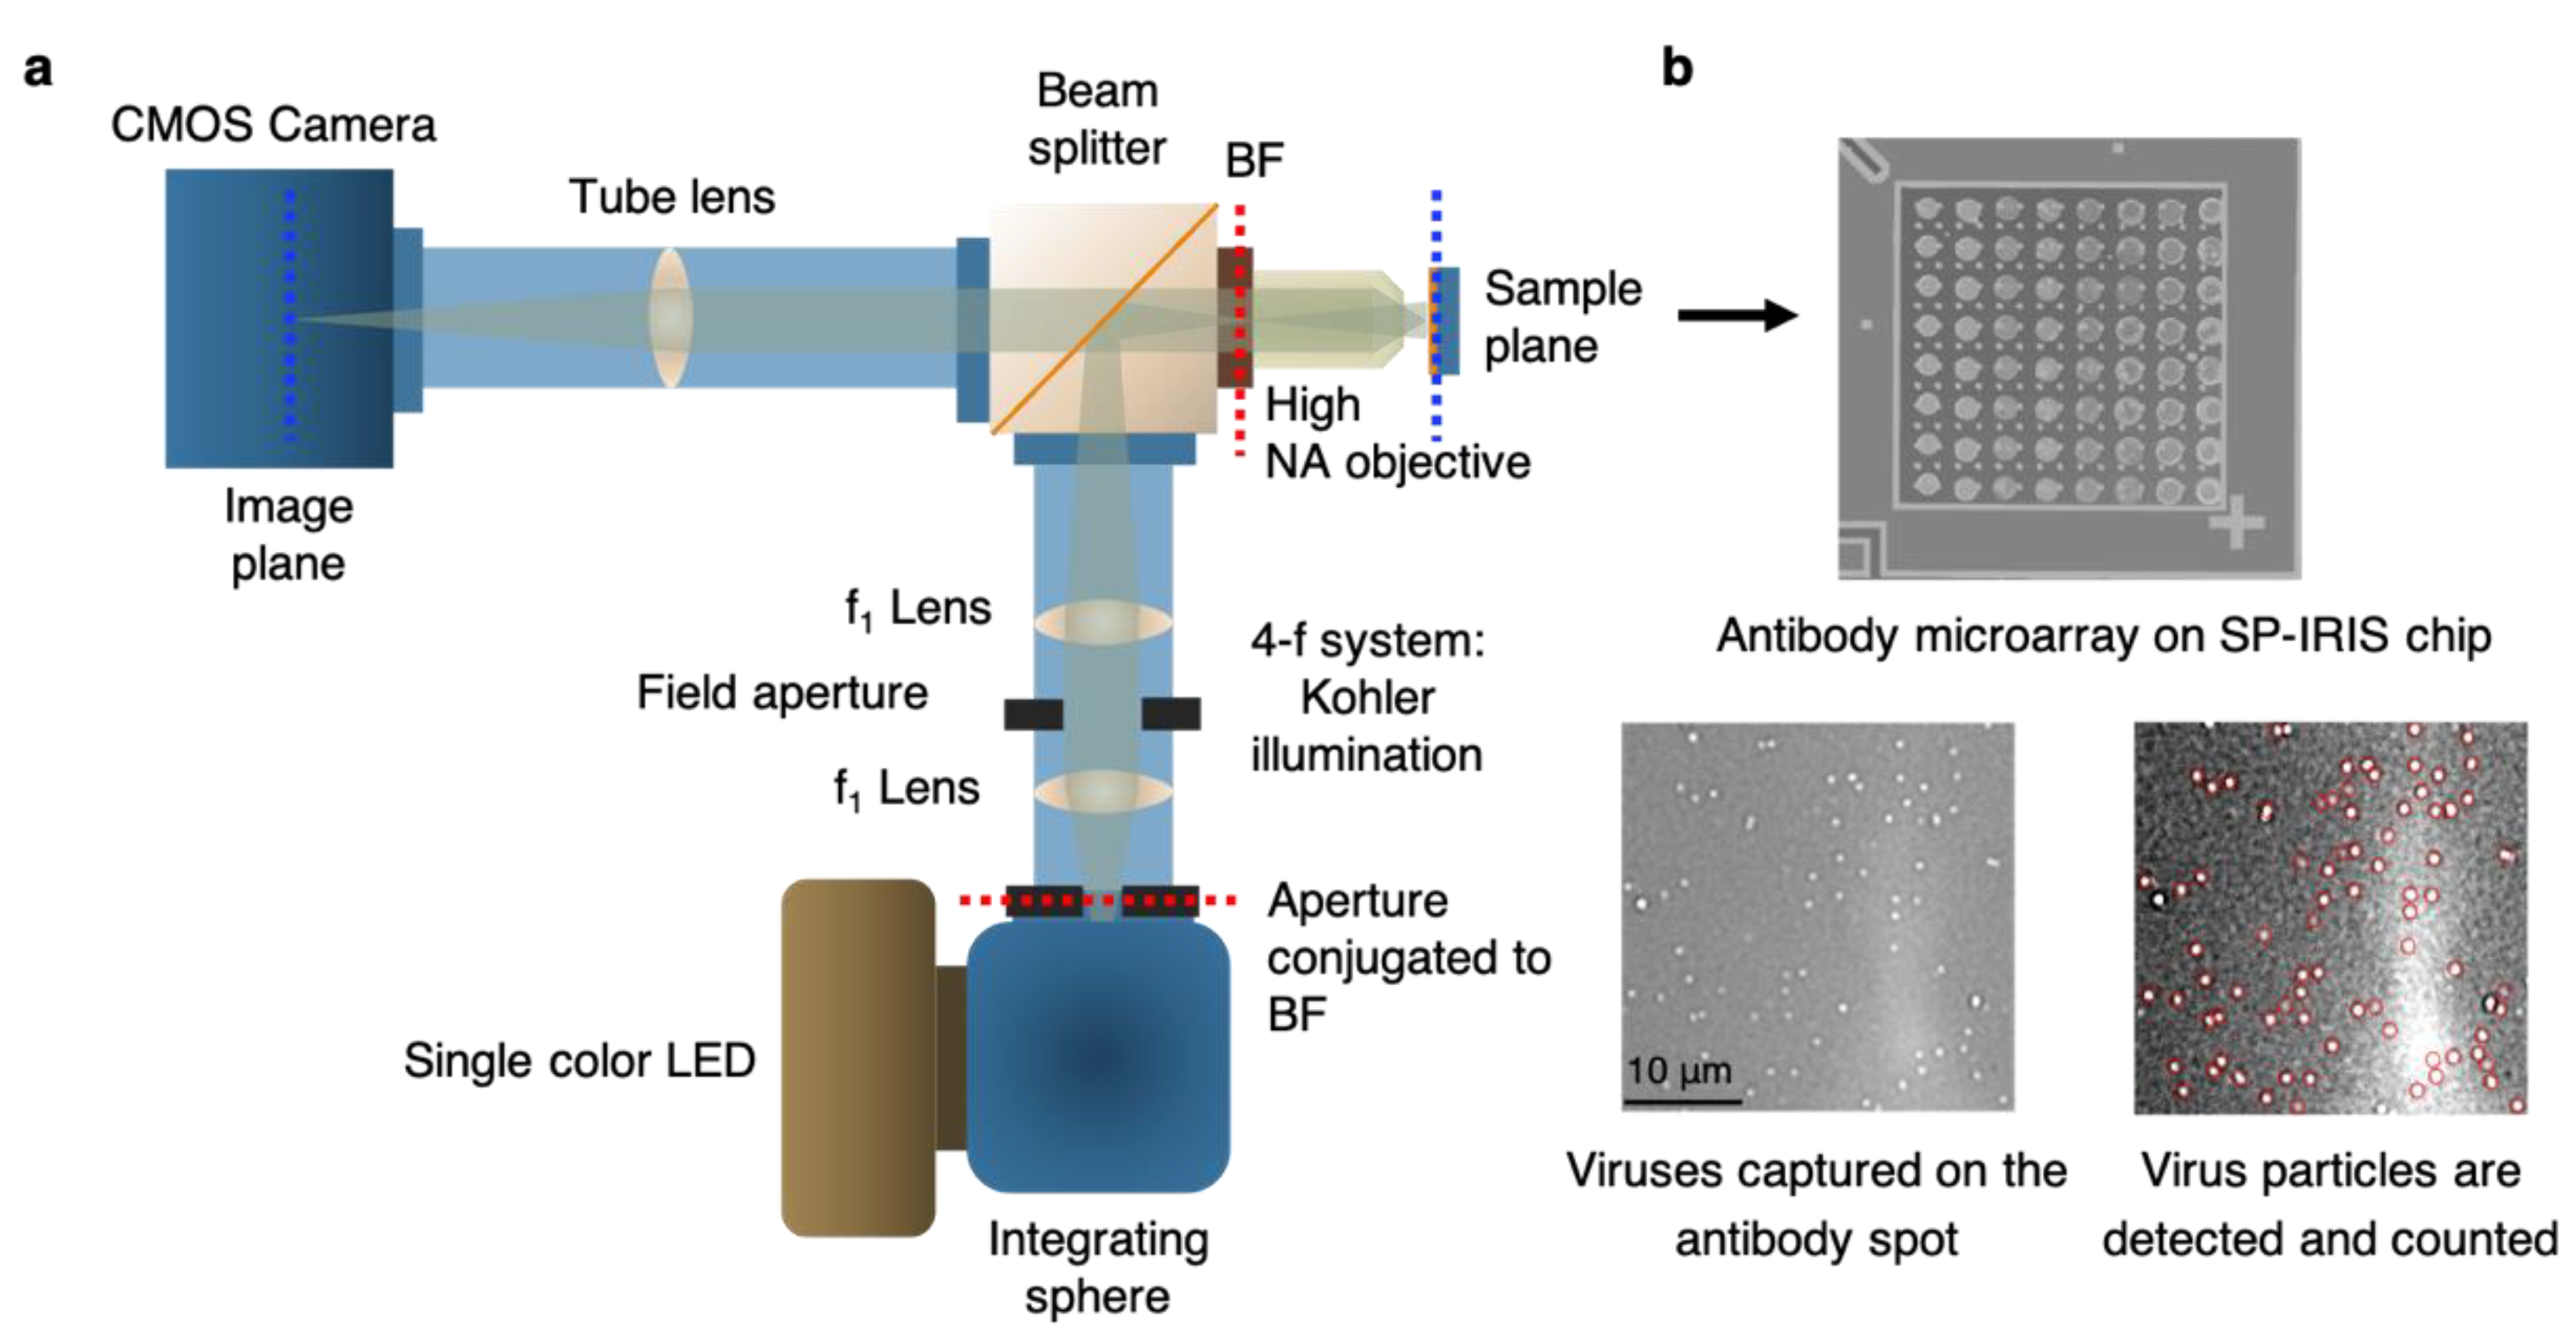
| SP-IRIS | Interferometric imaging | Whole-virus detection (VSV-based model viruses) | 102–106 PFU/mL | 102 PFU/mL | <20 min | [121,123] |
| Biolayer Interferometry (BLI)-based antibody detection | Interferometric | Norovirus antibodies | 102–103 fold dilution of serum samples | 1:104 dilution of serum | 10–20 min | [135] |
| Young Interferometer Sensor | Interferometric | Herpes simplex virus type 1 (HSV-1) | 8.5 × 10² to 8.5 × 10⁶ particles/mL | 850 particles/mL | 1 h | [136] |
Disclaimer/Publisher’s Note: The statements, opinions and data contained in all publications are solely those of the individual author(s) and contributor(s) and not of MDPI and/or the editor(s). MDPI and/or the editor(s) disclaim responsibility for any injury to people or property resulting from any ideas, methods, instructions or products referred to in the content. |
© 2023 by the authors. Licensee MDPI, Basel, Switzerland. This article is an open access article distributed under the terms and conditions of the Creative Commons Attribution (CC BY) license (https://creativecommons.org/licenses/by/4.0/).
Share and Cite
Seymour, E.; Ekiz Kanik, F.; Diken Gür, S.; Bakhshpour-Yucel, M.; Araz, A.; Lortlar Ünlü, N.; Ünlü, M.S. Solid-Phase Optical Sensing Techniques for Sensitive Virus Detection. Sensors 2023, 23, 5018. https://doi.org/10.3390/s23115018
Seymour E, Ekiz Kanik F, Diken Gür S, Bakhshpour-Yucel M, Araz A, Lortlar Ünlü N, Ünlü MS. Solid-Phase Optical Sensing Techniques for Sensitive Virus Detection. Sensors. 2023; 23(11):5018. https://doi.org/10.3390/s23115018
Chicago/Turabian StyleSeymour, Elif, Fulya Ekiz Kanik, Sinem Diken Gür, Monireh Bakhshpour-Yucel, Ali Araz, Nese Lortlar Ünlü, and M. Selim Ünlü. 2023. "Solid-Phase Optical Sensing Techniques for Sensitive Virus Detection" Sensors 23, no. 11: 5018. https://doi.org/10.3390/s23115018
APA StyleSeymour, E., Ekiz Kanik, F., Diken Gür, S., Bakhshpour-Yucel, M., Araz, A., Lortlar Ünlü, N., & Ünlü, M. S. (2023). Solid-Phase Optical Sensing Techniques for Sensitive Virus Detection. Sensors, 23(11), 5018. https://doi.org/10.3390/s23115018