


Relationship between EMG and fNIRS during Dynamic Movements

 ,
,  ,
,  , and
, and 
Abstract
1. Introduction
2. Materials and Methods
2.1. Participants Characteristics
2.2. Testing Procedures
2.3. Data Analysis
3. Results
4. Discussion
5. Conclusions
- The proposed methodology allows for the correlation of both signals during dynamic movements. This approach has been published in a rather limited number of papers.
- The achievement of positive correlations between electrical muscle activity and local muscle oxygenation have been achieved.
- The lifestyles of participants may have an impact on the level of correlation between EMG and NIRS signals.
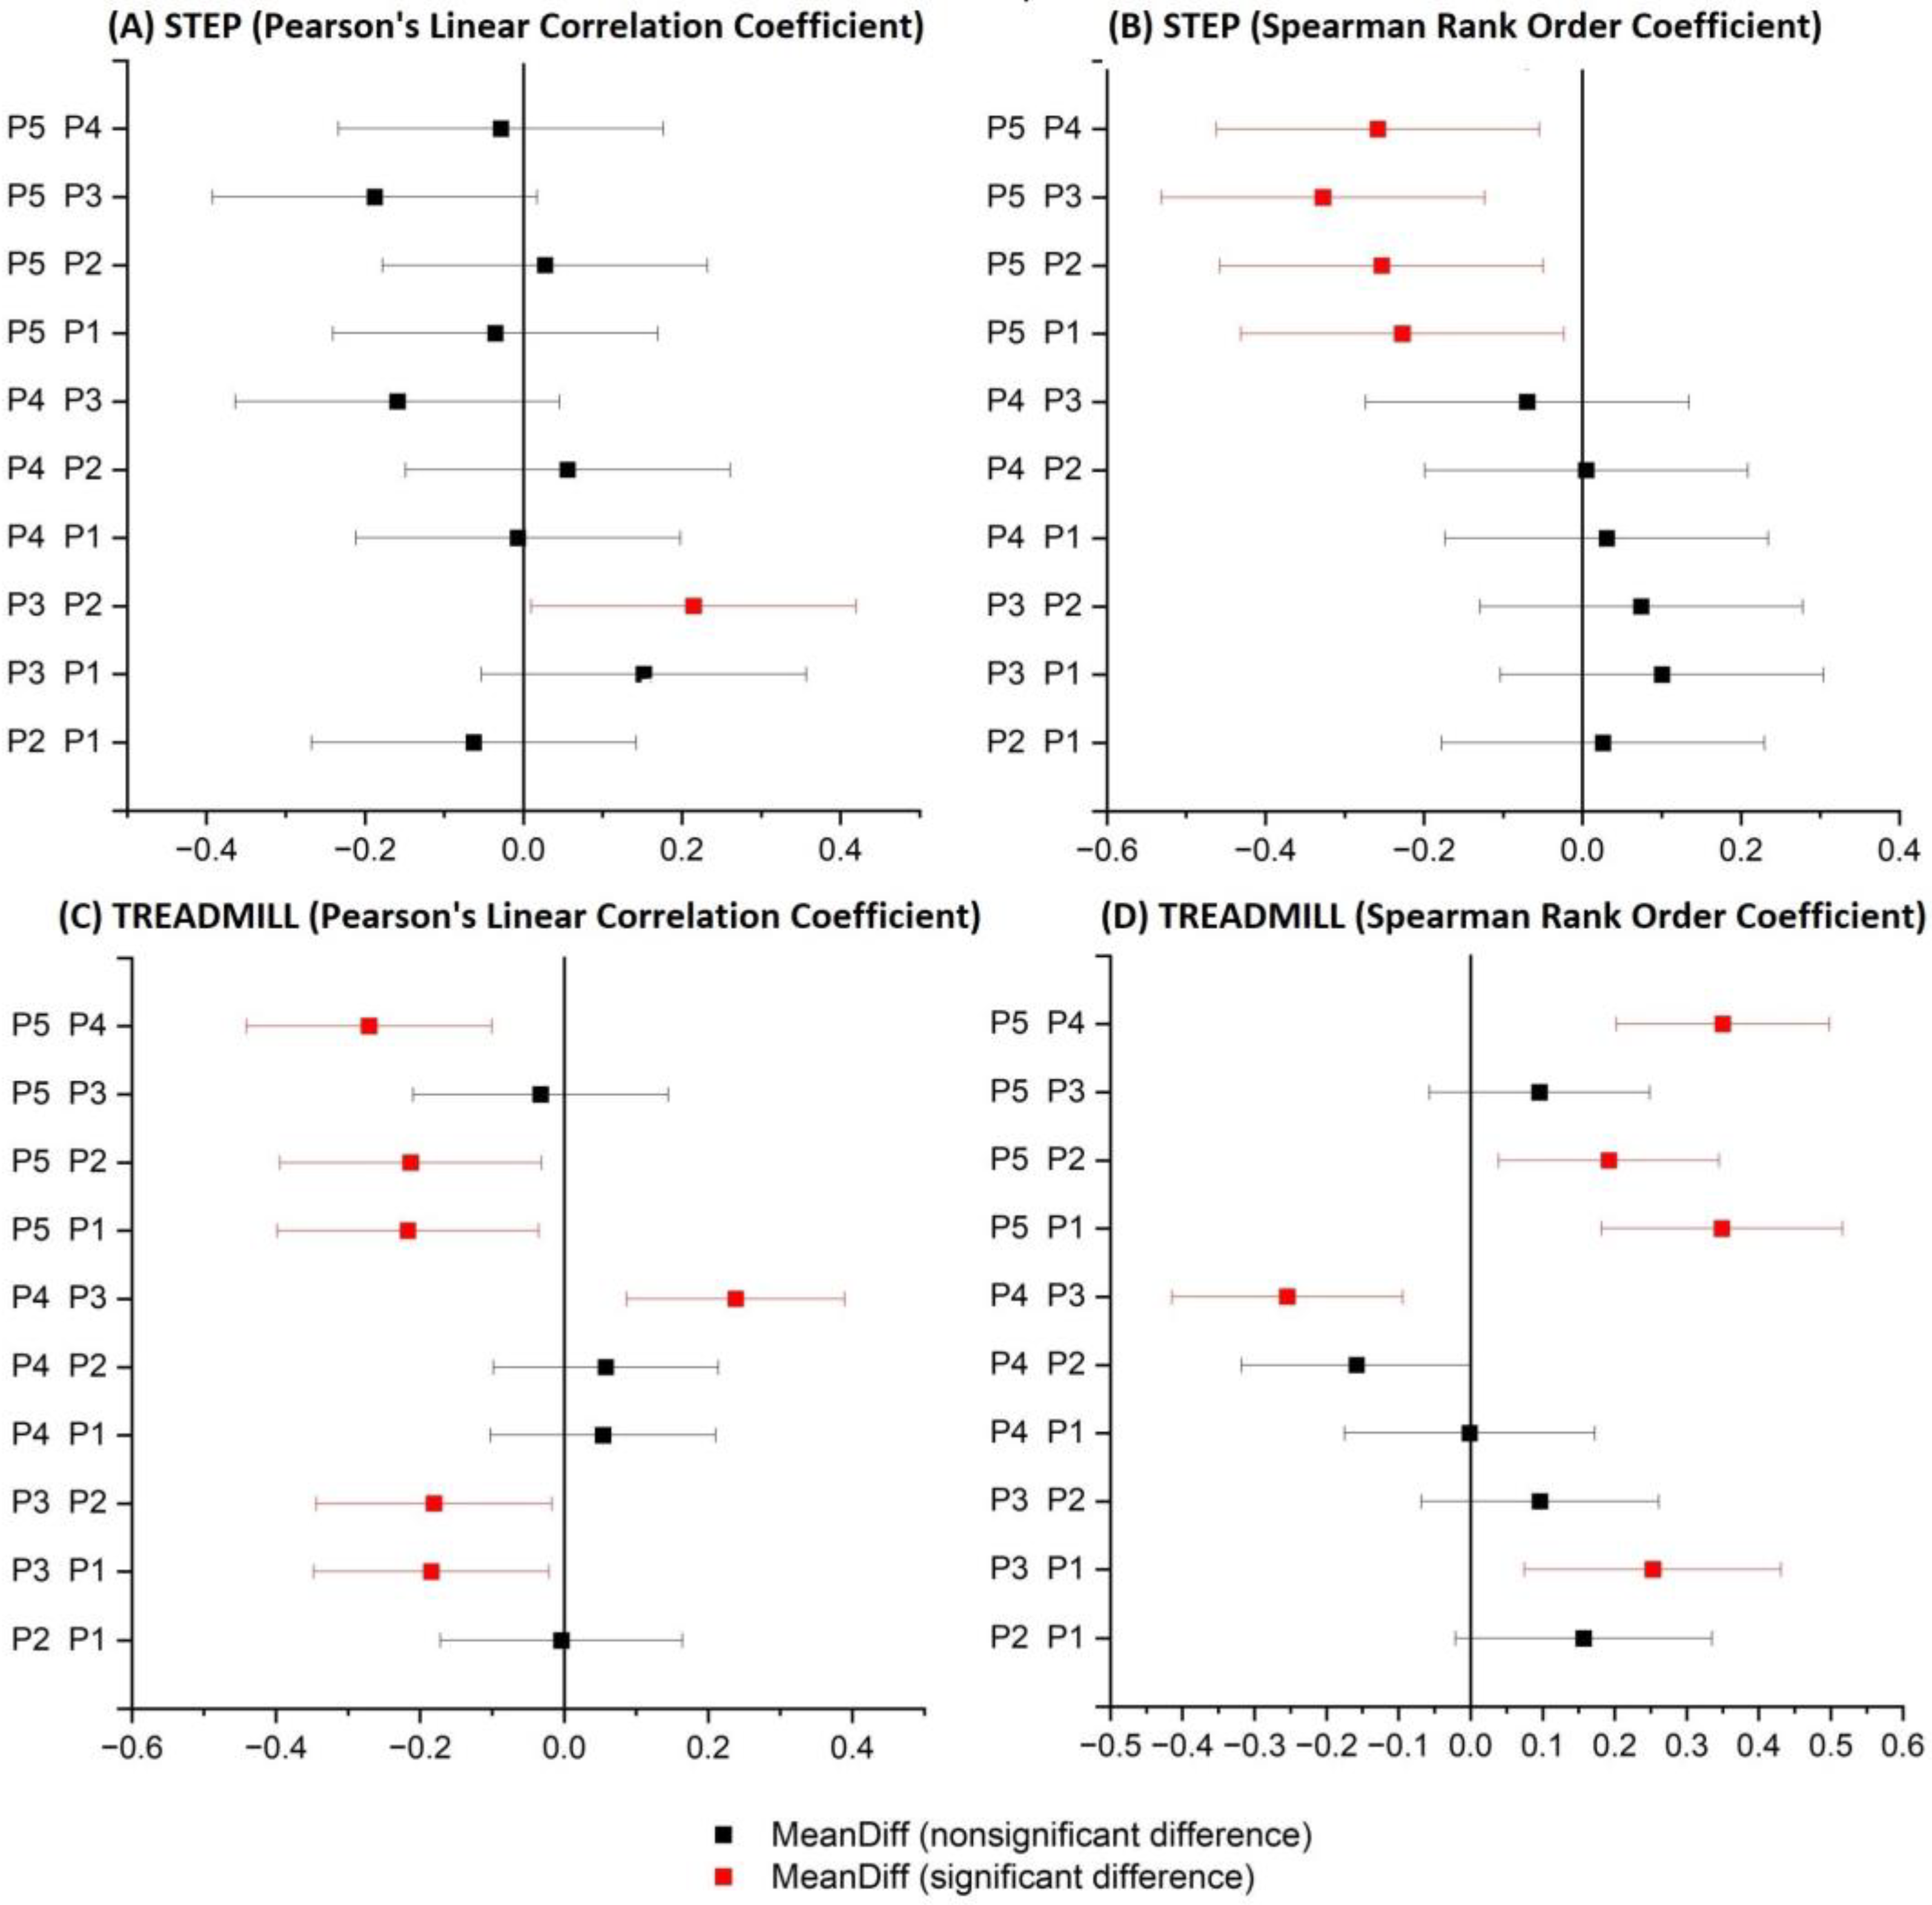
- During the analysis of data from the treadmill test, it was observed that the more active the participant’s lifestyle, the stronger the correlation between the EMG and NIRS signals. However, this relationship was not observed in the step test case.
Author Contributions
Funding
Institutional Review Board Statement
Informed Consent Statement
Data Availability Statement
Acknowledgments
Conflicts of Interest
References
- De Luca, C.J. The Use of Surface Electromyography in Biomechanics. J. Appl. Biomech. 1997, 13, 135–163. [Google Scholar] [CrossRef]
- Blok, J.H.; van Dijk, J.P.; Drost, G.; Zwarts, M.J. A High-Density Multichannel Surface Electromyography System for the Characterization of Single Motor Units. Rev. Sci. Instrum. 2002, 73, 1887–1897. [Google Scholar] [CrossRef]
- Drost, G.; Stegeman, D.F.; van Engelen, B.G.M.; Zwarts, M.J. Clinical Applications of High-Density Surface EMG: A Systematic Review. J. Electromyogr. Kinesiol. 2006, 16, 586–602. [Google Scholar] [CrossRef] [PubMed]
- Chen, Y.; Tang, J.; Chen, Y.; Farrand, J.; Craft, M.A.; Carlson, B.W.; Yuan, H. Amplitude of FNIRS Resting-State Global Signal Is Related to EEG Vigilance Measures: A Simultaneous FNIRS and EEG Study. Front. Neurosci. 2020, 14, 560878. [Google Scholar] [CrossRef] [PubMed]
- Hogrel, J.Y. Clinical Applications of Surface Electromyography in Neuromuscular Disorders. Neurophysiol. Clin. 2005, 35, 59–71. [Google Scholar] [CrossRef]
- Troka, M.; Wojnicz, W.; Szepietowska, K.; Podlasiński, M.; Walerzak, S.; Walerzak, K.; Lubowiecka, I. Towards Classification of Patients Based on Surface EMG Data of Temporomandibular Joint Muscles Using Self-Organising Maps. Biomed. Signal Process. Control 2022, 72, 103322. [Google Scholar] [CrossRef]
- Dejneka, A.; Malachowski, J.; Mazurkiewicz, L. Identification of Muscle Movements and Activity by Experimental Methods for Selected Cases—Stage#1. Acta Bioeng. Biomech. 2022, 24, 69–82. [Google Scholar] [CrossRef]
- Dejneka, A.; Malachowski, J.; Mazurkiewicz, Ł. Identification of Muscle Movements and Activity by Experimental Methods for Selected Cases—Stage#2. Acta Bioeng. Biomech. 2022, 24, 3–11. [Google Scholar] [CrossRef]
- Grassi, B.; Quaresima, V. Near-Infrared Spectroscopy and Skeletal Muscle Oxidative Function in Vivo in Health and Disease: A Review from an Exercise Physiology Perspective. J. Biomed. Opt. 2016, 21, 091313. [Google Scholar] [CrossRef]
- Peake, J.M.; Kerr, G.; Sullivan, J.P. A Critical Review of Consumer Wearables, Mobile Applications, and Equipment for Providing Biofeedback, Monitoring Stress, and Sleep in Physically Active Populations. Front. Physiol. 2018, 9, 743. [Google Scholar] [CrossRef]
- Jöbsis, F.F. Noninvasive, Infrared Monitoring of Cerebral and Myocardial Oxygen Sufficiency and Circulatory Parameters. Science 1977, 198, 1254–1267. [Google Scholar] [CrossRef] [PubMed]
- Haeussinger, F.B.; Heinzel, S.; Hahn, T.; Schecklmann, M.; Ehlis, A.C.; Fallgatter, A.J. Simulation of Near-Infrared Light Absorption Considering Individual Head and Prefrontal Cortex Anatomy: Implications for Optical Neuroimaging. PLoS ONE 2011, 6, e26377. [Google Scholar] [CrossRef] [PubMed]
- Perrey, S.; Ferrari, M. Muscle Oximetry in Sports Science: A Systematic Review. Sport. Med. 2018, 48, 597–616. [Google Scholar] [CrossRef]
- Buchheit, M.; Cormie, P.; Abbiss, C.R.; Ahmaidi, S.; Nosaka, K.K.; Laursen, P.B. Muscle Deoxygenation during Repeated Sprint Running: Effect of Active vs. Passive Recovery. Int. J. Sport Med. 2009, 30, 418–425. [Google Scholar] [CrossRef] [PubMed]
- Kozlová, S. The Use of Near-Infrared Spectroscopy in the Sport-Scientific Context. J. Neurol. Neurol. Disord. 2018, 4, 1–9. [Google Scholar] [CrossRef]
- Jones, B.; Cooper, C.E. Underwater Near-Infrared Spectroscopy: Muscle Oxygen Changes in the Upper and Lower Extremities in Club Level Swimmers and Triathletes. In Oxygen Transport to Tissue XXXVII; Elwell, C.E., Leung, T.S., Harrison, D.K., Eds.; Springer New York: New York, NY, USA, 2016; pp. 35–40. [Google Scholar]
- Taborri, J.; Keogh, J.; Kos, A.; Santuz, A.; Umek, A.; Urbanczyk, C.; van der Kruk, E.; Rossi, S. Sport Biomechanics Applications Using Inertial, Force, and EMG Sensors: A Literature Overview. Appl. Bionics Biomech. 2020, 2020, 2041549. [Google Scholar] [CrossRef] [PubMed]
- Kos, M.; Ženko, J.; Vlaj, D.; Kramberger, I. Tennis Stroke Detection and Classification Using Miniature Wearable IMU Device. Int. Conf. Syst. Signals Image Process. 2016, 2016, 17–20. [Google Scholar] [CrossRef]
- Jarrah, Y.A.; Asogbon, M.G.; Samuel, O.W.; Wang, X.; Zhu, M.; Nsugbe, E.; Chen, S.; Li, G. High-Density Surface EMG Signal Quality Enhancement via Optimized Filtering Technique for Amputees’ Motion Intent Characterization towards Intuitive Prostheses Control. Biomed. Signal Process. Control 2022, 74, 103497. [Google Scholar] [CrossRef]
- Smith, K.J.; Billaut, F. Influence of Cerebral and Muscle Oxygenation on Repeated-Sprint Ability. Eur. J. Appl. Physiol. 2010, 109, 989–999. [Google Scholar] [CrossRef]
- Di Giminiani, R.; Cardinale, M.; Ferrari, M.; Quaresima, V. Validation of Fabric-Based Thigh-Wearable EMG Sensors and Oximetry for Monitoring Quadricep Activity during Strength and Endurance Exercises. Sensors 2020, 20, 4664. [Google Scholar] [CrossRef]
- Praagman, M.; Veeger, H.E.J.; Chadwick, E.K.J.; Colier, W.N.J.M.; Van Der Helm, F.C.T. Muscle Oxygen Consumption, Determined by NIRS, in Relation to External Force and EMG. J. Biomech. 2003, 36, 905–912. [Google Scholar] [CrossRef] [PubMed]
- Moalla, W.; Merzouk, A.; Costes, F.; Tabka, Z.; Ahmaidi, S. Muscle Oxygenation and EMG Activity during Isometric Exercise in Children. J. Sport. Sci. 2006, 24, 1195–1201. [Google Scholar] [CrossRef] [PubMed]
- Şayli, Ö.; Akin, A.; Çotuk, H.B. Correlation Analysis between Surface Electromyography and Continuous-Wave near-Infrared Spectroscopy Parameters during Isometric Exercise to Volitional Fatigue. Turk. J. Electr. Eng. Comput. Sci. 2014, 22, 780–793. [Google Scholar] [CrossRef]
- Kauppi, K.; Korhonen, V.; Ferdinando, H.; Kallio, M.; Myllylä, T. Combined Surface Electromyography, near-Infrared Spectroscopy and Acceleration Recordings of Muscle Contraction: The Effect of Motion. J. Innov. Opt. Health Sci. 2017, 10, 1650056. [Google Scholar] [CrossRef]
- Astrand, P.-O.; Ryhming, I. A Nomogram for Calculation of Aerobic Capacity (Physical Fitness) from Pulse Rate during Submaximal Work. J. Appl. Physiol. 1954, 7, 218–221. [Google Scholar] [CrossRef]
- Astrand, P.-O. Experimental Studies of Physical Working Capacity in Relation to Sex and Age. Ph.D Thesis, Stockholm University, Stockholm, Sweden, 1952. [Google Scholar] [CrossRef]
- Martinek, R.; Ladrova, M.; Sidikova, M.; Jaros, R.; Behbehani, K.; Kahankova, R.; Kawala-Sterniuk, A. Advanced Bioelectrical Signal Processing Methods: Past, Present, and Future Approach—Part Iii: Other Biosignals. Sensors 2021, 21, 6064. [Google Scholar] [CrossRef]
- Berman, J.J. Chapter 4—Understanding your data. In Data Simplification; Berman, J.J., Ed.; Morgan Kaufmann: Boston, MA, USA, 2016; pp. 135–187. ISBN 978-0-12-803781-2. [Google Scholar]
- Al-jabery, K.K.; Obafemi-Ajayi, T.; Olbricht, G.R.; Wunsch II, D.C. 2—Data Preprocessing. In Computational Learning Approaches to Data Analytics in Biomedical Applications; Al-jabery, K.K., Obafemi-Ajayi, T., Olbricht, G.R., Wunsch II, D.C., Eds.; Academic Press: Cambridge, MA, USA, 2020; pp. 7–27. ISBN 978-0-12-814482-4. [Google Scholar]
- Schober, P.; Schwarte, L.A. Correlation Coefficients: Appropriate Use and Interpretation. Anesth. Analg. 2018, 126, 1763–1768. [Google Scholar] [CrossRef]
- Boone, J.; Barstow, T.J.; Celie, B.; Prieur, F.; Bourgois, J. The Impact of Pedal Rate on Muscle Oxygenation, Muscle Activation and Whole-Body VO2 during Ramp Exercise in Healthy Subjects. Eur. J. Appl. Physiol. 2015, 115, 57–70. [Google Scholar] [CrossRef]
- Scott, C.B.; Kurtulus, I.; Hasan, A.; Patricia, S.; Meltem, I.; Kambiz, P.; Banu, O. Implementation of FNIRS for Monitoring Levels of Expertise and Mental Workload; Springer: Berlin/Heidelberg, Germany, 2011; ISBN 3540286535. [Google Scholar]
- Ferrari, M.; Quaresima, V. A Brief Review on the History of Human Functional Near-Infrared Spectroscopy (FNIRS) Development and Fields of Application. Neuroimage 2012, 63, 921–935. [Google Scholar] [CrossRef]
- Fatimah, B.; Singh, P.; Singhal, A.; Pachori, R.B. Hand Movement Recognition from SEMG Signals Using Fourier Decomposition Method. Biocybern. Biomed. Eng. 2021, 41, 690–703. [Google Scholar] [CrossRef]
- Rahman, M.A.; Rashid, M.A.; Ahmad, M. Selecting the Optimal Conditions of Savitzky–Golay Filter for FNIRS Signal. Biocybern. Biomed. Eng. 2019, 39, 624–637. [Google Scholar] [CrossRef]
- Hermens, H.J.; Freriks, B.; Disselhorst-Klug, C.; Rau, G. Development of Recommendations for SEMG Sensors and Sensor Placement Procedures. J. Electromyogr. Kinesiol. 2000, 10, 361–374. [Google Scholar] [CrossRef] [PubMed]
- Yücel, M.A.; Lühmann, A.V.; Scholkmann, F.; Gervain, J.; Dan, I.; Ayaz, H.; Boas, D.; Cooper, R.J.; Culver, J.; Elwell, C.E.; et al. Best Practices for FNIRS Publications. Neurophotonics 2021, 8, 12101. [Google Scholar] [CrossRef] [PubMed]


| Participants | Lifestyles | |
|---|---|---|
| Participant #1 |  | Sedentary lifestyle |
| Participant #2 |  | Lifestyle of standing, small activity |
| Participant #3 |  | Mixed lifestyle, stressful work, sport after work |
| Participant #4 |  | Sedentary lifestyle |
| Participant #5 |  | Active lifestyle |
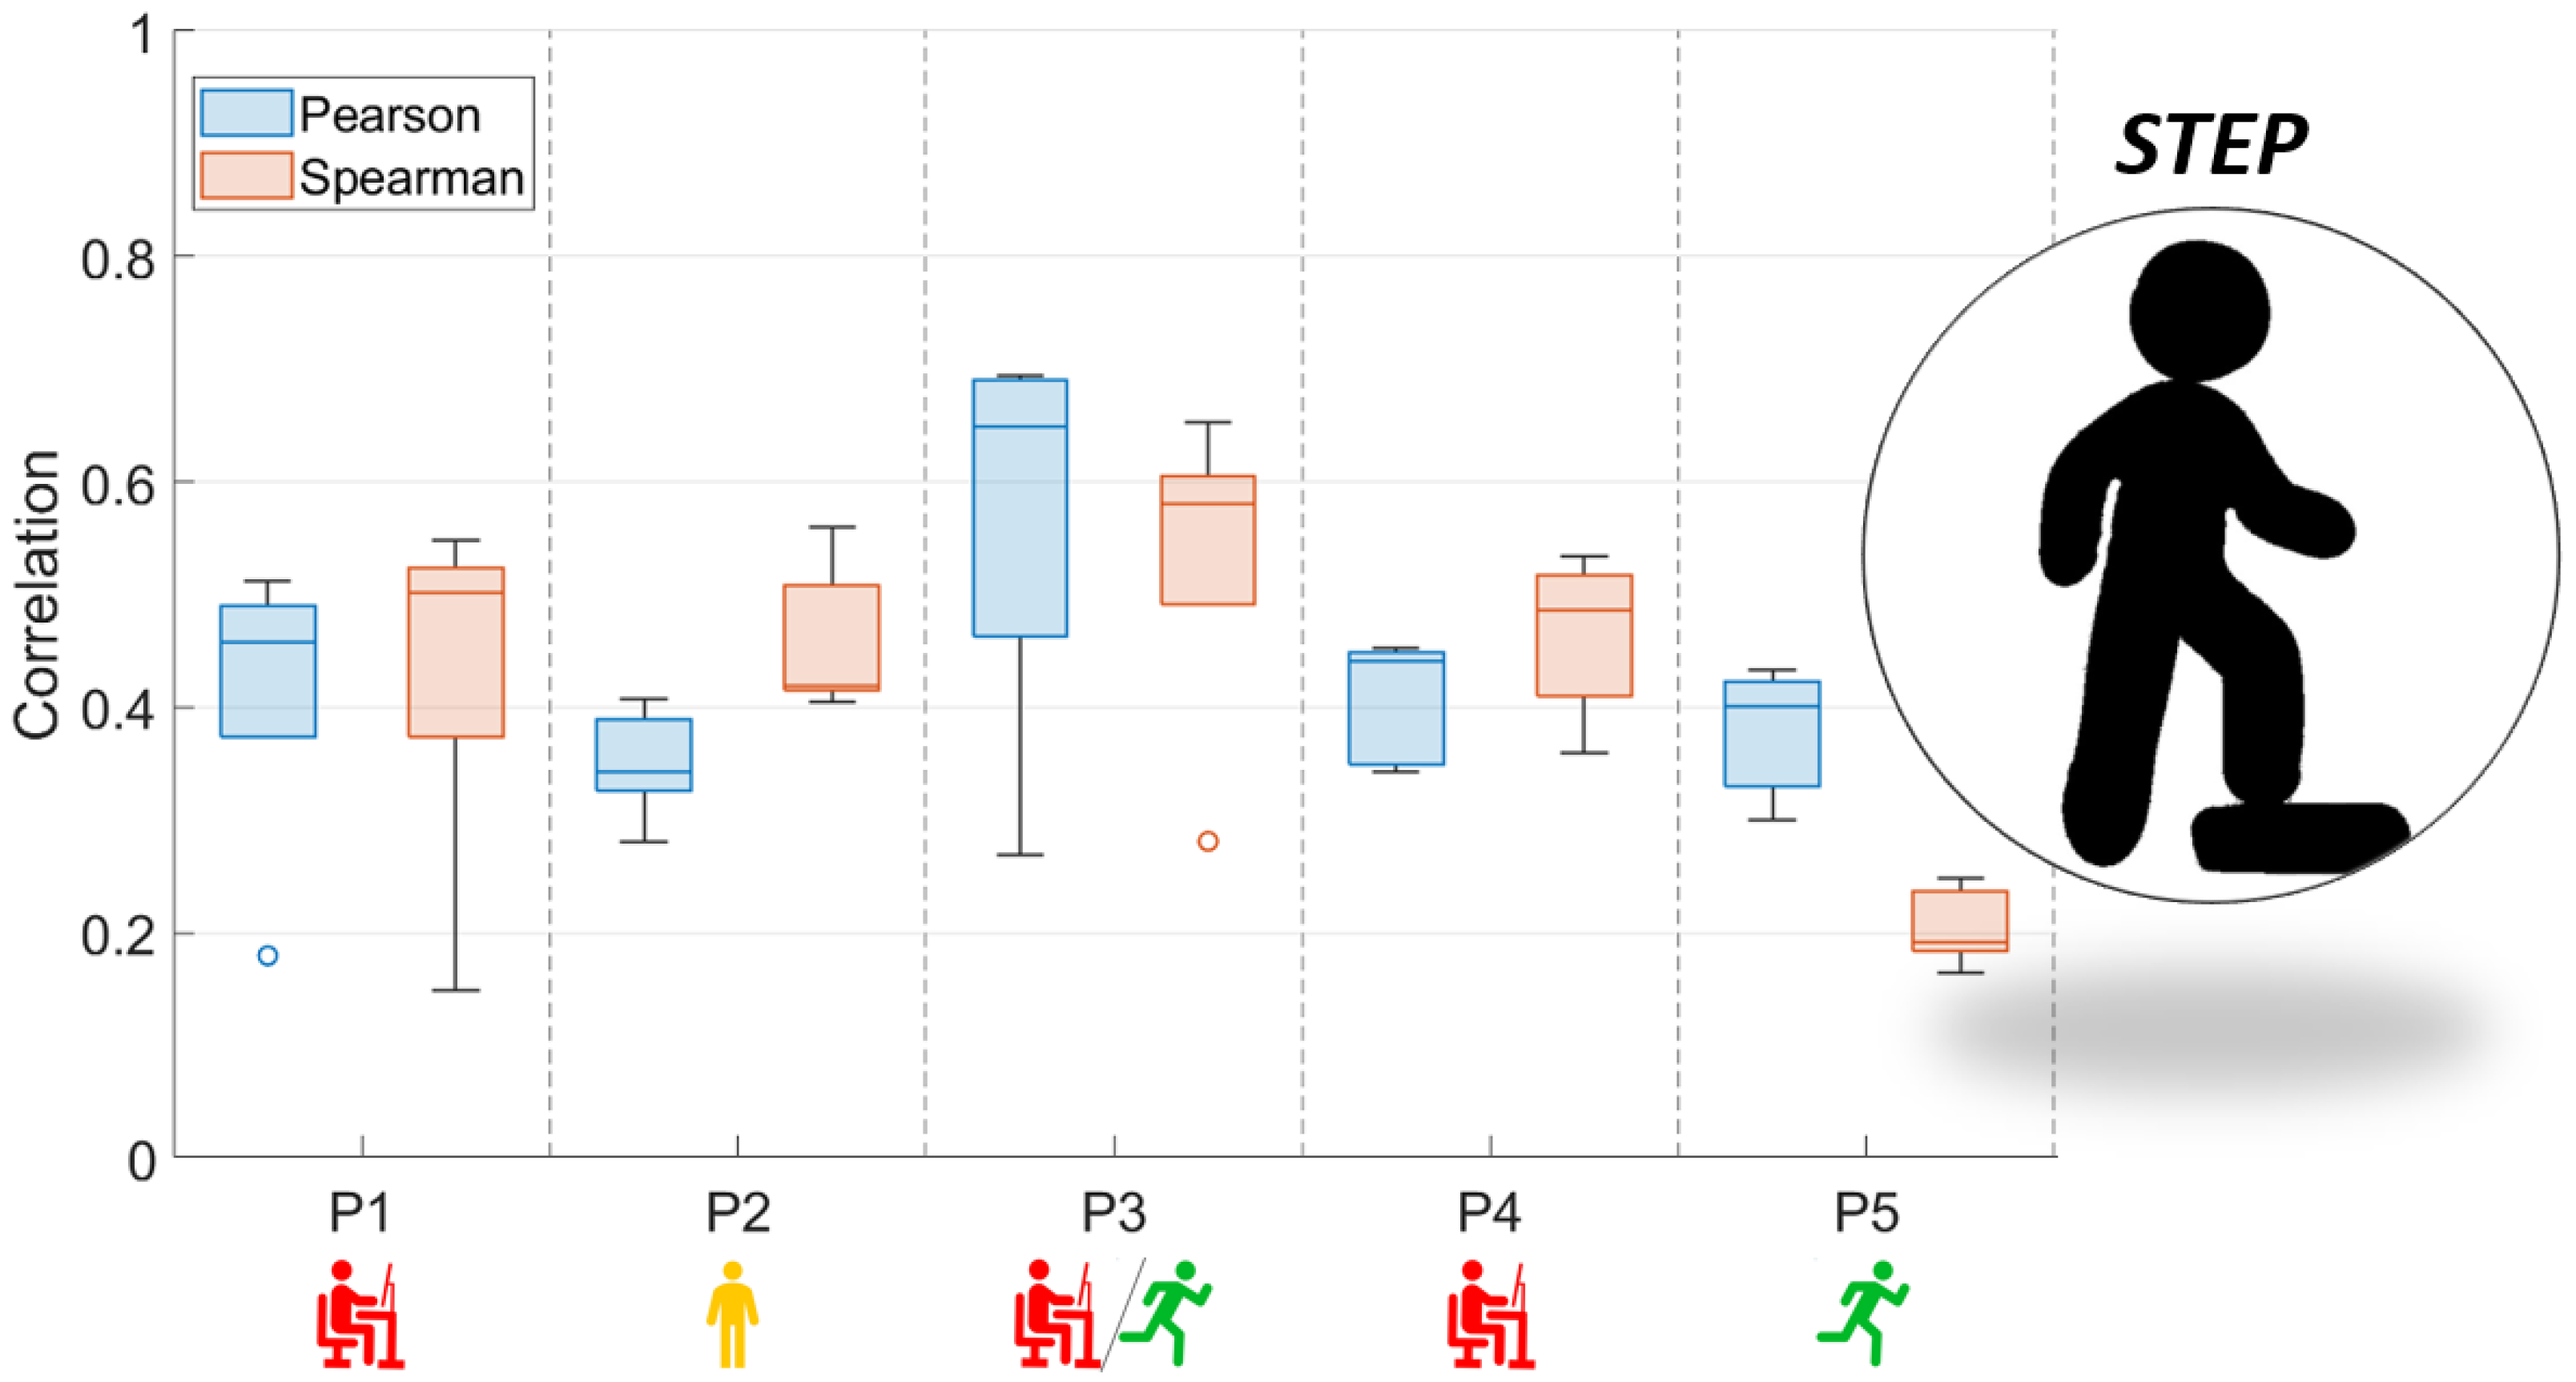
| Participant | N. of Stages | Correlation | MIN | MAX | Q1 | Q2 | Q3 |
|---|---|---|---|---|---|---|---|
| P1 | 5 | Pearson | 0.180 | 0.512 | 0.309 | 0.458 | 0.497 |
| Spearman | 0.149 | 0.548 | 0.299 | 0.502 | 0.532 | ||
| P2 | 5 | Pearson | 0.281 | 0.407 | 0.311 | 0.343 | 0.396 |
| Spearman | 0.406 | 0.560 | 0.412 | 0.419 | 0.526 | ||
| P3 | 5 | Pearson | 0.269 | 0.695 | 0.398 | 0.650 | 0.692 |
| Spearman | 0.281 | 0.654 | 0.421 | 0.580 | 0.622 | ||
| P4 | 5 | Pearson | 0.343 | 0.453 | 0.347 | 0.441 | 0.450 |
| Spearman | 0.359 | 0.535 | 0.393 | 0.486 | 0.523 | ||
| P5 | 5 | Pearson | 0.300 | 0.433 | 0.320 | 0.401 | 0.427 |
| Spearman | 0.165 | 0.248 | 0.177 | 0.192 | 0.241 |
| Participant | N. of Stages | Correlation | MIN | MAX | Q1 | Q2 | Q3 |
|---|---|---|---|---|---|---|---|
| P1 | 6 | Pearson | 0.207 | 0.682 | 0.301 | 0.544 | 0.642 |
| Spearman | 0.198 | 0.615 | 0.278 | 0.496 | 0.584 | ||
| P2 | 8 | Pearson | 0.593 | 0.830 | 0.619 | 0.707 | 0.792 |
| Spearman | 0.459 | 0.729 | 0.503 | 0.597 | 0.718 | ||
| P3 | 8 | Pearson | 0.532 | 0.790 | 0.654 | 0.734 | 0.761 |
| Spearman | 0.557 | 0.787 | 0.643 | 0.726 | 0.760 | ||
| P4 | 9 | Pearson | 0.372 | 0.742 | 0.387 | 0.470 | 0.691 |
| Spearman | 0.317 | 0.678 | 0.332 | 0.406 | 0.568 | ||
| P5 | 11 | Pearson | 0.631 | 0.850 | 0.691 | 0.788 | 0.825 |
| Spearman | 0.596 | 0.905 | 0.722 | 0.832 | 0.875 |
Disclaimer/Publisher’s Note: The statements, opinions and data contained in all publications are solely those of the individual author(s) and contributor(s) and not of MDPI and/or the editor(s). MDPI and/or the editor(s) disclaim responsibility for any injury to people or property resulting from any ideas, methods, instructions or products referred to in the content. |
© 2023 by the authors. Licensee MDPI, Basel, Switzerland. This article is an open access article distributed under the terms and conditions of the Creative Commons Attribution (CC BY) license (https://creativecommons.org/licenses/by/4.0/).
Share and Cite
Daniel, N.; Sybilski, K.; Kaczmarek, W.; Siemiaszko, D.; Małachowski, J. Relationship between EMG and fNIRS during Dynamic Movements. Sensors 2023, 23, 5004. https://doi.org/10.3390/s23115004
Daniel N, Sybilski K, Kaczmarek W, Siemiaszko D, Małachowski J. Relationship between EMG and fNIRS during Dynamic Movements. Sensors. 2023; 23(11):5004. https://doi.org/10.3390/s23115004
Chicago/Turabian StyleDaniel, Natalia, Kamil Sybilski, Wojciech Kaczmarek, Dariusz Siemiaszko, and Jerzy Małachowski. 2023. "Relationship between EMG and fNIRS during Dynamic Movements" Sensors 23, no. 11: 5004. https://doi.org/10.3390/s23115004
APA StyleDaniel, N., Sybilski, K., Kaczmarek, W., Siemiaszko, D., & Małachowski, J. (2023). Relationship between EMG and fNIRS during Dynamic Movements. Sensors, 23(11), 5004. https://doi.org/10.3390/s23115004