
Concurrent Validity and Test–Retest Reliability of Pressure-Detecting Insoles for Static and Dynamic Movements in Healthy Young Adults


Abstract
1. Introduction
2. Materials and Methods
2.1. Participants
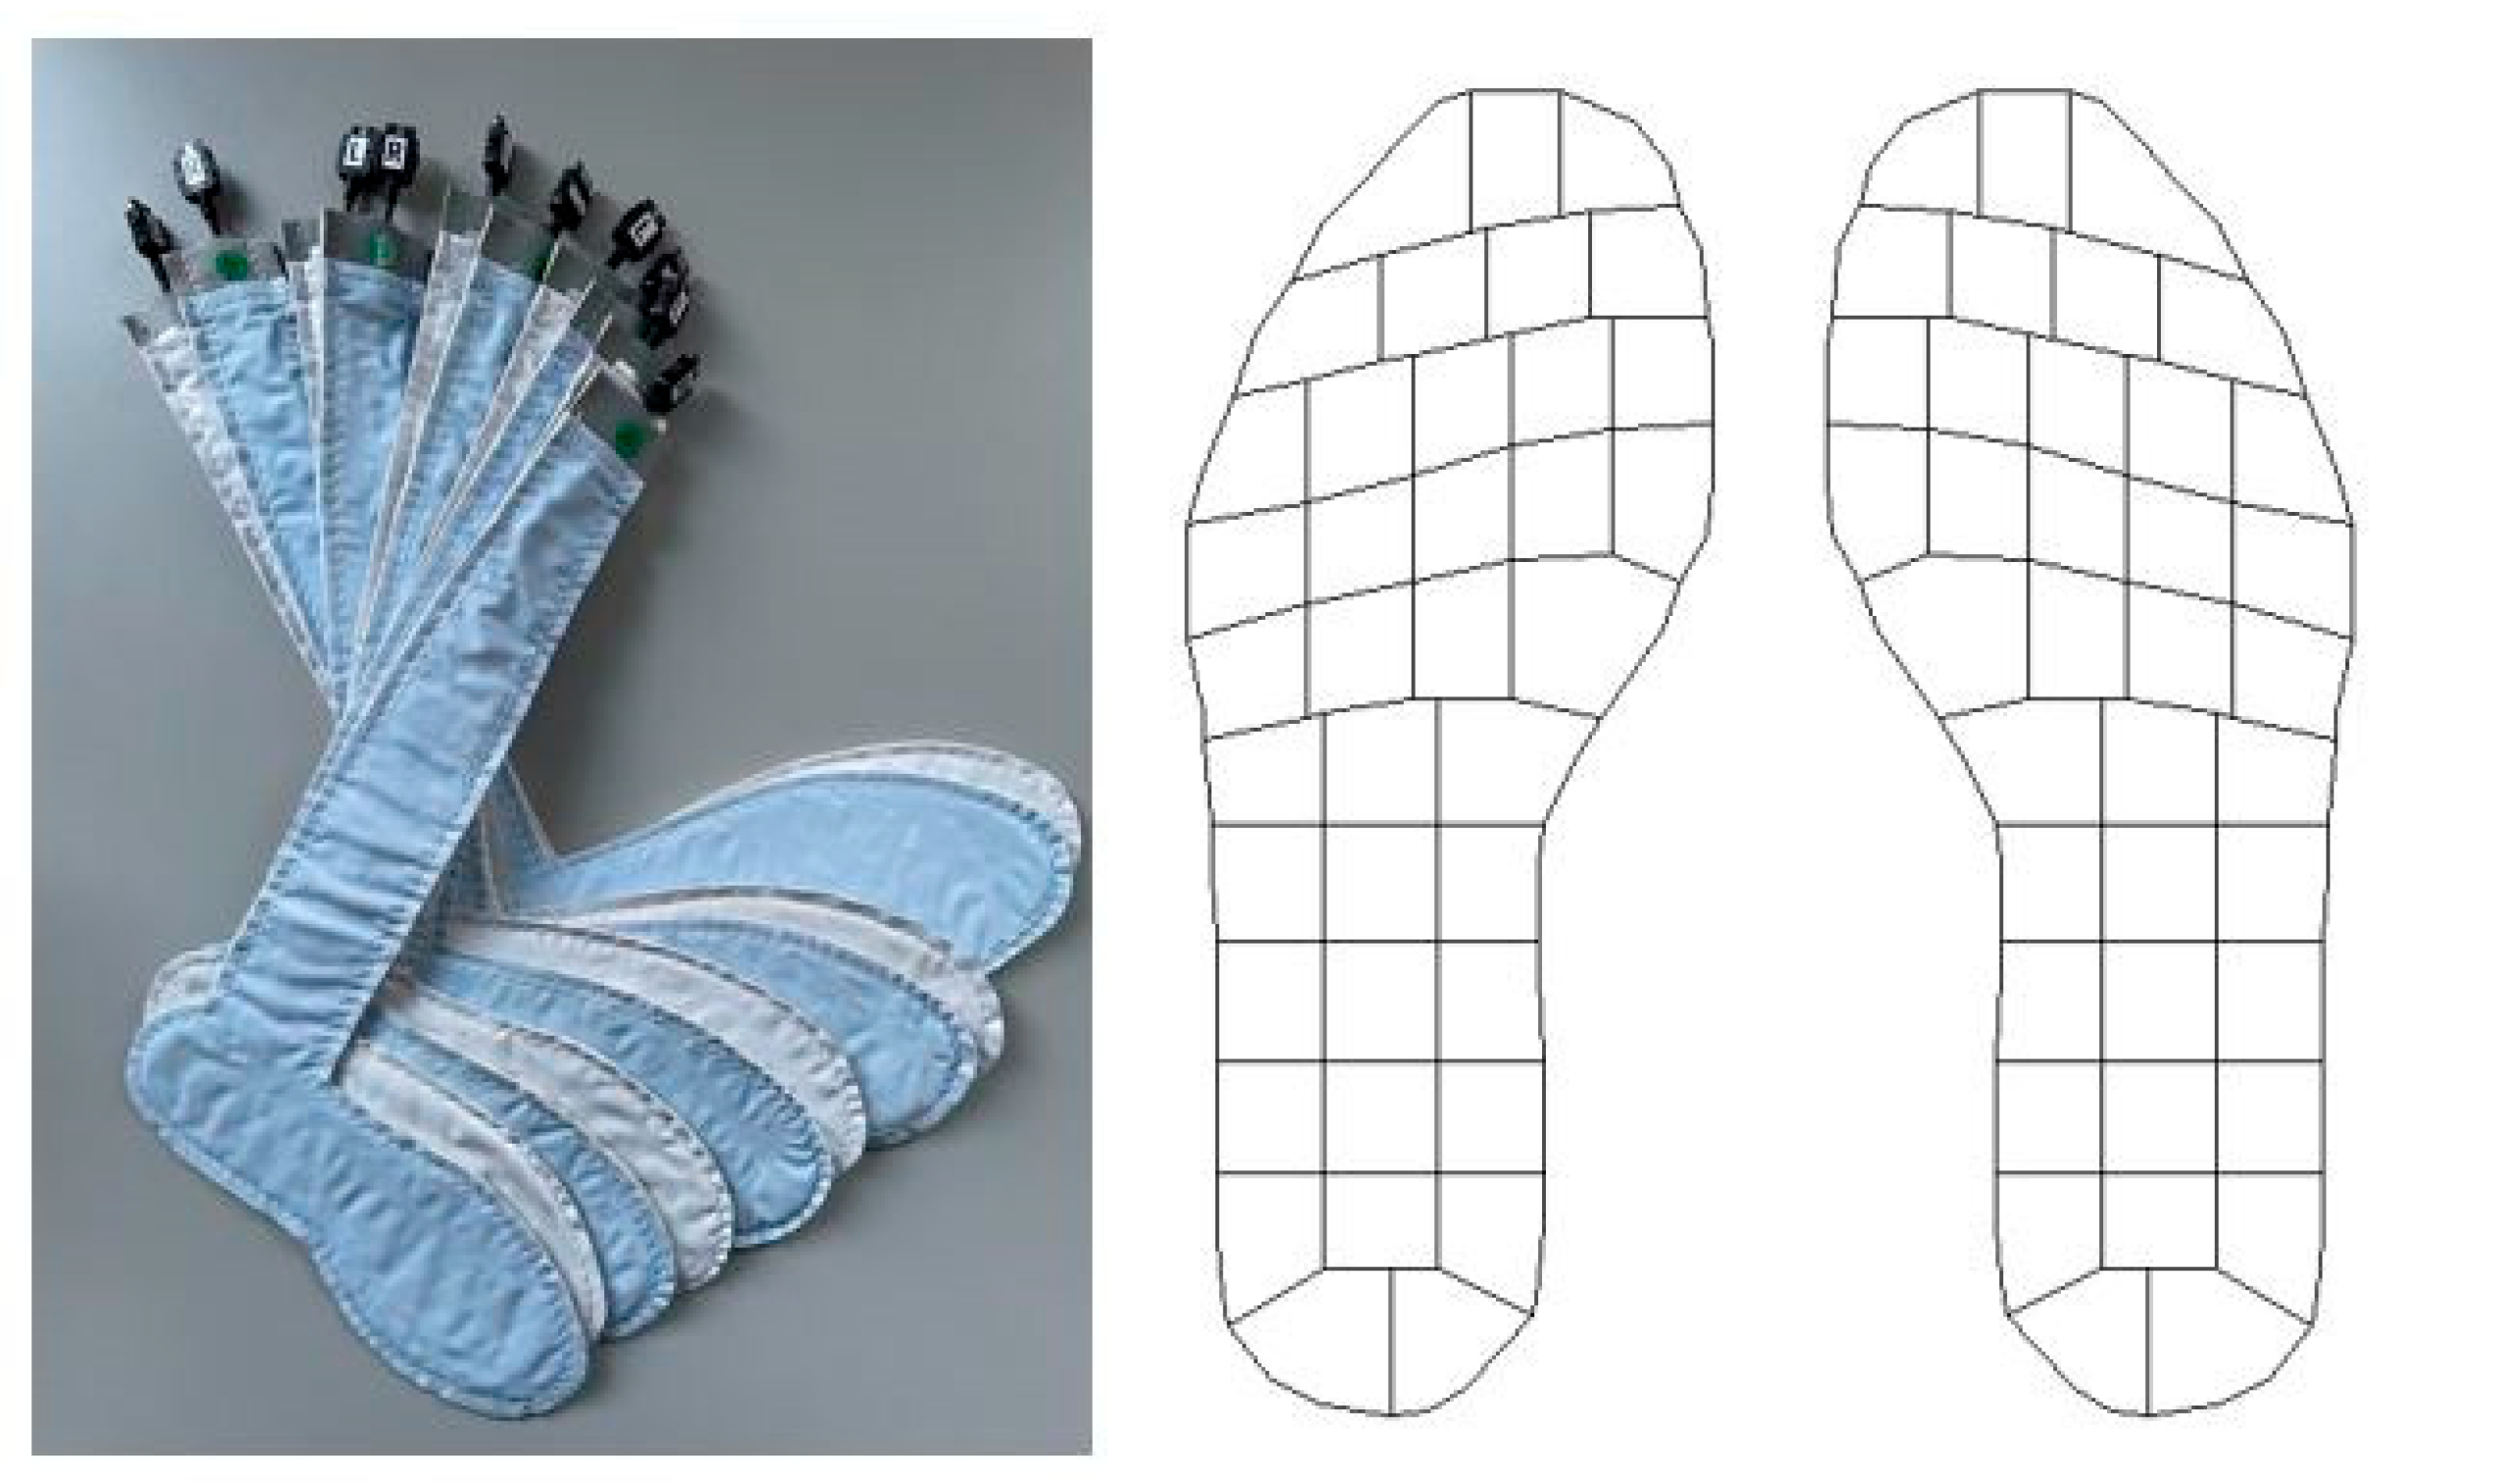
2.2. Assessment of Insole Data
2.3. Assessment of Force-Plate Data
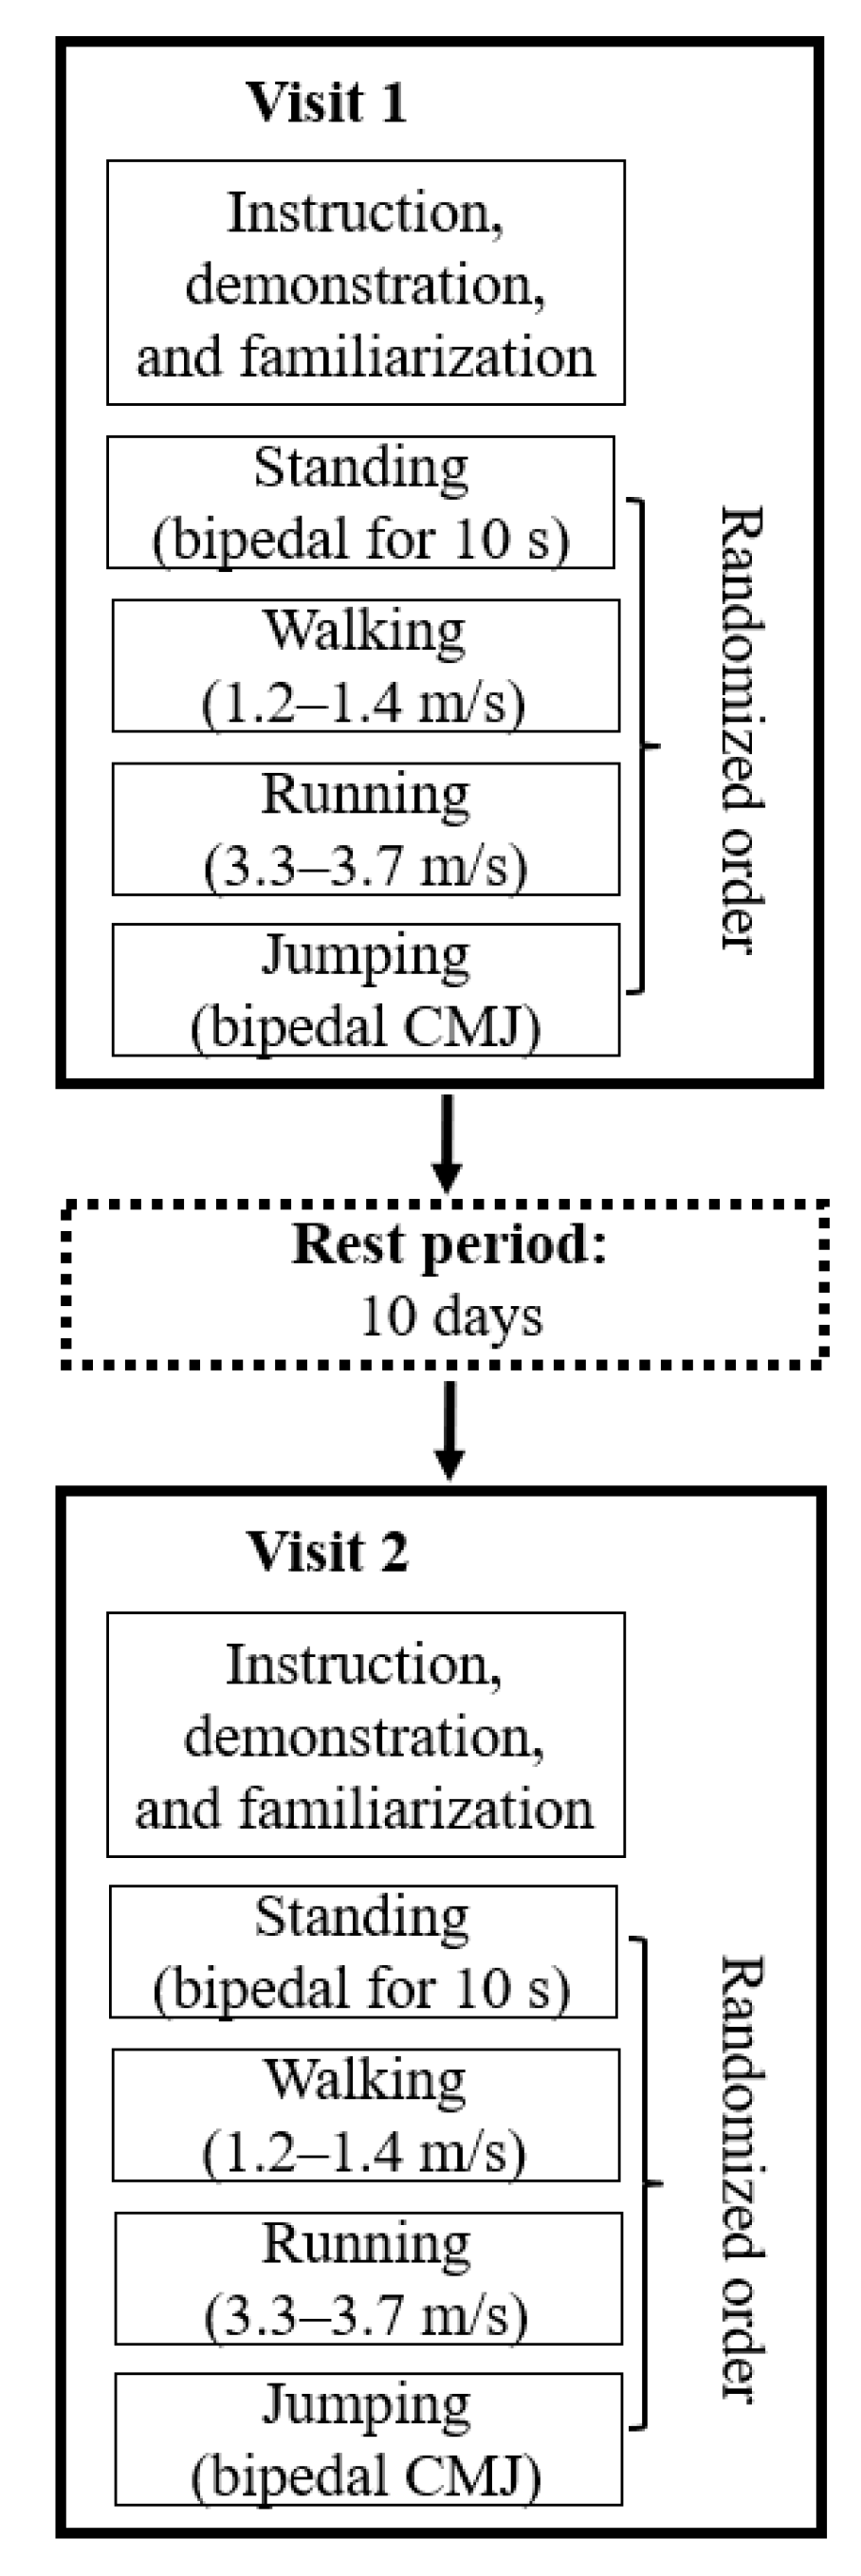
2.4. Procedures
2.5. Data Processing
2.6. Statistical Analyses
3. Results
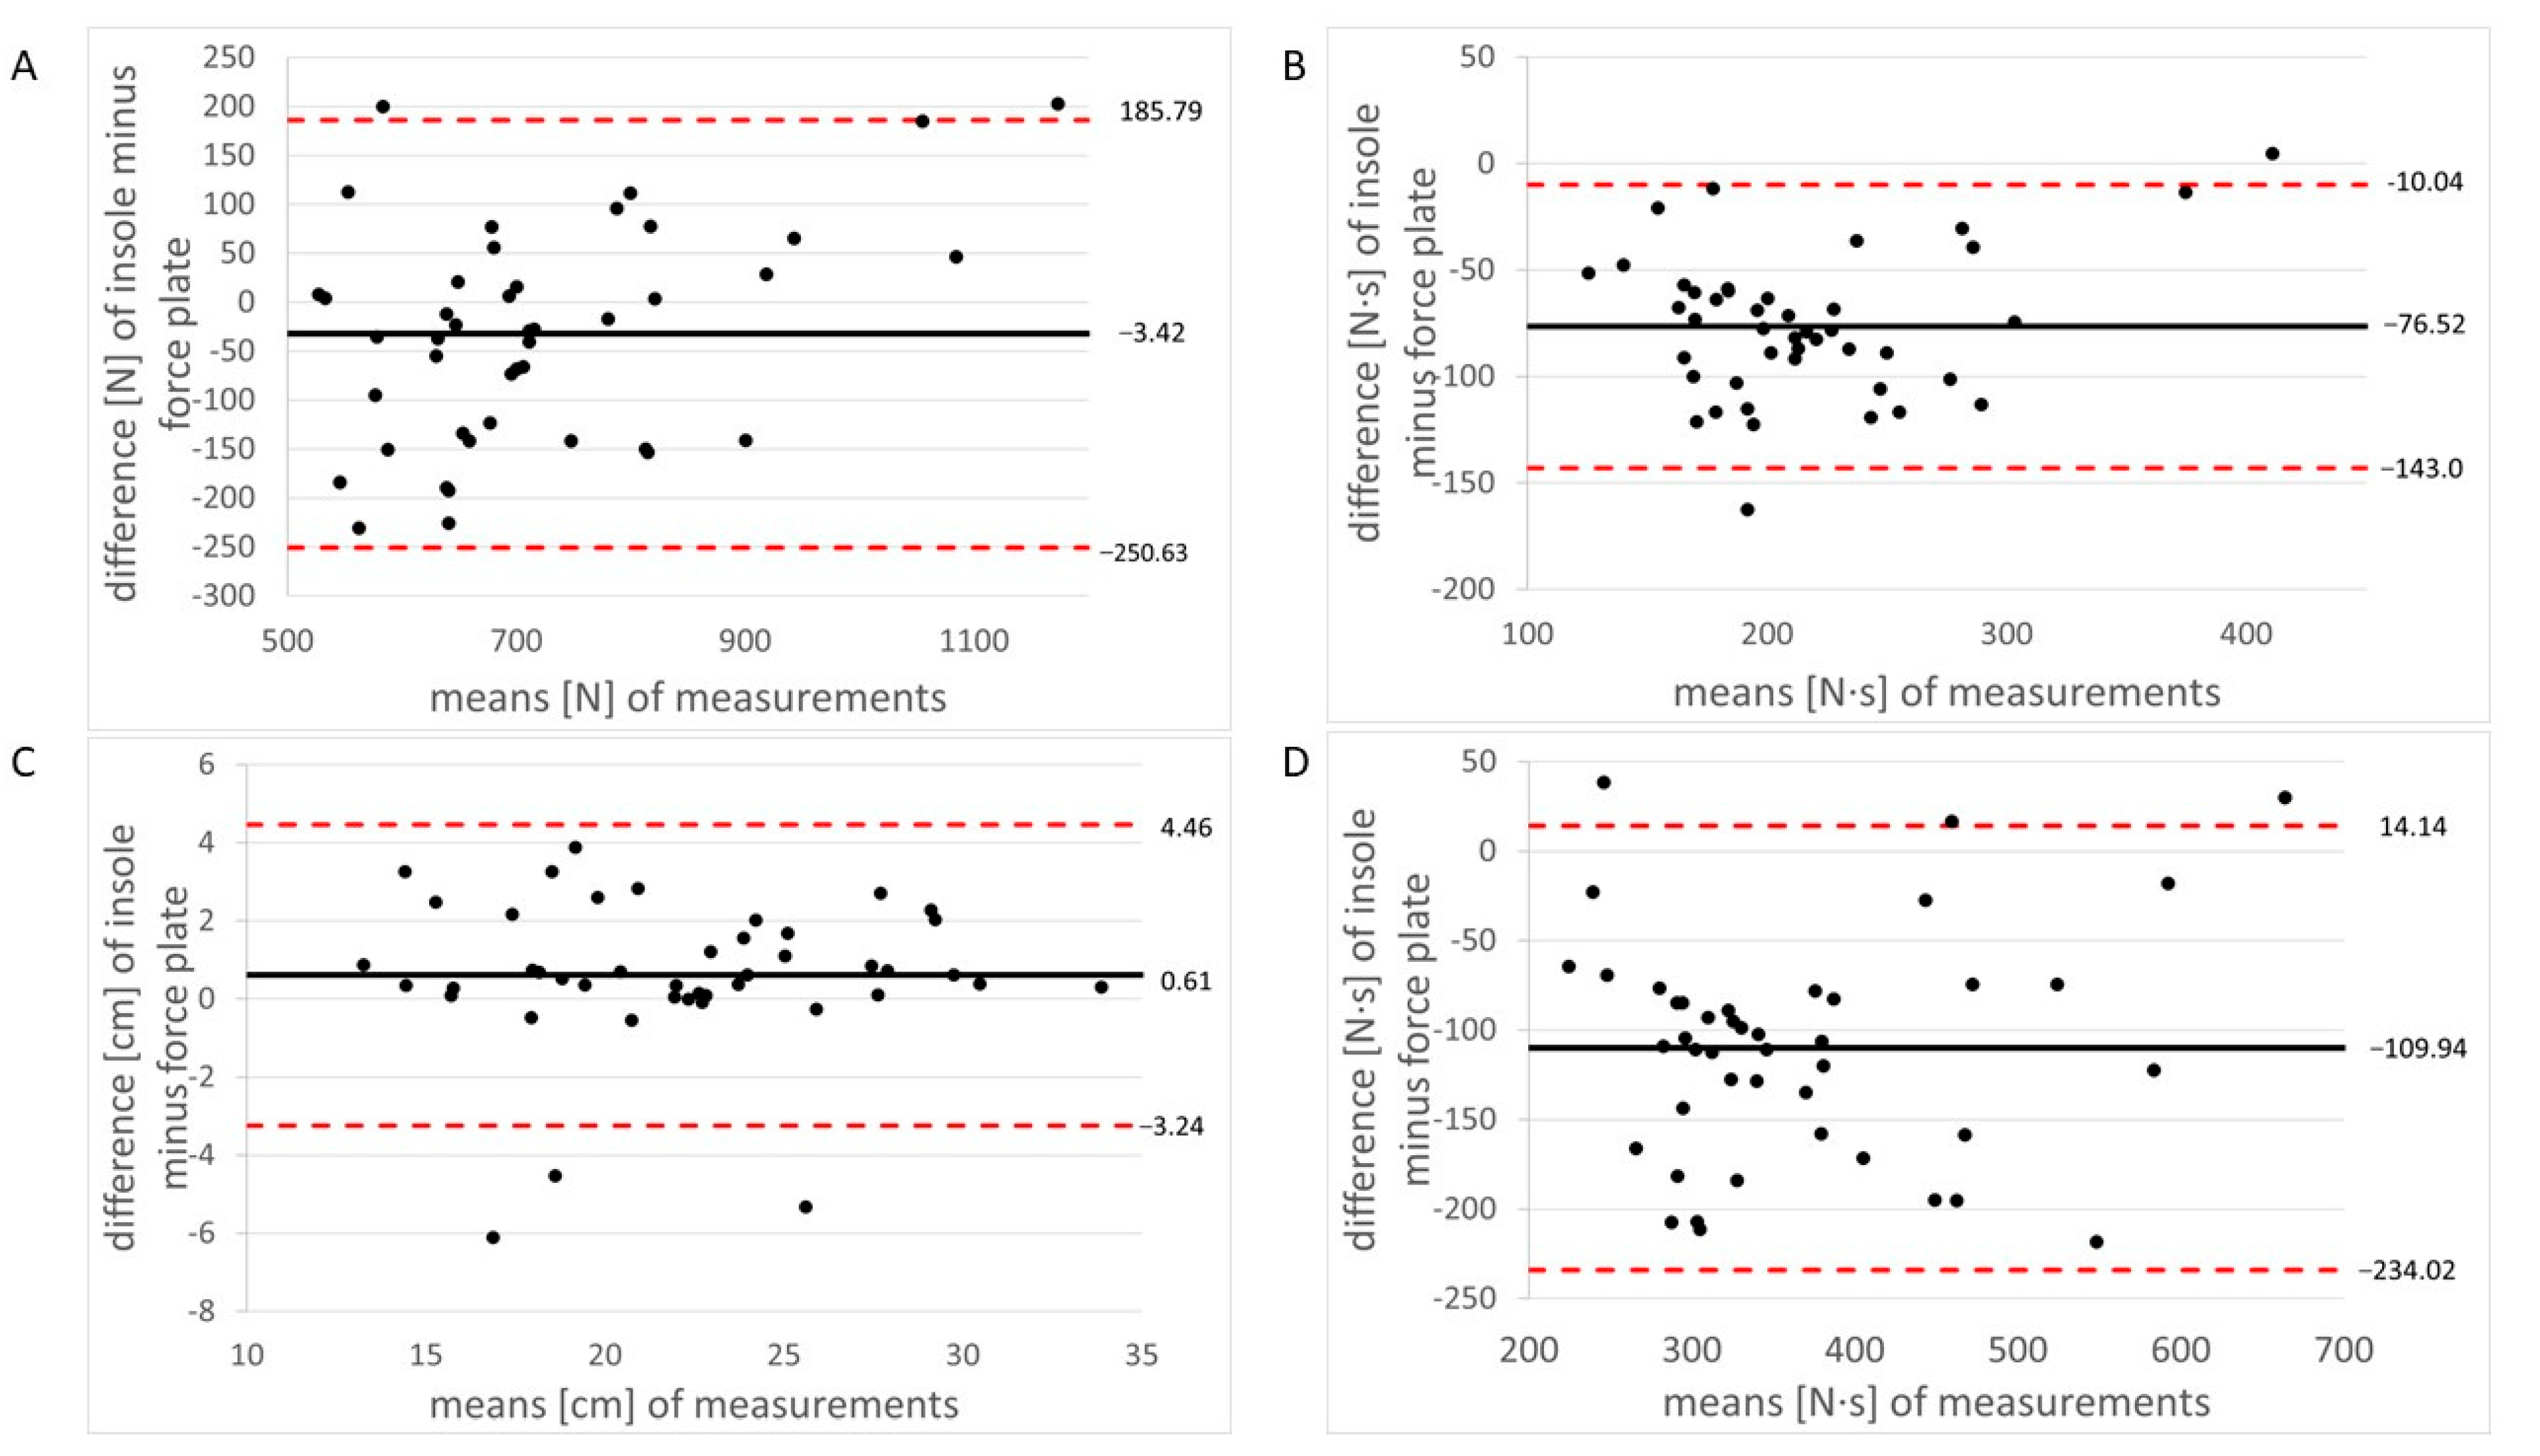
Concurrent Validity
4. Discussion
4.1. Concurrent Validity of the Pressure-Detecting Insoles Compared to the Force-Plate
4.2. Test–Retest Reliability of the Pressure-Detecting Insoles
5. Conclusions
Author Contributions
Funding
Institutional Review Board Statement
Informed Consent Statement
Data Availability Statement
Conflicts of Interest
References
- Ellenbecker, T.S.; Aoki, R. Step by step guide to understanding the kinetic chain concept in the overhead athlete. Curr. Rev. Musculoskelet. Med. 2020, 13, 155–163. [Google Scholar] [CrossRef] [PubMed]
- Bartlett, R. Introduction to Sports Biomechanics: Analysing Human Movement Patterns, 3rd ed.; Taylor and Francis, An Imprint of Routledge: Boca Raton, FL, USA, 2014; ISBN 9781134520190. [Google Scholar]
- Girard, O.; Micallef, J.-P.; Millet, G.P. Lower-limb activity during the power serve in tennis: Effects of performance level. Med. Sci. Sports Exerc. 2005, 37, 1021–1029. [Google Scholar] [PubMed]
- Hagen, M.; Abraham, C.; Ficklscherer, A.; Lahner, M. Biomechanical study of plantar pressures during walking in male soccer players with increased vs. normal hip alpha angles. Technol. Health Care 2015, 23, 93–100. [Google Scholar] [CrossRef] [PubMed]
- Sanchis-Sanchis, R.; Blasco-Lafarga, C.; Encarnación-Martínez, A.; Pérez-Soriano, P. Changes in plantar pressure and spatiotemporal parameters during gait in older adults after two different training programs. Gait Posture 2020, 77, 250–256. [Google Scholar] [CrossRef]
- Girard, O.; Micallef, J.-P.; Millet, G.P. Effects of the playing surface on plantar pressures during the first serve in tennis. Int. J. Sports Physiol. Perform. 2010, 5, 384–393. [Google Scholar] [CrossRef]
- Huang, P.; Liang, M.; Ren, F. Assessment of long-term badminton experience on foot posture index and plantar pressure distribution. Appl. Bionics Biomech. 2019, 2019, 8082967. [Google Scholar] [CrossRef]
- Azevedo, R.R.; da Rocha, E.S.; Franco, P.S.; Carpes, F.P. Plantar pressure asymmetry and risk of stress injuries in the foot of young soccer players. Phys. Ther. Sport 2017, 24, 39–43. [Google Scholar] [CrossRef]
- Ménard, A.-L.; Begon, M.; Barrette, J.; Green, B.; Ballaz, L.; Nault, M.-L. Plantar pressure analysis: Identifying risk of foot and ankle injury in soccer players. Transl. Sport. Med. 2021, 4, 684–690. [Google Scholar] [CrossRef]
- Kong, P.W.; Lam, W.K.; Ng, W.X.; Aziz, L.; Leong, H.F. In-Shoe plantar pressure profiles in amateur basketball players implications for footwear recommendations and orthosis use. J. Am. Podiatr. Med. Assoc. 2018, 108, 215–224. [Google Scholar] [CrossRef]
- Razak, A.H.A.; Zayegh, A.; Begg, R.K.; Wahab, Y. Foot plantar pressure measurement system: A review. Sensors 2012, 12, 9884–9912. [Google Scholar] [CrossRef]
- McPoil, T.; Cornwall, M.; Yamada, W. A comparison of two in-shoe plantar pressure measurement systems. Low. Extrem. 1995, 2, 95–103. [Google Scholar]
- Brinckmann, P.; Frobin, W.; Leivseth, G. Orthopaedic Biomechanic; Thieme: New York, NY, USA, 2000; ISBN 3131266317. [Google Scholar]
- Haley, S.M.; Fragala-Pinkham, M.A. Interpreting change scores of tests and measures used in physical therapy. Phys. Ther. 2006, 86, 735–743. [Google Scholar] [CrossRef] [PubMed]
- Price, C.; Parker, D.; Nester, C. Validity and repeatability of three in-shoe pressure measurement systems. Gait Posture 2016, 46, 69–74. [Google Scholar] [CrossRef] [PubMed]
- Cramer, L.A.; Wimmer, M.A.; Malloy, P.; O’Keefe, J.A.; Knowlton, C.B.; Ferrigno, C. Validity and reliability of the insole3 instrumented shoe insole for ground reaction force measurement during walking and running. Sensors 2022, 22, 2203. [Google Scholar] [CrossRef]
- Hurkmans, H.L.P.; Bussmann, J.B.J.; Benda, E.; Verhaar, J.A.N.; Stam, H.J. Accuracy and repeatability of the Pedar Mobile system in long-term vertical force measurements. Gait Posture 2006, 23, 118–125. [Google Scholar] [CrossRef]
- Renner, K.E.; Williams, D.S.B.; Queen, R.M. The Reliability and validity of the Loadsol® under various walking and running conditions. Sensors 2019, 19, 265. [Google Scholar] [CrossRef]
- Hurkmans, H.L.P.; Bussmann, J.B.J.; Selles, R.W.; Horemans, H.L.D.; Benda, E.; Stam, H.J.; Verhaar, J.A.N. Validity of the Pedar Mobile system for vertical force measurement during a seven-hour period. J. Biomech. 2006, 39, 110–118. [Google Scholar] [CrossRef]
- Stöggl, T.; Martiner, A. Validation of Moticon’s OpenGo sensor insoles during gait, jumps, balance and cross-country skiing specific imitation movements. J. Sport. Sci. 2017, 35, 196–206. [Google Scholar] [CrossRef]
- Ferrauti, A.; Fernandez-Fernandez, J.; Klapsing, G.M.; Ulbricht, A.; Rosenkranz, D. Diagnostic of footwork characteristics and running speed demands in tennis on different ground surfaces. Sport. Orthop. Traumatol. 2013, 29, 172–179. [Google Scholar] [CrossRef]
- Fleiss, J.L. The Design and Analysis of Clinical Experiments; Wiley: New York, NY, USA, 2010; ISBN 9781118031179. [Google Scholar]
- Nagahara, R.; Morin, J.-B. Sensor insole for measuring temporal variables and vertical force during sprinting. Proc. Inst. Mech. Eng. Part P J. Sport. Eng. Technol. 2018, 232, 369–374. [Google Scholar] [CrossRef]
- Kalpen, A.; Seitz, P. Comparison between the force values measured with the Pedar system and Kistler platform. Gait Posture 1994, 2, 236–237. [Google Scholar] [CrossRef]
- Kernozek, T.W.; LaMott, E.E.; Dancisak, M.J. Reliability of an in-shoe pressure measurement system during treadmill walking. Foot Ankle Int. 1996, 17, 204–209. [Google Scholar] [CrossRef] [PubMed]
- Adams, D.; Pozzi, F.; Willy, R.W.; Carrol, A.; Zeni, J. Altering cadence or vertical oscillation during running: Effects on running related injury factors. Int. J. Sport. Phys. Ther. 2018, 13, 633–642. [Google Scholar] [CrossRef]


| Characteristic | Value |
|---|---|
| Age [years] | 27.5 ± 9.2 |
| Sex [female/male] | 12/10 |
| Body height [cm] | 178.6 ± 3.7 |
| Body mass [kg] | 74.9 ± 13.6 |
| Shoe size [EU] | 42.0 ± 2.8 |
| Test Condition | vGRF Variable | Force-Plate Mean ± SD | Insoles Mean ± SD | ICC3,2 (95% CI) | Mean Bias [%] |
|---|---|---|---|---|---|
| Standing | Mass [N] | 734.43 ± 133.54 | 702.01 ± 177.13 | 0.86 (0.74–0.92) | −4.41 |
| Walking | Peak 1 [N] | 845.10 ± 150.30 | 719.08 ± 187.08 | 0.82 (0.67–0.90) | −14.91 |
| Peak 2 [N] | 817.60 ± 148.51 | 513.84 ± 200.29 | 0.87 (0.76–0.93) | −37.15 | |
| Valley [N] | 510.66 ± 111.57 | 376.12 ± 142.09 | 0.85 (0.72–0.92) | −26.35 | |
| Impulse [N∙s] | 420.15 ± 103.43 | 310.21 ± 110.47 | 0.90 (0.82–0.95) | −26.17 | |
| Contact time [s] | 0.70 ± 0.06 | 0.72 ± 0.06 | 0.98 (0.95–0.99) | 1.85 | |
| Running | Peak max [N] | 1741.02 ± 299.17 | 1229.06 ± 368.19 | 0.91 (0.84–0.95) | −29.41 |
| Impulse [N∙s] | 253.77 ± 55.25 | 177.25 ± 63.04 | 0.91 (0.84–0.95) | −30.15 | |
| Contact time [s] | 0.25 ± 0.02 | 0.25 ± 0.03 | 0.87 (0.77–0.93) | 0.97 | |
| Jumping | Propulsive force [N] | 1576.59 ± 308.44 | 1186.63 ± 303.11 | 0.82 (0.67–0.90) | −24.73 |
| Landing force [N] | 2869.35 ± 613.12 | 2200.74 ± 716.91 | 0.95 (0.90–0.97) | −23.30 | |
| Jump height [cm] | 22.39 ± 5.03 | 21.78 ± 4.99 | 0.96 (0.93–0.98) | 2.80 |
| Test Condition | vGRF Variable | Insoles: Visit 1 Mean ± SD | Insoles: Visit 2 Mean ± SD | ICC3,2 (95% CI) | SEM * | MDC95% [%] |
|---|---|---|---|---|---|---|
| Standing | Mass [N] | 716.35 ± 198.65 | 687.68 ± 156.05 | 0.94 (0.84–0.97) | 45.16 | 2.65 |
| Walking | Peak 1 [N] | 742.33 ± 197.38 | 695.83 ± 177.69 | 0.95 (0.89–0.98) | 40.12 | 2.44 |
| Peak 2 [N] | 524.97 ± 215.85 | 502.71 ± 187.85 | 0.97 (0.93–0.99) | 34.69 | 3.17 | |
| Valley [N] | 382.73 ± 151.80 | 369.52 ± 134.94 | 0.95 (0.87–0.98) | 33.32 | 4.25 | |
| Impulse [N∙s] | 318.43 ± 118.20 | 301.99 ± 104.28 | 0.97 (0.93–0.99) | 20.67 | 4.06 | |
| Contact time [s] | 0.72 ± 0.06 | 0.71 ± 0.06 | 0.74 (0.36–0.89) | 0.03 | 65.73 | |
| Running | Peak max [N] | 1253.11 ± 383.07 | 1205.02 ± 360.05 | 0.98 (0.94–0.99) | 57.04 | 1.70 |
| Impulse [N∙s] | 183.05 ± 67.80 | 171.45 ± 58.90 | 0.97 (0.93–0.99) | 10.55 | 5.08 | |
| Contact time [s] | 0.25 ± 0.02 | 0.25 ± 0.03 | 0.85 (0.65–0.94) | 0.01 | 112.00 | |
| Jumping | Propulsive force [N] | 1214.55 ± 316.83 | 1158.71 ± 293.45 | 0.89 (0.74–0.96) | 99.15 | 2.32 |
| Landing force [N] | 2391.45 ± 822.78 | 2192.24 ± 691.49 | 0.91 (0.78–0.96) | 227.34 | 1.82 | |
| Jump height [cm] | 23.31 ± 4.31 | 21.46 ± 5.60 | 0.81 (0.53–0.92) | 2.21 | 18.41 |
| Test Condition | vGRF Variable | Force-Plate: Visit 1 Mean ± SD | Force-Plate: Visit 2 Mean ± SD | ICC3,2 (95% CI) | SEM * | MDC95% [%] |
|---|---|---|---|---|---|---|
| Standing | Mass [N] | 728.66 ± 143.48 | 740.21 ± 125.93 | 0.97 (0.94–0.99) | 21.53 | 1.75 |
| Walking | Peak 1 [N] | 837.59 ± 162.70 | 852.60 ± 140.24 | 0.96 (0.90–0.98) | 30.06 | 1.80 |
| Peak 2 [N] | 806.25 ± 152.49 | 828.94 ± 147.10 | 0.95 (0.83–0.97) | 32.88 | 1.94 | |
| Valley [N] | 506.95 ± 120.87 | 514.37 ± 104.16 | 0.93 (0.83–0.97) | 29.31 | 2.93 | |
| Impulse [N∙s] | 415.64 ± 111.84 | 424.66 ± 96.72 | 0.94 (0.85–0.98) | 25.55 | 3.33 | |
| Contact time [s] | 0.70 ± 0.06 | 0.70 ± 0.06 | 0.74 (0.37–0.89) | 0.03 | 70.00 | |
| Running | Peak max [N] | 1752.72 ± 324.65 | 1729.32 ± 278.53 | 0.98 (0.94–0.99) | 46.35 | 1.08 |
| Impulse [N∙s] | 253.93 ± 60.58 | 253.62 ± 50.79 | 0.88 (0.71–0.95) | 19.14 | 4.78 | |
| Contact time [s] | 0.25 ± 0.03 | 0.25 ± 0.02 | 0.94 (0.85–0.97) | 0.01 | 88.00 | |
| Jumping | Propulsive force [N] | 1568.84 ± 293.52 | 1584.35 ± 328.66 | 0.95 (0.87–0.98) | 138.11 | 2.06 |
| Landing force [N] | 3007.96 ± 655.82 | 2913.41 ± 629.10 | 0.95 (0.88–0.98) | 148.00 | 1.14 | |
| Jump height [cm] | 23.13 ± 4.26 | 21.01 ± 5.30 | 0.80 (0.52–0.92) | 1.09 | 13.09 |
Disclaimer/Publisher’s Note: The statements, opinions and data contained in all publications are solely those of the individual author(s) and contributor(s) and not of MDPI and/or the editor(s). MDPI and/or the editor(s) disclaim responsibility for any injury to people or property resulting from any ideas, methods, instructions or products referred to in the content. |
© 2023 by the authors. Licensee MDPI, Basel, Switzerland. This article is an open access article distributed under the terms and conditions of the Creative Commons Attribution (CC BY) license (https://creativecommons.org/licenses/by/4.0/).
Share and Cite
Lambrich, J.; Hagen, M.; Schwiertz, G.; Muehlbauer, T. Concurrent Validity and Test–Retest Reliability of Pressure-Detecting Insoles for Static and Dynamic Movements in Healthy Young Adults. Sensors 2023, 23, 4913. https://doi.org/10.3390/s23104913
Lambrich J, Hagen M, Schwiertz G, Muehlbauer T. Concurrent Validity and Test–Retest Reliability of Pressure-Detecting Insoles for Static and Dynamic Movements in Healthy Young Adults. Sensors. 2023; 23(10):4913. https://doi.org/10.3390/s23104913
Chicago/Turabian StyleLambrich, Johanna, Marco Hagen, Gerrit Schwiertz, and Thomas Muehlbauer. 2023. "Concurrent Validity and Test–Retest Reliability of Pressure-Detecting Insoles for Static and Dynamic Movements in Healthy Young Adults" Sensors 23, no. 10: 4913. https://doi.org/10.3390/s23104913
APA StyleLambrich, J., Hagen, M., Schwiertz, G., & Muehlbauer, T. (2023). Concurrent Validity and Test–Retest Reliability of Pressure-Detecting Insoles for Static and Dynamic Movements in Healthy Young Adults. Sensors, 23(10), 4913. https://doi.org/10.3390/s23104913