
An Accurate Millimeter-Wave Imaging Algorithm for Close-Range Monostatic System

 , , ,
, , ,  and
and
Abstract
1. Introduction
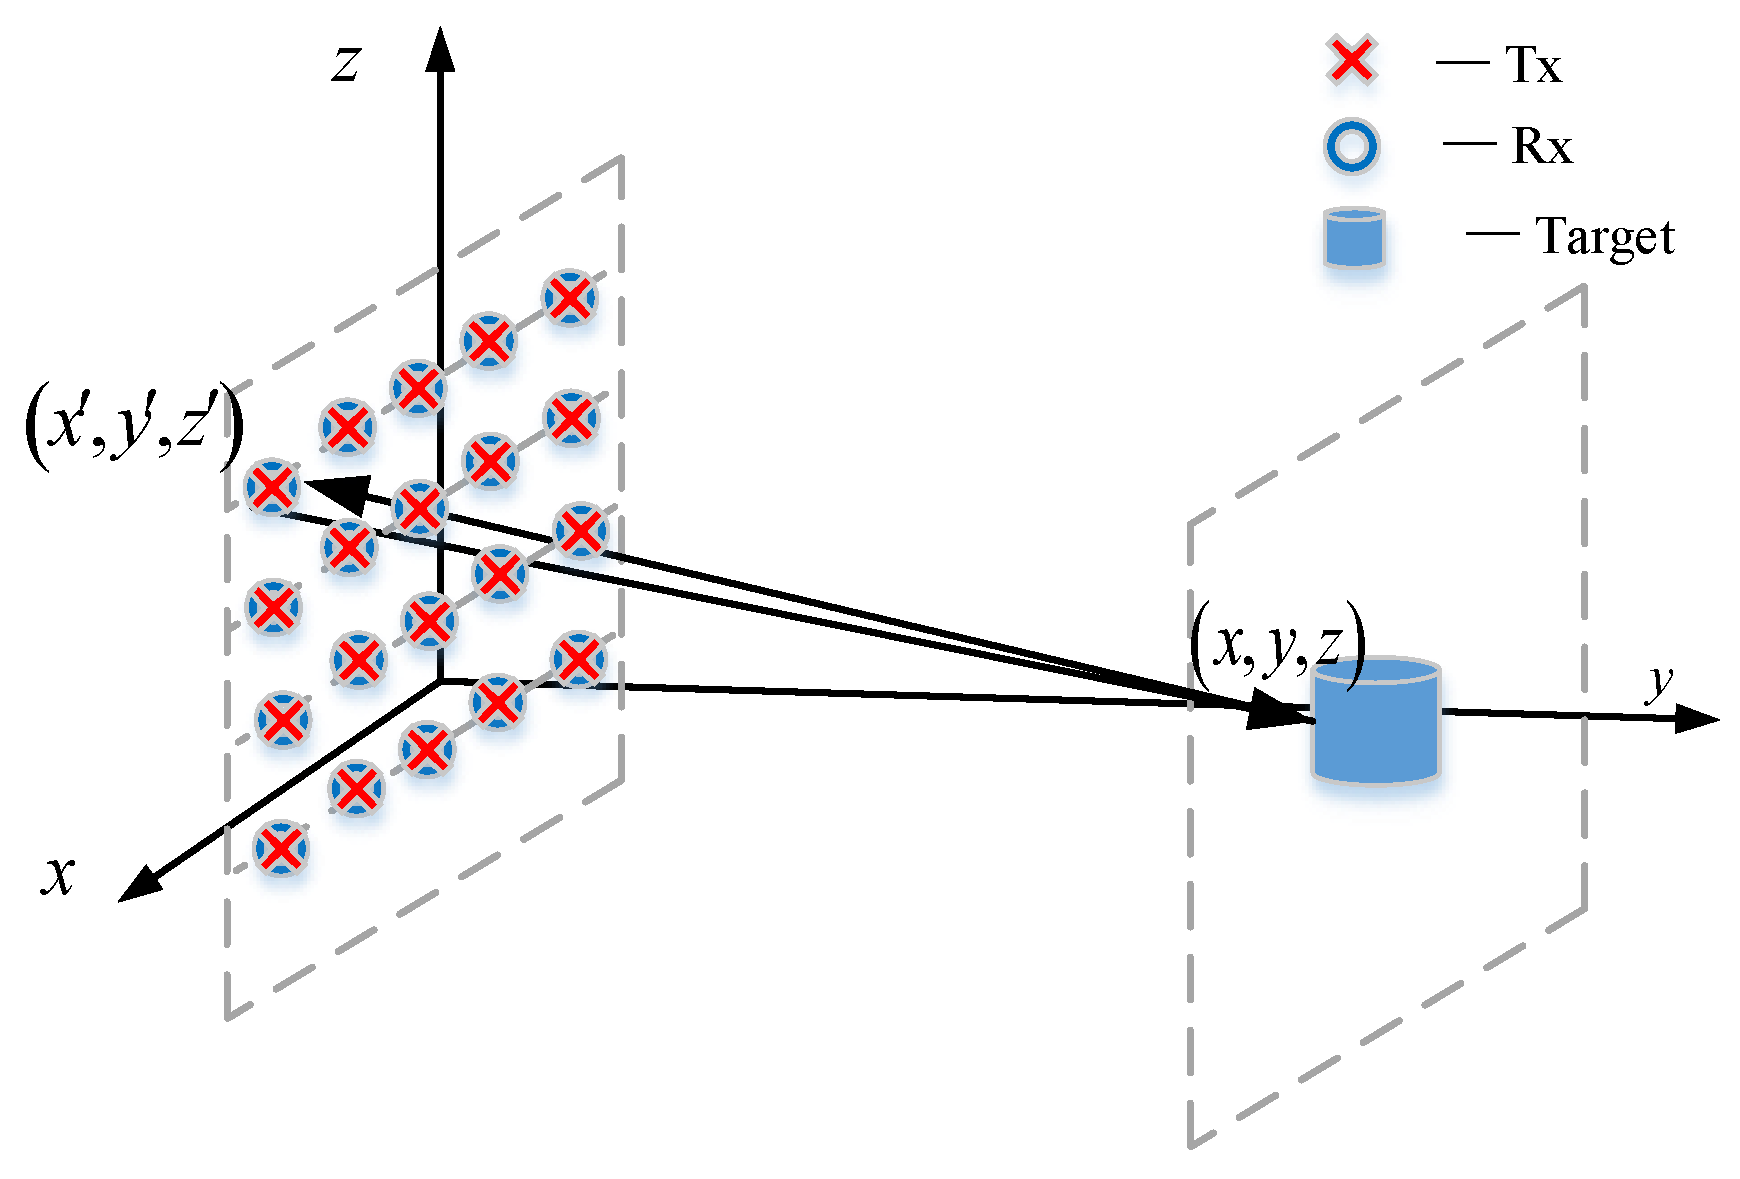
2. Theory
3. Results and Discussions
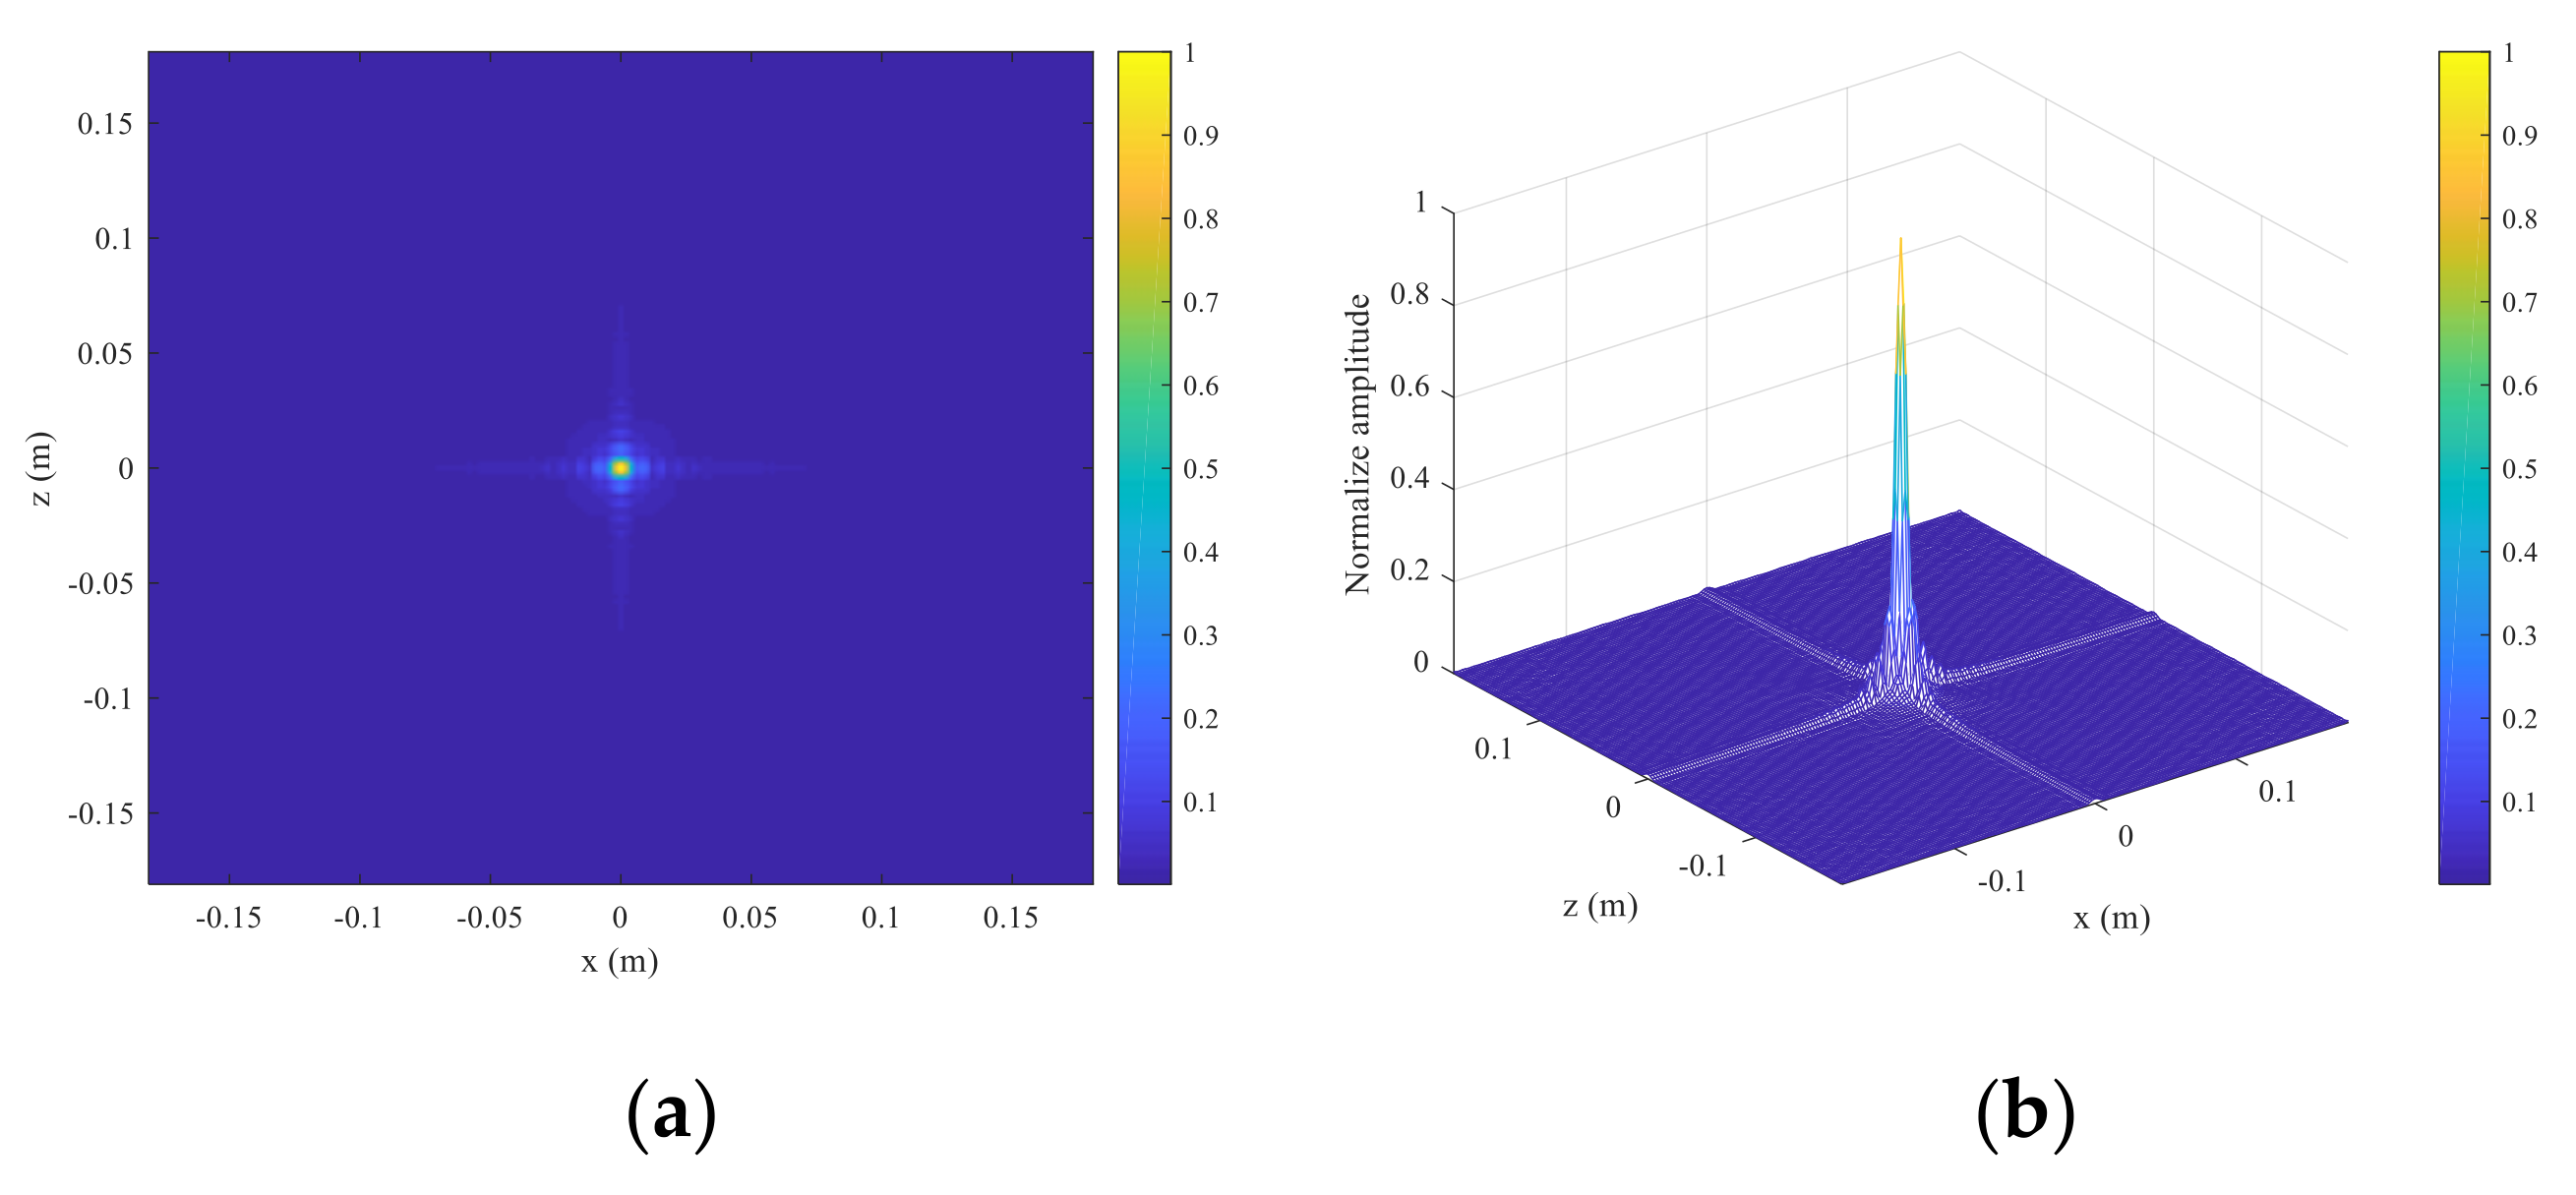
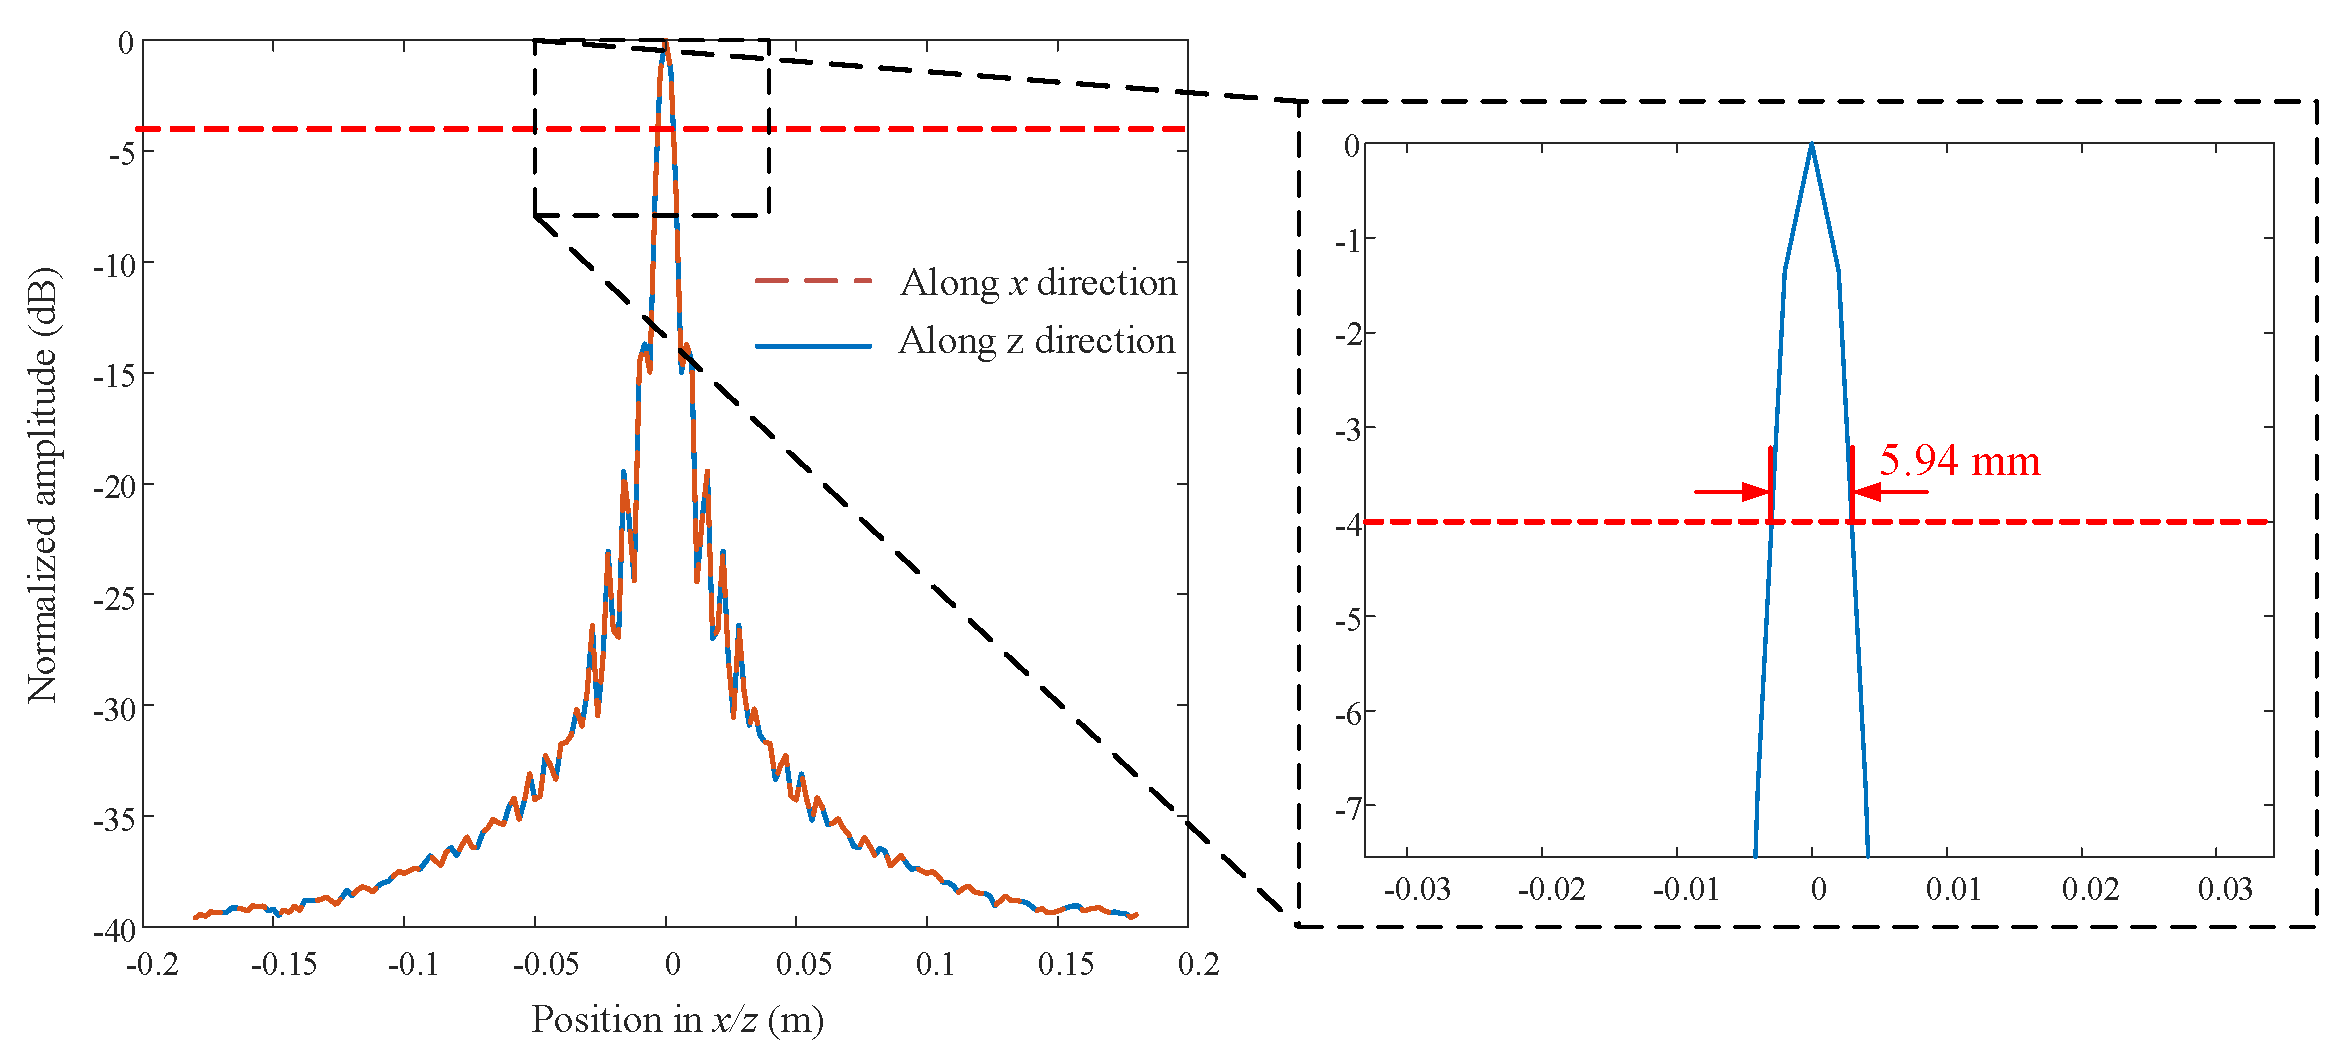
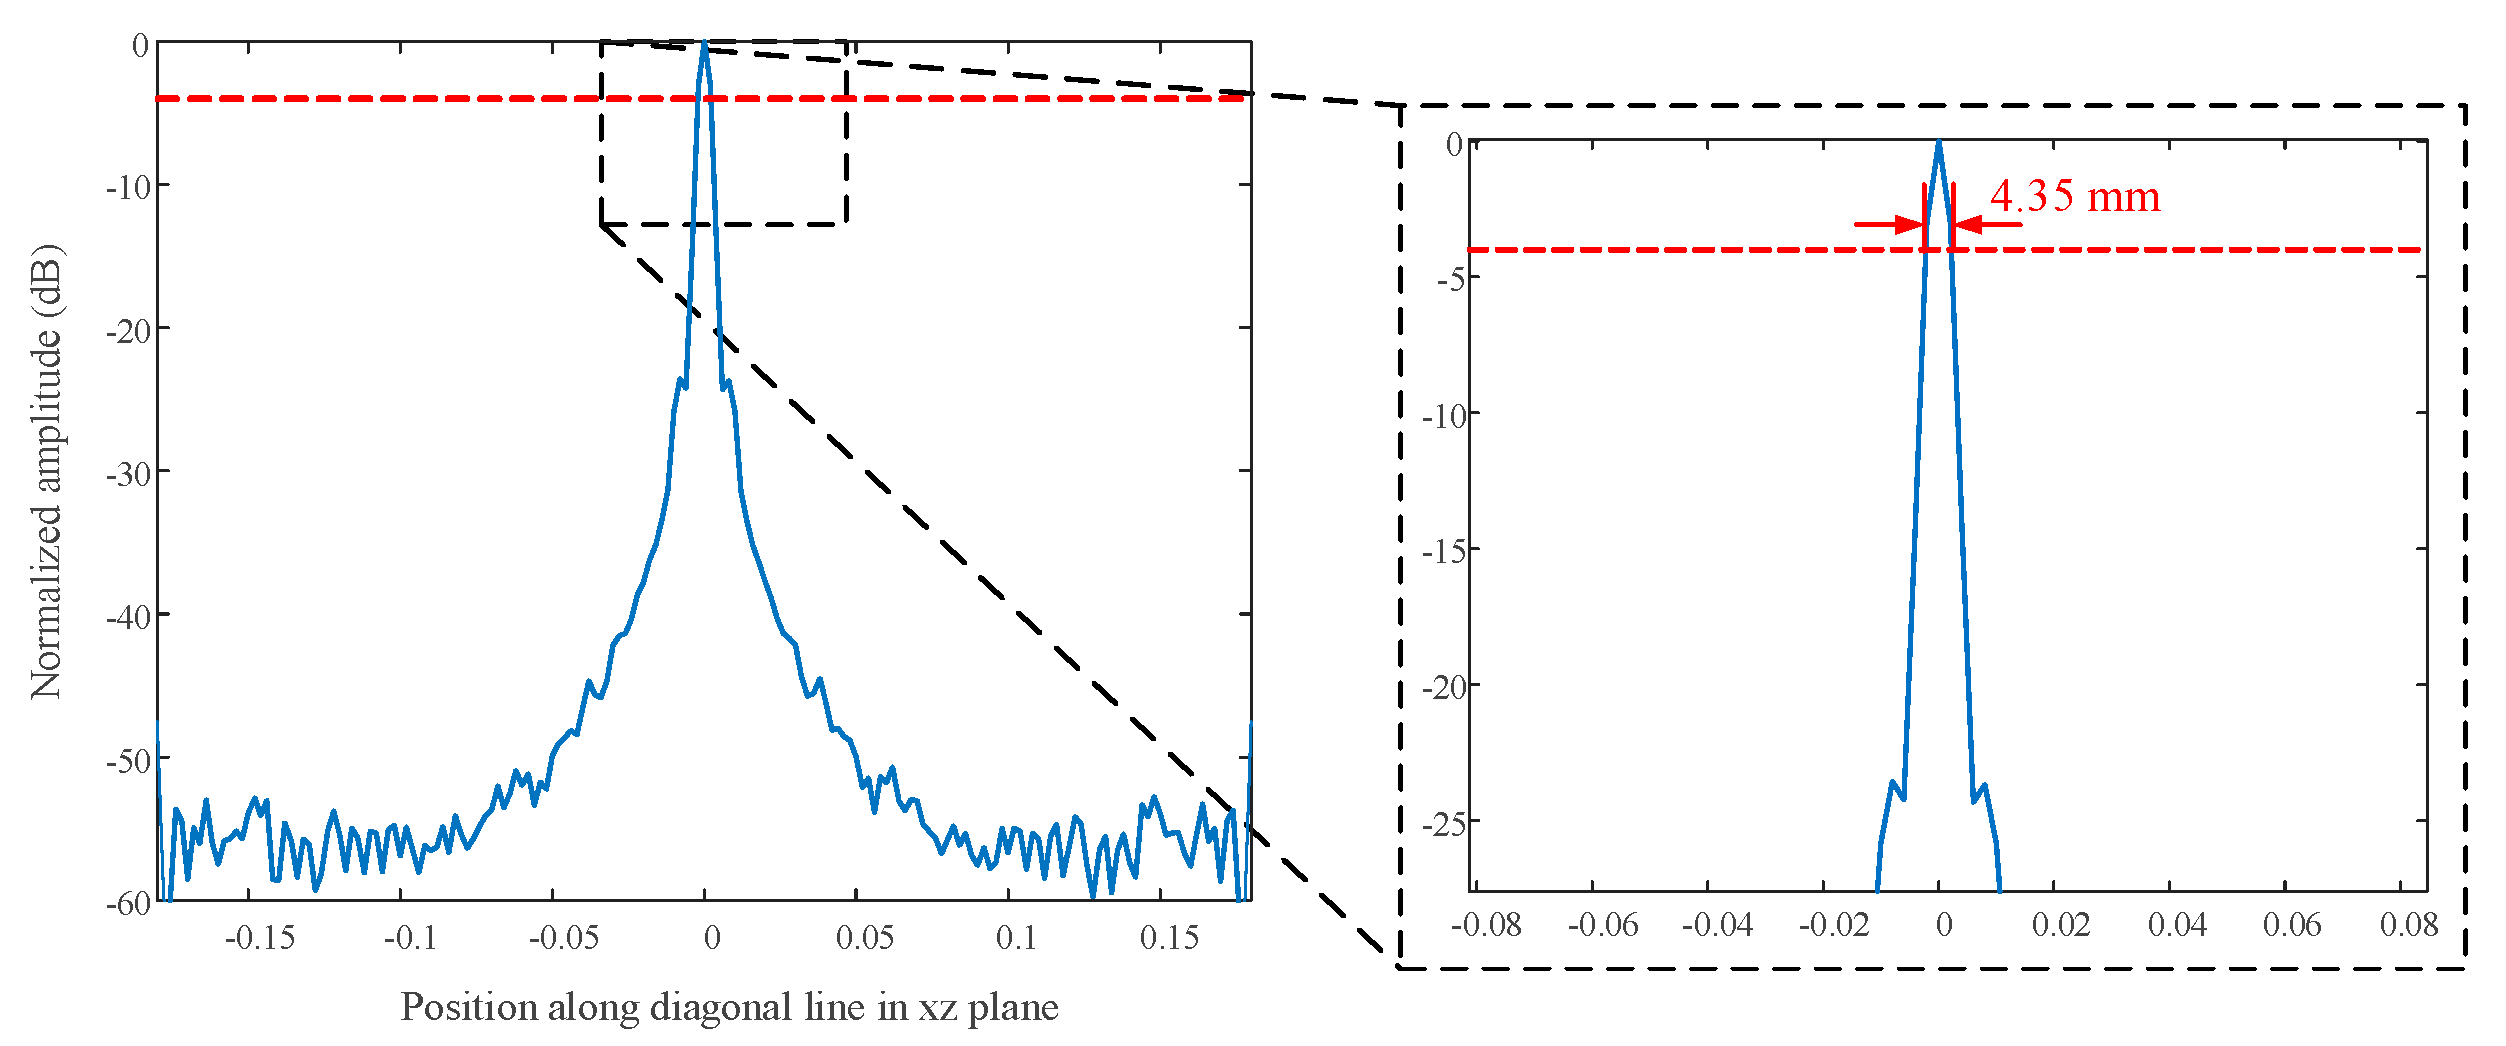
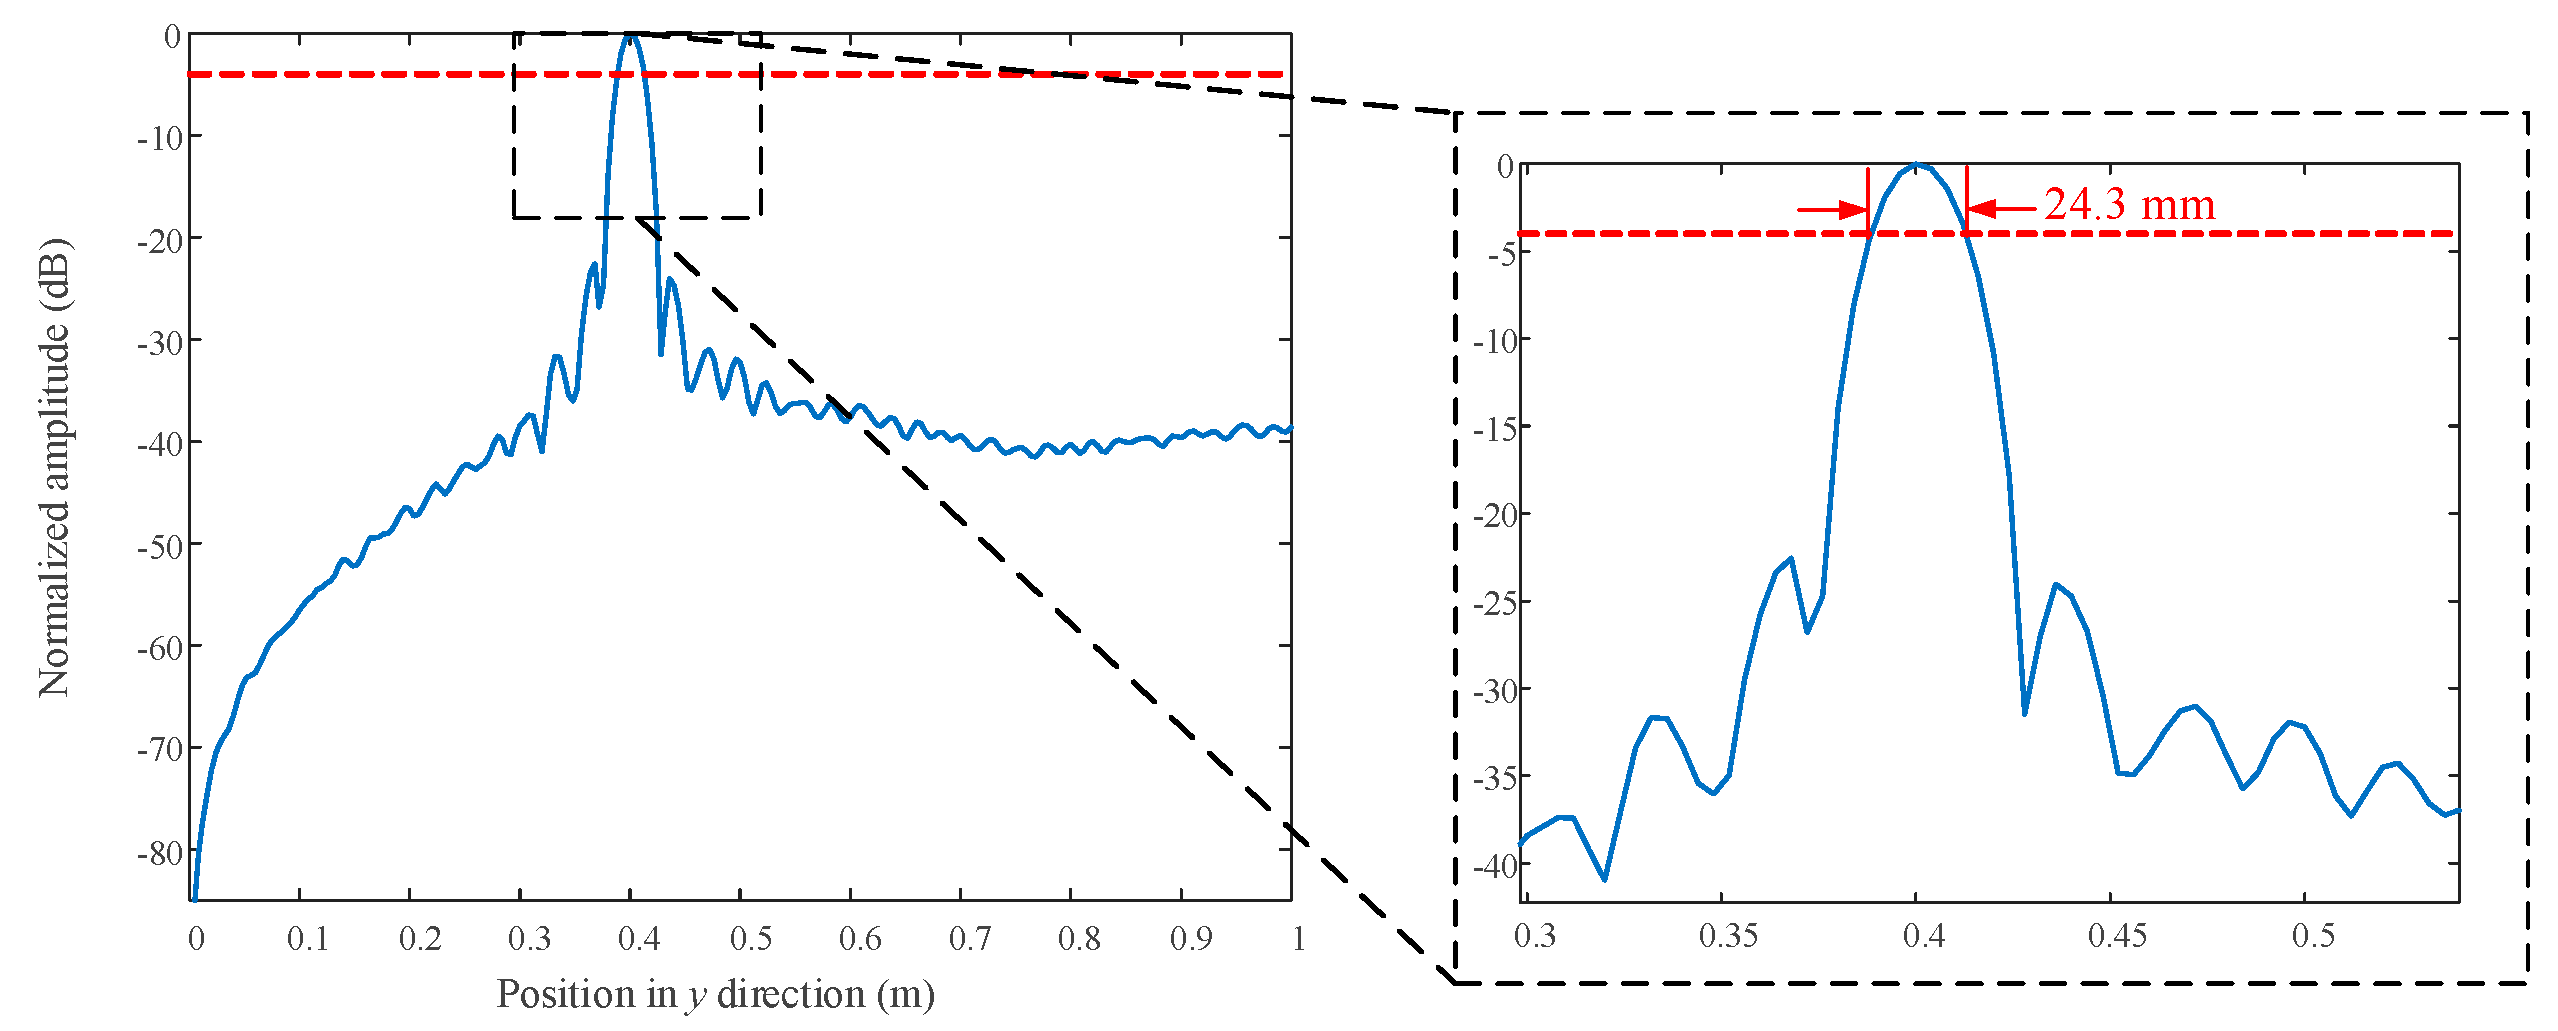
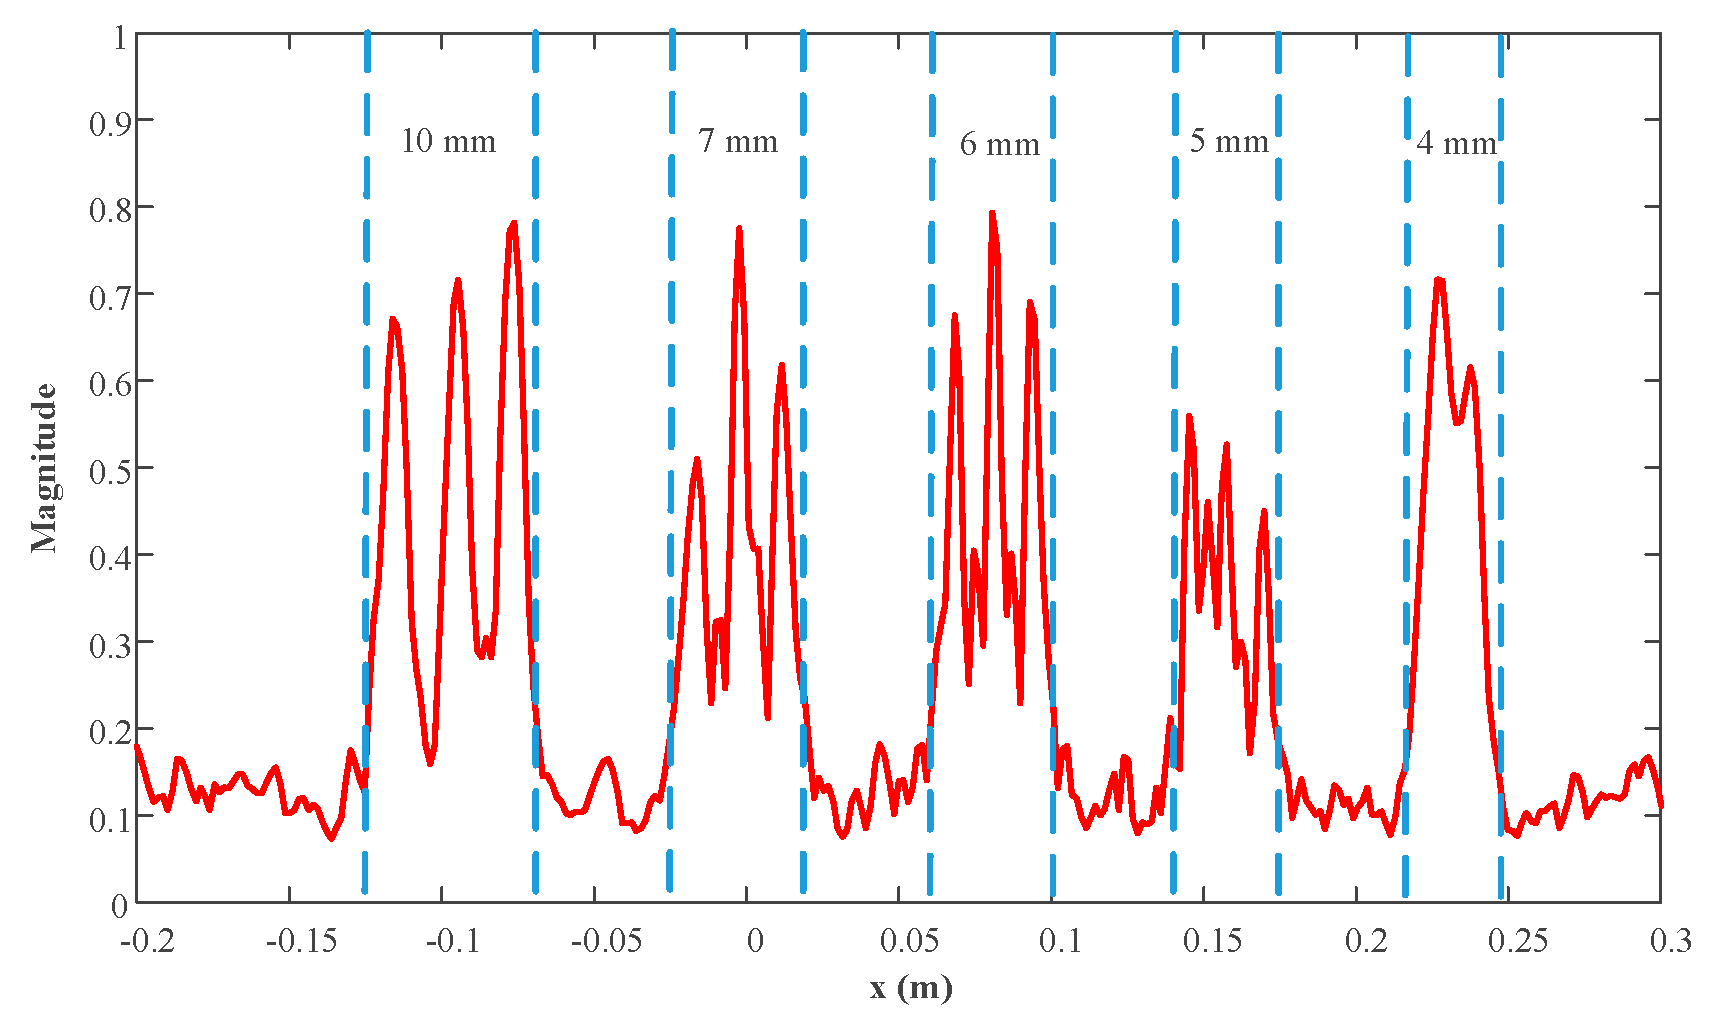
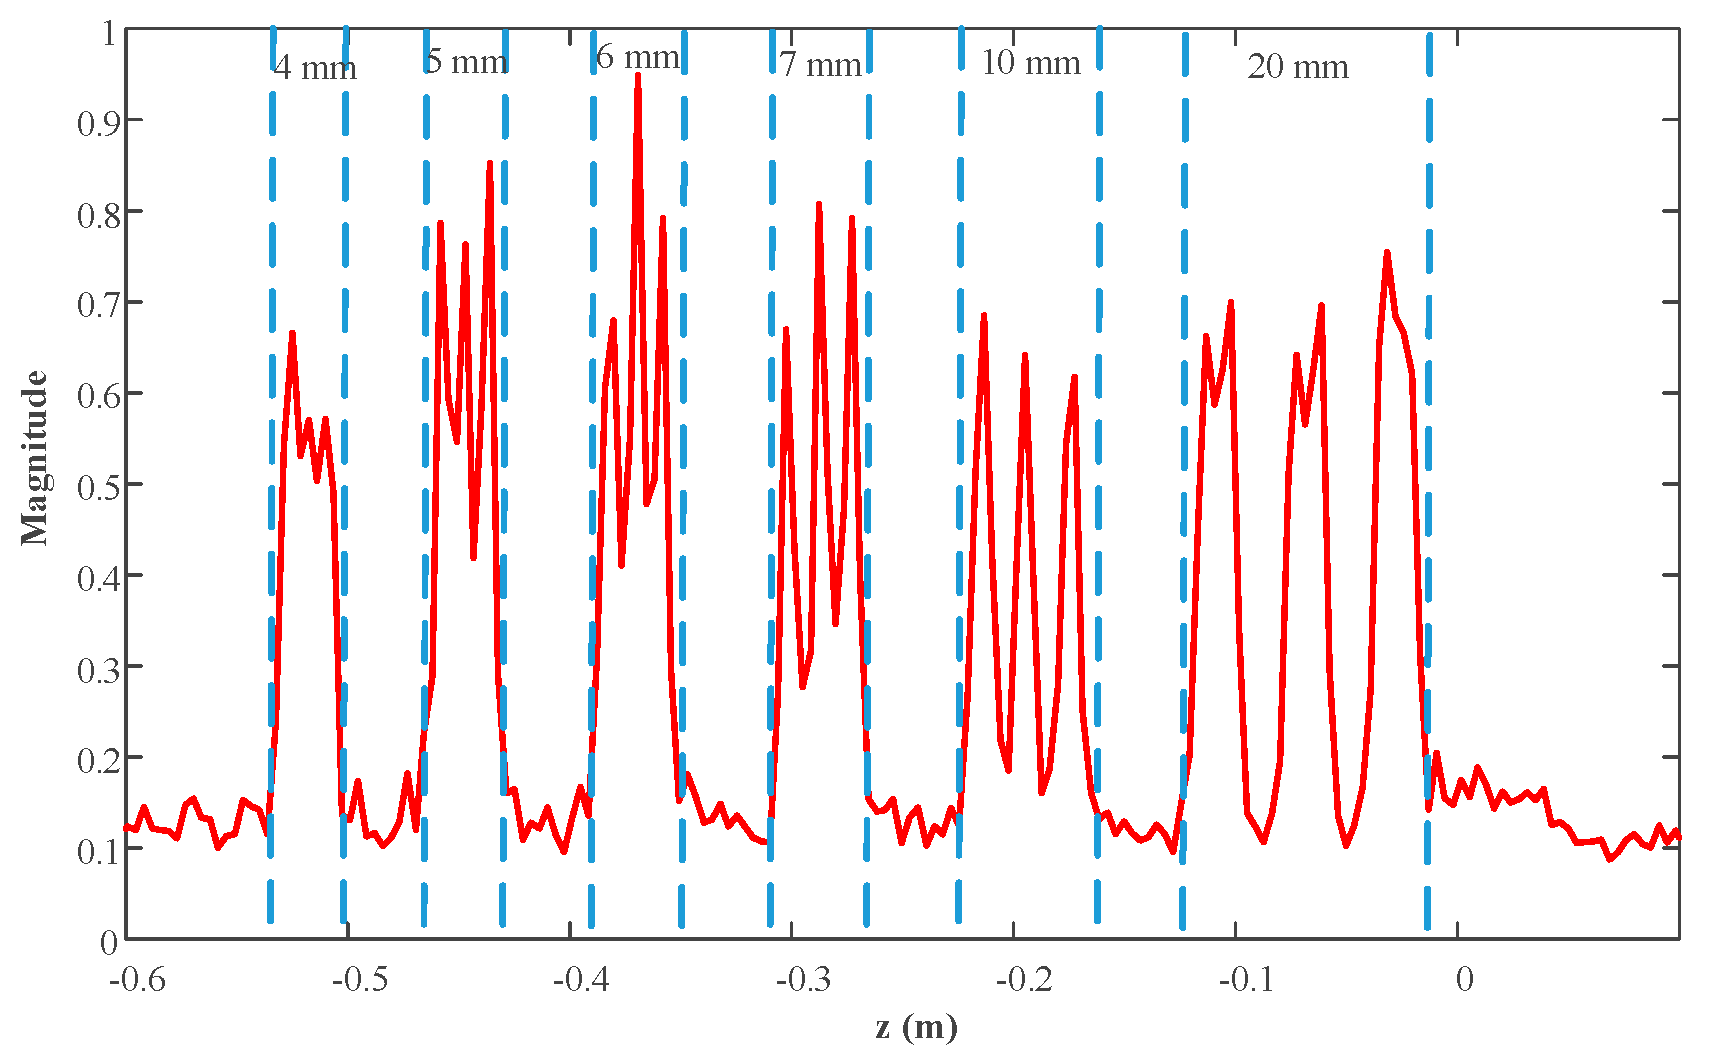
3.1. Point Spread Function
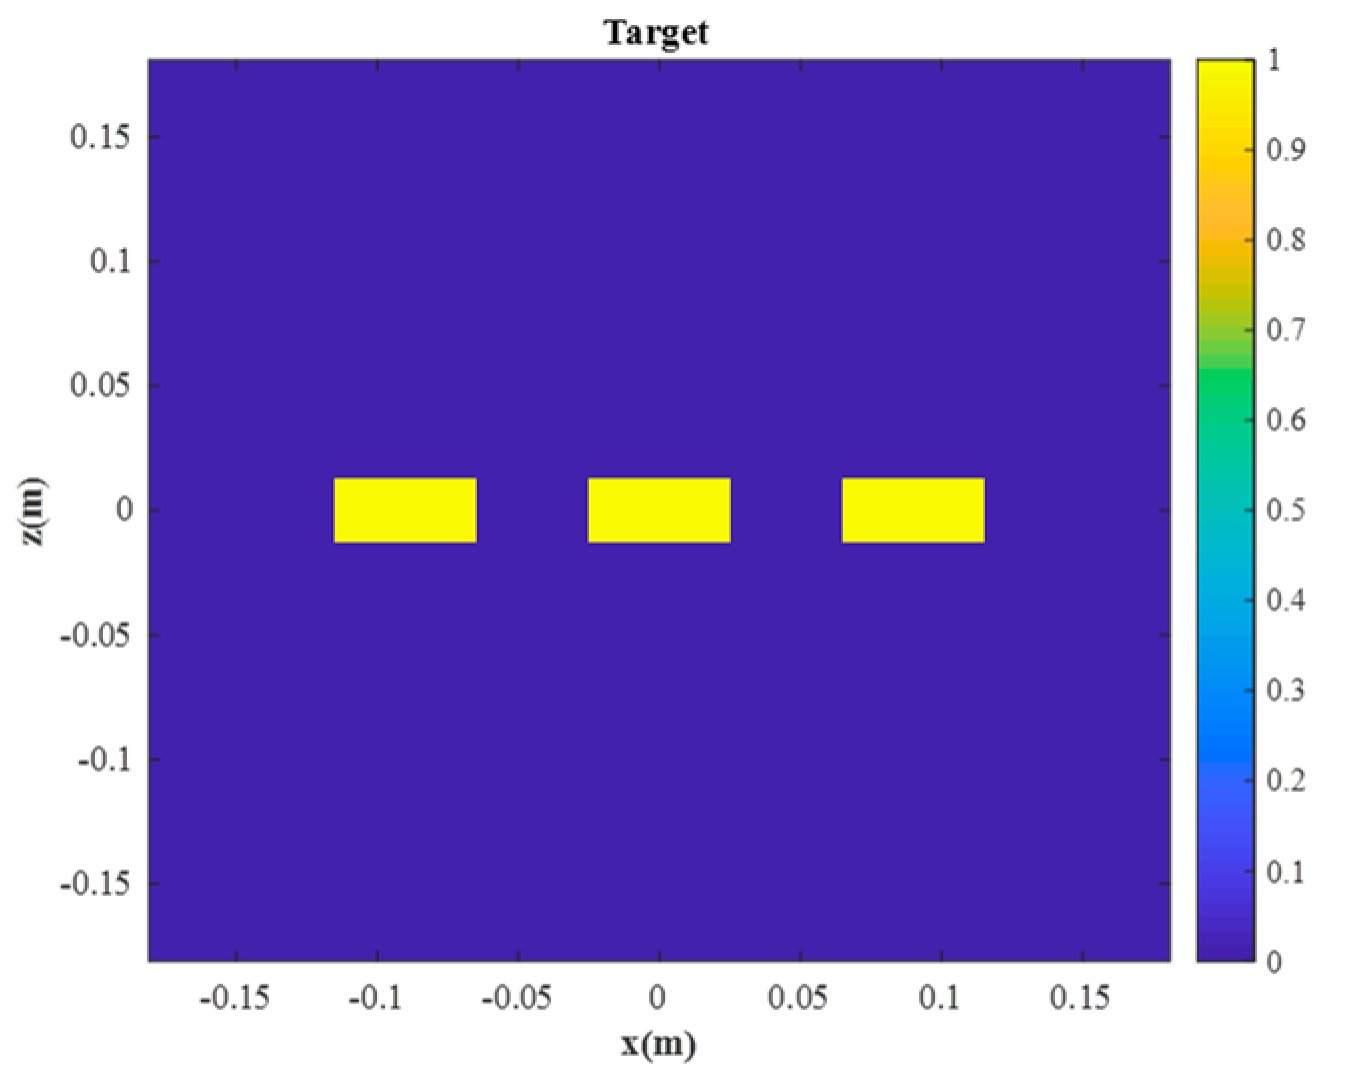
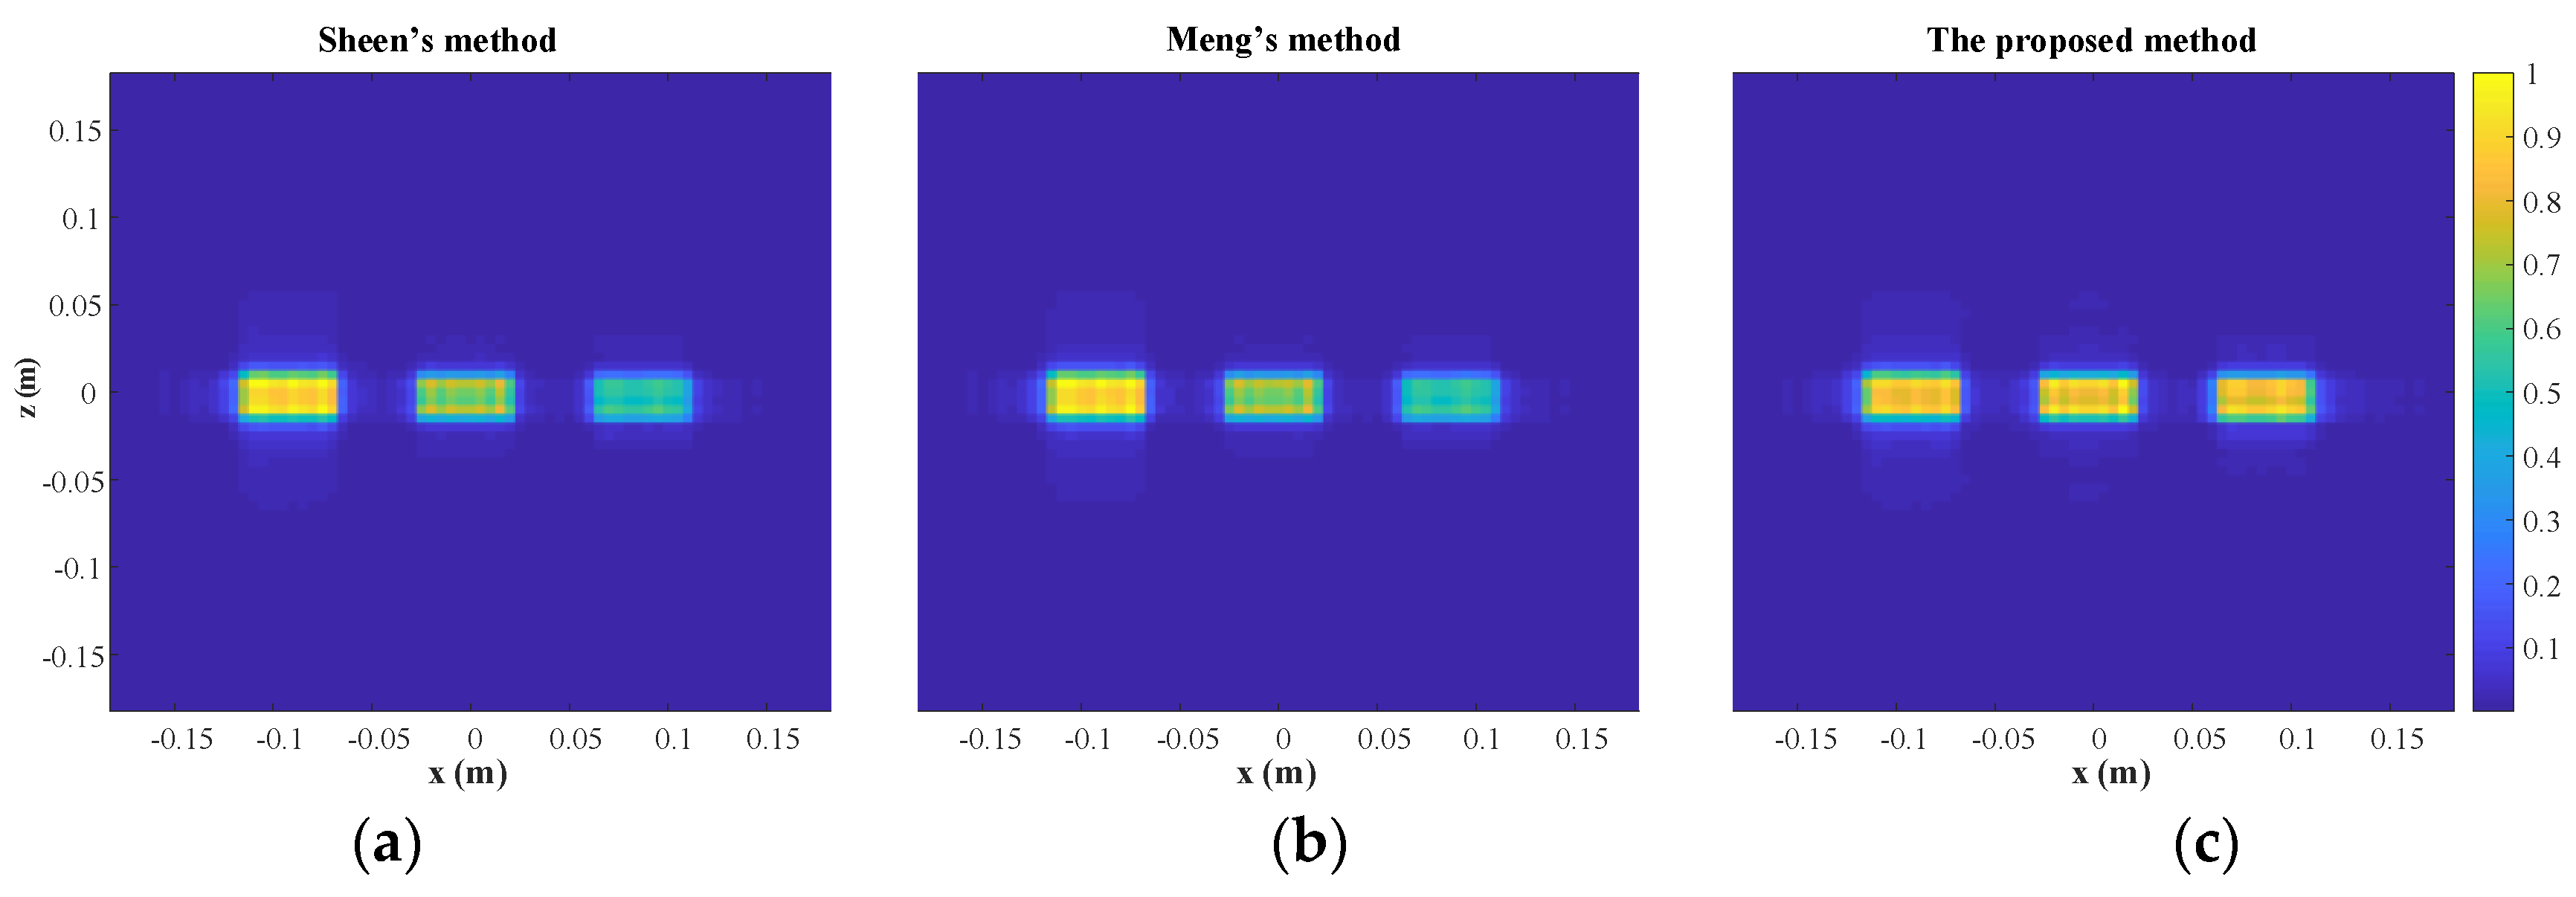
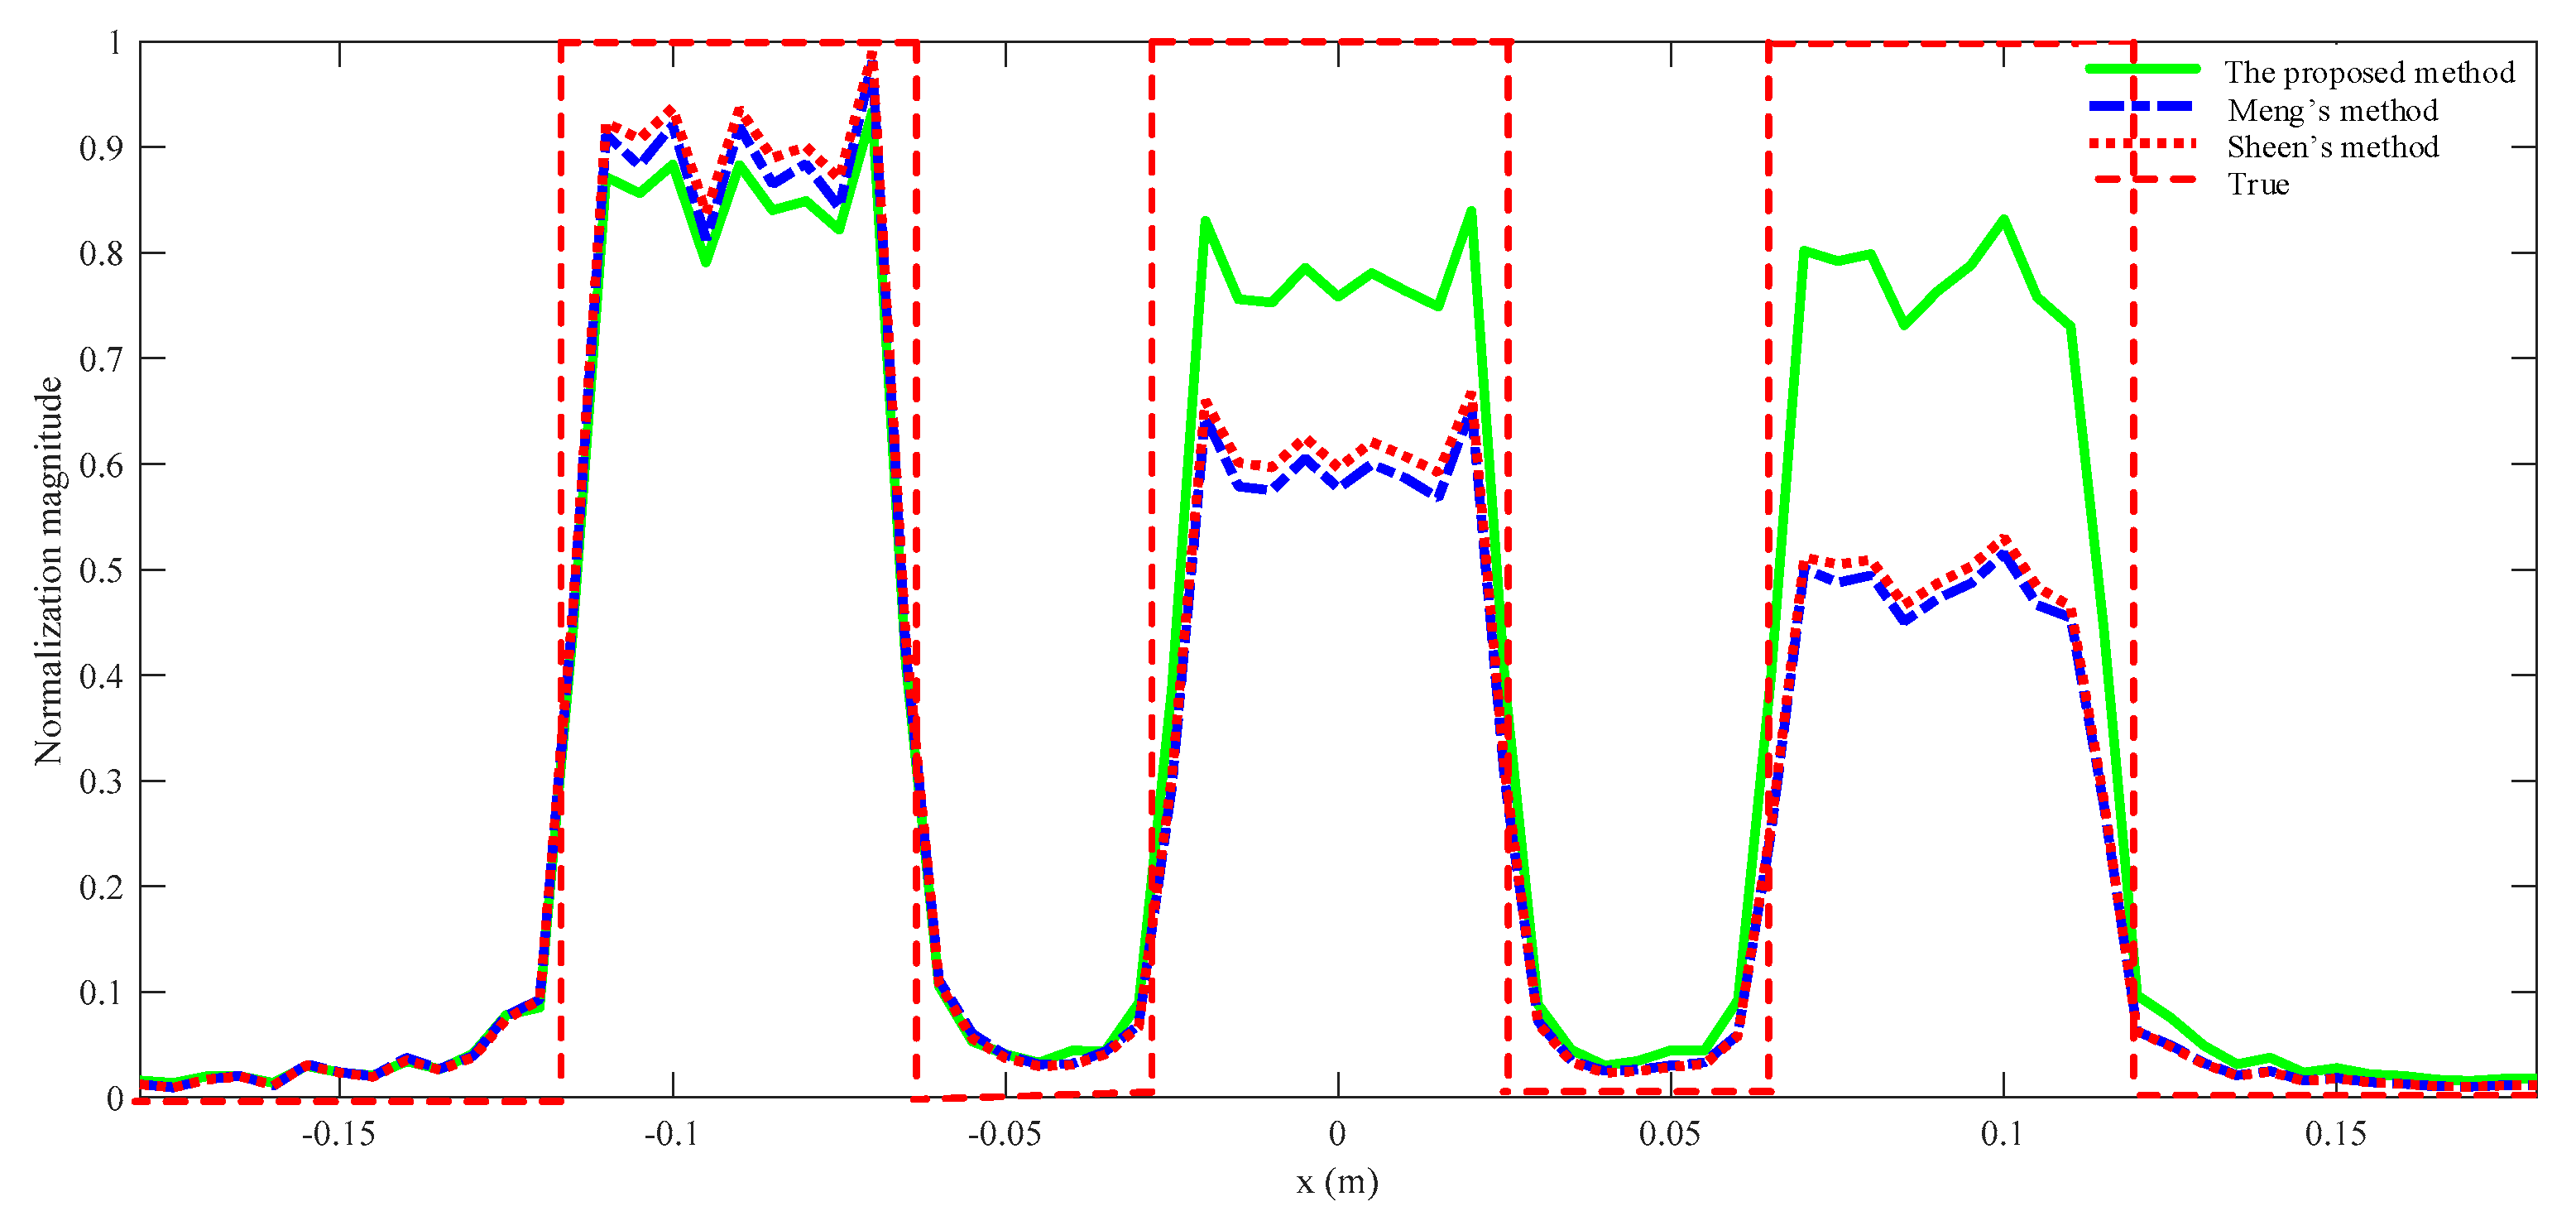
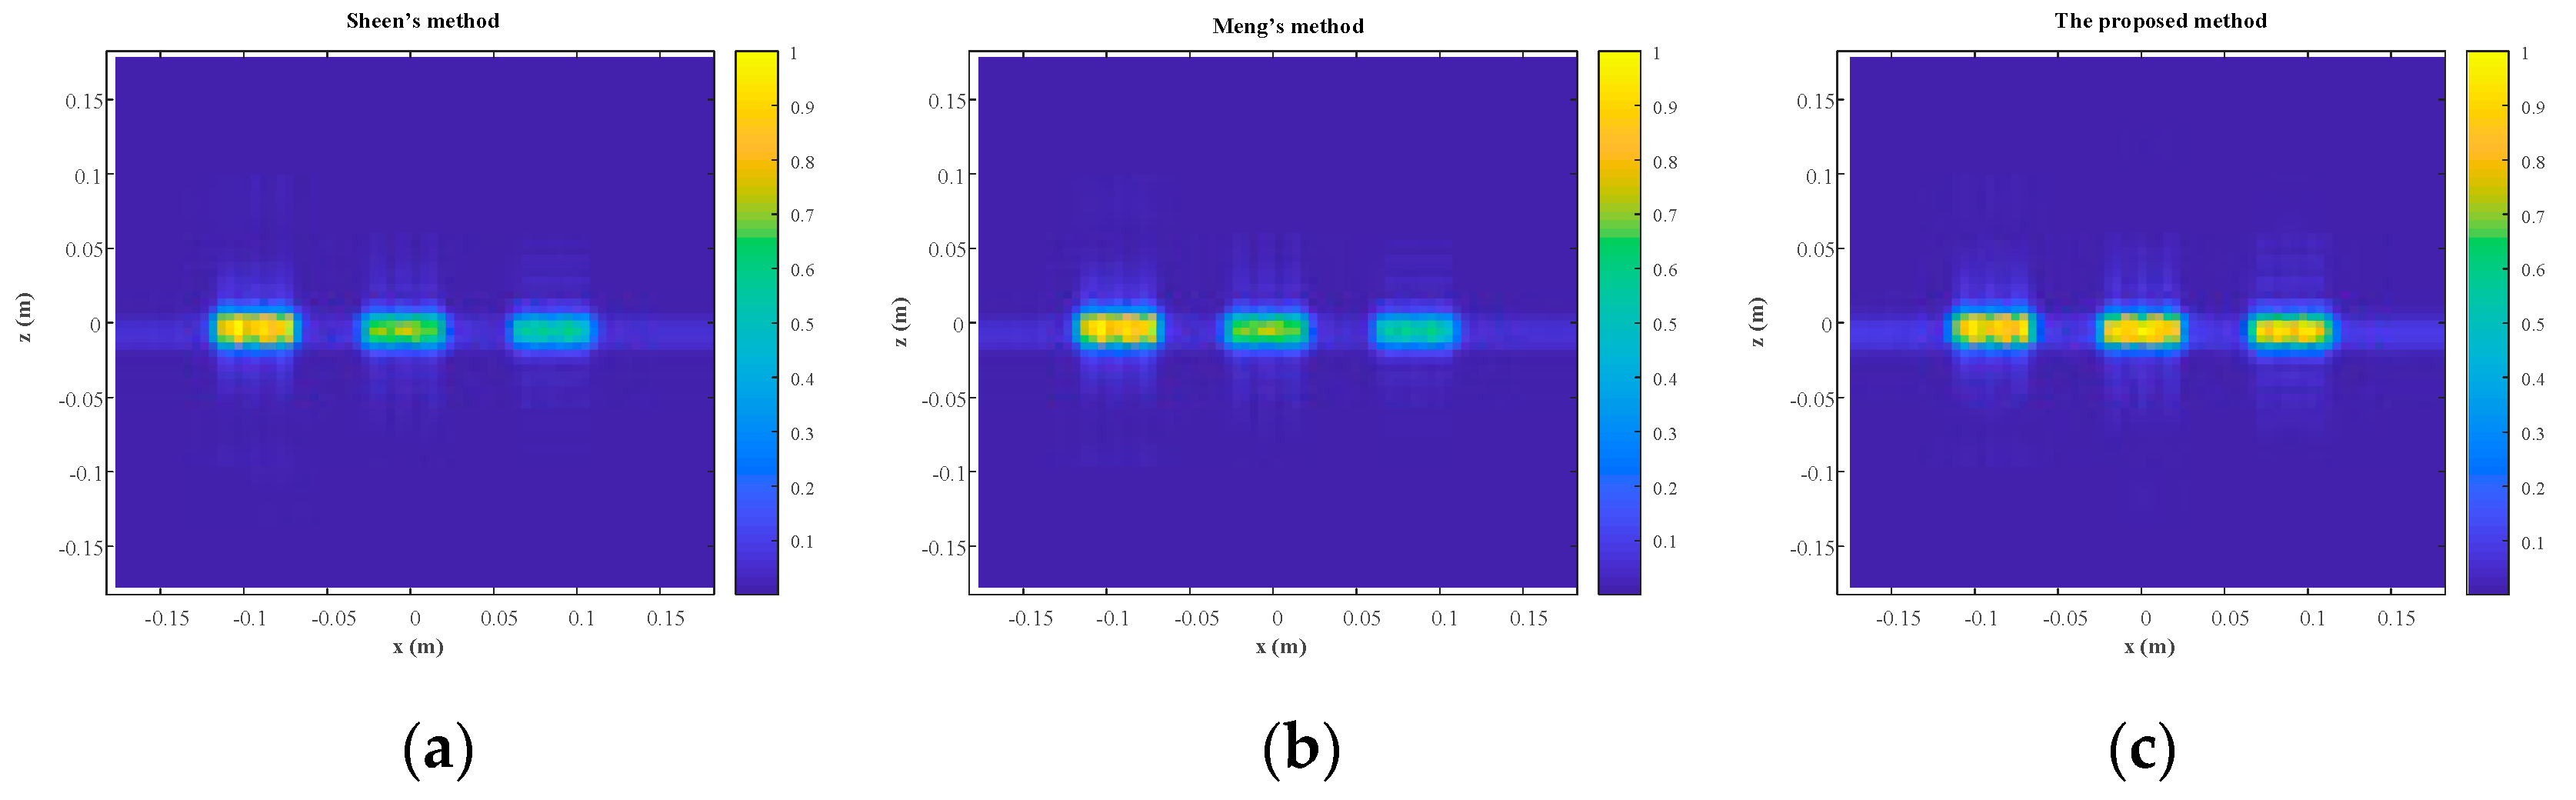
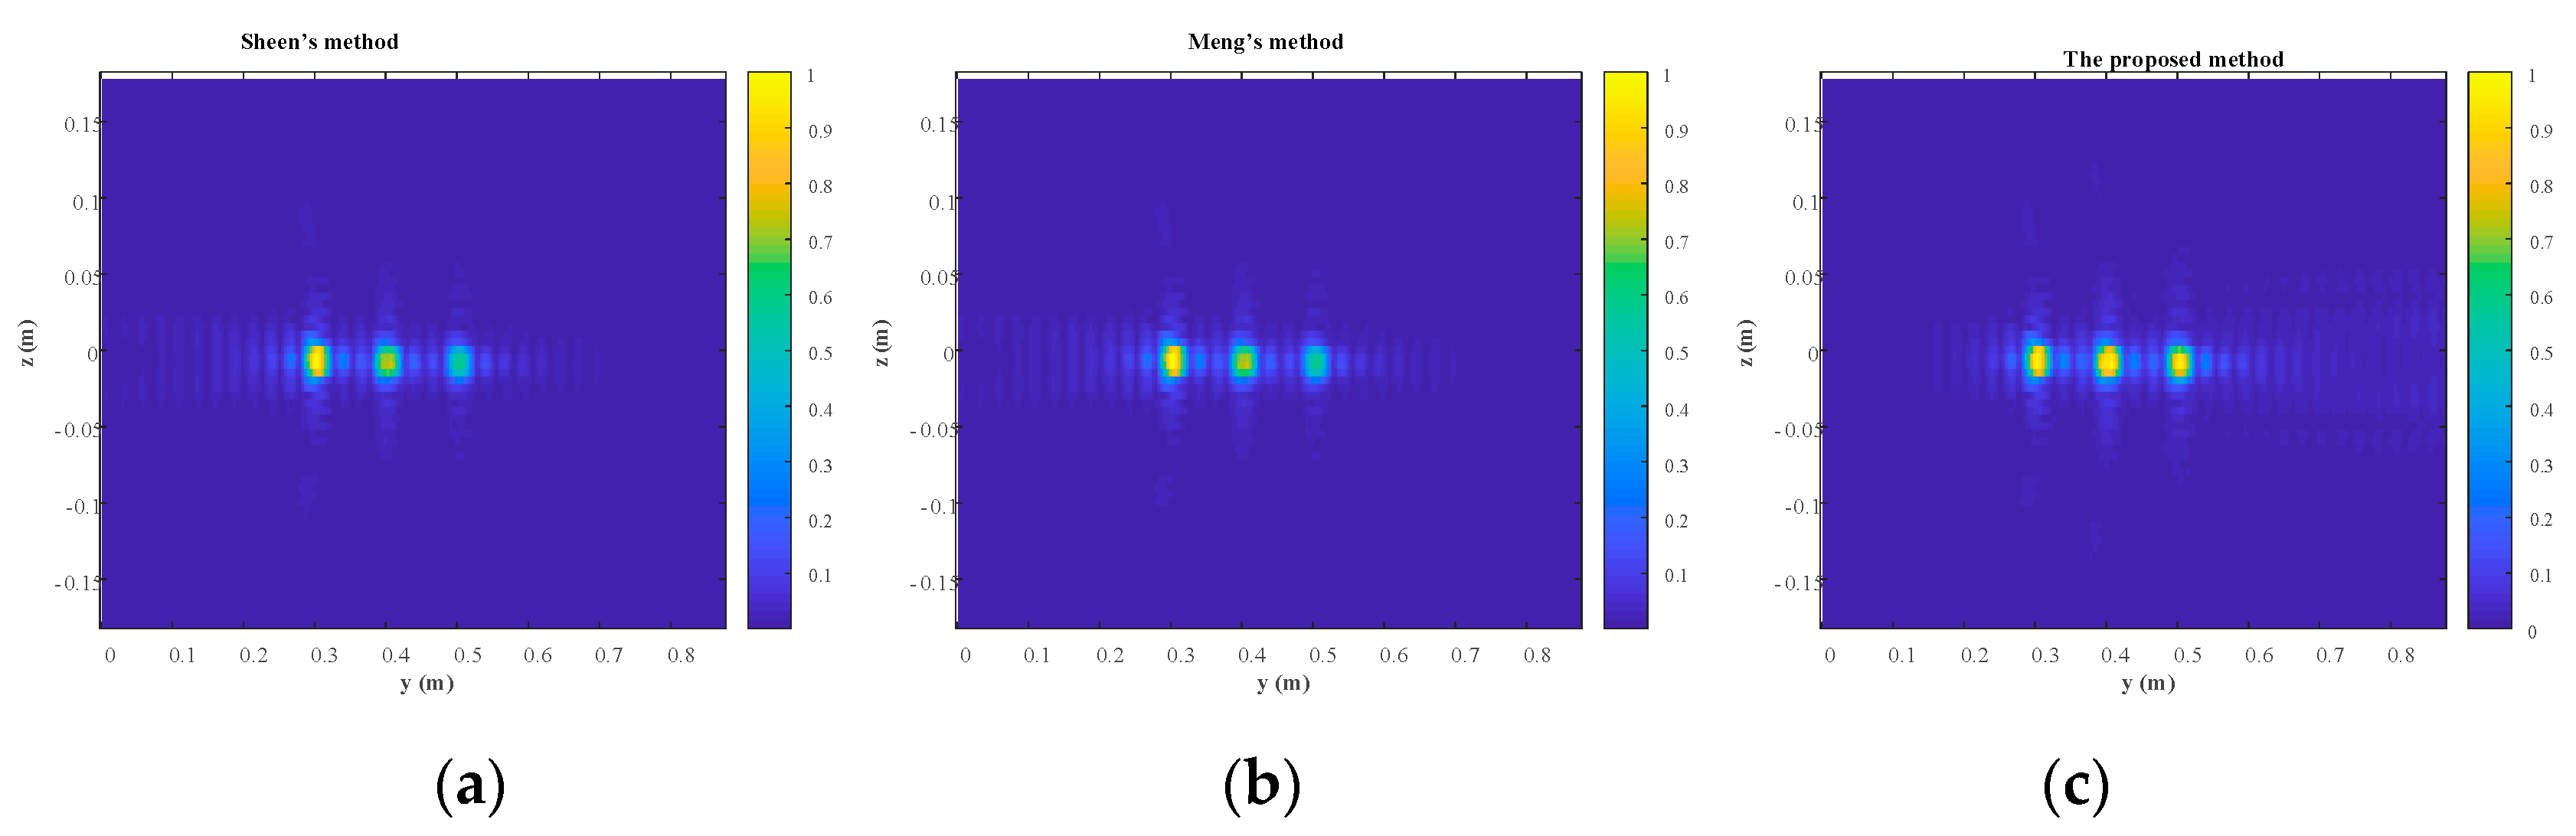
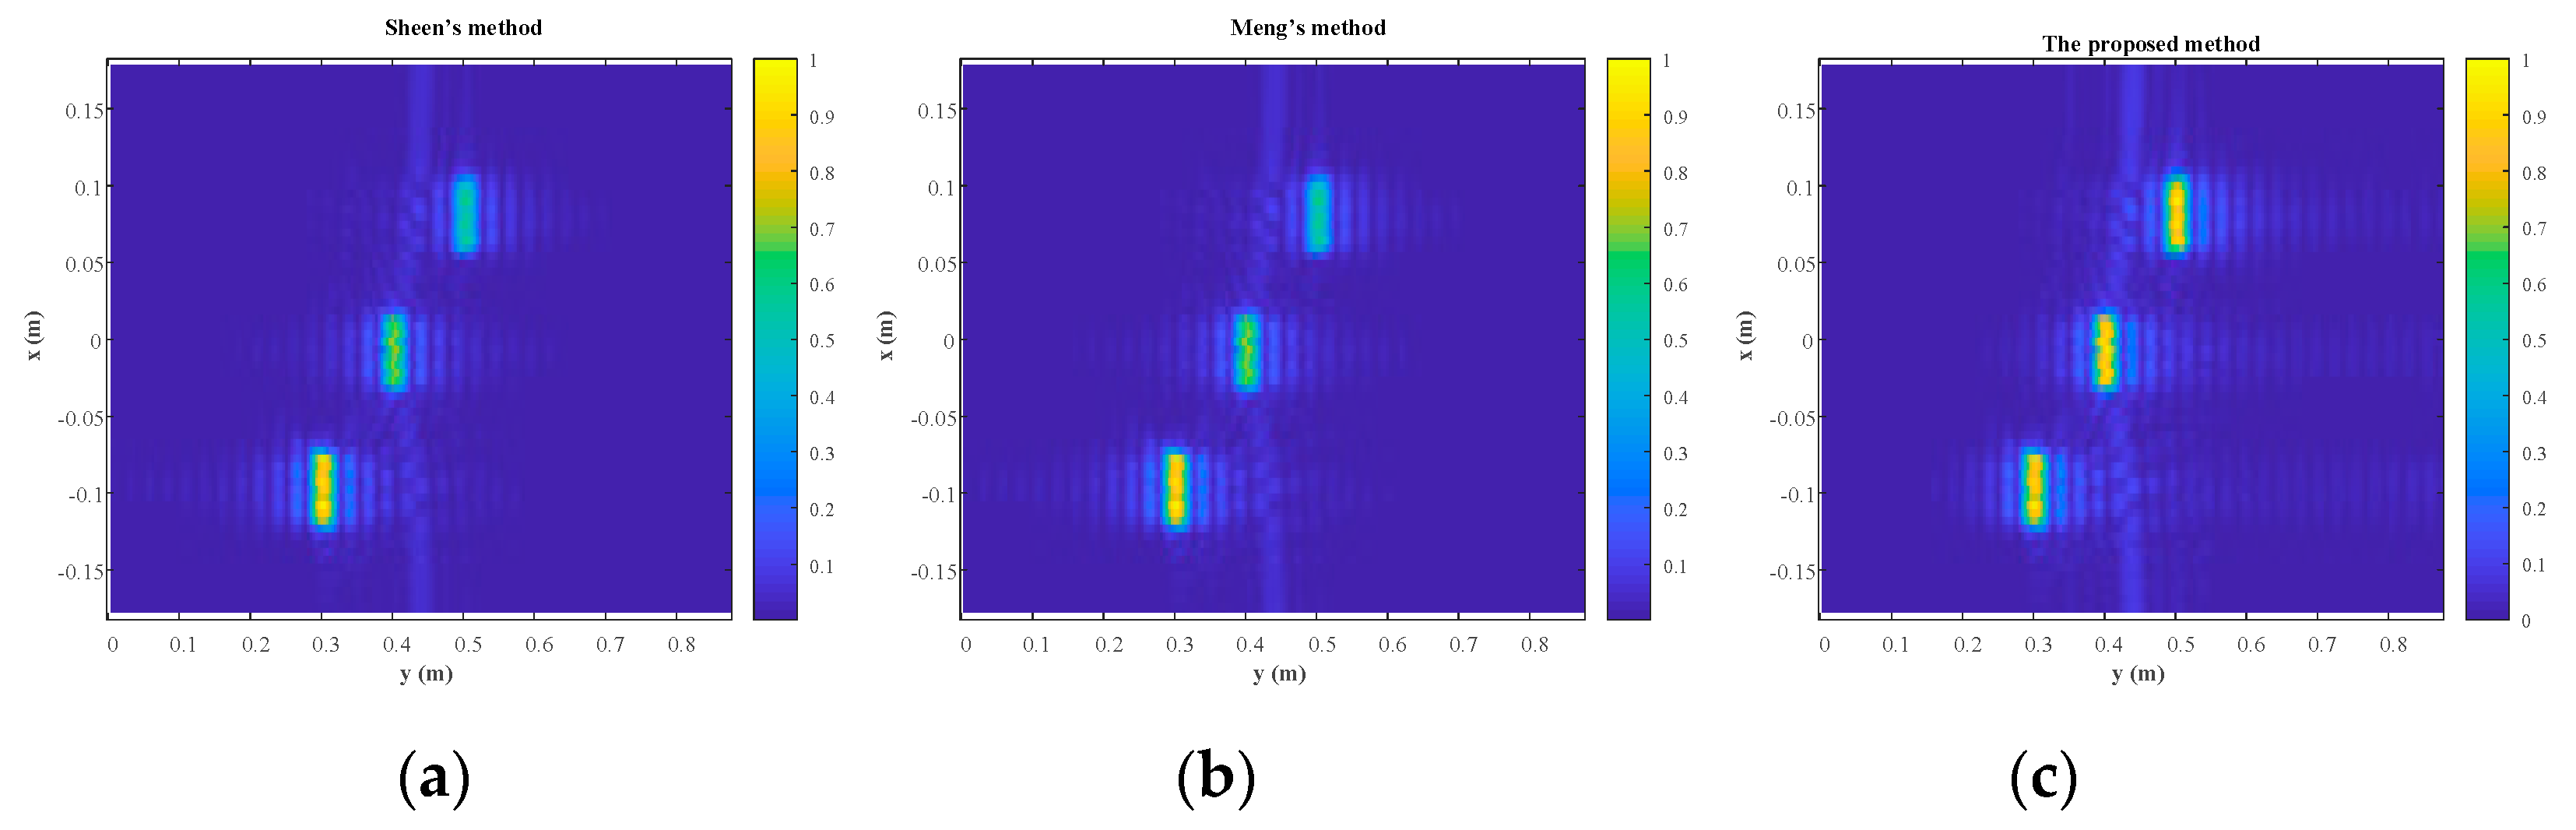
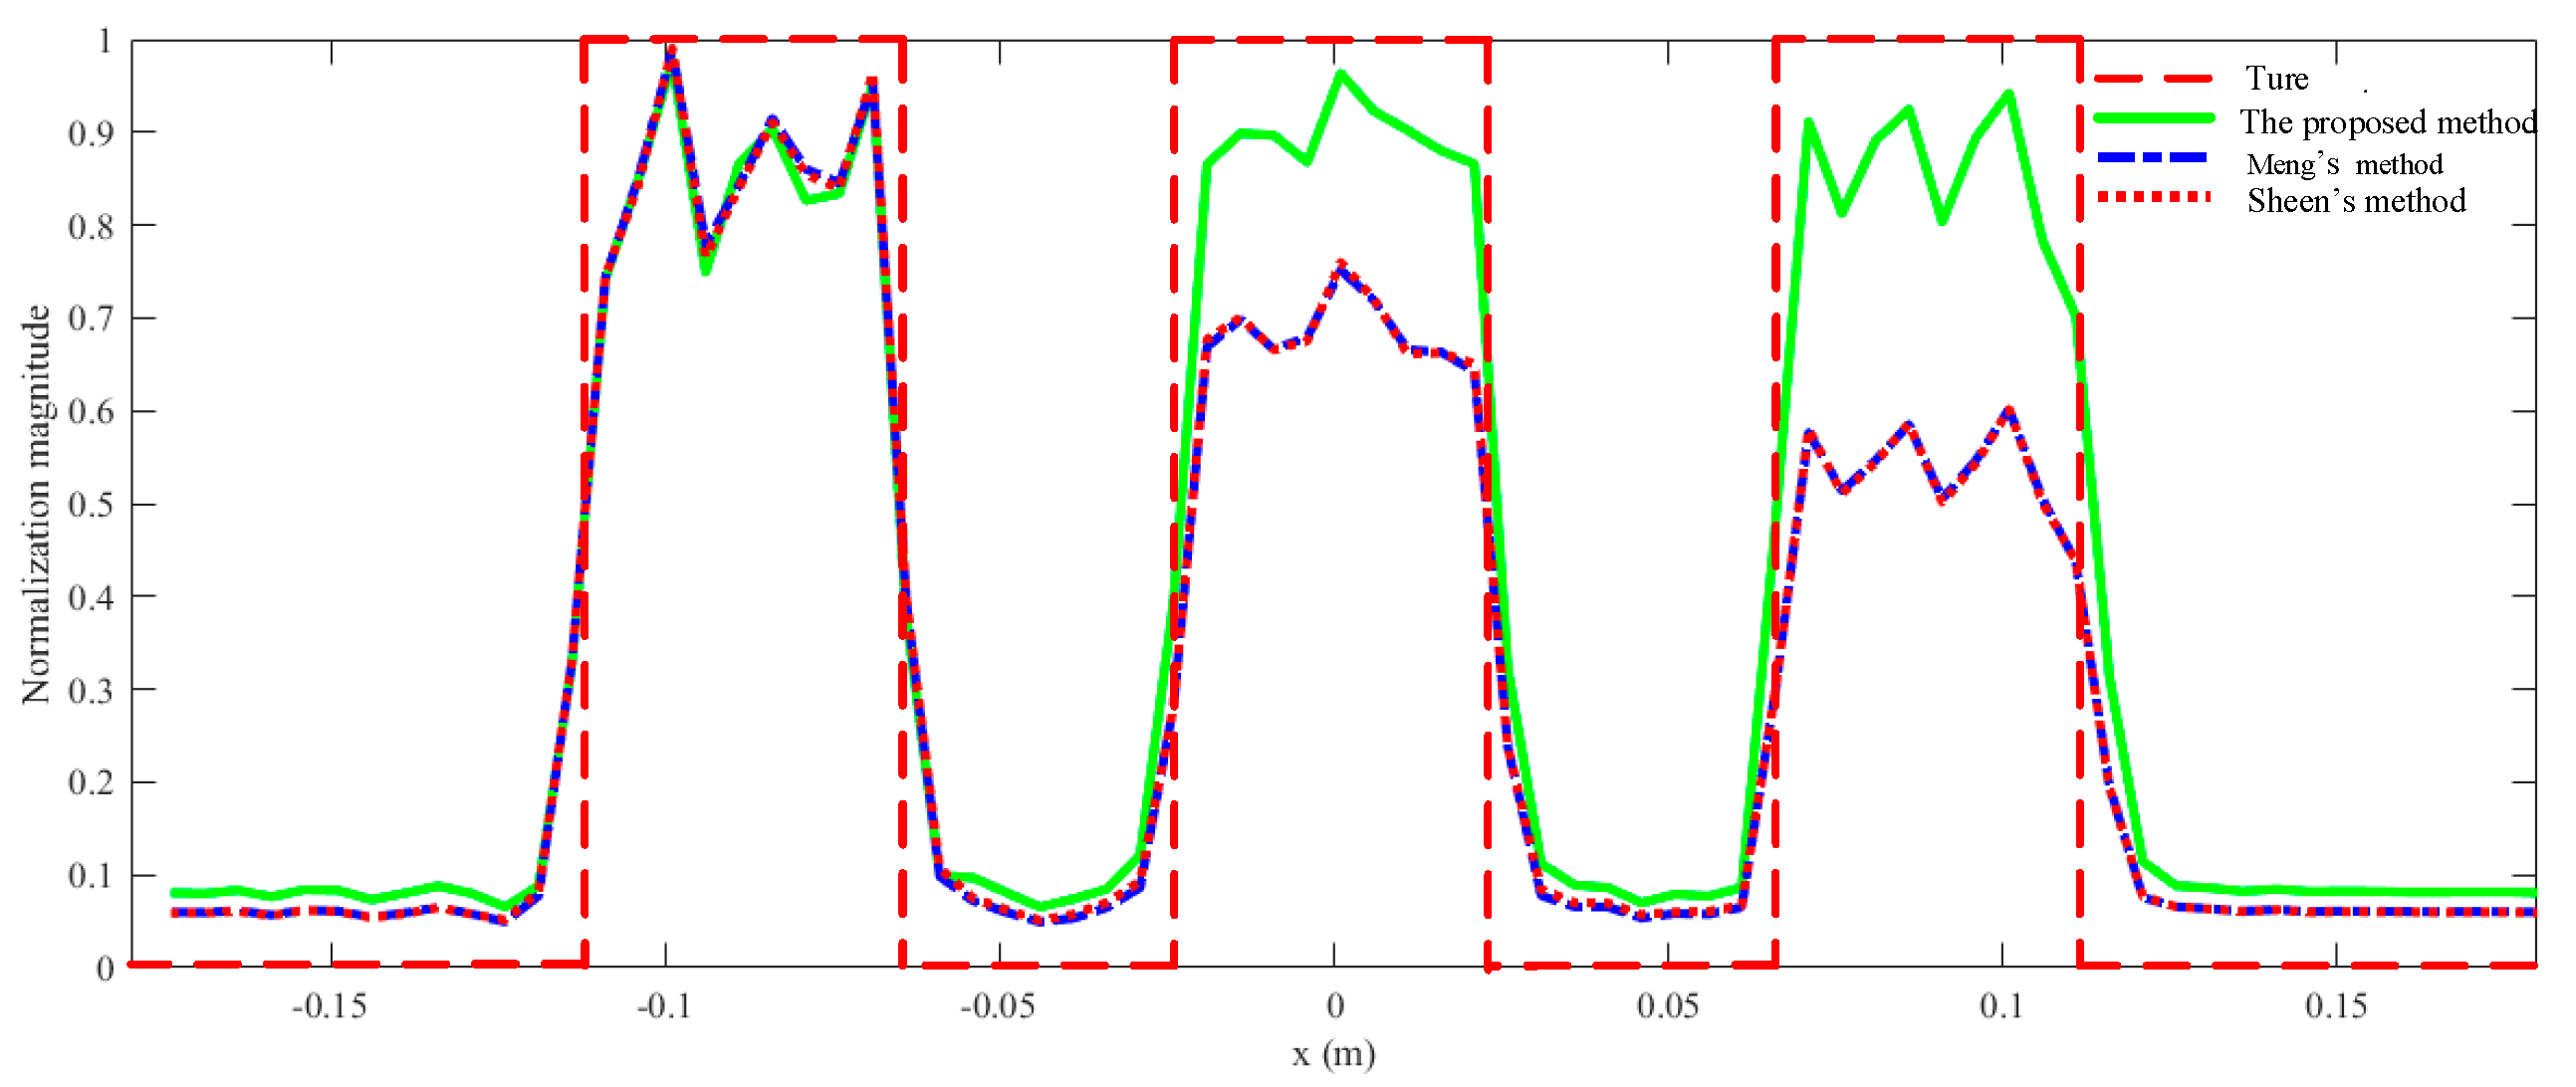
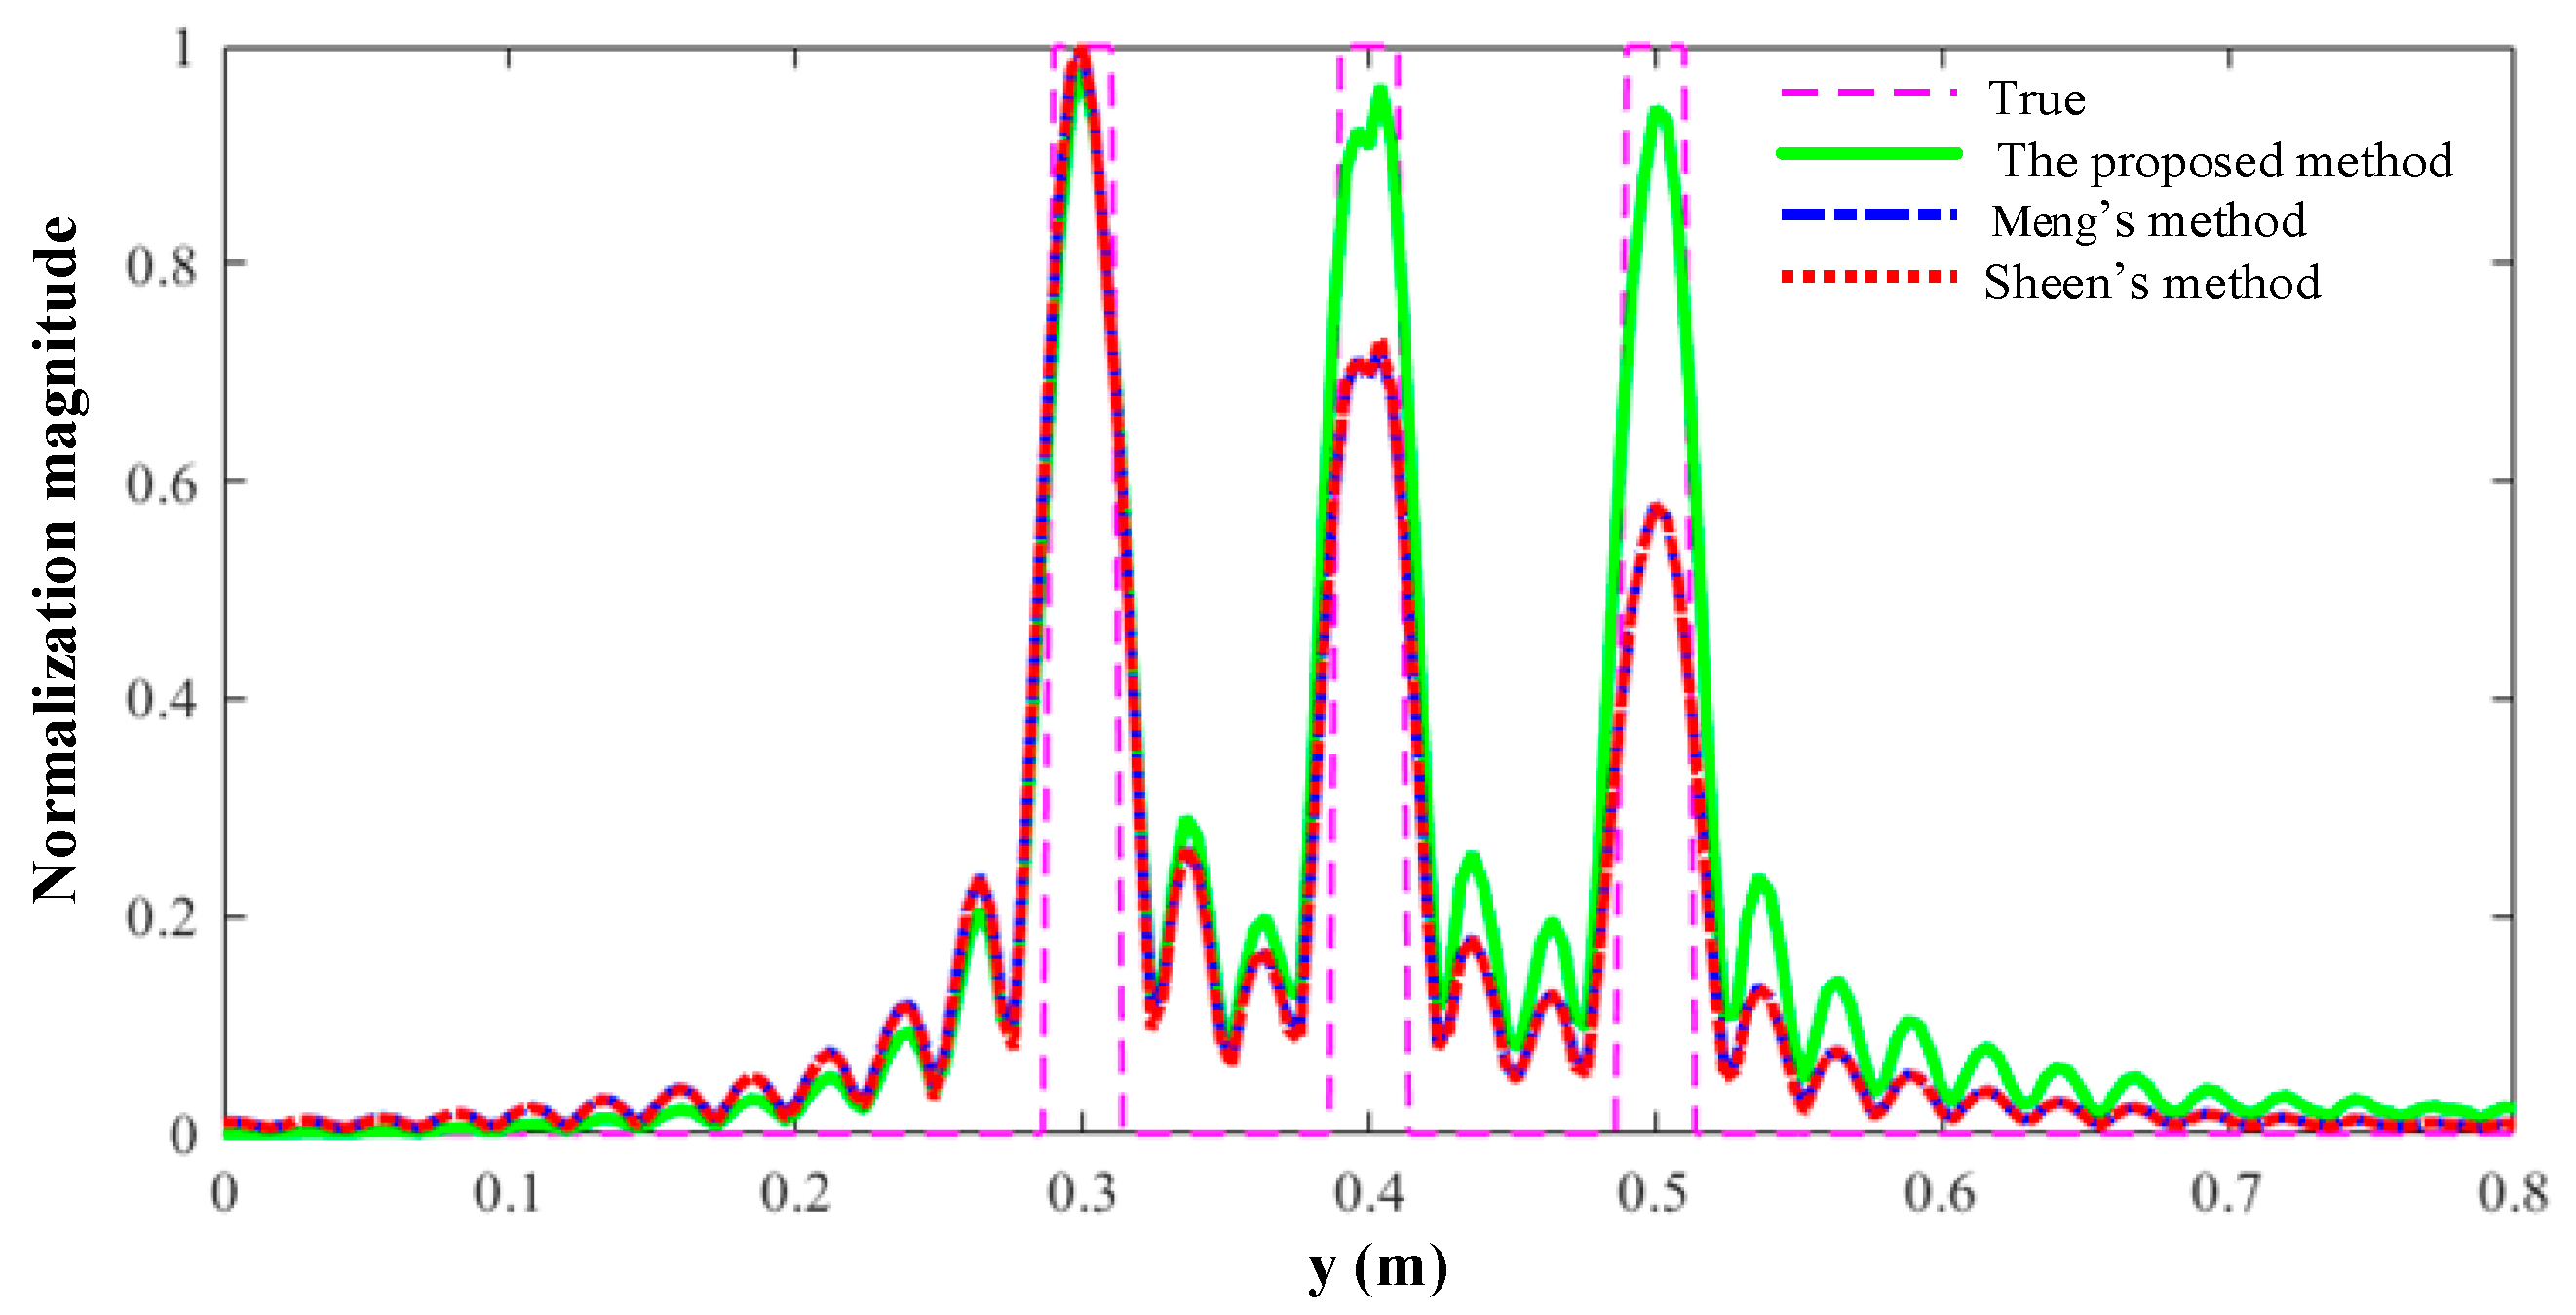
3.2. The Synthetic Data
3.3. The Full-Wave Data
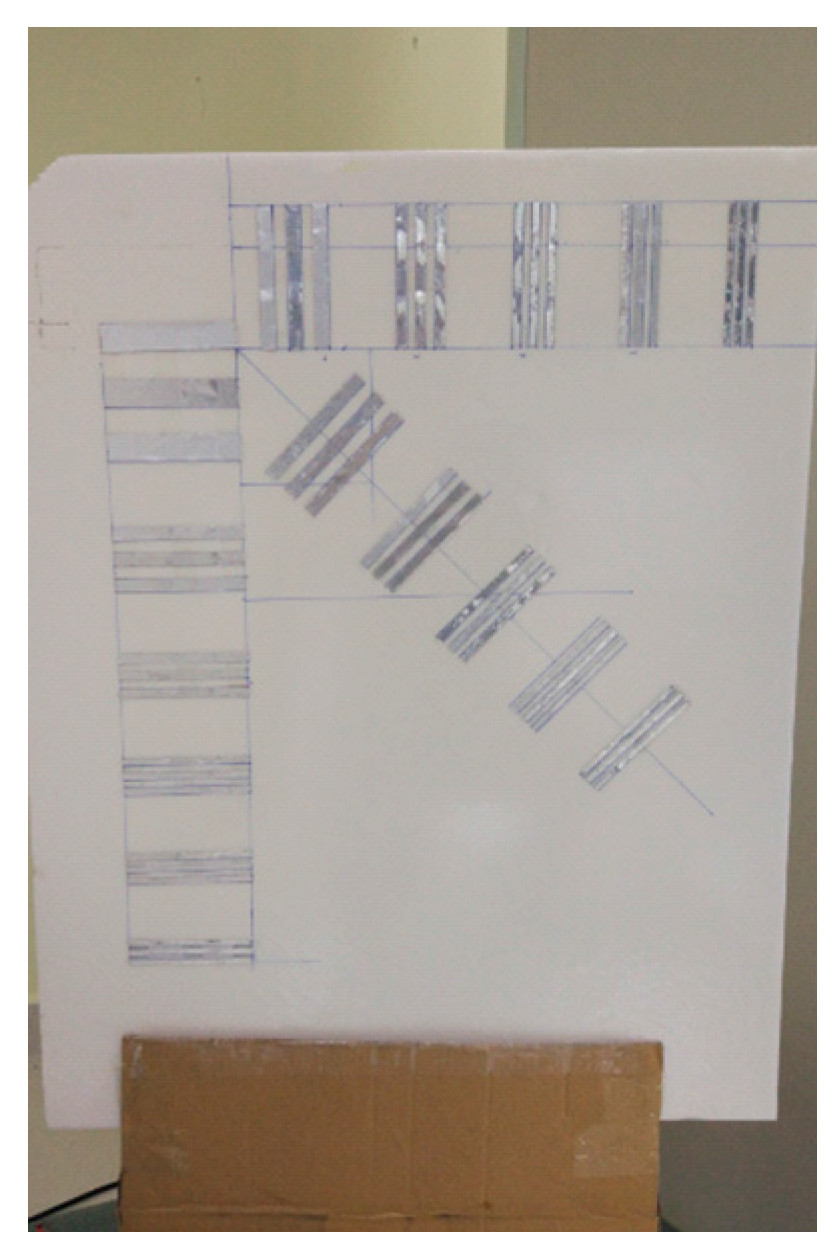
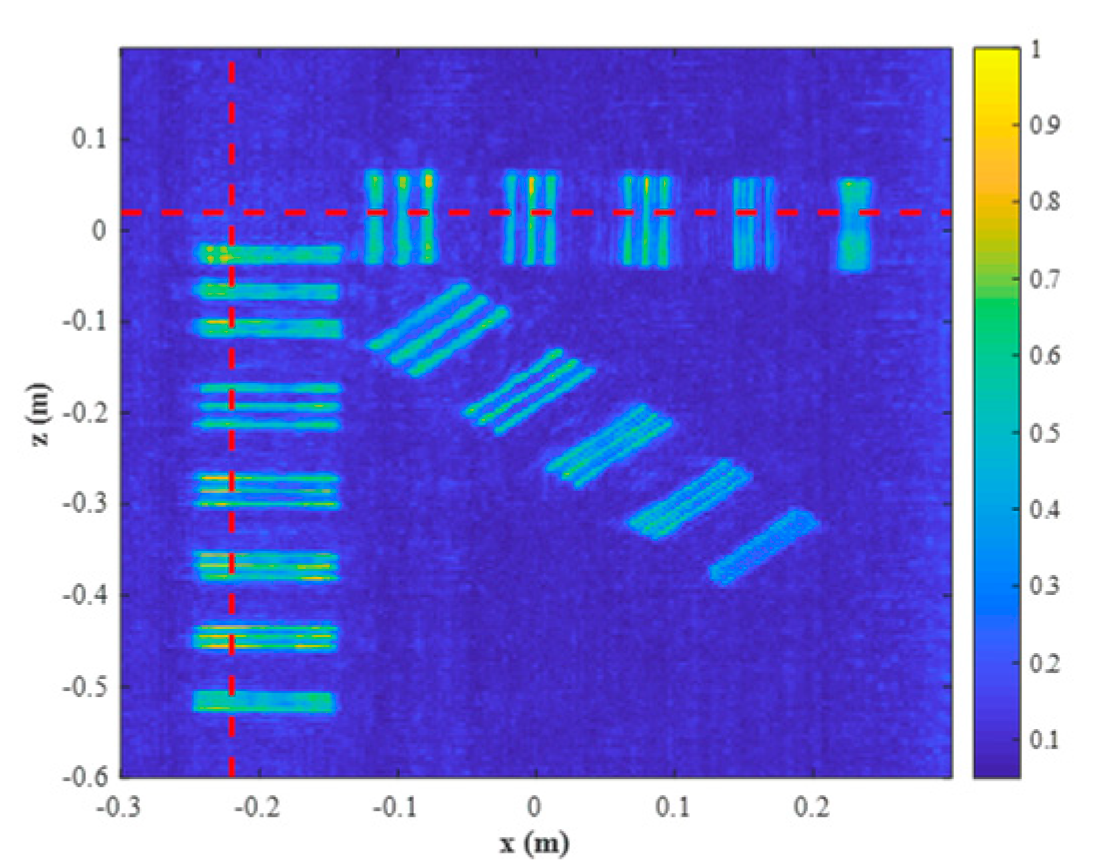
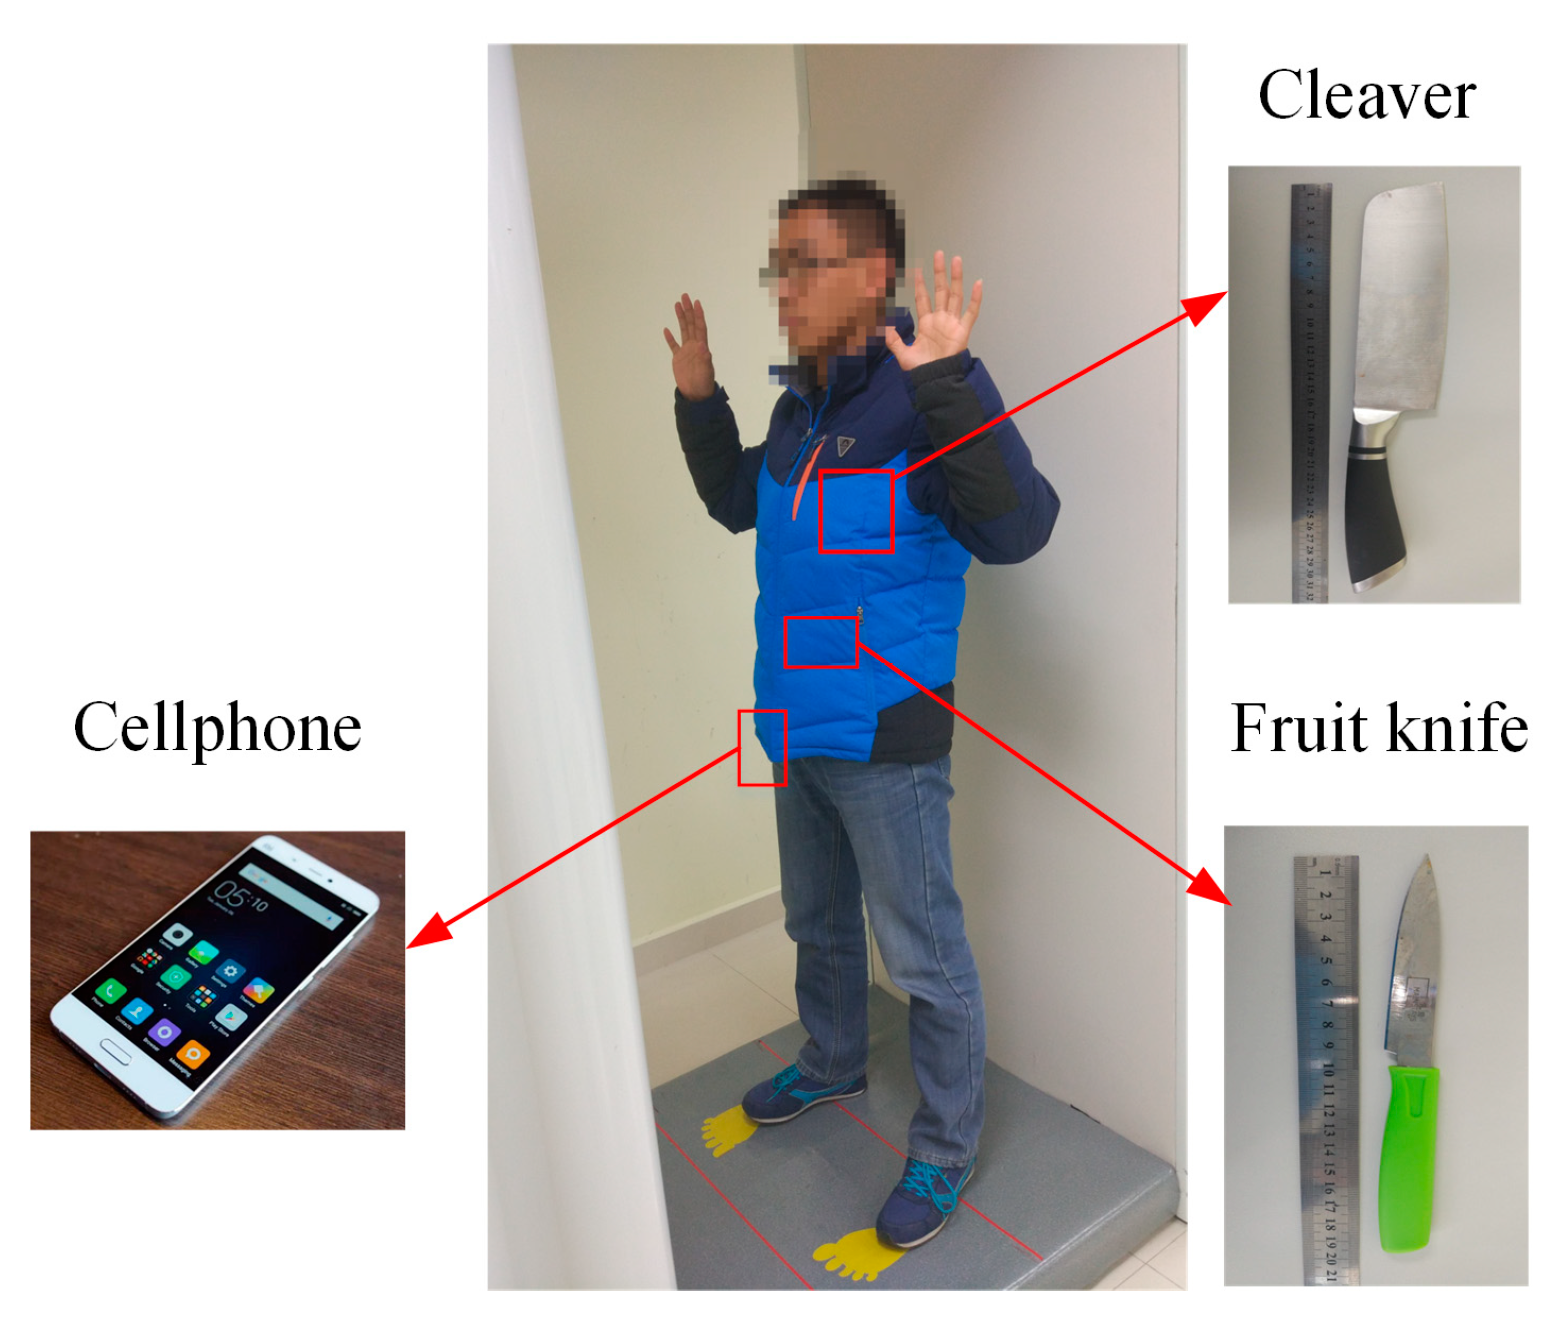
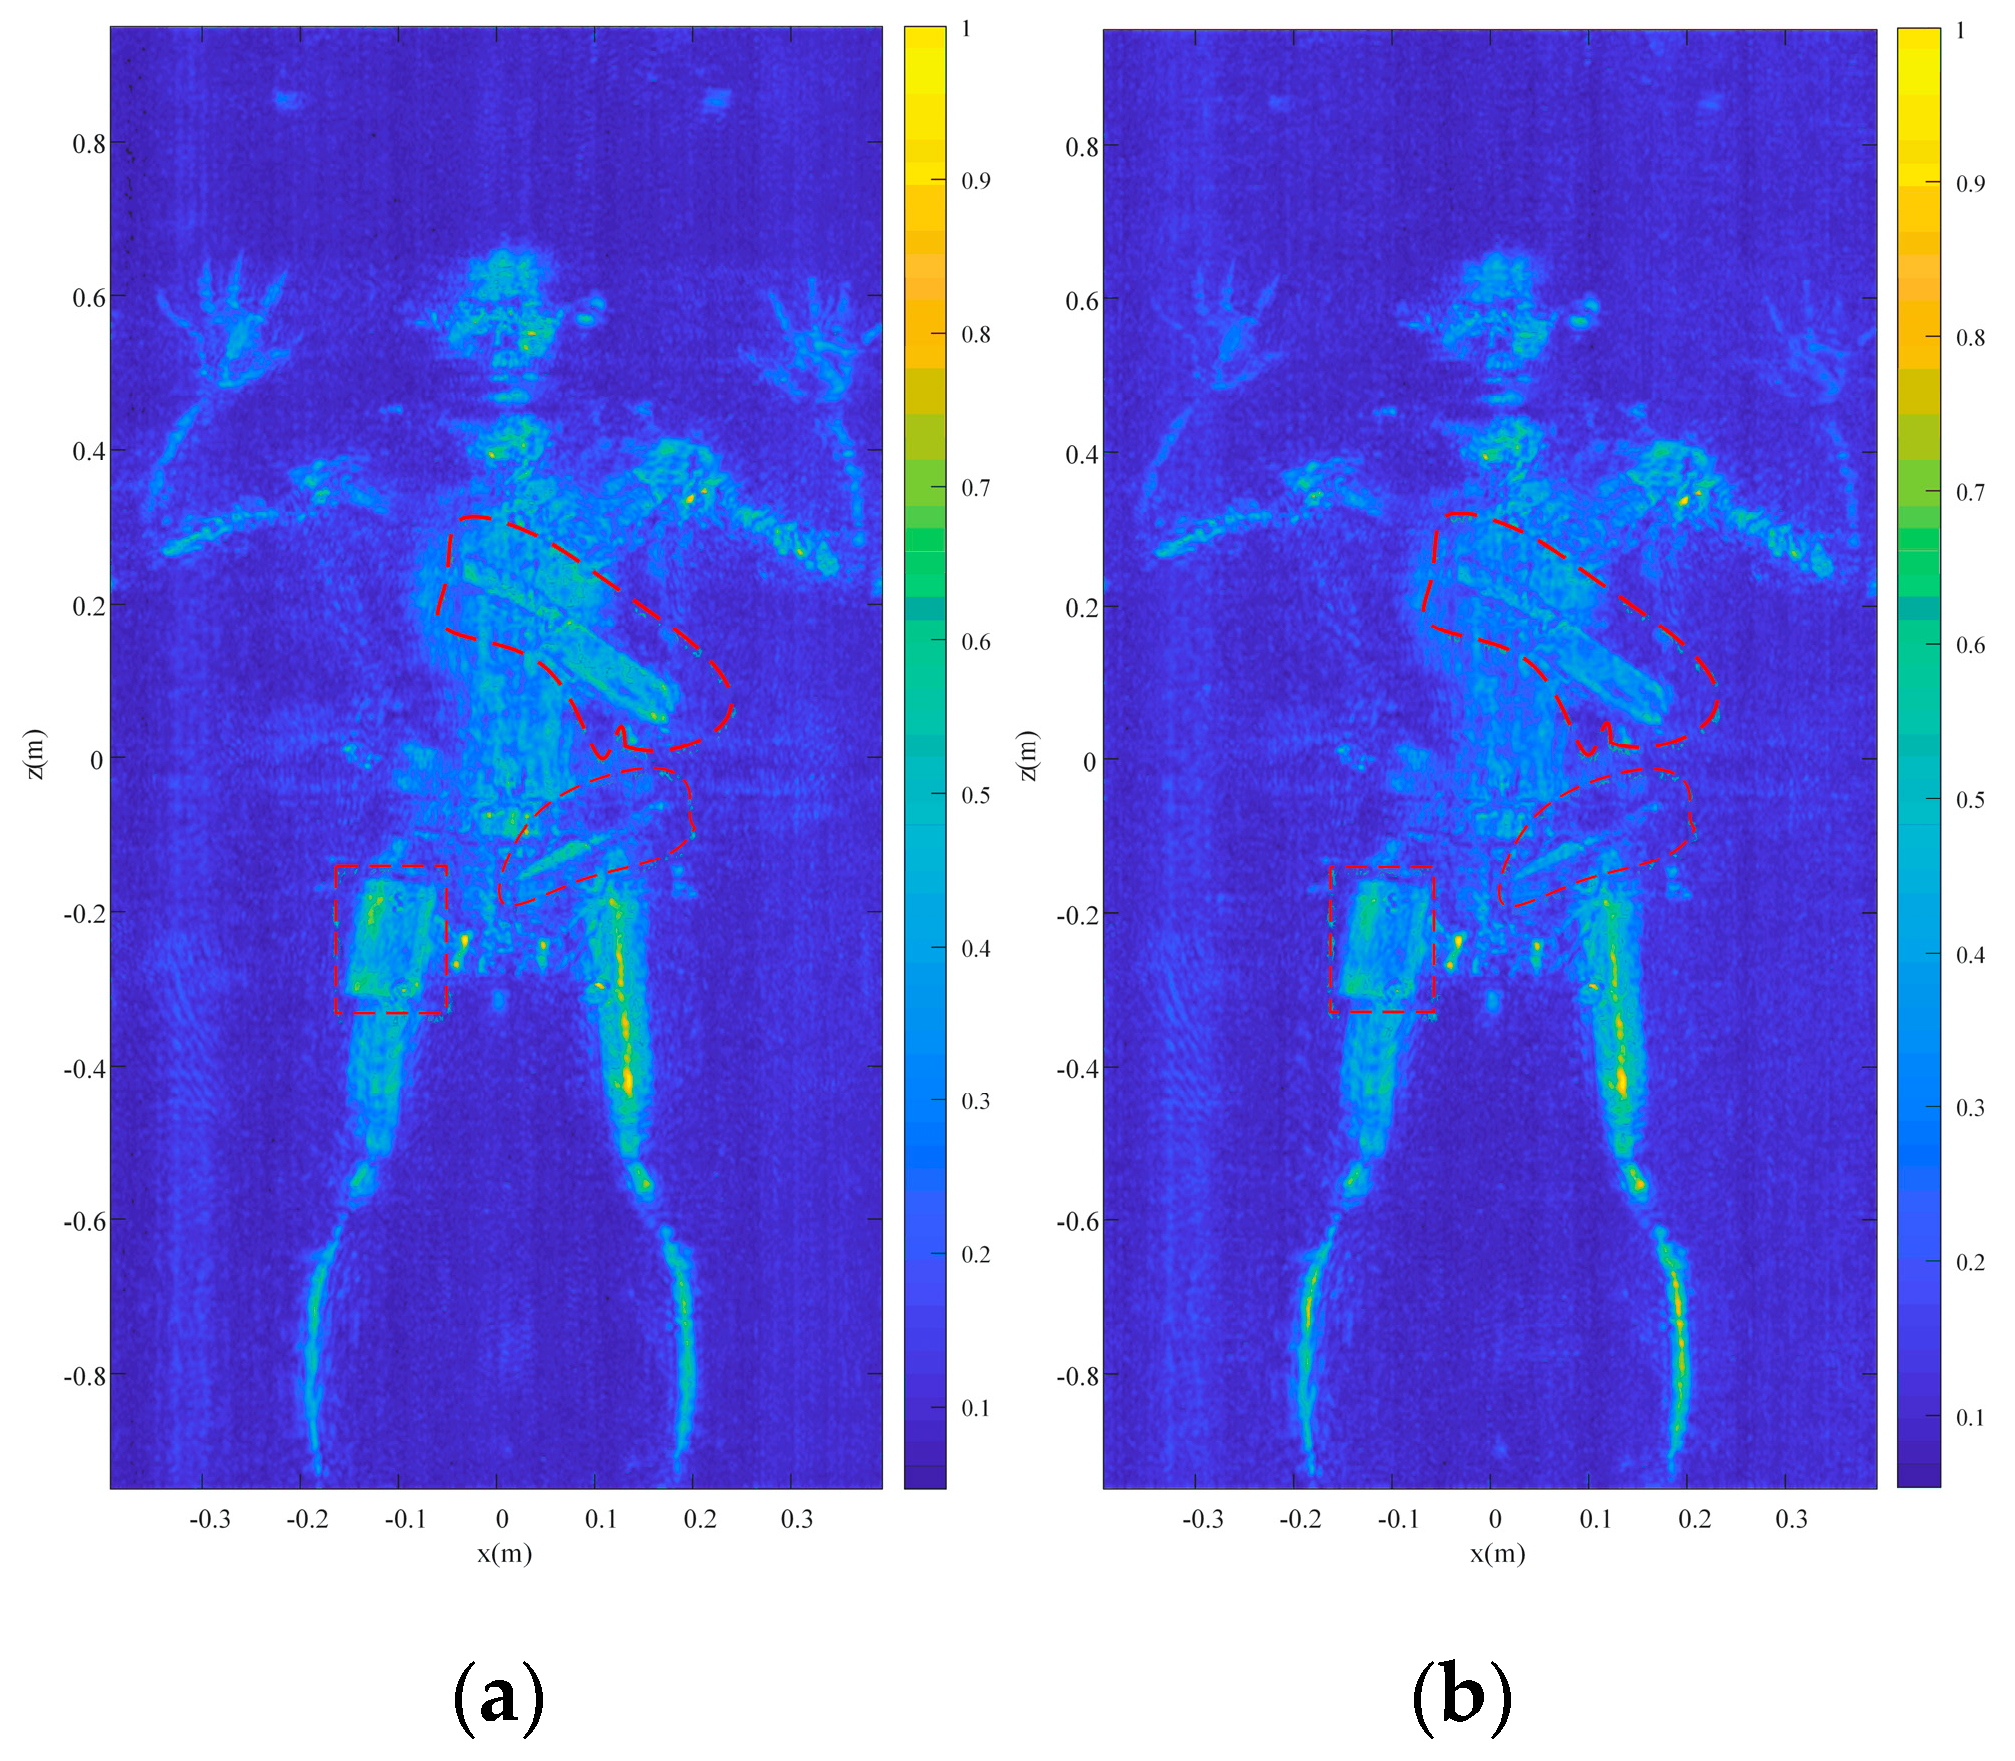
3.4. Experimental Results
4. Conclusions
Author Contributions
Funding
Institutional Review Board Statement
Informed Consent Statement
Data Availability Statement
Acknowledgments
Conflicts of Interest
Appendix A
References
- Global Terrorism Database. Available online: https://www.start.umd.edu/gtd/ (accessed on 3 February 2023).
- Hounsfield, G.N. Method and Apparatus for Measuring X-or γ-Radiation Absorption or Transmission at Plural Angles and Analyzing the Data. US Patent 3778614, 11 December 1973. [Google Scholar]
- Vollmer, M.; Klaus-Peter, M. Infrared Thermal Imaging: Fundamentals, Research and Applications; John Wiley & Sons: Weinheim, Germany, 2018. [Google Scholar]
- Demirci, S.; Cetinkaya, H.; Yigit, E.; Ozdemir, C.; Vertiy, A.A. A study on millimeter-wave imaging of concealed objects: Application using back-projection algorithm. Prog. Electromagn. Res. 2012, 128, 457–477. [Google Scholar] [CrossRef]
- Moll, J.; Schops, P.; Krozer, V. Towards three-dimensional millimeter-wave radar with the bistatic fast-factorized back-projection algorithm—Potential and limitations. IEEE Trans. Terahertz Sci. Technol. 2012, 2, 432–440. [Google Scholar] [CrossRef]
- Abbasi, M.; Shayei, A.; Shabany, M.; Kavehvash, Z. Fast Fourier-based implementation of synthetic aperture radar algorithm for multistatic imaging system. IEEE Trans. Instrum. Meas. 2018, 68, 3339–3349. [Google Scholar] [CrossRef]
- Broquetas, A.; Palau, J.; Jofre, L.; Cardama, A. Spherical wave near-field imaging and radar cross-section measurement. IEEE Trans. Antennas Propag. 1998, 46, 730–735. [Google Scholar] [CrossRef]
- Boag, A. A fast multilevel domain decomposition algorithm for radar imaging. In Proceedings of the IEEE Antennas and Propagation Society International Symposium, Orlando, FL, USA, 11–16 July 1999; Volume 3, pp. 1788–1791. [Google Scholar]
- Boag, A. A fast multilevel domain decomposition algorithm for radar imaging. IEEE Trans. Antennas Propag. 2001, 49, 666–671. [Google Scholar] [CrossRef]
- Tan, K.; Chen, X. Precise near-range 3-D image reconstruction based on MIMO circular synthetic aperture radar. IEEE Trans. Microwave Theory Tech. 2021, 69, 2651–2661. [Google Scholar] [CrossRef]
- Sheen, D.M.; McMakin, D.L.; Hall, T.E. Three-dimensional millimeter-wave imaging for concealed weapon detection. IEEE Trans. Microwave Theory Tech. 2001, 49, 1581–1592. [Google Scholar] [CrossRef]
- Gabor, D. A new microscopic principle. Nature 1948, 161, 777–778. [Google Scholar] [CrossRef]
- Wolf, E. Three-dimensional structure determination of semi-transparent objects from holographic data. Opt. Commun. 1969, 1, 153–156. [Google Scholar] [CrossRef]
- Qiao, L.; Wang, Y.; Shen, Z.; Zhao, Z.; Chen, Z. Compressive sensing for direct millimeter-wave holographic imaging. Appl. Opt. 2015, 54, 3280–3289. [Google Scholar] [CrossRef]
- Qiao, L.; Wang, Y.; Zhao, Z.; Chen, Z. Exact reconstruction for near-field threedimensional planar millimeter-wave holographic imaging. J. Infrared Millim Terahertz Waves. 2015, 36, 1221–1236. [Google Scholar] [CrossRef]
- McMakin, D.L.; Sheen, D.M.; Collins, H.D.; Hall, T.E.; Severtsen, R.H. Wideband millimeter-wave holographic weapons surveillance systems. In Proceedings of the European Symposium on Optics for Environmental and Public Safety, Munich, Germany, 19–23 June 1995; Volume 2511, pp. 131–141. [Google Scholar]
- Sheen, D.M.; McMakin, D.L.; Barber, J.; Hall, T.E.; Severtsen, R.H. Active imaging at 350 GHz for security applications. In Proceedings of the SPIE Defense and Security Symposium, Orlando, FL, USA, 16–20 March 2008; Volume 6948, p. 69480M. [Google Scholar]
- Sheen, D.; McMakin, D.; Hall, T. Near-field three-dimensional radar imaging techniques and applications. Appl. Opt. 2010, 49, E83–E93. [Google Scholar] [CrossRef]
- Sheen, D.M.; Clark, R.T.; Tedeschi, J.; Jones, A.M.; Hall, T.E. High-resolution 3D microwave imaging of a moving target using optical motion capture. In Proceedings of the SPIE Defense + Commercial Sensing, Baltimore, MD, USA, 14–18 April 2019; Volume 10994, p. 109940D. [Google Scholar]
- Smith, D.; Yurduseven, O.; Livingstone, B.; Schejbal, V. Microwave imaging using indirect holographic techniques. IEEE Antennas Propag. Mag. 2014, 56, 104–117. [Google Scholar] [CrossRef]
- Cheng, H.; Gu, J.; Cheng, Y.; Li, S.; Sun, H. Multi-section auto-focus millimeter-wave holography. In Proceedings of the 2016 IEEE MTT-S International Microwave Symposium (IMS), San Francisco, CA, USA, 22–27 May 2016; pp. 1–3. [Google Scholar]
- Cheng, H.; Li, S.; Zheng, H.; Jing, H.; Sun, H. A W-band auto-focus holographic imaging system for security screening. IEICE Electron. Express. 2017, 14, 20170347. [Google Scholar] [CrossRef]
- Moulder, W.F.; Krieger, J.D.; Majewski, J.J.; Coldwell, C.M.; Nguyen, H.T.; Maurais-Galejs, D.T.; Anderson, T.L.; Dufilie, P.; Herd, J.S. Development of a high-throughput microwave imaging system for concealed weapons detection. In Proceedings of the 2016 IEEE International Symposium on Phased Array Systems and Technology (PAST), Waltham, MA, USA, 18–21 October 2016. [Google Scholar]
- Gao, J.; Deng, B.; Qin, Y.; Wang, H.; Li, X. An efficient algorithm for MIMO cylindrical millimeter-wave holographic 3-D imaging. IEEE Trans. Microwave Theory Tech. 2018, 66, 5065–5074. [Google Scholar] [CrossRef]
- Meng, Y.; Lin, C.; Zang, J.; Qing, A.; Nikolova, N.K. General theory of holographic inversion with linear frequency modulation radar and its application to whole-body security scanning. IEEE Trans. Microwave Theory Tech. 2020, 68, 4694–4705. [Google Scholar] [CrossRef]
- Meng, Y.; Lin, C.; Qing, A.; Nikolova, N.K. Accelerated holographic imaging with range stacking for linear frequency modulation radar. IEEE Trans. Microwave Theory Tech. 2022, 70, 1630–1638. [Google Scholar] [CrossRef]
- Zhu, Y.-K.; Yang, M.-H.; Wu, L.; Sun, Y.; Sun, X.-W. Millimeter-wave holographic imaging algorithm with amplitude corrections. Prog. Electromagn. Res. M. 2016, 49, 33–39. [Google Scholar] [CrossRef]
- Gao, J.; Deng, B.; Qin, Y.; Wang, H.; Li, X. Efficient terahertz wide-angle NUFFT-based inverse synthetic aperture imaging considering spherical wavefront. Sensors 2016, 16, 2120. [Google Scholar] [CrossRef]
- Detlefsen, J.; Dallinger, A.; Huber, S.; Schelkshorn, S. Effective reconstruction approaches to millimeter-wave imaging of humans. In Proceedings of the 28th General Assembly of International Union of Radio Science, New Delhi, India, 23–29 October 2005; pp. 23–29. [Google Scholar]
- Yanik, M.E.; Wang, D.; Torlak, M. Development and demonstration of MIMO-SAR mmWave imaging testbeds. IEEE Access 2020, 8, 126019–126038. [Google Scholar] [CrossRef]
- Hughes, W.; Gault, K.; Princz, G. A comparison of the range-Doppler and chirp scaling algorithms with reference to RADARSAT. In Proceedings of the IGARSS ’96. 1996 International Geoscience and Remote Sensing Symposium, Lincoln, NE, USA, 31 May 1996; Volume 2, pp. 1221–1223. [Google Scholar]
- Soumekh, M. Bistatic synthetic aperture radar inversion with application in dynamic object imaging. IEEE Trans. Signal Process. 1991, 39, 2044–2055. [Google Scholar] [CrossRef] [PubMed]
- Bamler, R. A comparison of range-Doppler and wavenumber domain SAR focusing algorithms. IEEE Trans. Geosci. Remote Sens. 1992, 30, 706–713. [Google Scholar] [CrossRef]
- Raney, R.K.; Runge, H.; Bamler, R.; Cumming, I.G.; Wong, F.H. Precision SAR processing using chirp scaling. IEEE Trans. Geosci. Remote Sens. 1994, 32, 786–799. [Google Scholar] [CrossRef]
- Zhuge, X.; Yarovoy, A.G. Three-dimensional near-field MIMO array imaging using range migration techniques. IEEE Trans. Image Process. 2012, 21, 3026–3033. [Google Scholar] [CrossRef] [PubMed]
- Lopez-Sanchez, J.M.; Fortuny-Guasch, J. 3-D radar imaging using range migration techniques. IEEE Trans. Antennas Propag. 2000, 48, 728–737. [Google Scholar] [CrossRef]
- Tan, K.; Wu, S.; Liu, X.; Fang, G. Omega-K algorithm for near-field 3-D image reconstruction based on planar SIMO/MIMO array. IEEE Trans. Geosci. Remote Sens. 2019, 57, 2381–2394. [Google Scholar] [CrossRef]
- Tan, W.; Huang, P.; Huang, Z.; Qi, Y.; Wang, W. Three-dimensional microwave imaging for concealed weapon detection using range stacking technique. Int. J. Antennas Propag. 2017, 2017, 1480623. [Google Scholar] [CrossRef]
- Zhuge, X.; Yarovoy, A.G.; Savelyev, T.; Ligthart, L. Modified Kirchhoff migration for UWB MIMO array-based radar imaging. IEEE Trans. Geosci. Remote Sens. 2010, 48, 2692–2703. [Google Scholar] [CrossRef]
- Wang, Z.; Guo, Q.; Tian, X.; Chang, T.; Cui, H. Millimeter-wave image reconstruction algorithm for one-stationary bistatic SAR. IEEE Trans. Microwave Theory Tech. 2020, 68, 1185–1194. [Google Scholar] [CrossRef]
- Fromenteze, T.; Yurduseven, O.; Berland, F.; Decroze, C.; Smith, D.R.; Yarovoy, A.G. A transverse spectrum deconvolution technique for MIMO short-range Fourier imaging. IEEE Trans. Geosci. Remote Sens. 2019, 57, 6311–6324. [Google Scholar] [CrossRef]
- Wang, J.; Aubry, P.; Yarovoy, A. 3-D short-range imaging with irregular MIMO arrays using NUFFT-based range migration algorithm. IEEE Trans. Geosci. Remote Sens. 2020, 58, 4730–4742. [Google Scholar] [CrossRef]
- Fromentèze, T.; Yurduseven, O.; Berland, F.; Cyril, D.; Smith, D.R.; Yarovoy, A.G. Accelerating short range MIMO imaging with optimized Fourier processing. In Proceedings of the SPIE Defense + Commercial Sensing, Online, 27 April–9 May 2020; Volume 11411D, pp. 56–61. [Google Scholar]
- Nie, X.; Cheng, L.; Wang, S.; Amsdon, T.; Roberston, I.D.; Qing, A. The effect of range on close-Range millimeter-wave imaging systems. In Proceedings of the 2023 IEEE International Symposium on Antennas and Propagation and North American Radio Science Meeting, Portland, OR, USA, July 2023. (accepted). [Google Scholar]
- Born, M.; Wolf, E. Principles of Optics: Electromagnetic Theory of Propagation, Interference and Diffraction of Light, 15th ed.; Cambridge University Press: Cambridge, UK, 2019. [Google Scholar]
- Nikolova, N.K. Introduction to Microwave Imaging; Cambridge University Press: New York, NY, USA, 2017. [Google Scholar]
- Kettler, D.; Redding, N.; Gray, D. Exact point spread functions for SAR imaging. In Proceedings of the Committee Earth Observation Satellites, Synthetic Aperture Radar Workshop, September 2005; pp. 1–8. Available online: https://www.researchgate.net/publication/310651741_Exact_Point_Spread_Functions_for_SAR_Imaging (accessed on 6 March 2023).
- Ahmed, S.S.; Schiessl, A.; Schmidt, L. A novel active real-time digital-beamforming imager for personnel screening. In Proceedings of the EUSAR 2012; 9th European Conference on Synthetic Aperture Radar, Nuremberg, Germany, 23–26 April 2012; pp. 178–181. [Google Scholar]
- Zhou, W.; Bovik, A.C.; Sheikh, H.R.; Simoncelli, E.P. Image quality assessment: From error visibility to structural similarity. IEEE Trans. Image Process. 2004, 13, 600–612. [Google Scholar]


| Parameters | Value |
|---|---|
| Center frequency | 29.9 GHz |
| Frequency bandwidth | 5.8 GHz |
| The number of sampling frequency points | 220 |
| The length of the aperture along x axis | 360 mm |
| The sampling interval along x axis | 5 mm |
| The length of the aperture along z axis | 360 mm |
| The sampling interval along z axis | 5 mm |
| Sheen’s Method [11] | Meng’s Method [25] | The Proposed Method | |
|---|---|---|---|
| SSIM | 9.495 × 10⁻¹ | 9.501 × 10⁻¹ | 9.544 × 10⁻¹ |
| RMSE | 5.957 × 10⁻³ | 5.921 × 10⁻³ | 4.316 × 10⁻³ |
| Method | Time (s) |
|---|---|
| Sheen’s method | 3.44 |
| Meng’s method | 3.54 |
| The proposed method | 3.61 |
| Sheen’s Method [11] | Meng’s Method [25] | The Proposed Method | |
|---|---|---|---|
| SSIM | 9.2118 × 10⁻¹ | 9.218 × 10⁻¹ | 9.270 × 10⁻¹ |
| RMSE | 1.0753 × 10⁻³ | 1.0714 × 10⁻³ | 8.774 × 10⁻³ |
| Algorithm | Time (s) |
|---|---|
| Sheen’s method | 2.86 |
| Meng’s method | 2.93 |
| The proposed method | 2.94 |
Disclaimer/Publisher’s Note: The statements, opinions and data contained in all publications are solely those of the individual author(s) and contributor(s) and not of MDPI and/or the editor(s). MDPI and/or the editor(s) disclaim responsibility for any injury to people or property resulting from any ideas, methods, instructions or products referred to in the content. |
© 2023 by the authors. Licensee MDPI, Basel, Switzerland. This article is an open access article distributed under the terms and conditions of the Creative Commons Attribution (CC BY) license (https://creativecommons.org/licenses/by/4.0/).
Share and Cite
Nie, X.; Lin, C.; Meng, Y.; Qing, A.; Sykulski, J.K.; Robertson, I.D. An Accurate Millimeter-Wave Imaging Algorithm for Close-Range Monostatic System. Sensors 2023, 23, 4577. https://doi.org/10.3390/s23104577
Nie X, Lin C, Meng Y, Qing A, Sykulski JK, Robertson ID. An Accurate Millimeter-Wave Imaging Algorithm for Close-Range Monostatic System. Sensors. 2023; 23(10):4577. https://doi.org/10.3390/s23104577
Chicago/Turabian StyleNie, Xinyi, Chuan Lin, Yang Meng, Anyong Qing, Jan K. Sykulski, and Ian D. Robertson. 2023. "An Accurate Millimeter-Wave Imaging Algorithm for Close-Range Monostatic System" Sensors 23, no. 10: 4577. https://doi.org/10.3390/s23104577
APA StyleNie, X., Lin, C., Meng, Y., Qing, A., Sykulski, J. K., & Robertson, I. D. (2023). An Accurate Millimeter-Wave Imaging Algorithm for Close-Range Monostatic System. Sensors, 23(10), 4577. https://doi.org/10.3390/s23104577