


Water Meter Reading for Smart Grid Monitoring


Abstract
1. Introduction
- the possibility of offering customized contracts for particular users, modifying the limit of the power supplied and applying more complex multi-hour tariffs or similar options;
- the opportunity to remotely disconnect some users from the network in the event of arrears or in the event of network overload, if provided for by contract;
- the possibility of having greater control over the distribution network in order to avoid fraud or abusive energy withdrawals;
- the opportunity to intervene automatically when there is a failure in the meter;
- the possibility of minimizing inefficiencies, due to the immediate acquisition of information.
- reduction of reading and contract management costs—operations that now become feasible remotely;
- higher reading frequency;
- network monitoring and maintenance optimization in case of leaks;
- possibility of free competition;
- user awareness of consumption and waste, given by the real-time measurement of consumption and related analysis due to efficiency algorithms;
- improvement of energy habits and increase in energy savings;
- reduction of energy costs for the user.
- at least once a year for customers with consumption up to 500 standard per cubic metre (Smc)/year;
- at least twice a year for customers with consumption above 500 Smc/year and up to 1500 Smc/year;
- at least three times a year for customers with consumption above 1500 Smc/year and up to 5000 Smc/year;
- at least once a month for customers with consumption above 5000 cubic meters/year.
2. Related Work
3. A Method for Automatic Dial Meter Reading
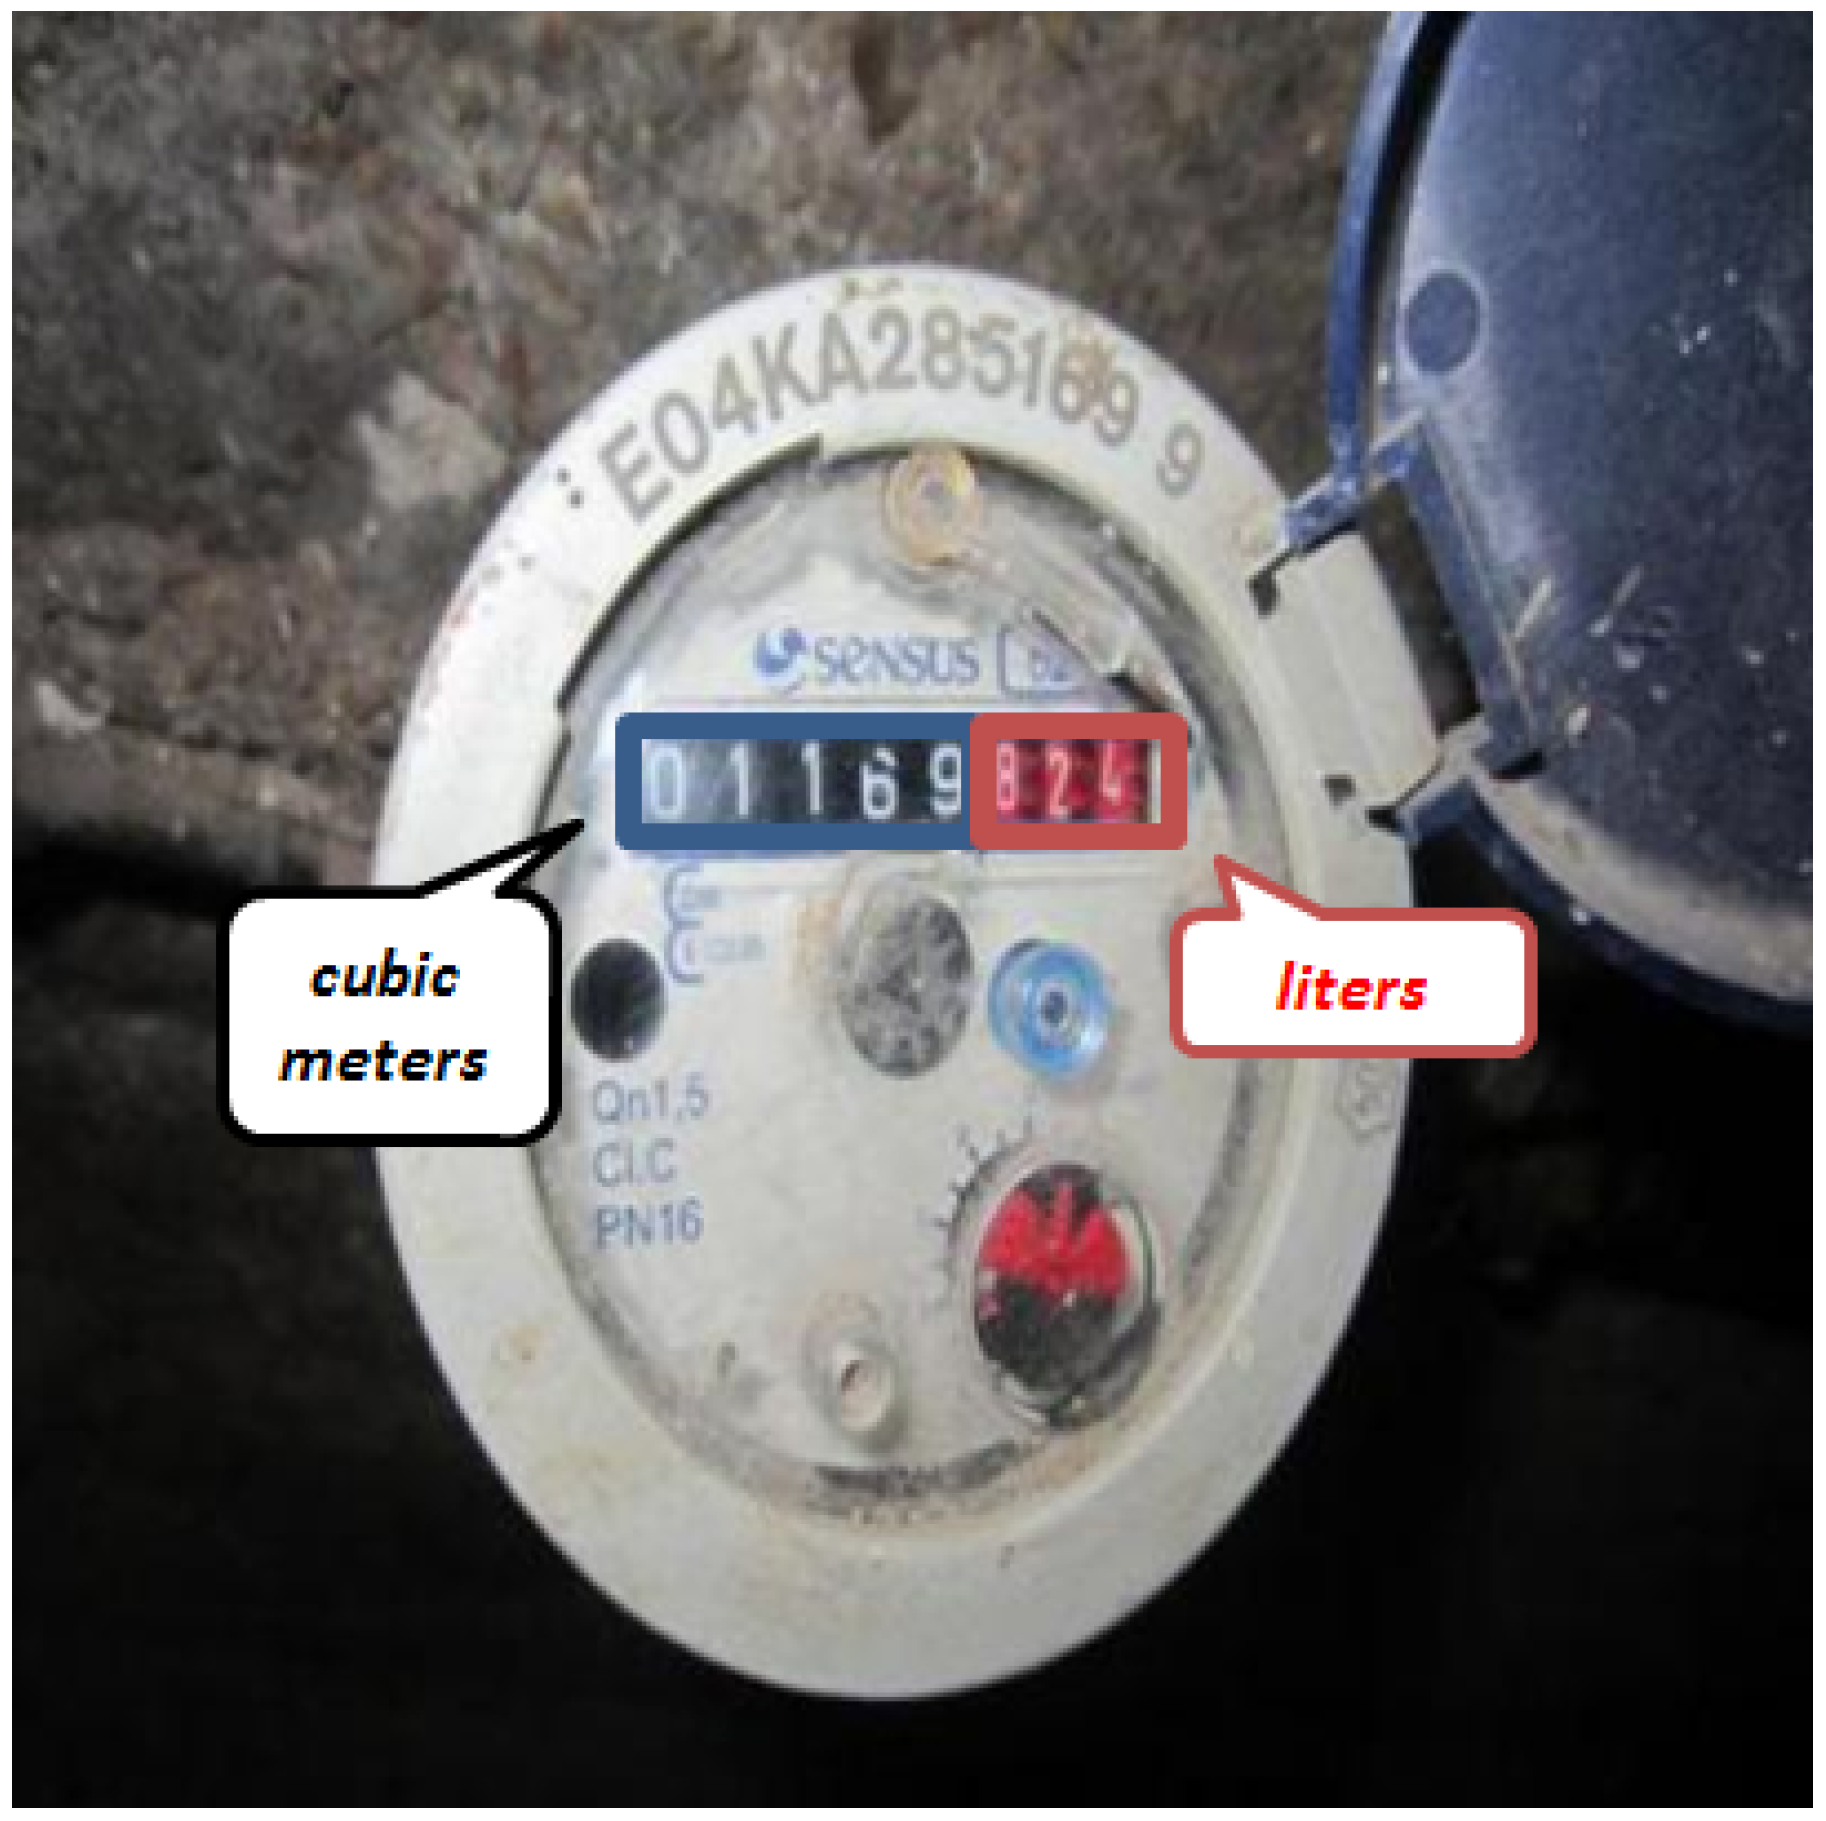
- The cubic meters of consumption with the digits in white on a black background or the reverse. This is the information that we need to extract from the water meter images.
- The litres of consumption, with the digits in white on a red background or the reverse. This part of the meter will be ignored for the reading of the index as only the cubic meters are useful when billing consumers.
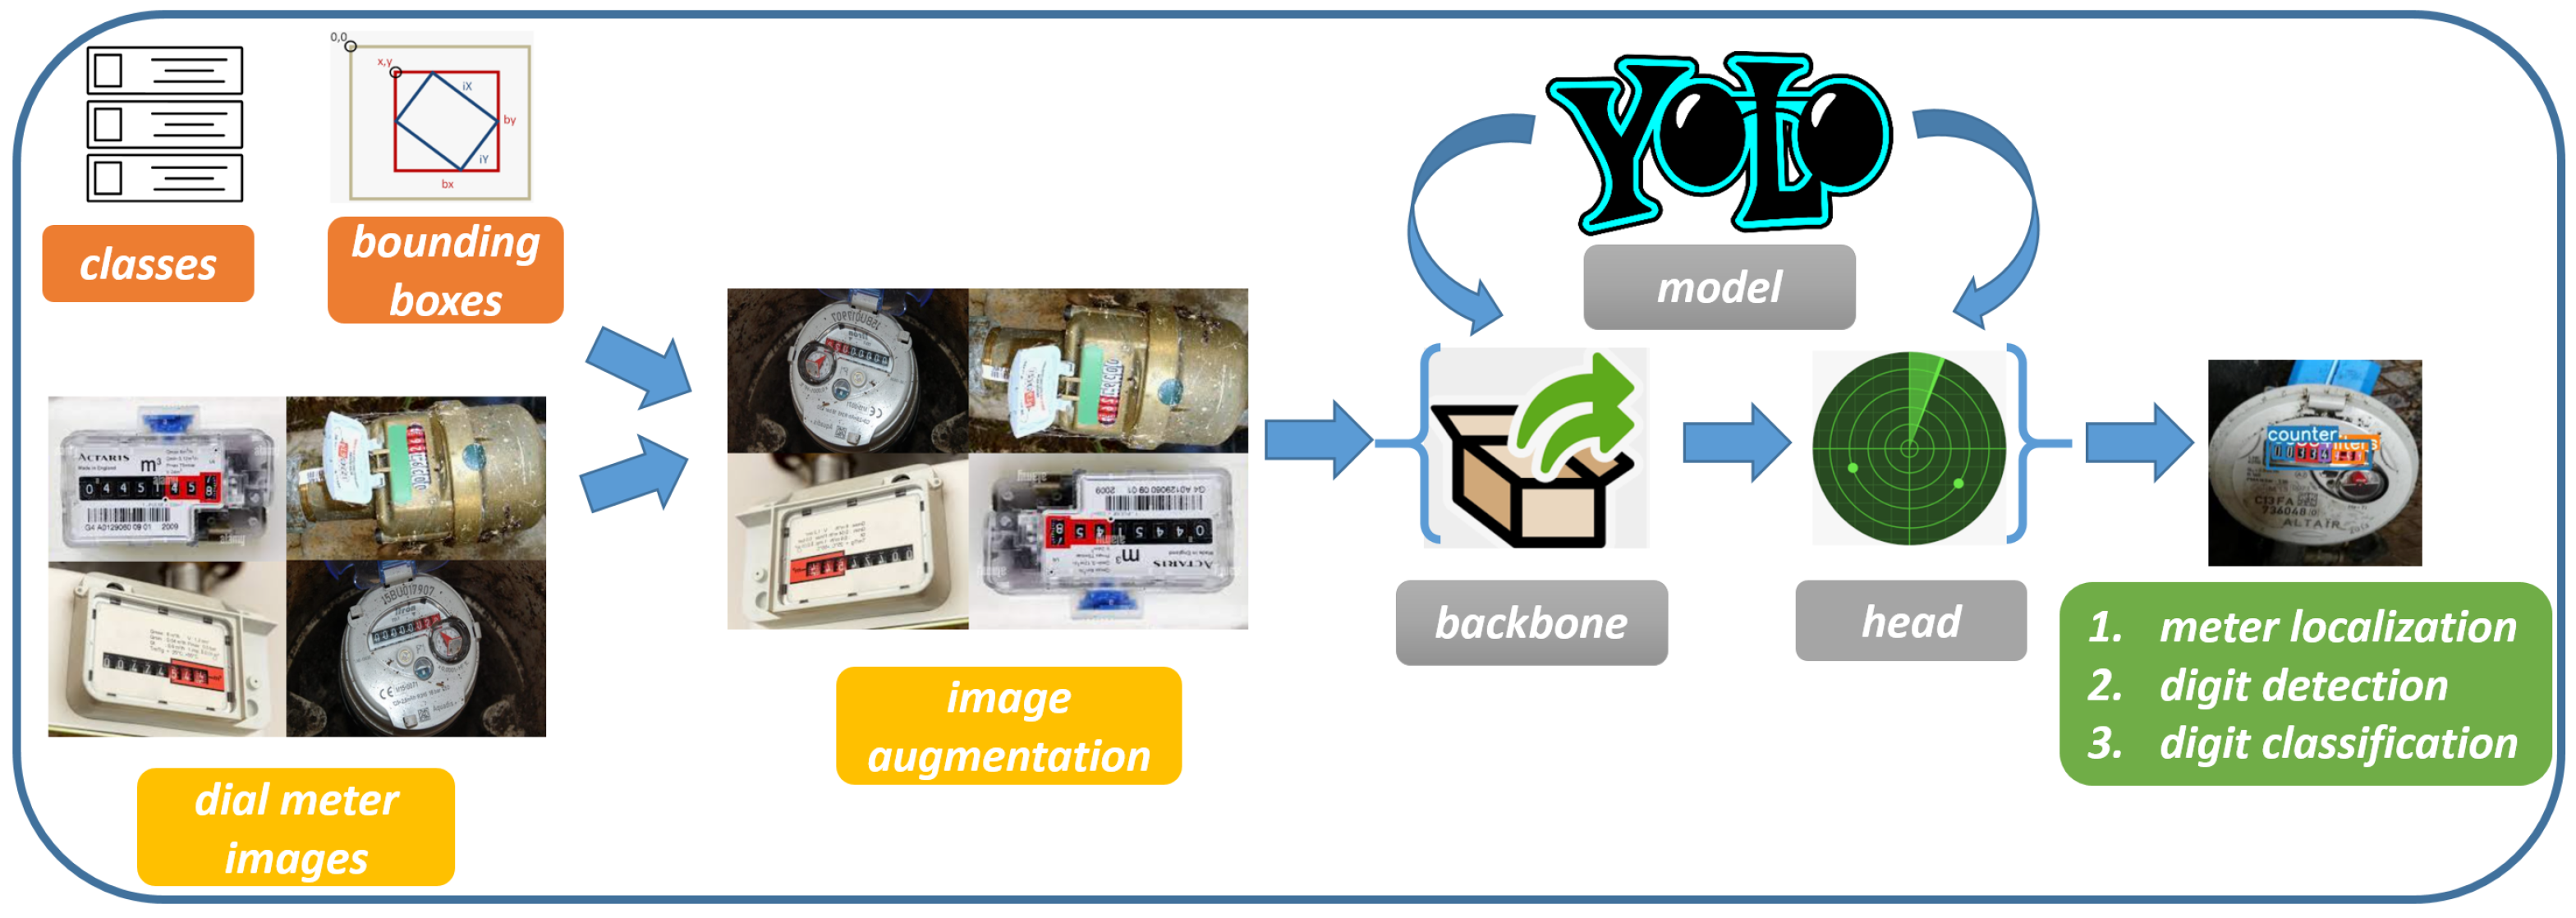
The YOLO Model
| Listing 1. The architecture of the YOLOv5s model for object detection. |
| # YOLOv5 backbone |
| backbone: |
| # [from, number, module, args] |
| [[−1, 1, Focus, [64, 3]], |
| [−1, 1, Conv, [128, 3, 2]], |
| [−1, 3, BottleneckCSP, [128]], |
| [−1, 1, Conv, [256, 3, 2]], |
| [−1, 9, BottleneckCSP, [256]], |
| [−1, 1, Conv, [512, 3, 2]], |
| [−1, 9, BottleneckCSP, [512]], |
| [−1, 1, Conv, [1024, 3, 2]], |
| [−1, 1, SPP, [1024, [5, 9, 13]]], |
| [−1, 3, BottleneckCSP, [1024, False]], |
| ] |
| # YOLOv5 head |
| head: |
| [[−1, 1, Conv, [512, 1, 1]], |
| [−1, 1, nn.Upsample, [None, 2, ’nearest’]], |
| [[−1, 6], 1, Concat, [1]], |
| [−1, 3, BottleneckCSP, [512, False]], |
| [−1, 1, Conv, [256, 1, 1]], |
| [−1, 1, nn.Upsample, [None, 2, ’nearest’]], |
| [[−1, 4], 1, Concat, [1]], |
| [−1, 3, BottleneckCSP, [256, False]], |
| [−1, 1, Conv, [256, 3, 2]], |
| [[−1, 14], 1, Concat, [1]], |
| [−1, 3, BottleneckCSP, [512, False]], |
| [−1, 1, Conv, [512, 3, 2]], |
| [[−1, 10], 1, Concat, [1]], |
| [−1, 3, BottleneckCSP, [1024, False]], |
| [[17, 20, 23], 1, Detect, [nc, anchors]], |
| ] |
- water meter cubic localization;
- water litre localization;
- digit detection in the water meter;
- digit classification.
4. Experimental Analysis
4.1. The Dataset
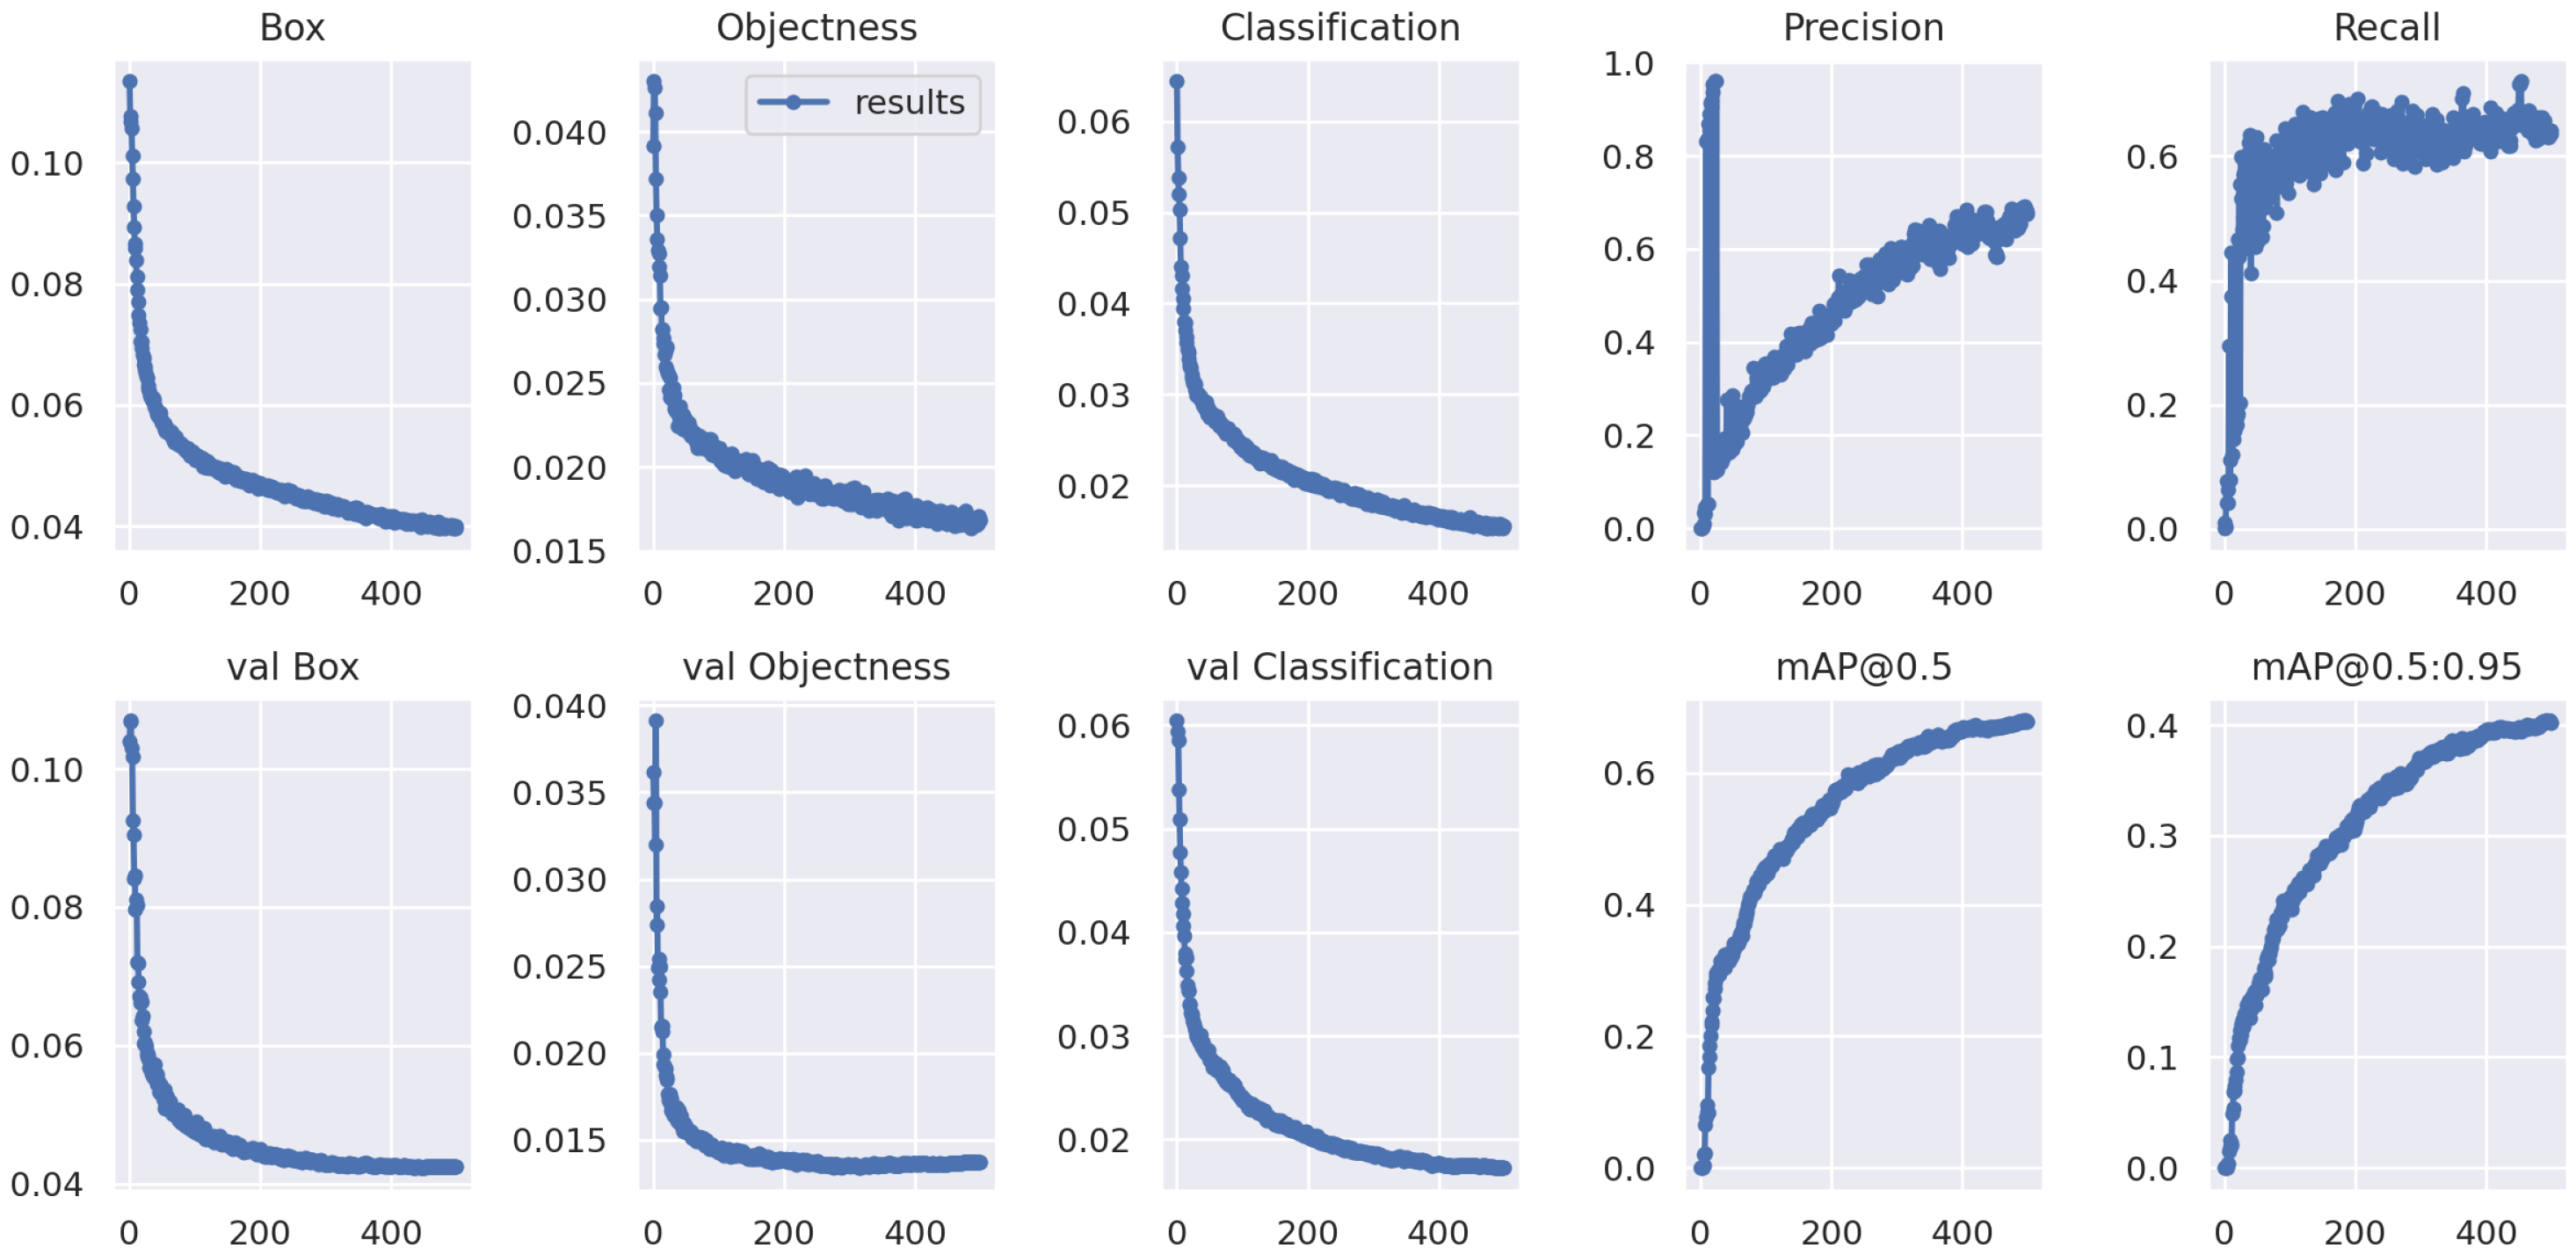
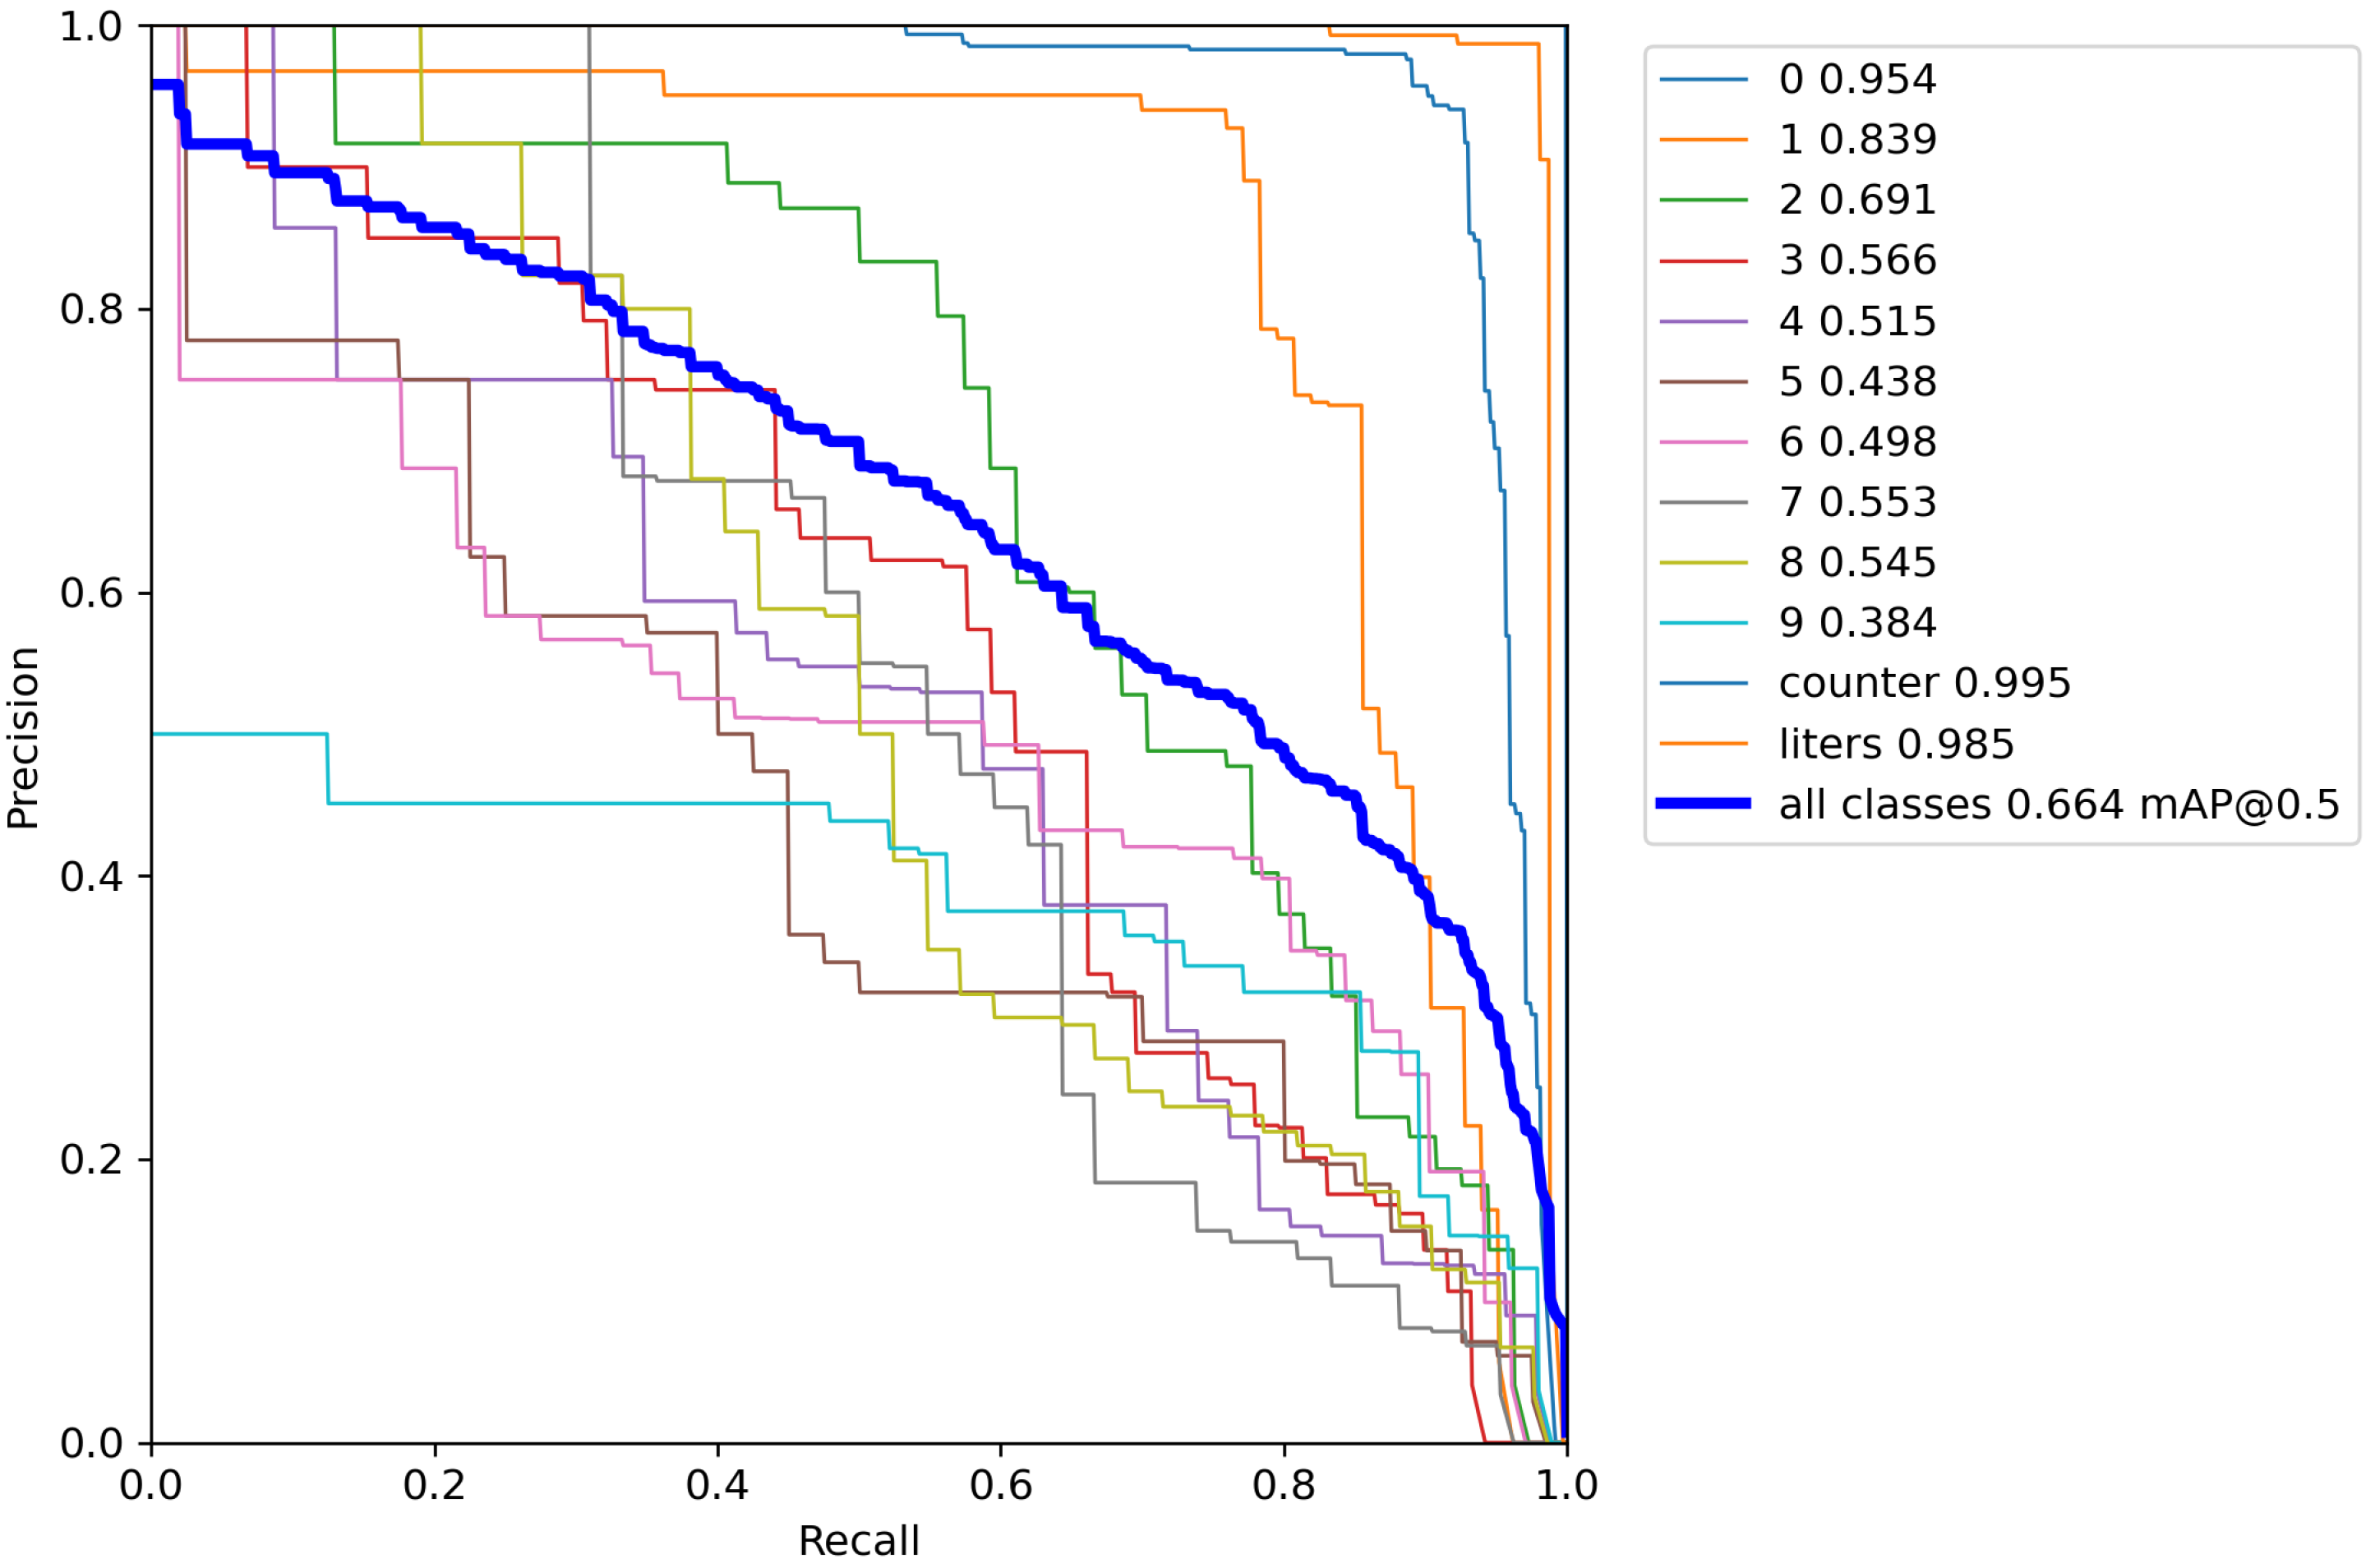
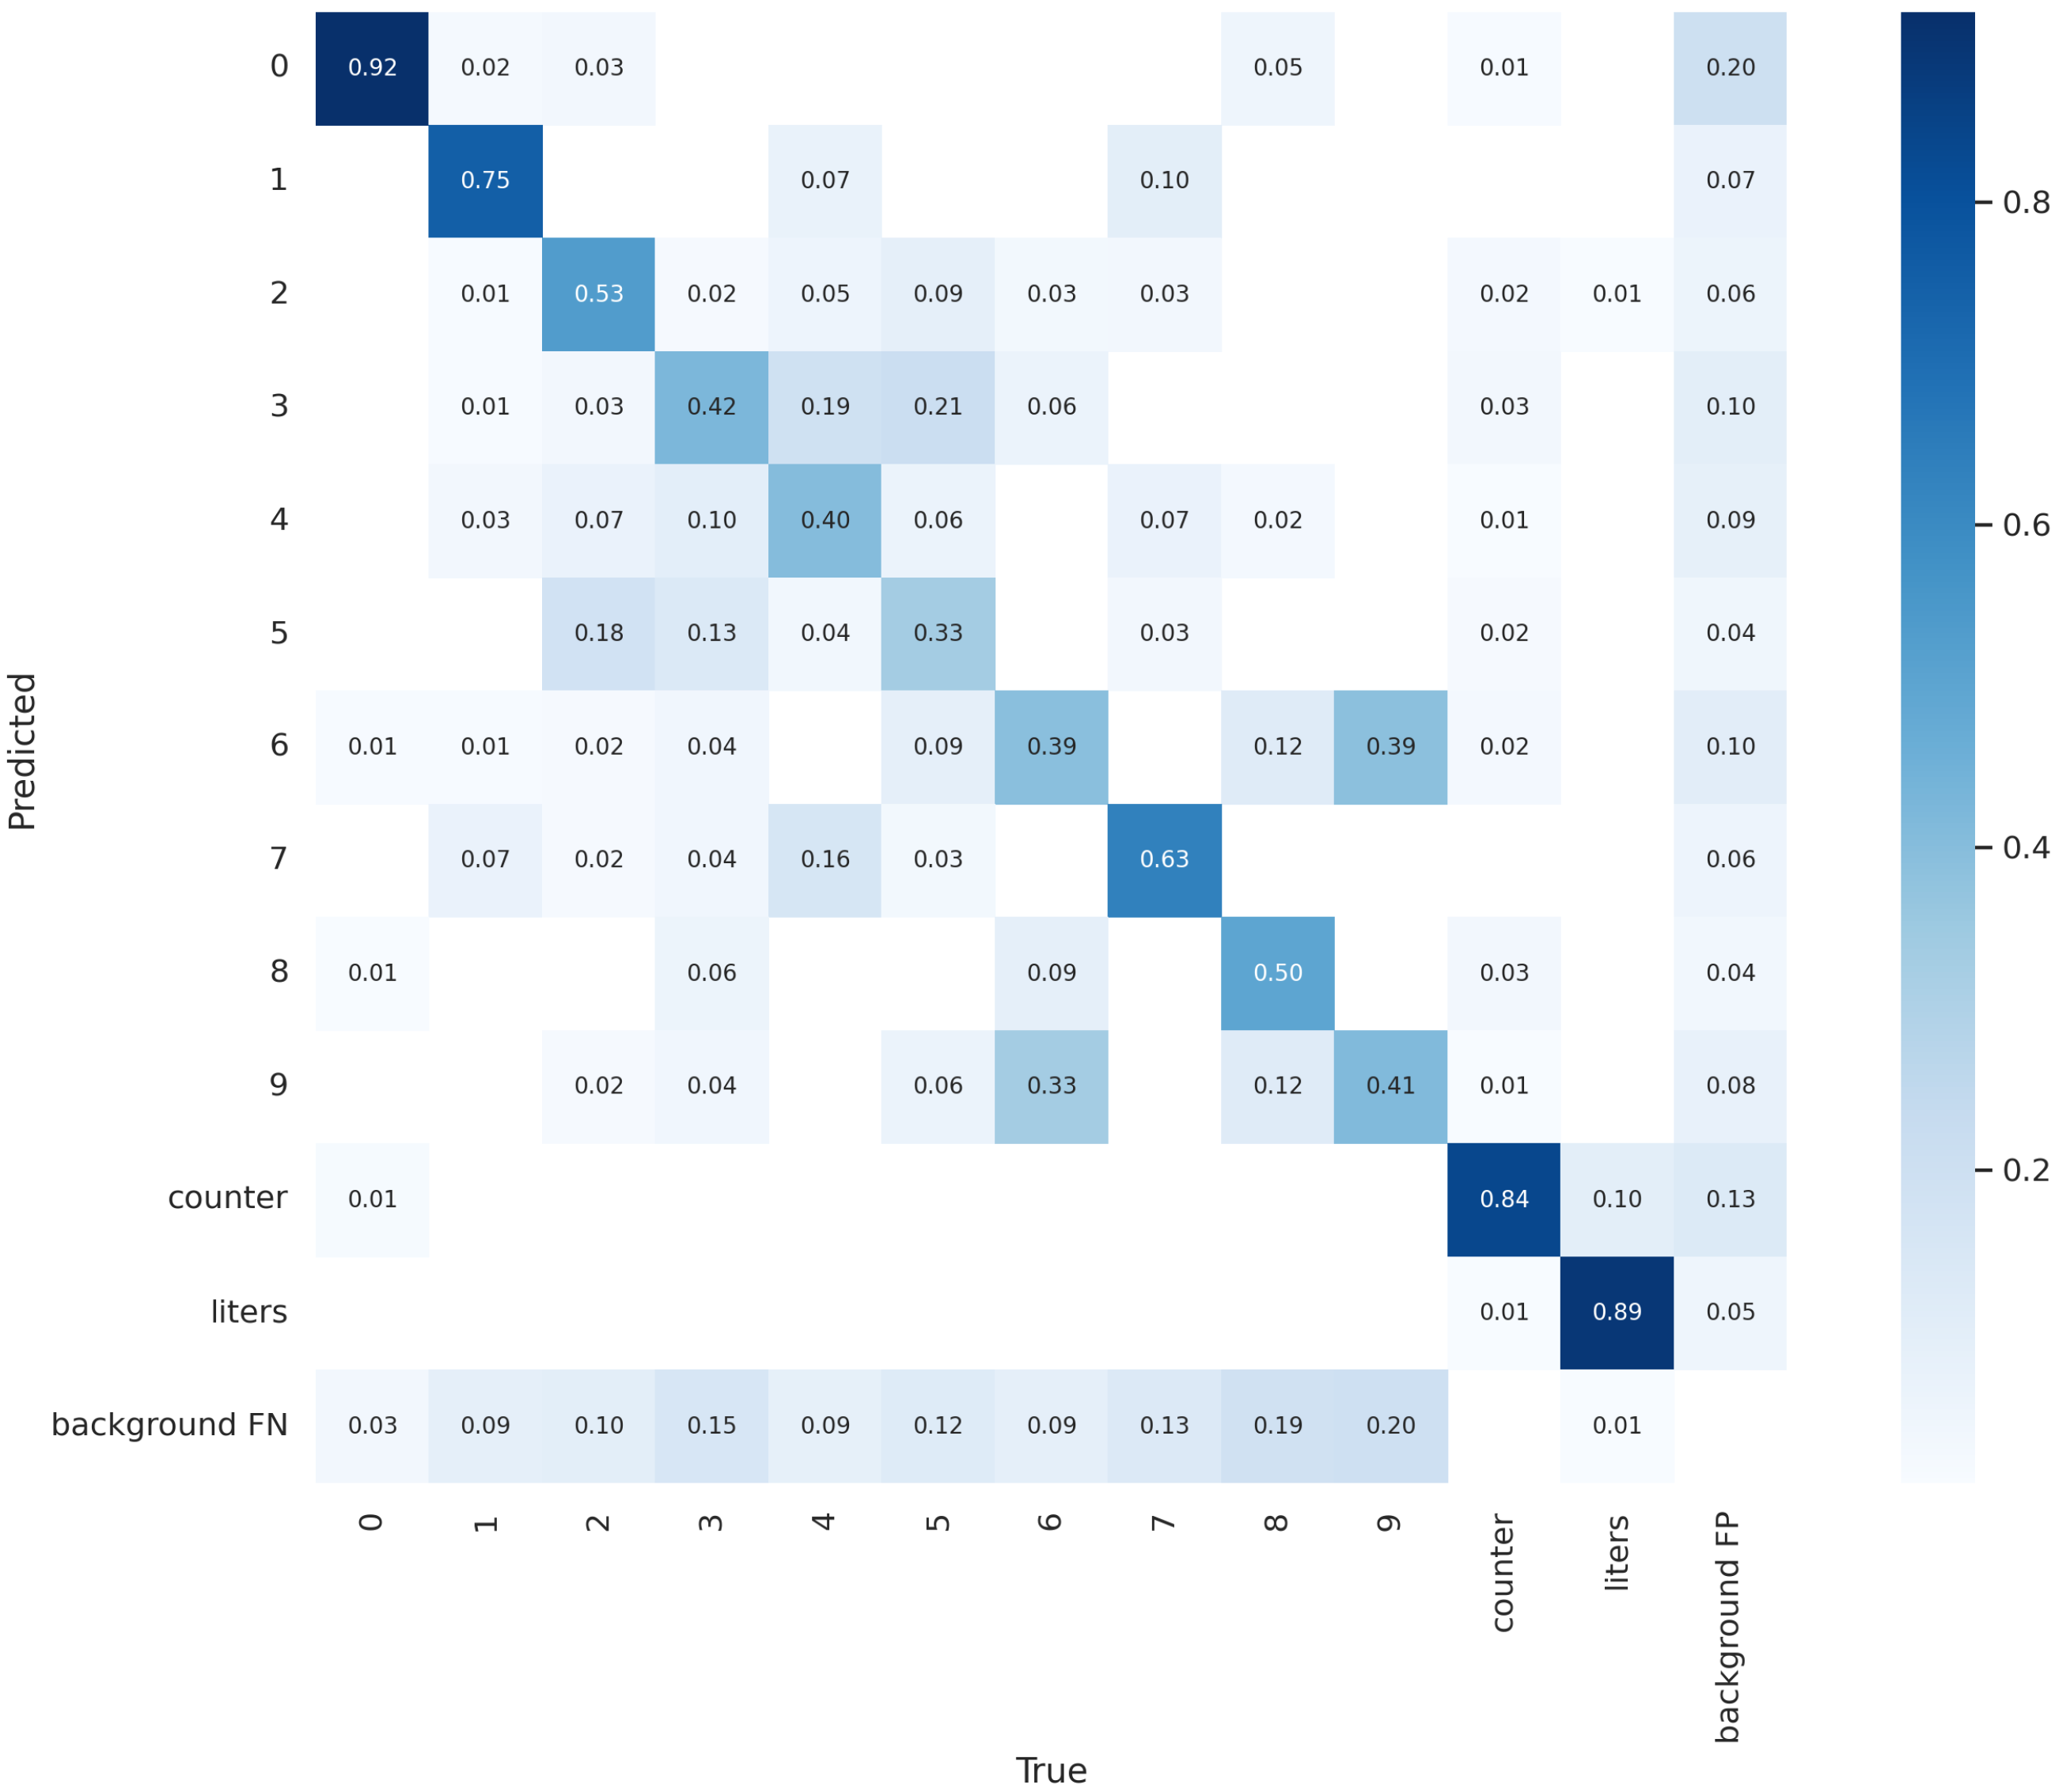
4.2. The Results
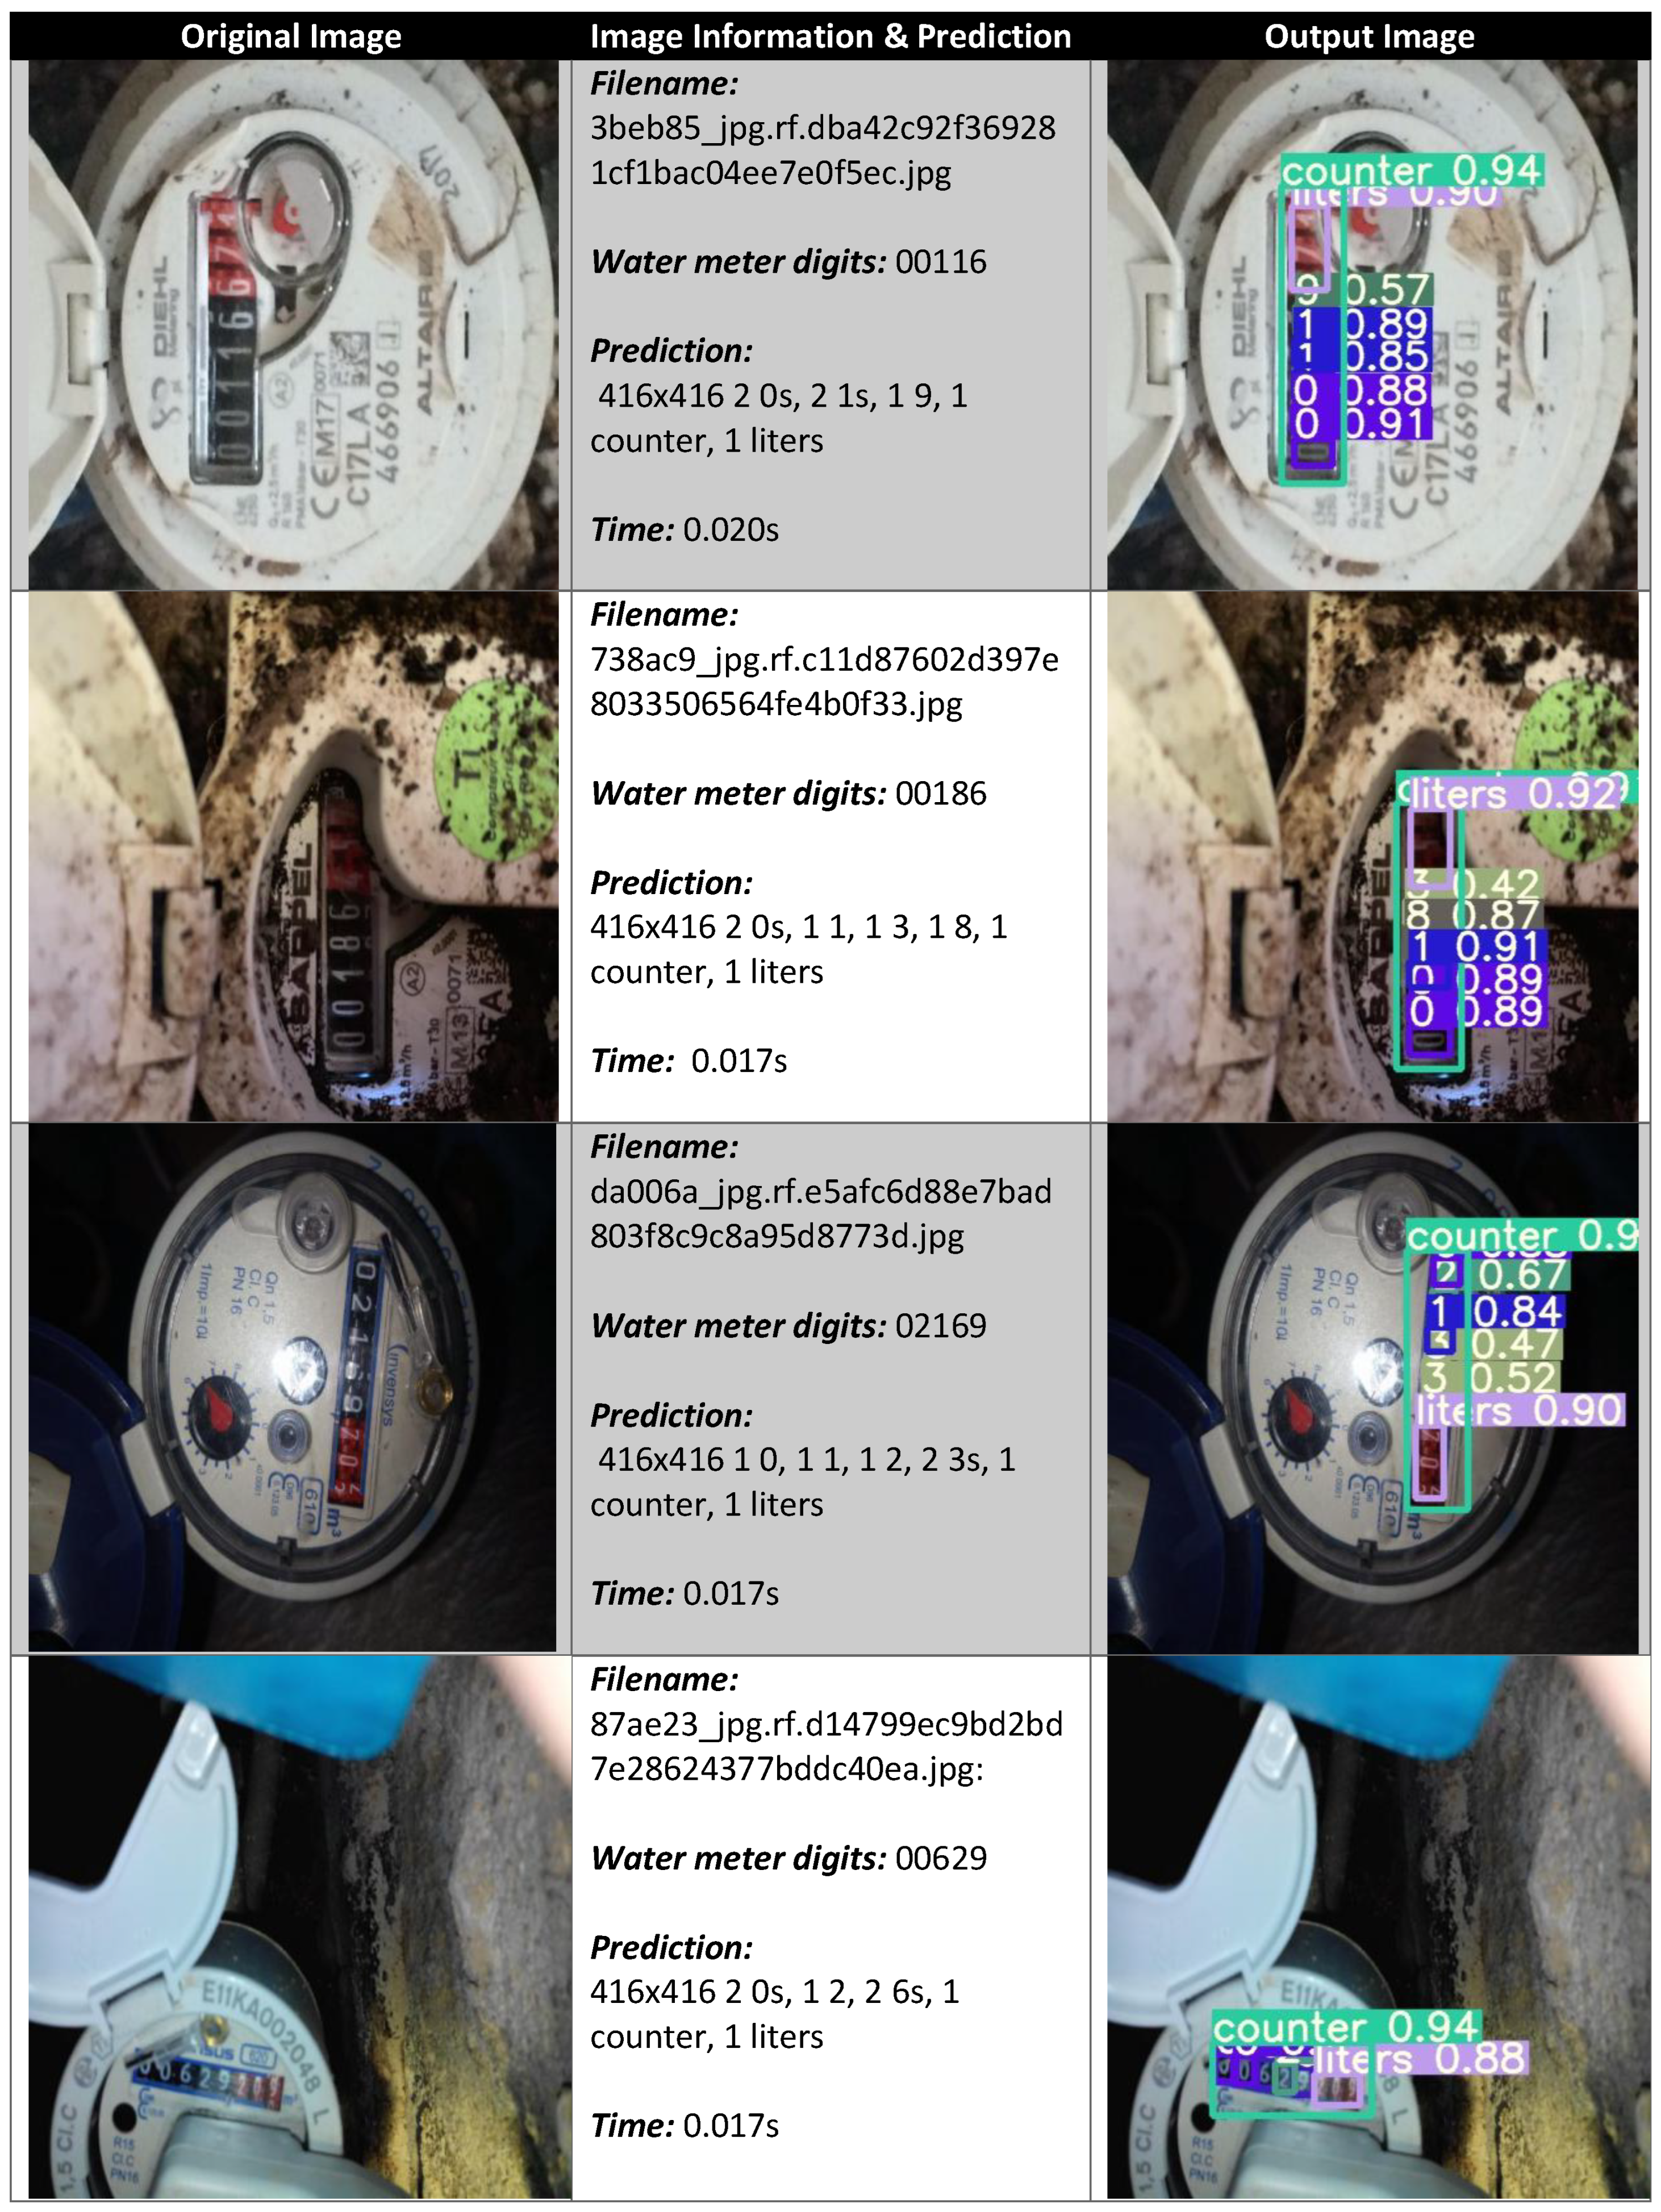
4.3. Prediction Examples
5. Conclusions and Future Work
Author Contributions
Funding
Institutional Review Board Statement
Informed Consent Statement
Conflicts of Interest
References
- Colak, I. Introduction to smart grid. In Proceedings of the 2016 International Smart Grid Workshop and Certificate Program (ISGWCP), Istanbul, Turkey, 21–25 March 2016; pp. 1–5. [Google Scholar]
- Palensky, P.; Kupzog, F. Smart grids. Annu. Rev. Environ. Resour. 2013, 38, 201–226. [Google Scholar] [CrossRef]
- Gao, J.; Xiao, Y.; Liu, J.; Liang, W.; Chen, C.P. A survey of communication/networking in smart grids. Future Gener. Comput. Syst. 2012, 28, 391–404. [Google Scholar] [CrossRef]
- Ali, A.S. Smart Grids: Opportunities, Developments, and Trends; Springer: Berlin/Heidelberg, Germany, 2013. [Google Scholar]
- Zheng, J.; Gao, D.W.; Lin, L. Smart meters in smart grid: An overview. In Proceedings of the 2013 IEEE Green Technologies Conference (GreenTech), Denver, CO, USA, 4–5 April 2013; pp. 57–64. [Google Scholar]
- Knayer, T.; Kryvinska, N. An analysis of smart meter technologies for efficient energy management in households and organizations. Energy Rep. 2022, 8, 4022–4040. [Google Scholar] [CrossRef]
- Eskandarnia, E.M.; Al-Ammal, H.M. A taxonomy of smart meter analytics: Forecasting, knowledge discovery, and power management. Int. J. Comput. Digit. Syst. 2022, 11, 851–859. [Google Scholar] [CrossRef] [PubMed]
- Berger, S.; Ebeling, F.; Feldhaus, C.; Löschel, A.; Wyss, A.M. What motivates smart meter adoption? Evidence from an experimental advertising campaign in Germany. Energy Res. Soc. Sci. 2022, 85, 102357. [Google Scholar] [CrossRef]
- You, Y. Intelligent System Designs: Data-driven Sensor Calibration & Smart Meter Privacy. Ph.D. Thesis, KTH Royal Institute of Technology, Stockholm, Sweden, 2022. [Google Scholar]
- Salomon, G.; Laroca, R.; Menotti, D. Deep learning for image-based automatic dial meter reading: Dataset and baselines. In Proceedings of the 2020 International Joint Conference on Neural Networks (IJCNN), Glasgow, UK, 19–24 July 2020; pp. 1–8. [Google Scholar]
- Gallo, I.; Zamberletti, A.; Noce, L. Robust angle invariant GAS meter reading. In Proceedings of the 2015 International Conference on Digital Image Computing: Techniques and Applications (DICTA), Adelaide, Australia, 23–25 November 2015; pp. 1–7. [Google Scholar]
- Vanetti, M.; Gallo, I.; Nodari, A. Gas meter reading from real world images using a multi-net system. Pattern Recognit. Lett. 2013, 34, 519–526. [Google Scholar] [CrossRef]
- Laroca, R.; Barroso, V.; Diniz, M.A.; Gonçalves, G.R.; Schwartz, W.R.; Menotti, D. Convolutional neural networks for automatic meter reading. J. Electron. Imaging 2019, 28, 013023. [Google Scholar] [CrossRef]
- Nodari, A.; Gallo, I. A Multi-Neural Network Approach to Image Detection and Segmentation of Gas Meter Counter. In Proceedings of the MVA, Nara, Japan, 13–15 June 2011; pp. 239–242. [Google Scholar]
- Tsai, C.M.; Shou, T.D.; Chen, S.C.; Hsieh, J.W. Use SSD to detect the digital region in electricity meter. In Proceedings of the 2019 International Conference on Machine Learning and Cybernetics (ICMLC), Kobe, Japan, 7–10 July 2019; pp. 1–7. [Google Scholar]
- Liu, W.; Anguelov, D.; Erhan, D.; Szegedy, C.; Reed, S.; Fu, C.Y.; Berg, A.C. Ssd: Single shot multibox detector. In Proceedings of the European Conference on Computer Vision, Amsterdam, The Netherlands, 11–14 October 2016; pp. 21–37. [Google Scholar]
- Yang, F.; Jin, L.; Lai, S.; Gao, X.; Li, Z. Fully convolutional sequence recognition network for water meter number reading. IEEE Access 2019, 7, 11679–11687. [Google Scholar] [CrossRef]
- Gómez, L.; Rusinol, M.; Karatzas, D. Cutting Sayre’s Knot: Reading scene text without segmentation. Application to utility meters. In Proceedings of the 2018 13th IAPR International Workshop on Document Analysis Systems (DAS), Vienna, Austria, 24–27 April 2018; pp. 97–102. [Google Scholar]
- Redmon, J.; Farhadi, A. YOLO9000: Better, faster, stronger. In Proceedings of the IEEE Conference on Computer Vision and Pattern Recognition, Honolulu, HI, USA, 21–26 July 2017; pp. 7263–7271. [Google Scholar]
- Shorten, C.; Khoshgoftaar, T.M. A survey on image data augmentation for deep learning. J. Big Data 2019, 6, 60. [Google Scholar] [CrossRef]
- Redmon, J.; Divvala, S.; Girshick, R.; Farhadi, A. You only look once: Unified, real-time object detection. In Proceedings of the IEEE Conference on Computer Vision and Pattern Recognition, Las Vegas, NV, USA, 27–30 June 2016; pp. 779–788. [Google Scholar]
- Jiang, P.; Ergu, D.; Liu, F.; Cai, Y.; Ma, B. A Review of Yolo algorithm developments. Procedia Comput. Sci. 2022, 199, 1066–1073. [Google Scholar] [CrossRef]
- Sanchez, S.; Romero, H.; Morales, A. A review: Comparison of performance metrics of pretrained models for object detection using the TensorFlow framework. In Proceedings of the IOP Conference Series: Materials Science and Engineering, Ulaanbaatar, Mongolia, 10–13 September 2020; Volume 844, p. 012024. [Google Scholar]
- Sah, S.; Shringi, A.; Ptucha, R.; Burry, A.M.; Loce, R.P. Video redaction: A survey and comparison of enabling technologies. J. Electron. Imaging 2017, 26, 051406. [Google Scholar] [CrossRef]
- Hurtik, P.; Molek, V.; Hula, J.; Vajgl, M.; Vlasanek, P.; Nejezchleba, T. Poly-YOLO: Higher speed, more precise detection and instance segmentation for YOLOv3. Neural Comput. Appl. 2022, 34, 8275–8290. [Google Scholar] [CrossRef]
- Horak, K.; Sablatnig, R. Deep learning concepts and datasets for image recognition: Overview 2019. In Proceedings of the Eleventh International Conference on Digital Image Processing (ICDIP 2019), Guangzhou, China, 10–13 May 2019; Volume 11179, pp. 484–491. [Google Scholar]
- Dosovitskiy, A.; Beyer, L.; Kolesnikov, A.; Weissenborn, D.; Zhai, X.; Unterthiner, T.; Dehghani, M.; Minderer, M.; Heigold, G.; Gelly, S.; et al. An image is worth 16 × 16 words: Transformers for image recognition at scale. arXiv 2020, arXiv:2010.11929. [Google Scholar]


Disclaimer/Publisher’s Note: The statements, opinions and data contained in all publications are solely those of the individual author(s) and contributor(s) and not of MDPI and/or the editor(s). MDPI and/or the editor(s) disclaim responsibility for any injury to people or property resulting from any ideas, methods, instructions or products referred to in the content. |
© 2022 by the authors. Licensee MDPI, Basel, Switzerland. This article is an open access article distributed under the terms and conditions of the Creative Commons Attribution (CC BY) license (https://creativecommons.org/licenses/by/4.0/).
Share and Cite
Martinelli, F.; Mercaldo, F.; Santone, A. Water Meter Reading for Smart Grid Monitoring. Sensors 2023, 23, 75. https://doi.org/10.3390/s23010075
Martinelli F, Mercaldo F, Santone A. Water Meter Reading for Smart Grid Monitoring. Sensors. 2023; 23(1):75. https://doi.org/10.3390/s23010075
Chicago/Turabian StyleMartinelli, Fabio, Francesco Mercaldo, and Antonella Santone. 2023. "Water Meter Reading for Smart Grid Monitoring" Sensors 23, no. 1: 75. https://doi.org/10.3390/s23010075
APA StyleMartinelli, F., Mercaldo, F., & Santone, A. (2023). Water Meter Reading for Smart Grid Monitoring. Sensors, 23(1), 75. https://doi.org/10.3390/s23010075