


Establishing Reliable Research Data Management by Integrating Measurement Devices Utilizing Intelligent Digital Twins


Abstract
1. Introduction
2. Related Work
2.1. Research Data Management
- Findable: Data are described with extensive metadata, which are given a globally unique and persistent identifier and are stored in a searchable resource.
- Accessible: Metadata are retrievable by their individual indicators through a standardized protocol, which is publicly free and universally implementable, as well as enabling an authentication procedure. The metadata must remain accessible even if the data are no longer available.
- Interoperable: (Meta)-data utilize a formal, broadly applicable language and follow FAIR principles; moreover, references exist between (meta)-data.
- Reusable: (Meta)-data are characterized by relevant attributes and released on the basis of clear data usage licenses. The origin of the (meta)-data is clearly referenced. In addition, (meta)-data comply with domain-relevant community standards.
2.2. Digital Twins
- Replication, Representation and Interoperability: The virtual counterpart of a physical entity should be as detailed as possible, but at the same time as less complex as required without violating the fidelity of the replicated device. A representation should not only include the data of a device but also describe the meaning of this data to lay the foundations for autonomous interoperability.
- Interconnectivity, Data Acquisition: All physical devices must be connected bidirectionally via suitable communication standards. The incoming data must be processed in a time-appropriate manner and reflected in the twin. The data forms to be taken into account can be of a descriptive, static or dynamic nature and must be considered accordingly during processing. Processed information from the DT must also be reflected back into the PT.
- Data Storage: All aggregated data must be stored format agnostically immediately. For reusability, it is necessary to store the data with reference and labeling in suitable storage forms. Not only time but also version, as well as change management, are useful options regarding this.
- Synchronization: Whenever possible, the bivalent data connection should be carried out in real-time and under adequate latency conditions. Both twins should replicate the condition of their counterparts if possible.
- Interface and Interaction: In order to enable collaboration and interaction between and with the twins, suitable interfaces are required. On the one hand, it must be possible for data to be exchanged and accessed by machines, and on the other hand, data must be readable and interpretable by humans providing suitable interaction modes.
- Optimization, Analytics, Simulation and Decision-Making: To gain further advantages, additional features should be accessible through the DTs. Thus, real-time analyses and optimizations as well as independent algorithms for data evaluation can be applied to the data basis of the DT. It should be possible to use AI technologies, establish decision making or use far-reaching simulations, for example. The DT is intended to create context awareness and to facilitate collaborative approaches to reliably choreograph the twins.
- Security: Each entity must comply with the current security standards, i.e., authorization, policies, and encryption. Both privacy and integrity must be preserved. Optionally, the DT could monitor the current security through what-if scenarios and initiate countermeasures.
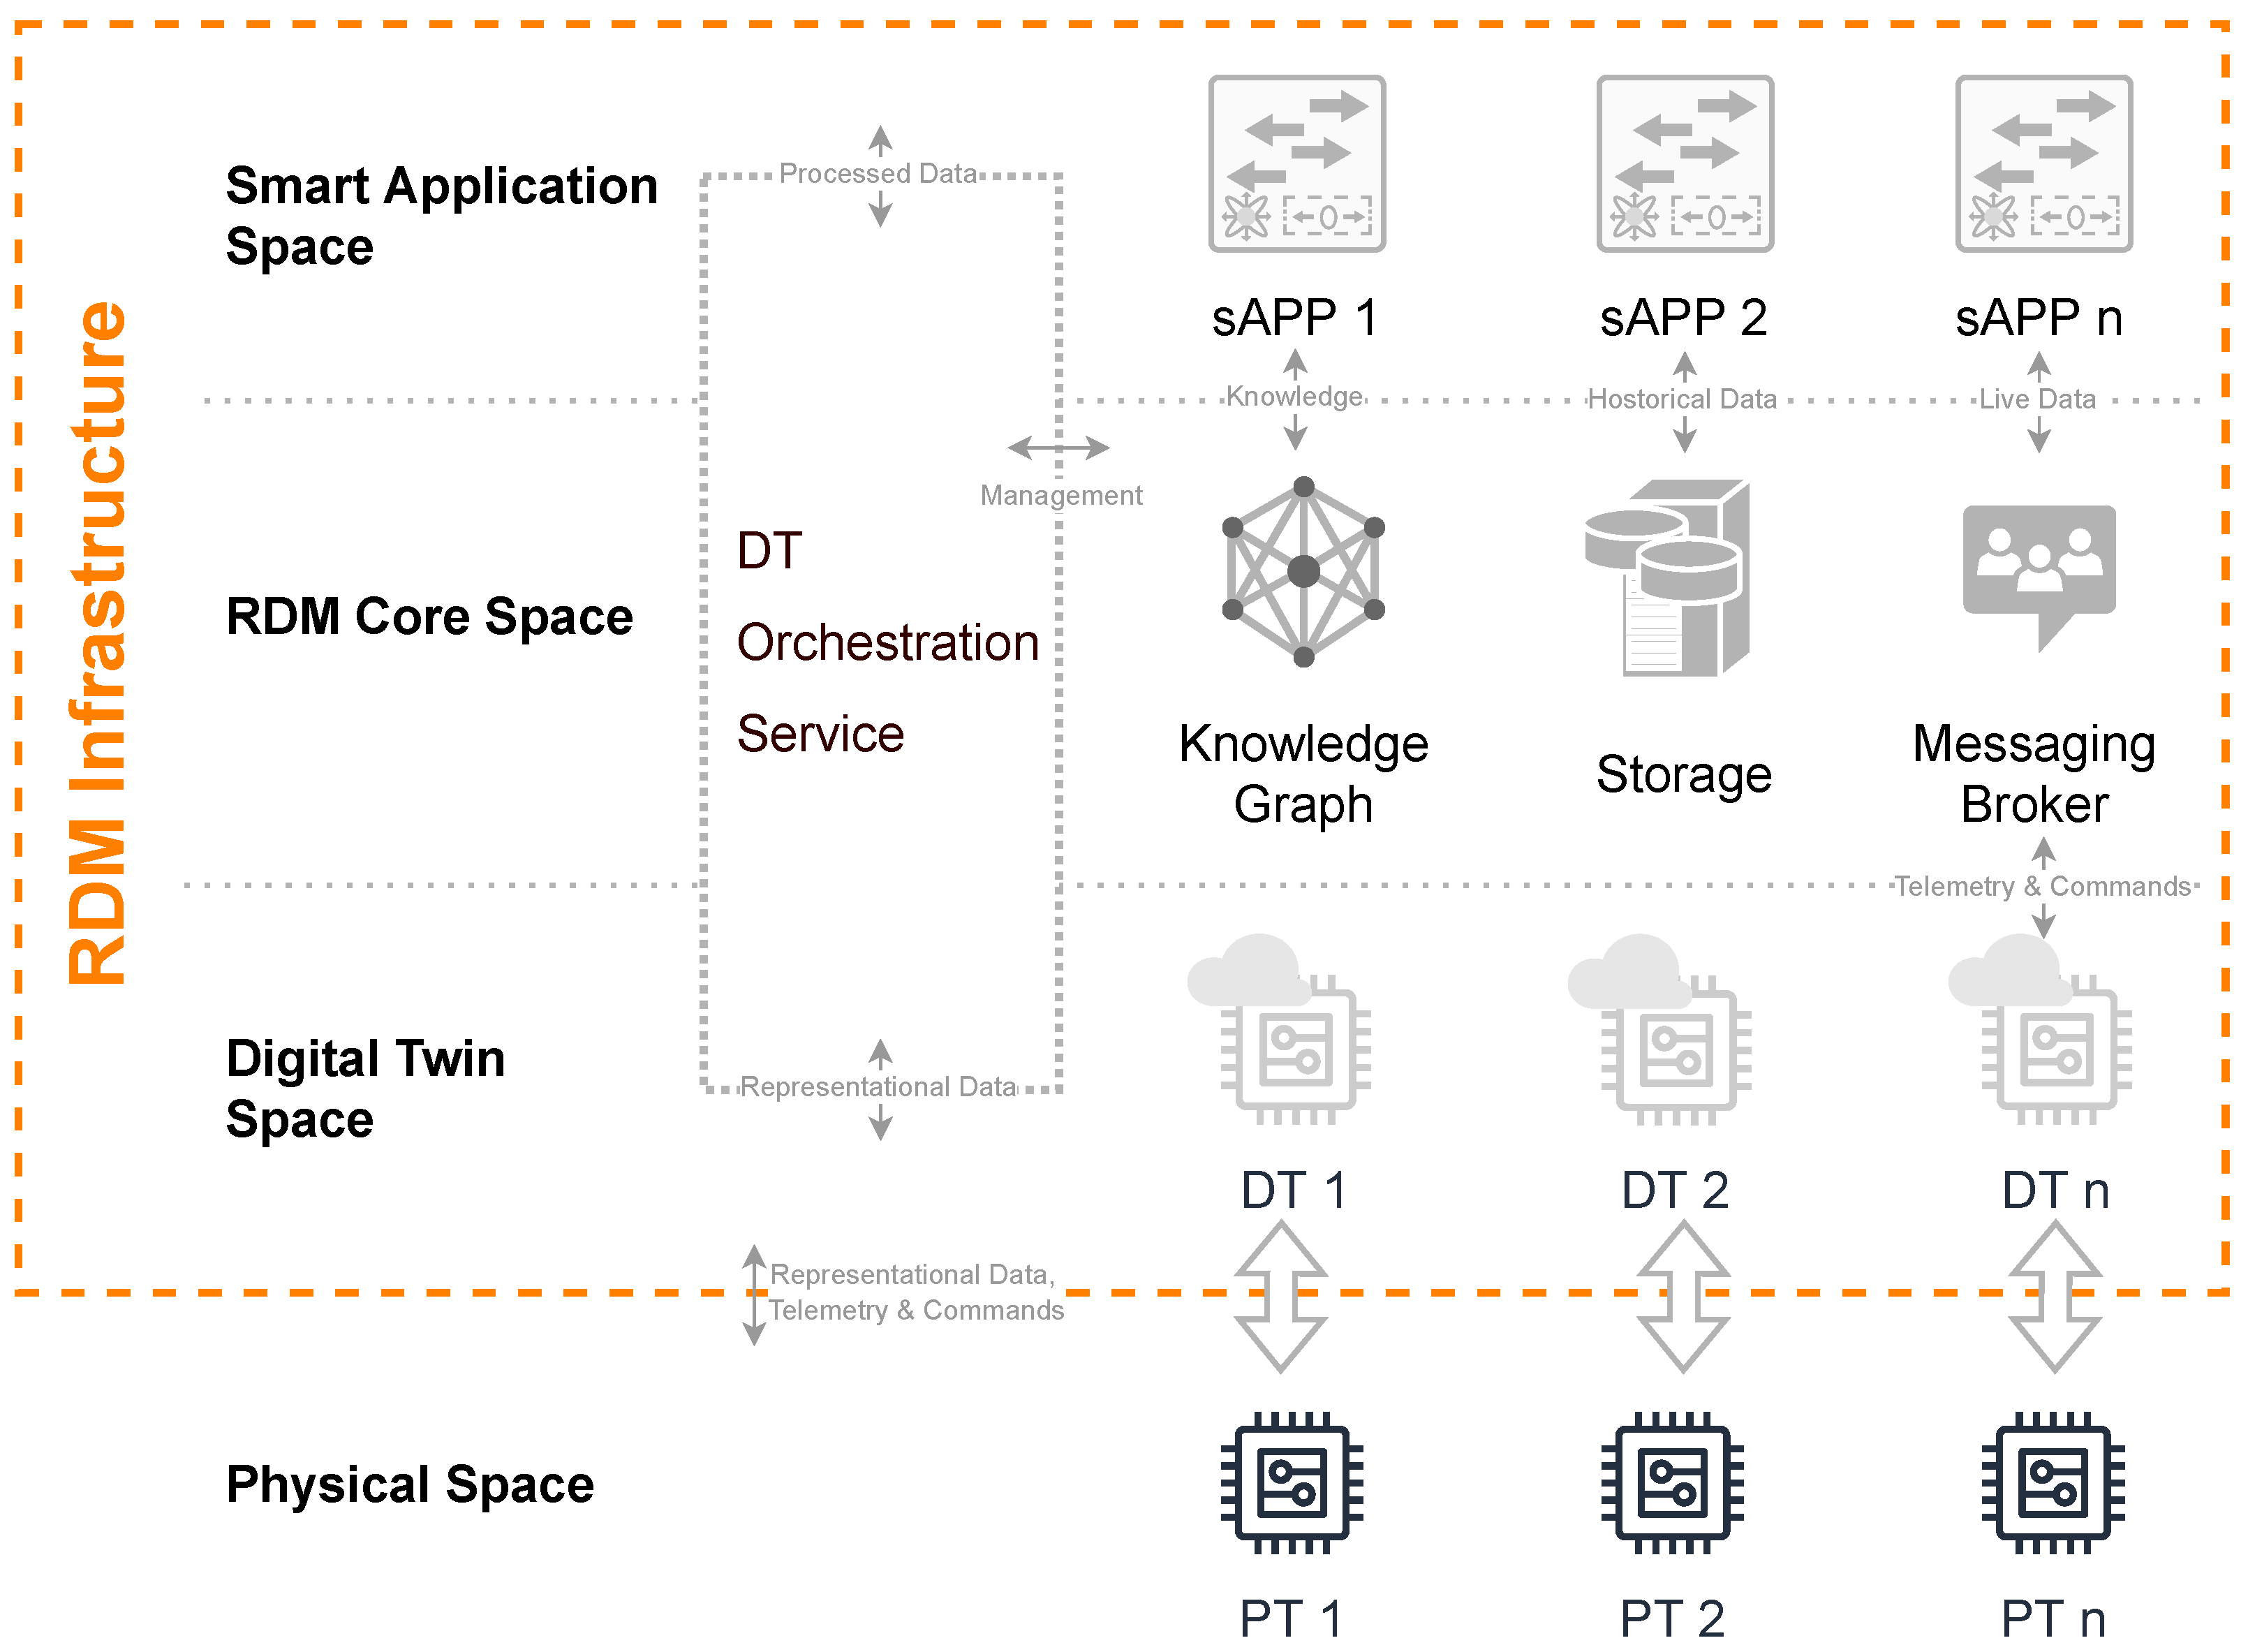
3. Concept Architecture
4. Research Landscape and Use Case Description of a Photometrical Measurement Device
- Use of a Scattered Light Sensor for Monitoring the Dispersed Surface in Crystallization. The specific surface area of the dispersed phase in suspensions, emulsions, bubble columns, and aerosols plays a decisive role in the increment of heat and mass transfer processes. This has a direct effect on the space-time yield in large-scale chemical/process engineering production plants. An easy-to-install optical backscatter sensor outputs the dispersed surface area as a direct primary signal under certain boundary conditions. The sensor works even in highly concentrated suspensions and emulsions, where conventional nephelometry already fails. Trends and limitations found so far for the sensor, which can be used in-line in batch and continuously operated crystallizers, even in harsh production environments and in potentially explosive zones. The specific dispersed surface is directly detected as the primary measurand [41].
- Development and Application of Optical Sensors and Measurement Devices for the Detection of Deposits During Reaction Fouling. In many chemical/pharmaceutical processes, the technically viable efficiencies and throughputs have not been achieved yet because of the reduction in heat transfer (e.g., in heat transfer units, reactors, etc.) due to the formation of wall deposits. Considerable amounts of energy can be saved by reducing or entirely preventing this problematic area. Therefore, a measurement device and its optical and electronic parts were developed for the detection and measurement of deposits in polymerization reactors, simultaneously aiming the in-line monitoring. The design strategy was carried out systematically via theoretical calculations-such as optical ray tracing and photon flux analysis-via test designs, laboratory investigations, and then industrial use. The developed sensors are based on fiber-optic technology and thus can be integrated into the smallest and most complex apparatus, even in explosion-hazardous areas. Critical product and process states in the reactant are detected at an early stage by combining several multi-spectral backscattering technologies. Thus, the formation of deposits can be prevented by changing process parameters [42].
- Photometric Inline Monitoring of the Pigment Concentration of Highly Filled Coatings. Inline monitoring of particle concentration in highly filled dispersions and paint systems using fiber optic backscatter sensors. Due to the miniaturization of the distance between emitter and receiver fiber to <600 µm, the transmitted light can also penetrate high dispersion phase fractions of up to 60%. Due to the measurement setup, both transmission and scattering influences are found in the resulting signal. In this setup, the photometer is configured with detectors and light sources for the red wavelength range (660 nm). The measurement interval of 128 ms is sufficiently small to allow very close monitoring of the measured values [43].
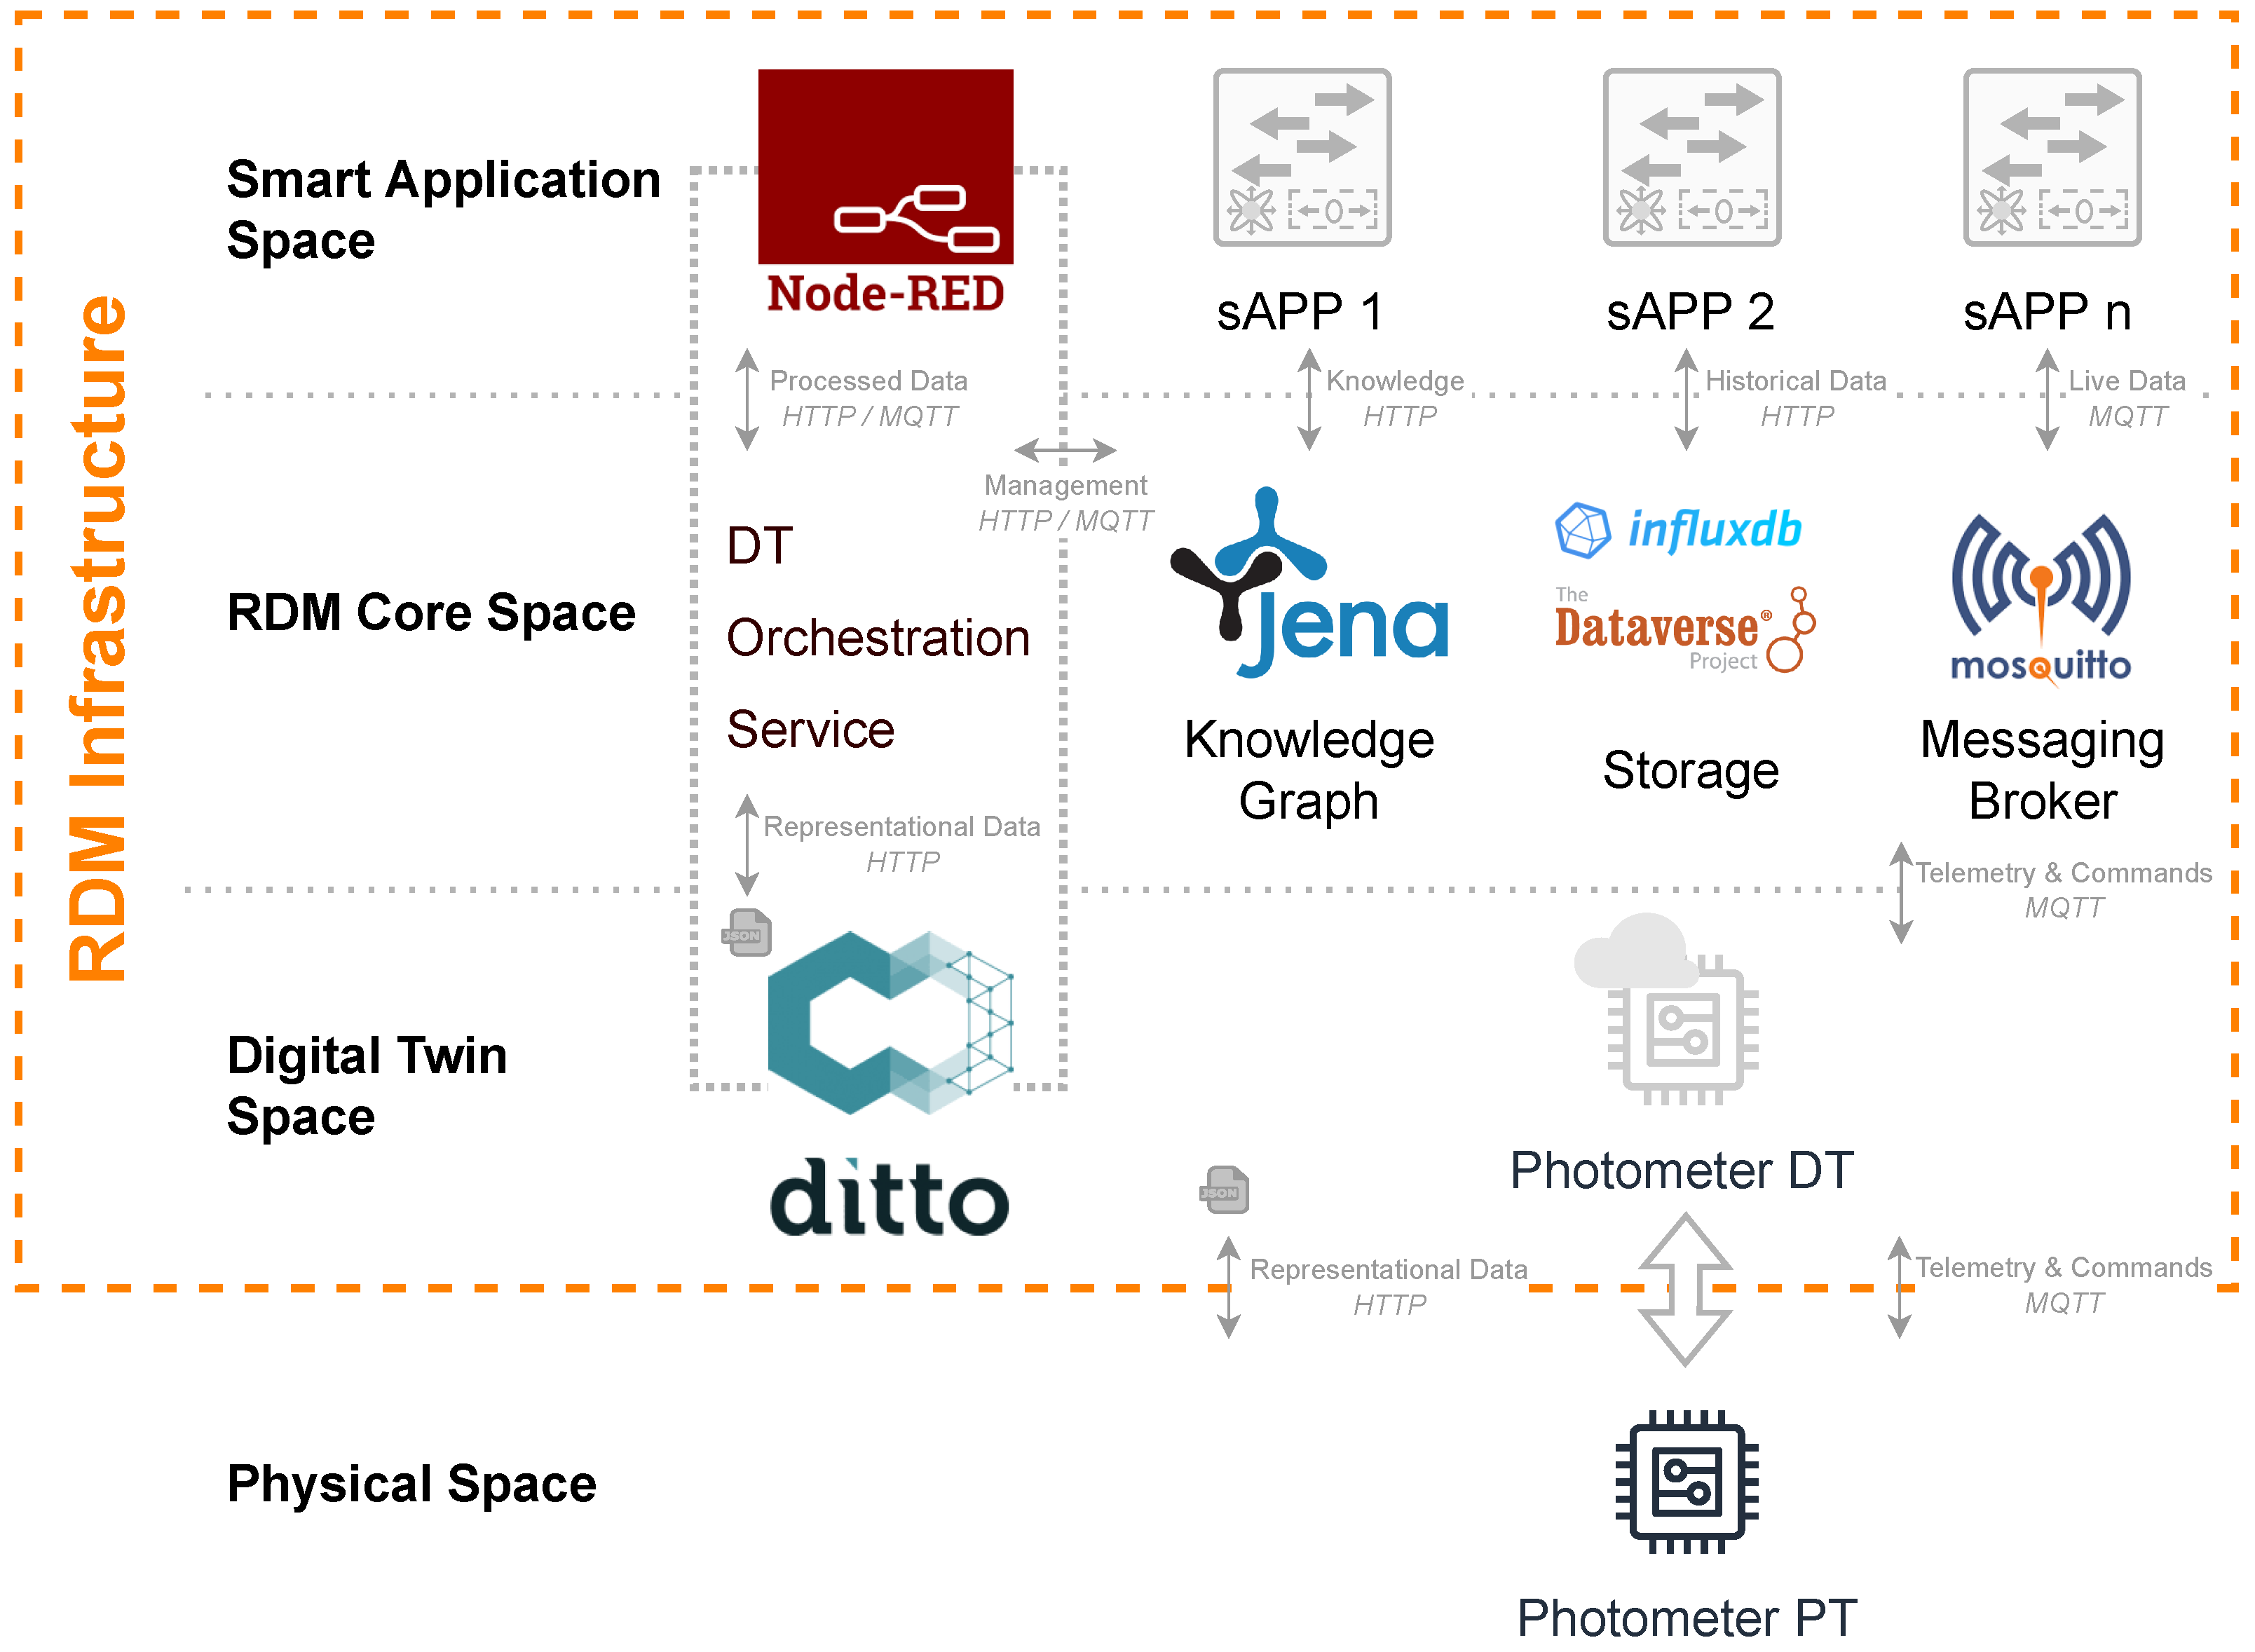
5. Implementation
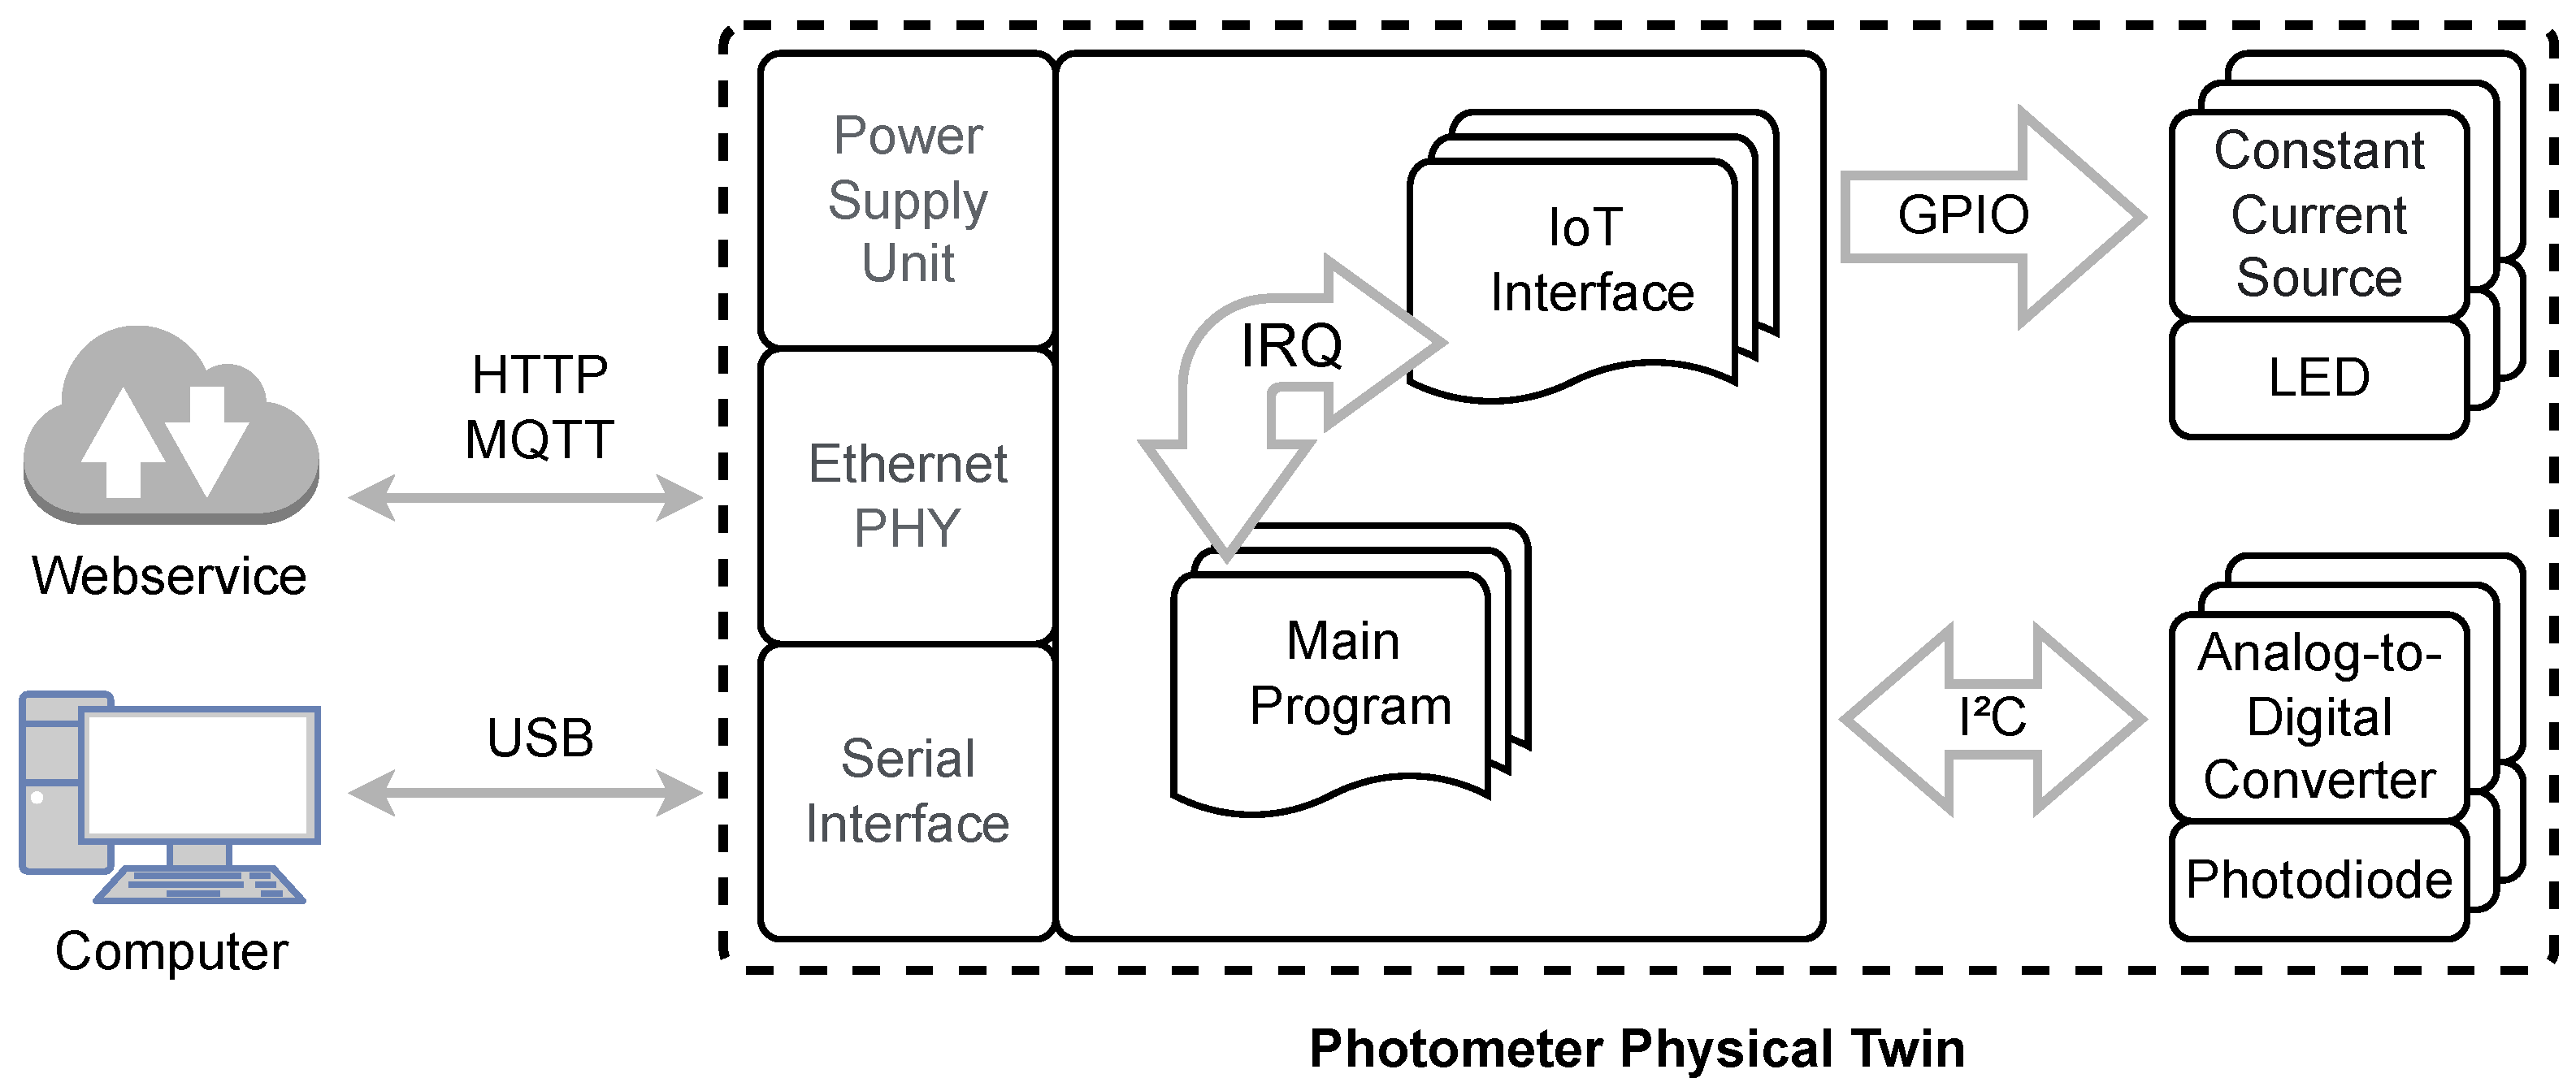
5.1. Physical Space
5.2. Digital Twin Space
- Connectivity Service: Ensuring friction-less communication between physical devices, their virtual counterparts, and data consuming back end applications the Connectivity Service provides a direct interface for various protocols and communication standards such as HTTP, Websockets, MQTT or Advanced Message Queuing Protocol (AMQP). A specially developed, unified, JSON-based Ditto Protocol as payload of messages of the listed communication standards opens up numerous interaction possibilities. For example, messages can be also mapped via scripts for preprocessing and after-processing as well as structuring. Furthermore, by using the Ditto Protocol the entire Ditto instance can be managed, thereby a complete interface is established to interact efficiently with the DTs and their physical counterparts.
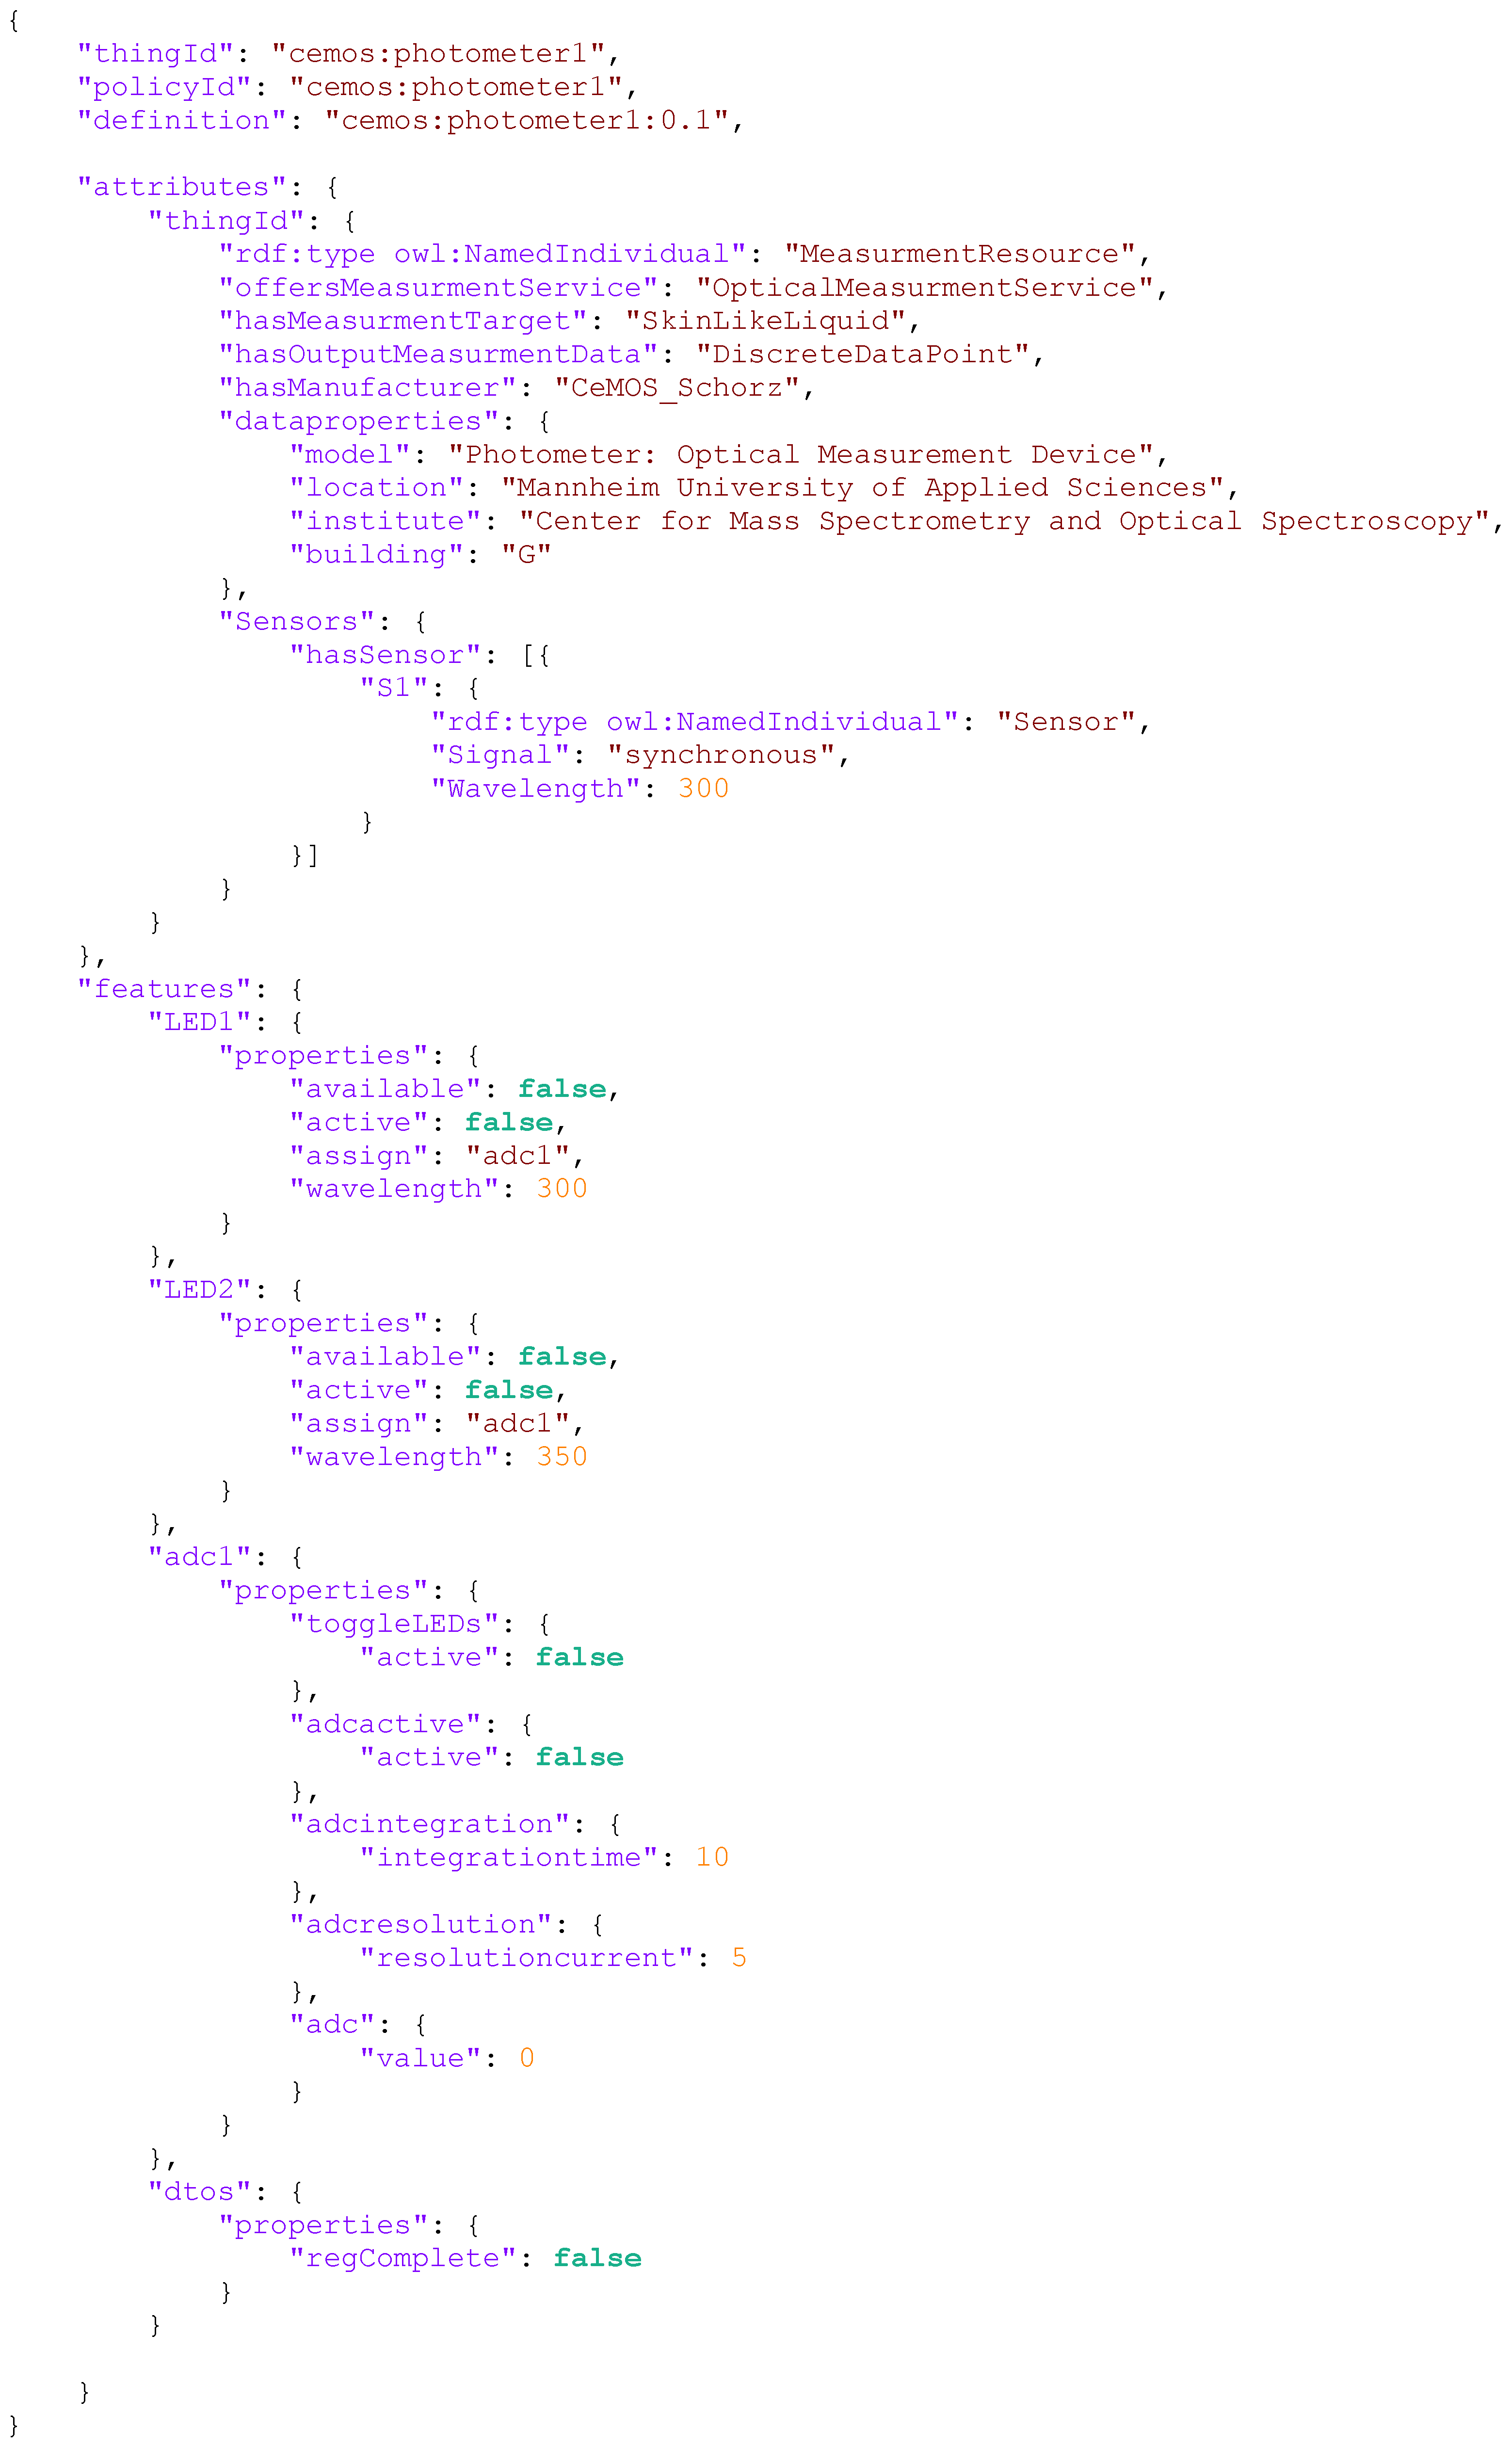
- Things Service: The Things Service contains the actual structure and telemetry representation of the PTs. This abstract representation consists of a simple JSON file. While the first part of the JSON includes the static describing attributes of a DT, such as an unique identifier, the assigned policy, or other e.g., semantically describing properties, the second part contains the dynamic features to which all telemetry data belong. These mirror the constantly changing status of the PTs.
- Policies Service: Individual permissions for access and management of the twins, preserving privacy and integrity, are managed by the policy microservice. In order to grant finely graded read and write permissions to certain subjects, Eclipse Ditto offers the policy concept that can be easily modified via specific Ditto Protocol communication patterns. In addition to extensible certificate-based security mechanisms which Eclipse Ditto naively offers, this setup forms the foundation for the fulfilment of modern security standards.
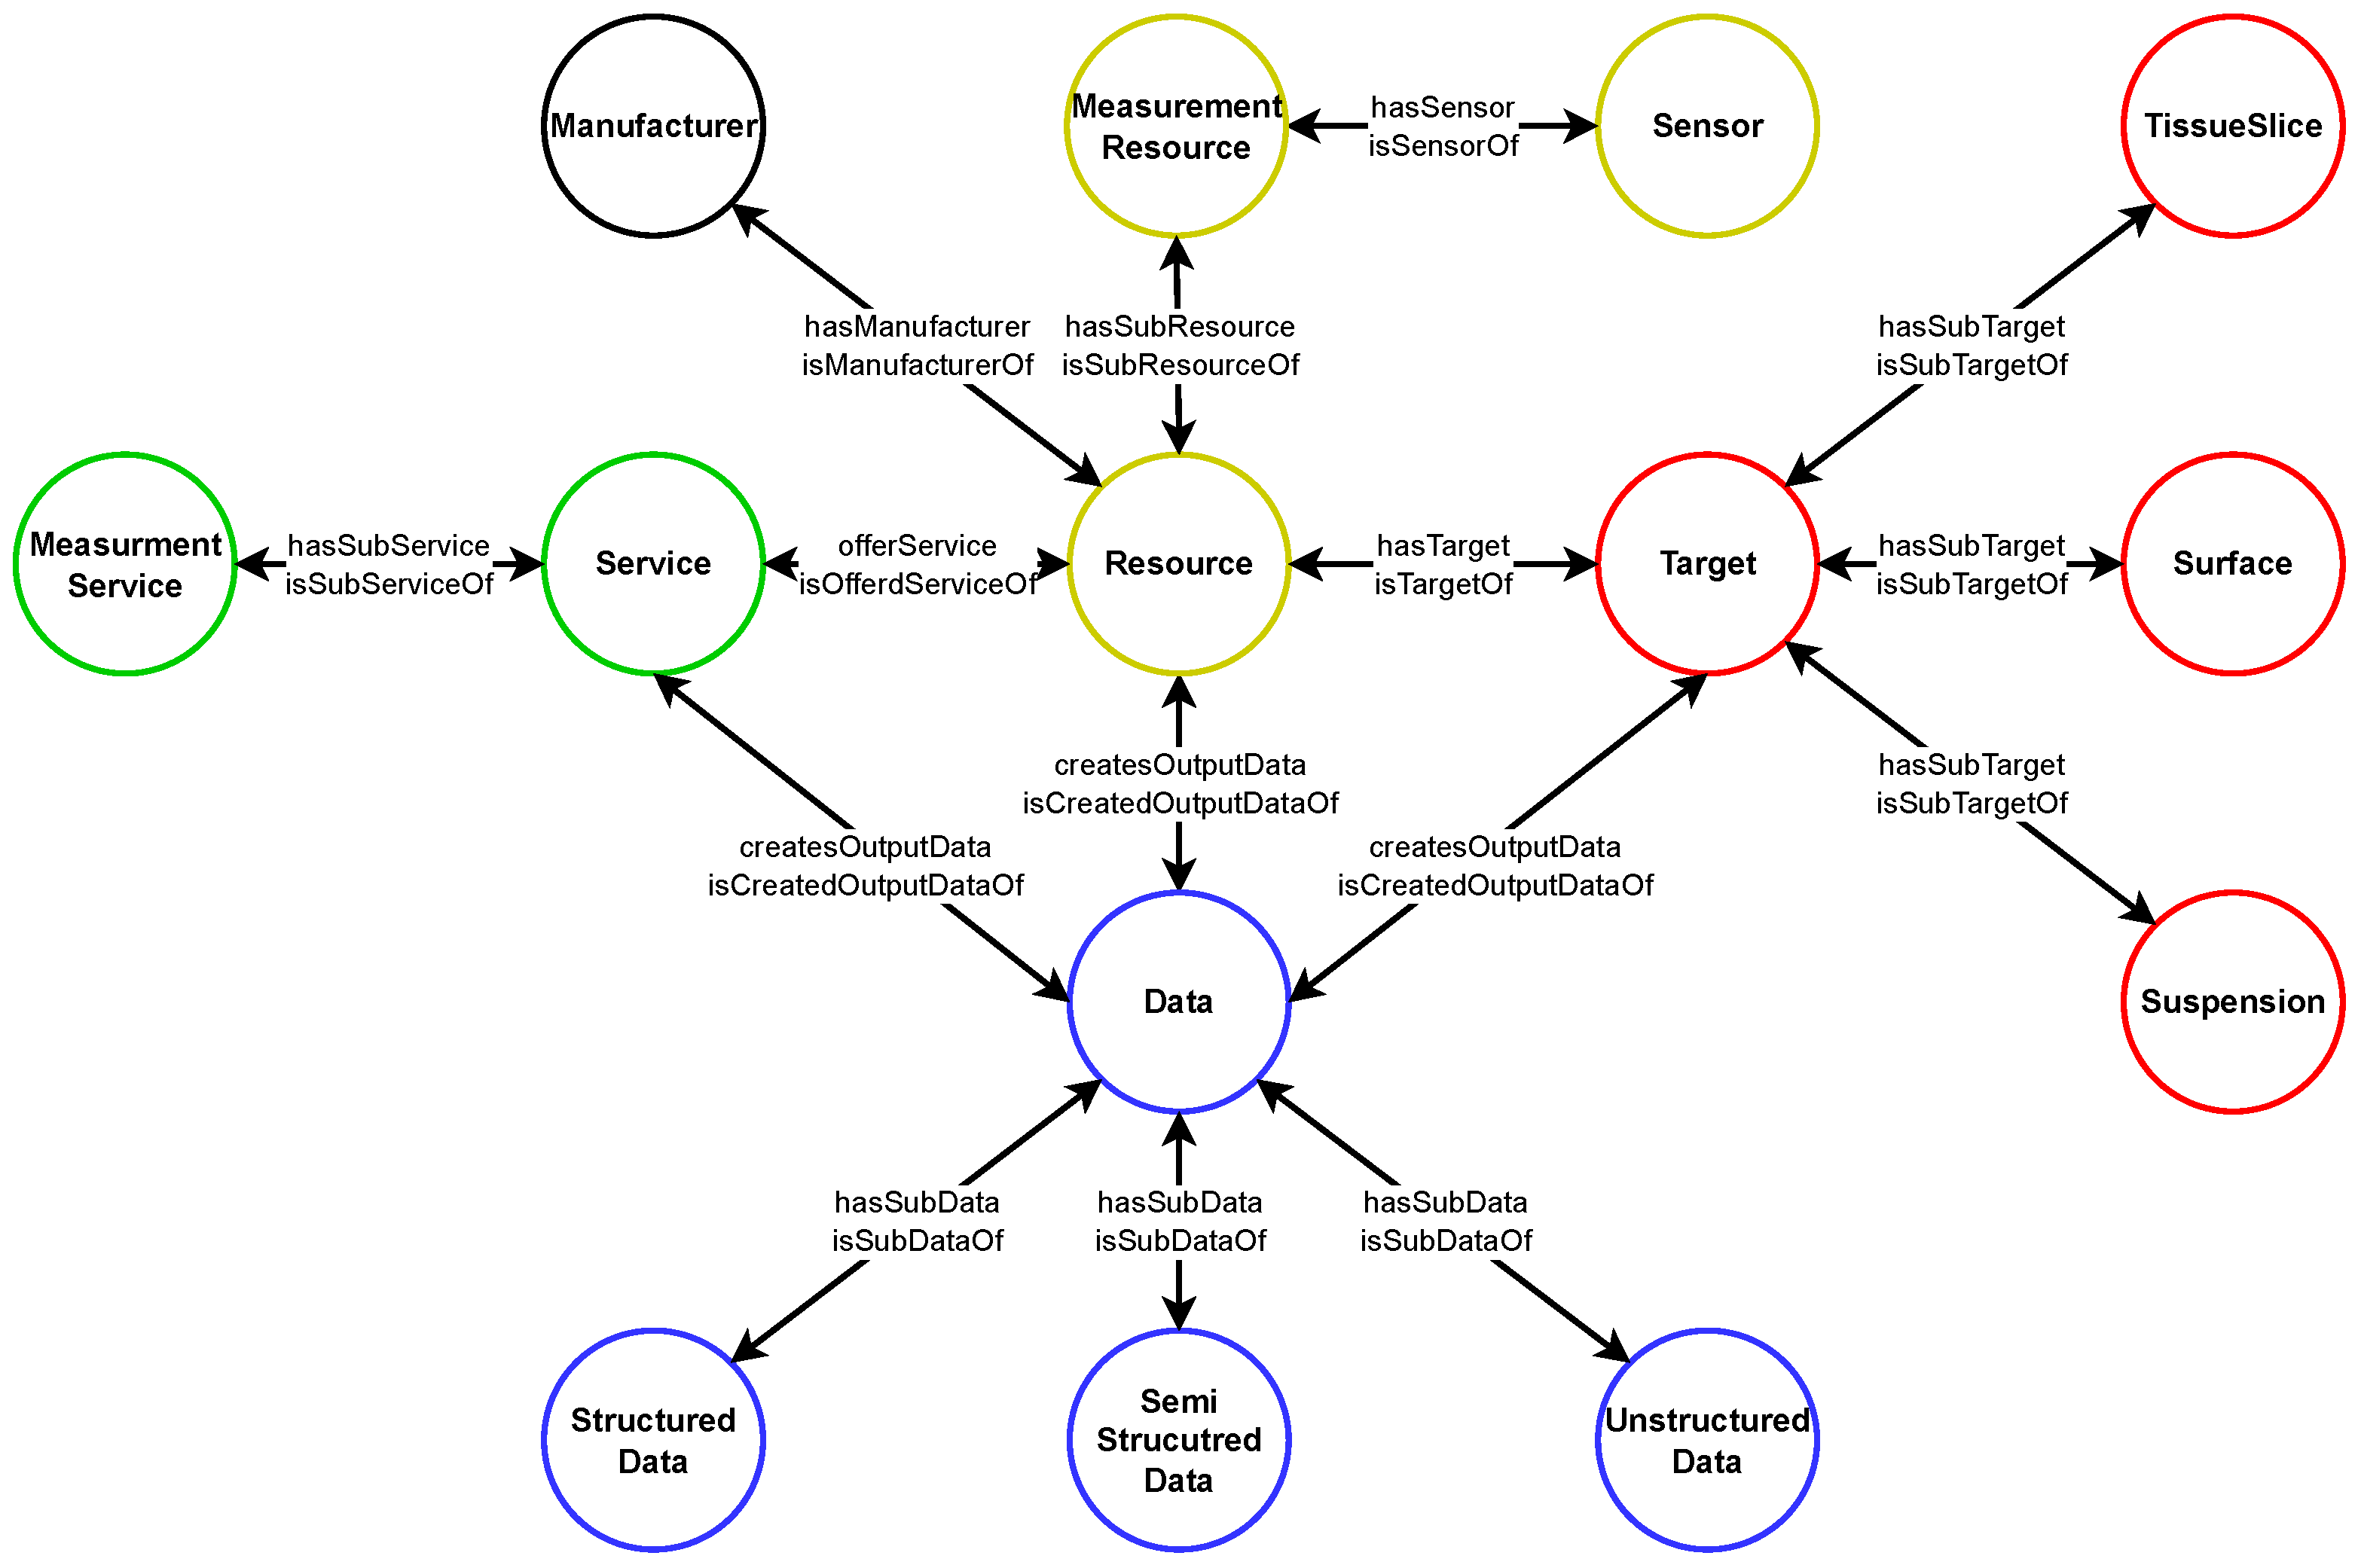
5.3. RDM Core Space
5.4. Smart Application Space
6. Proof of Concept and Evaluation
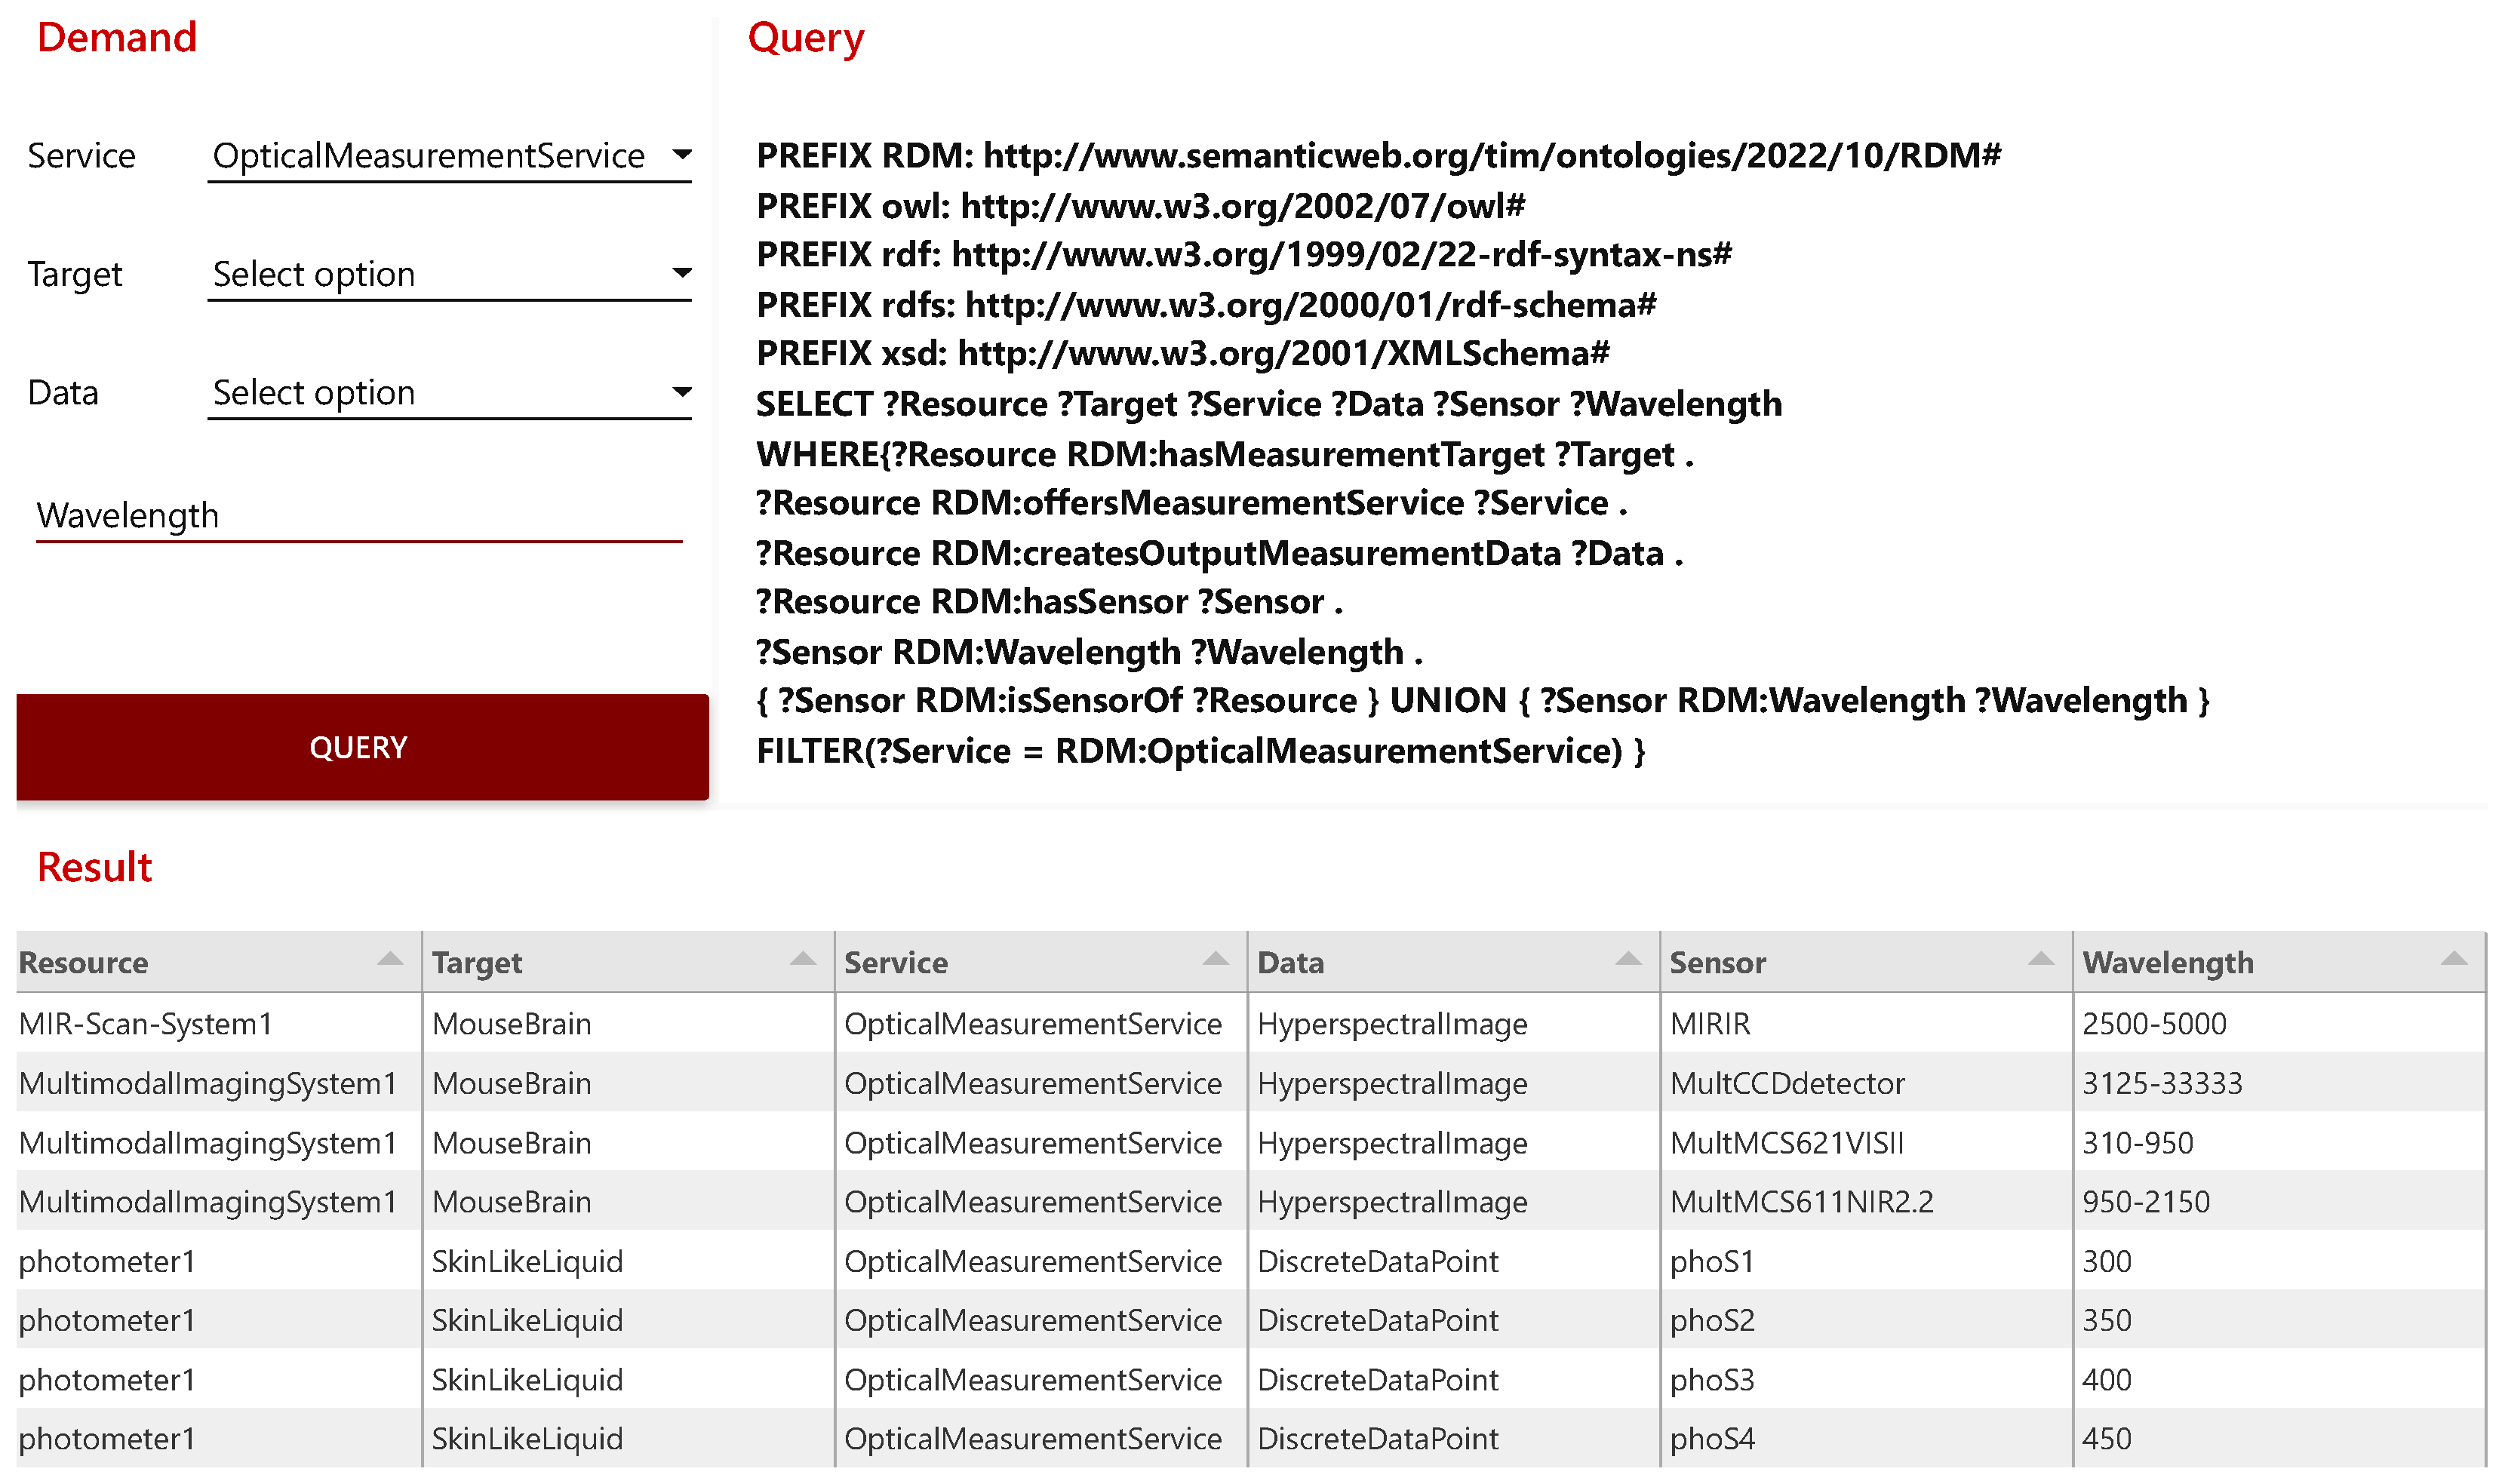
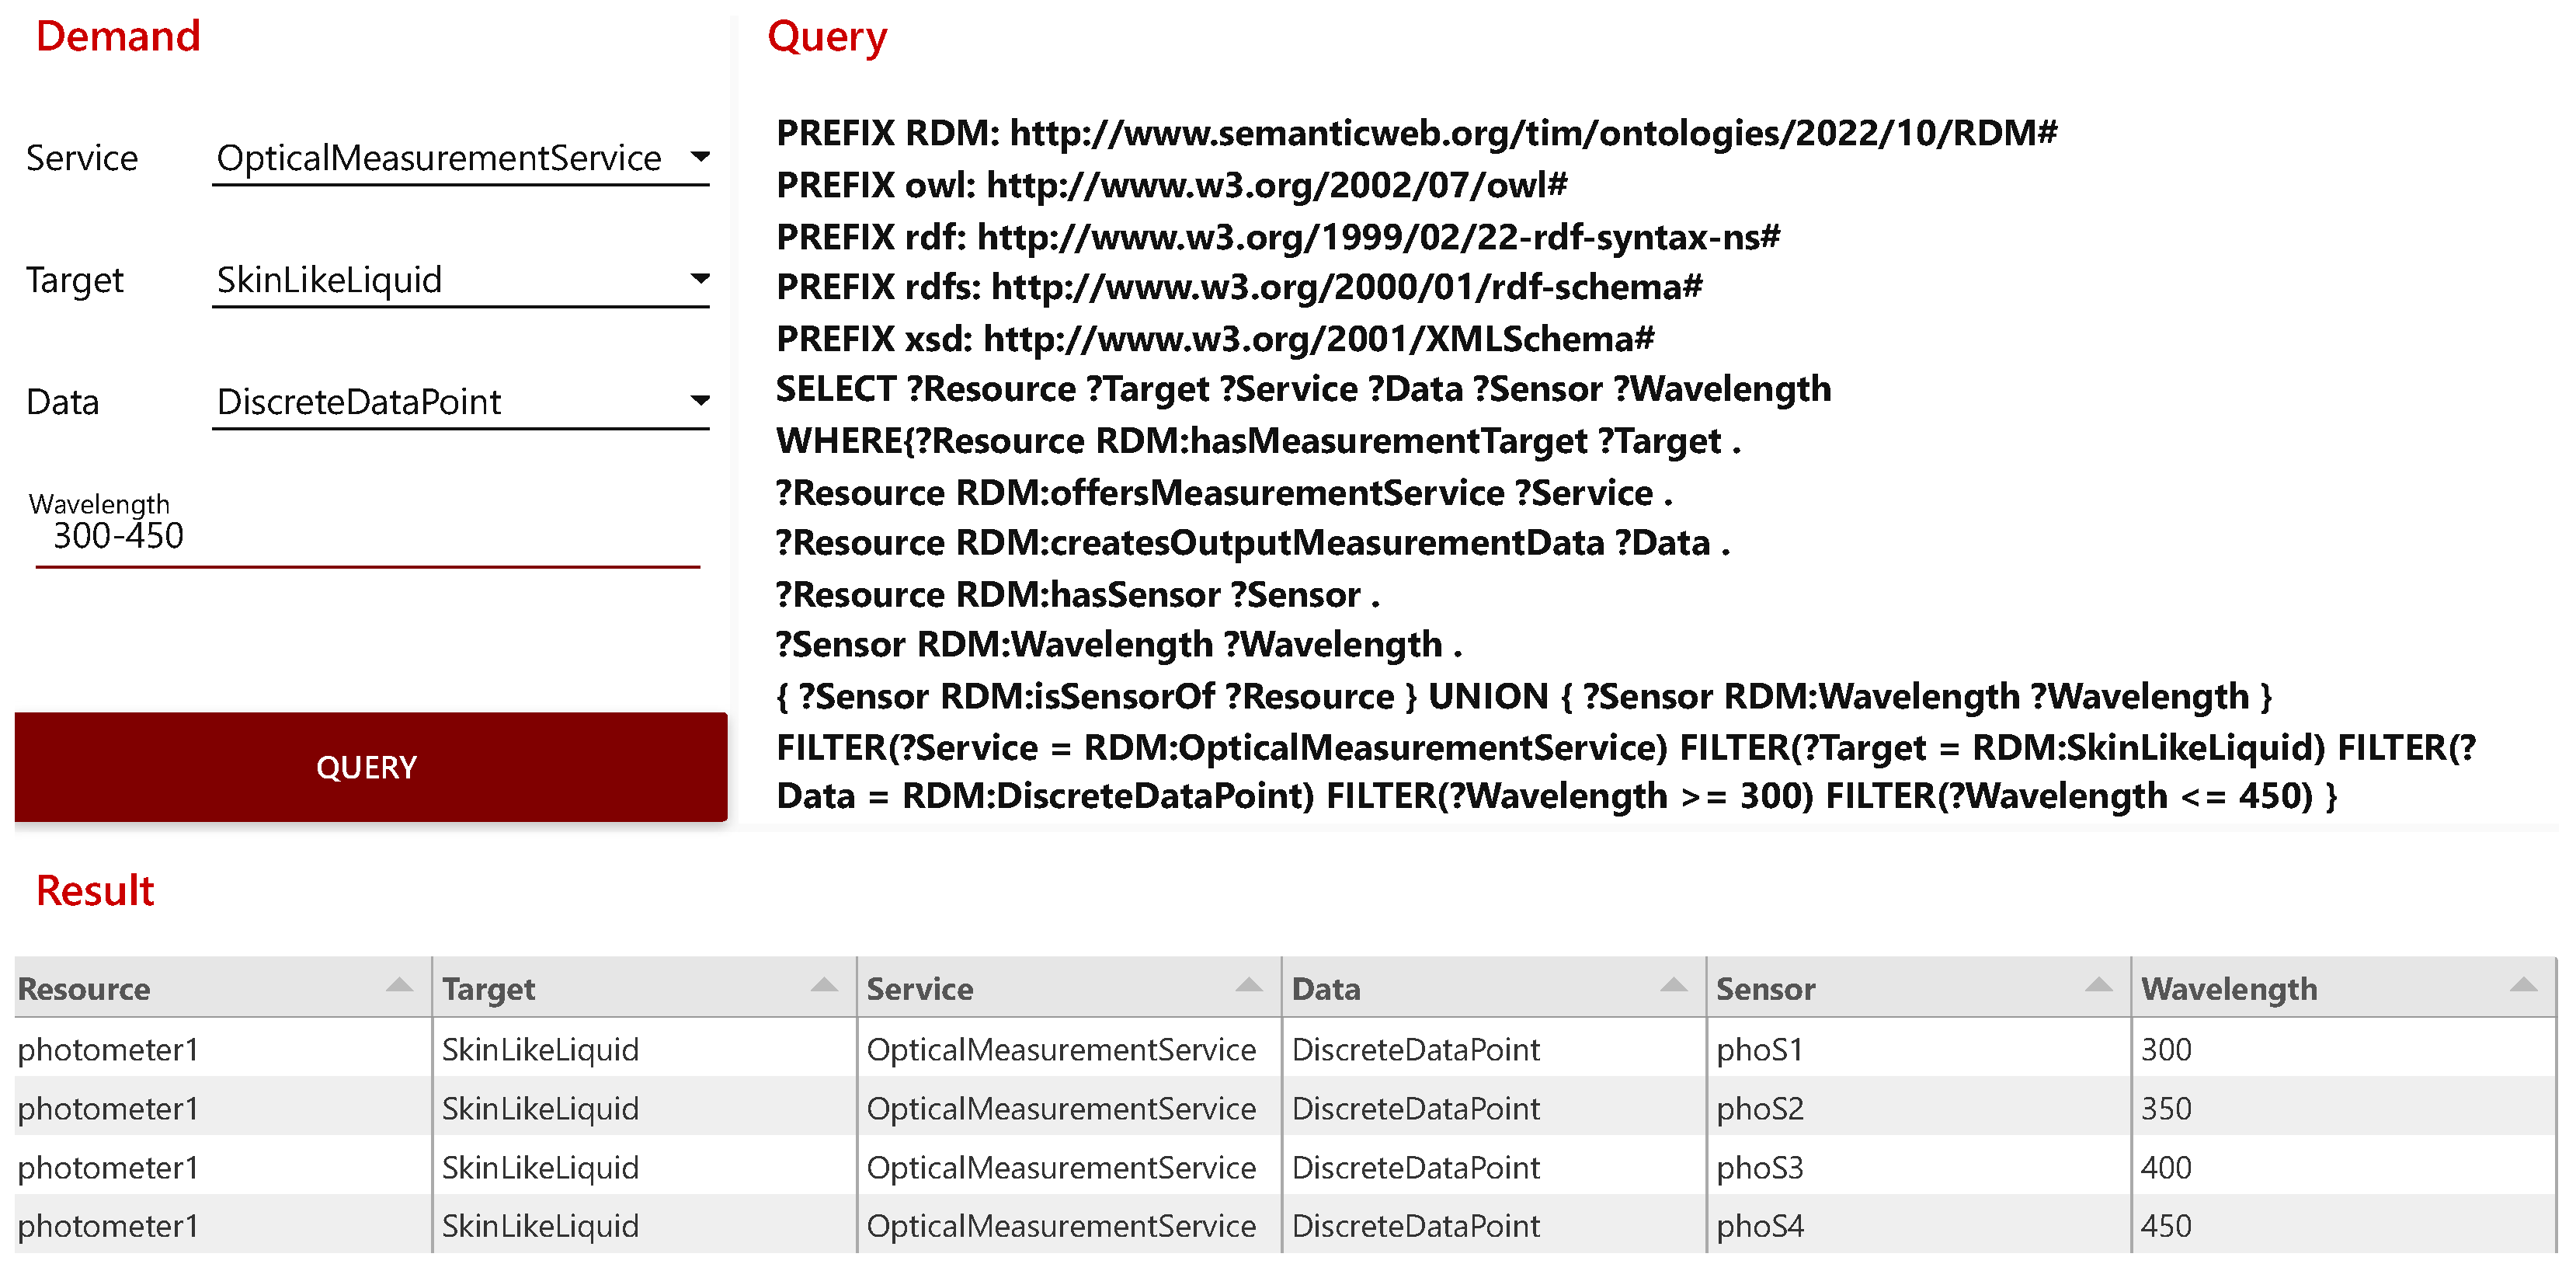
6.1. Knowledge-Based Recommendation of Measuring Devices
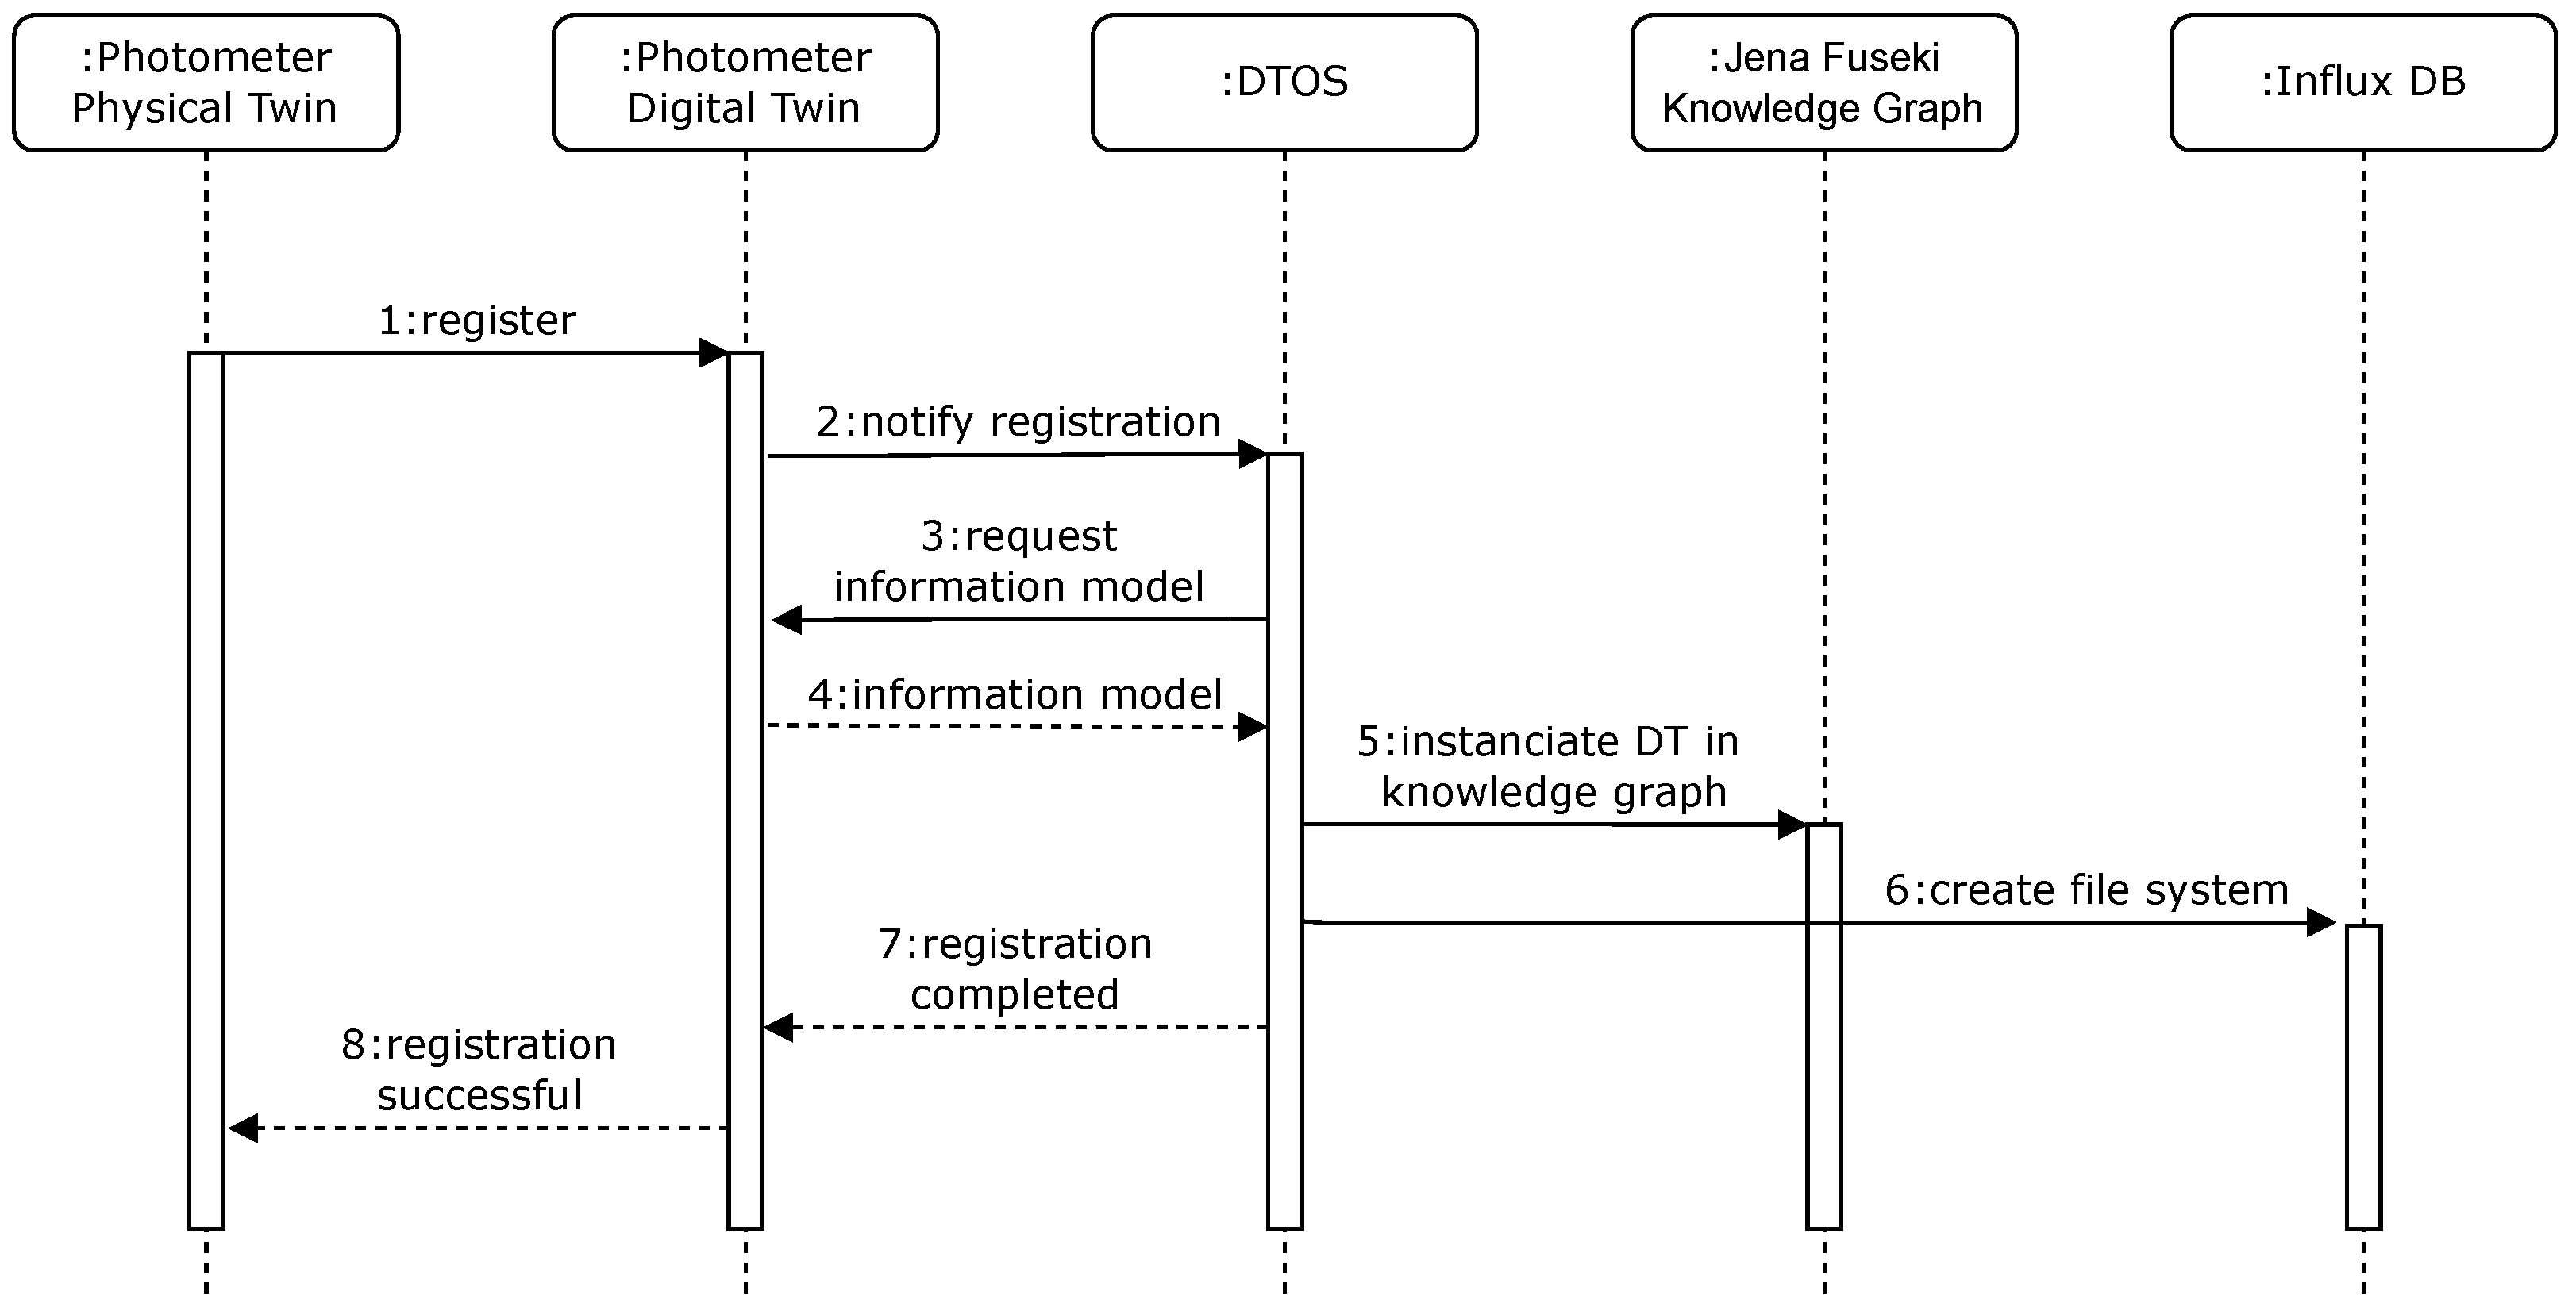
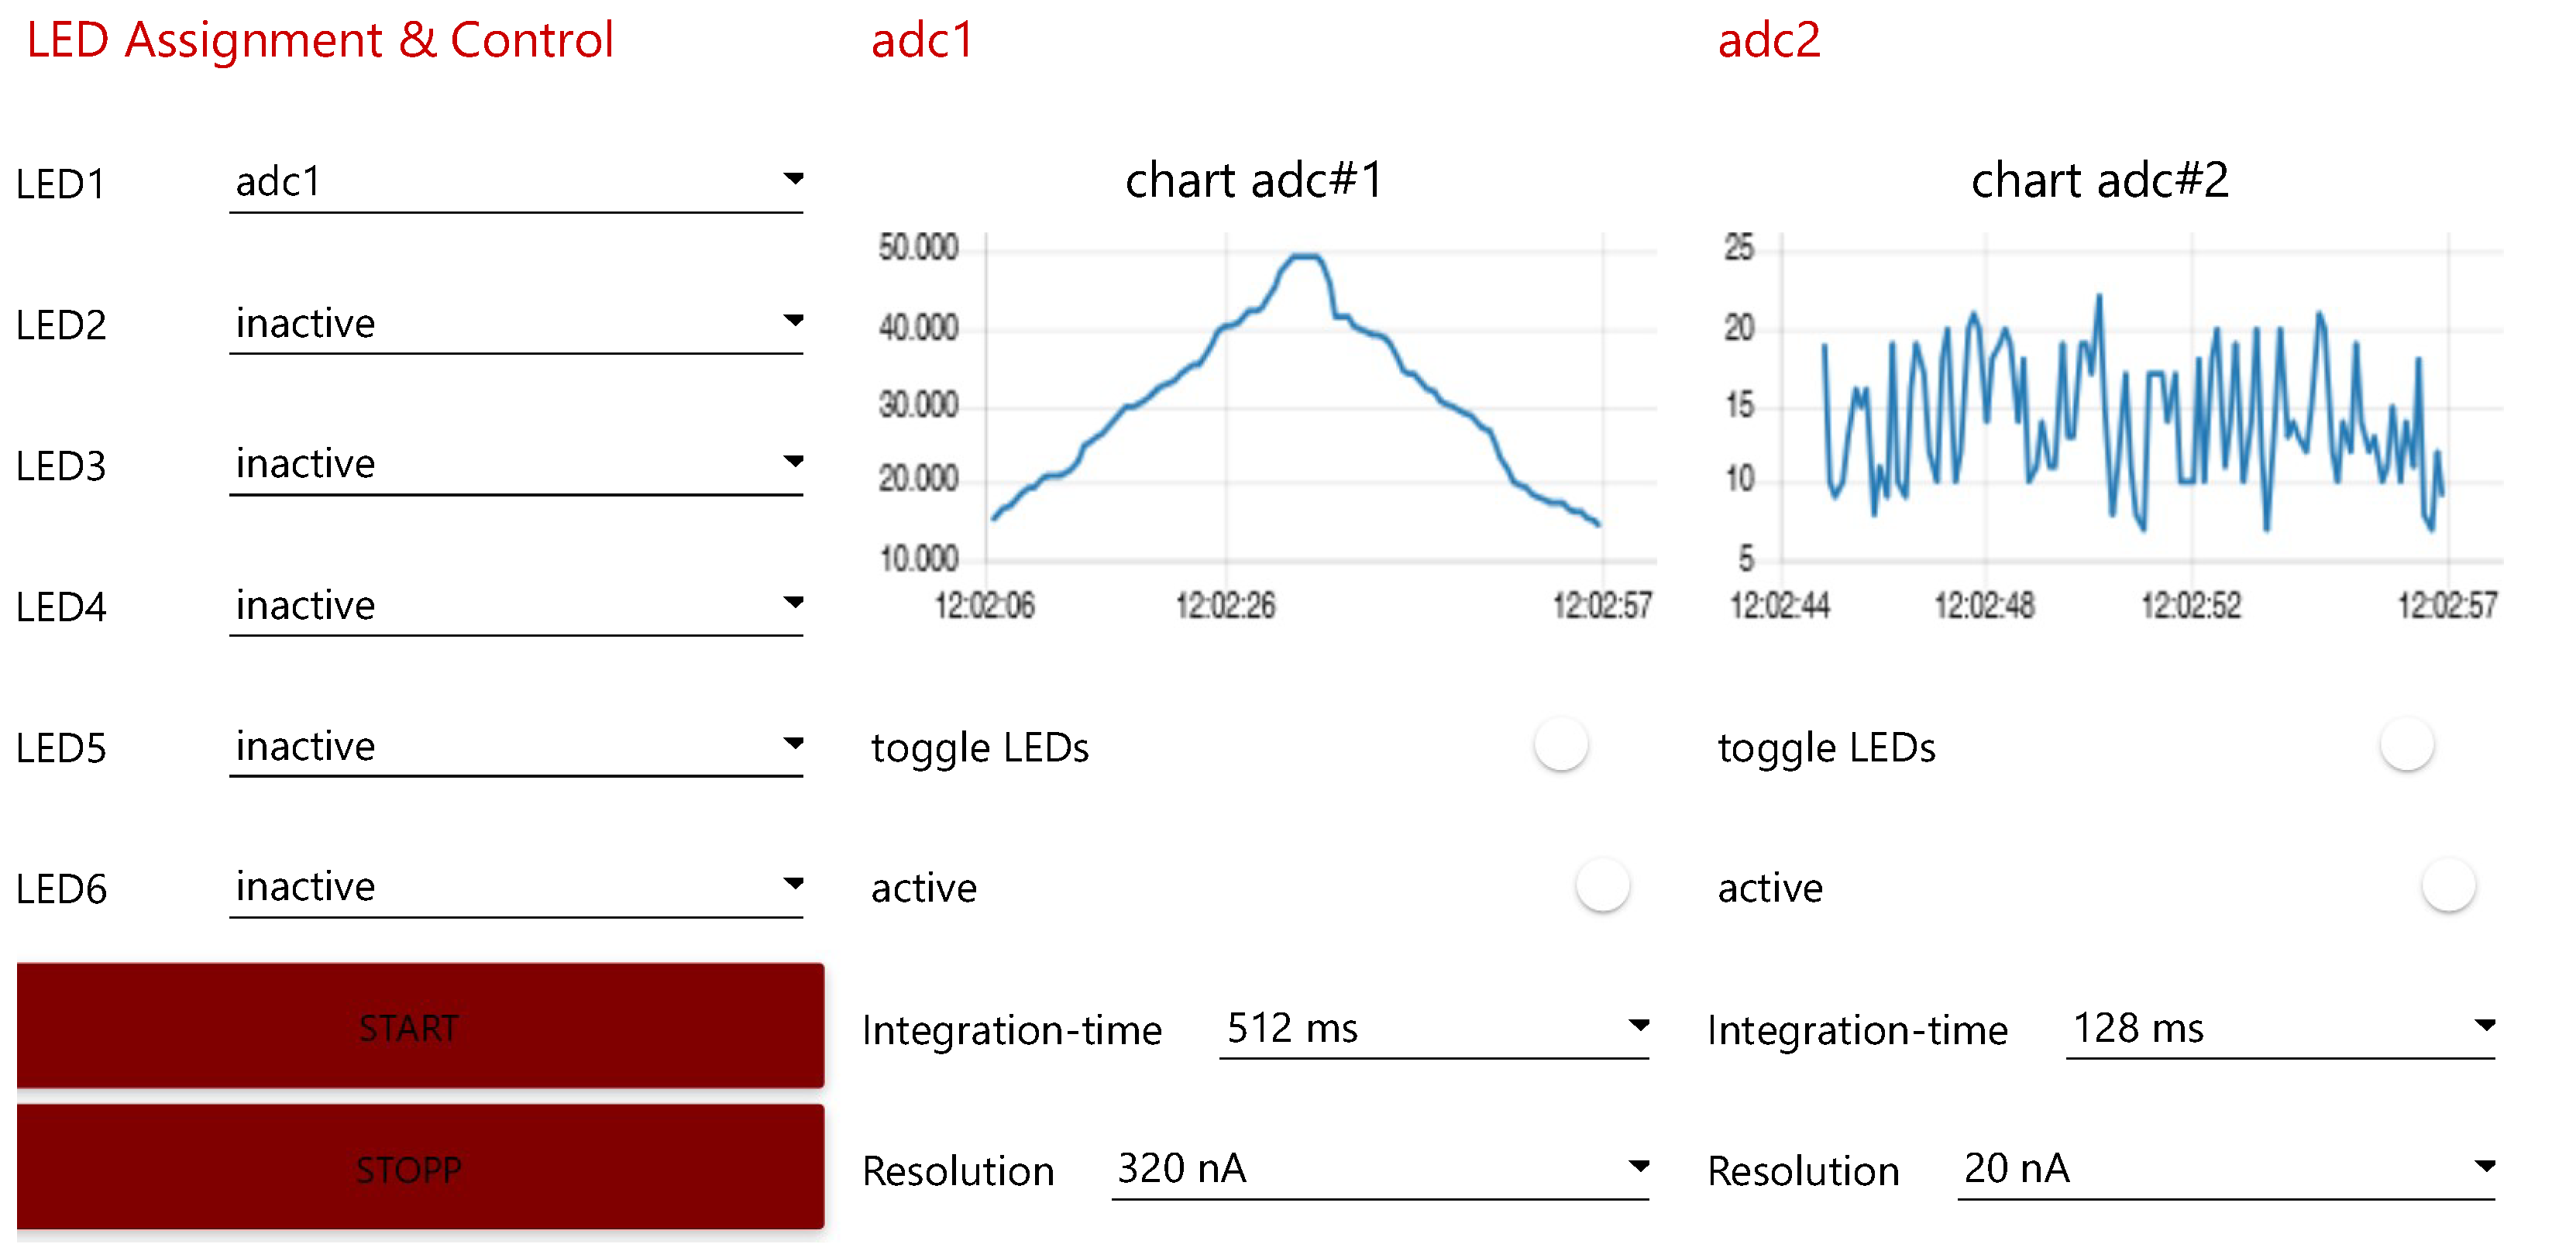
6.2. Interfacing the Digital Twin of a Photometrical Measurement Device
7. Discussion
- In particular, R-DT1: Replication, Representation and Interoperability meets perfectly with R-RDM1: Findable, R-RDM3: Interoperable and R-RDM4: Reusable. Every PT is precisely described as DT within the Digital Twin Space facilitated by Eclipse Ditto and its JSON-based twin representation examined by the exemplary Photometer implementation. Herein embedded are all necessary structural and semantic information, which are further consumed by the DTOS which instantiates this information into Apache Jena Fuseki’s knowledge graph and thus establishing the pillar of later interaction and querying of all metadata within the RDM Core Space. To do so, the twins and their knowledge representation are unambiguously connected with each other.
- R-DT2: Interconnectivity, Data Acquisition fits well with R-RDM2: Accessible. The DTs settled within Eclipse Ditto are connected bidirectionally via various standard IoT interfaces (e.g., MQTT, HTTP, etc.) to their physical pendants. The different types of the DT’s data including its metadata are all covered by the dynamically updated JSON representation.
- R-DT3: Data Storage can be aligned with R-RDM1: Findable, R-RDM2: Accessible, R-RDM3: Interoperable and R-RDM4: Reusable. All types of data are managed, homogeneously stored, and labeled by the DTOS within both applied storage approaches. While InfluxDB is serving a time-series technique, the Dataverse offers a repository-based approach. The labeling relates to the metadata managed by the DTOS and the instantiated individuals within Apache Jena Fuseki’s knowledge graph. The data access can be achieved by calling DTOS API or in a two-staged manner by querying the knowledge graph and afterward pulling the data from the resulting storage locations.
- R-DT4: Synchronization could be satisfied in the demo implementation by using MQTT realized by Eclipse Mosquitto for the connection between the twins. Every change of state actualizes the DT and superordinated components or vice versa the PT.
- R-DT5: Interface and Interaction meets with R-RDM2: Accessible and R-RDM3: Interoperable. As well Eclipse Ditto as the entire RDM Core Space components offer open APIs to interact and request data. Even Node RED located in the Smart Application Space embodies basic GUI and interaction schemes of the DTs as a demonstrative implementation.
- R-DT6: Optimization, Analytics, Simulation and Decision-Making addresses several value-adding features on top of DTs in accordance with every FAIR principle. The Smart Application Space is intended to be the habitat of these value-adding features and applications which is founded on the subordinated three spaces. So far just Node-RED represents one demonstrative approach to highlight potential future functionalities. With the introduced RDM infrastructure in place, there are no restrictions and obstacles in the potential magnitude of later developable smart applications or tools.
- The last requirement R-DT6: Security is suitable regarding R-RDM2: Accessible. Eclipse Ditto supports state-of-the-art security standards including encryption, policy, and tenant-based DT management to gain proper access to required entities.
8. Conclusions and Future Work
Author Contributions
Funding
Institutional Review Board Statement
Informed Consent Statement
Data Availability Statement
Acknowledgments
Conflicts of Interest
Appendix A

References
- Raptis, T.P.; Passarella, A.; Conti, M. Data Management in Industry 4.0: State of the Art and Open Challenges. IEEE Access 2019, 7, 97052–97093. [Google Scholar] [CrossRef]
- Jones, E.; Kalantery, N.; Glover, B. Research 4.0: Interim Report. 2019. Available online: https://apo.org.au/node/262636 (accessed on 6 December 2022).
- Wilkinson, M.D.; Dumontier, M.; Aalbersberg, I.J.; Appleton, G.; Axton, M.; Baak, A.; Blomberg, N.; Boiten, J.W.; da Silva Santos, L.B.; Bourne, P.E.; et al. The FAIR Guiding Principles for scientific data management and stewardship. Sci. Data 2016, 3, 160018. [Google Scholar] [CrossRef] [PubMed]
- Mons, B. Data Stewardship for Open Science: Implementing FAIR Principles; Chapman and Hall/CRC: New York, NY, USA, 2018. [Google Scholar] [CrossRef]
- Diepenbroek, M.; Glöckner, F.O.; Grobe, P.; Güntsch, A.; Huber, R.; König-Ries, B.; Kostadinov, I.; Nieschulze, J.; Seeger, B.; Tolksdorf, R.; et al. Towards an integrated biodiversity and ecological research data management and archiving platform: The German federation for the curation of biological data (GFBio). In Proceedings of the Informatik 2014; Plödereder, E., Grunske, L., Schneider, E., Ull, D., Eds.; Gesellschaft für Informatik e.V.: Bonn, Germany, 2014; pp. 1711–1721. [Google Scholar]
- Grieves, M. Origins of the Digital Twin Concept. 2016. Available online: https://www.researchgate.net/publication/307509727_Origins_of_the_Digital_Twin_Concept?channel=doi&linkId=57c6f44008ae9d64047e92b4&showFulltext=true (accessed on 15 November 2022).
- Mihai, S.; Yaqoob, M.; Hung, D.V.; Davis, W.; Towakel, P.; Raza, M.; Karamanoglu, M.; Barn, B.; Shetve, D.; Prasad, R.V.; et al. Digital Twins: A Survey on Enabling Technologies, Challenges, Trends and Future Prospects. IEEE Commun. Surv. Tutor. 2022, 24, 2255–2291. [Google Scholar] [CrossRef]
- Massonet, A.; Kiesel, R.; Schmitt, R.H. Der Digitale Zwilling über den Produktlebenszyklus. Z. Wirtsch. Fabr. 2020, 115, 97–100. [Google Scholar] [CrossRef]
- Semeraro, C.; Lezoche, M.; Panetto, H.; Dassisti, M. Digital twin paradigm: A systematic literature review. Comput. Ind. 2021, 130, 103469. [Google Scholar] [CrossRef]
- Bao, Q.; Zhao, G.; Yu, Y.; Dai, S.; Wang, W. The ontology-based modeling and evolution of digital twin for assembly workshop. Int. J. Adv. Manuf. Technol. 2021, 117, 395–411. [Google Scholar] [CrossRef]
- Sahlab, N.; Kamm, S.; Muller, T.; Jazdi, N.; Weyrich, M. Knowledge Graphs as Enhancers of Intelligent Digital Twins. In Proceedings of the 2021 4th IEEE International Conference on Industrial Cyber-Physical Systems (ICPS), Victoria, BC, Canada, 10–12 May 2021; pp. 19–24. [Google Scholar] [CrossRef]
- Pang, C.; Szafron, D. Single source of truth (SSOT) for service oriented architecture (SOA). In Proceedings of the International Conference on Service-Oriented Computing, Paris, France, 3–6 November 2014; Springer: Berlin/Heidelberg, Germany, 2014; pp. 575–589. [Google Scholar]
- Miksa, T.; Cardoso, J.; Borbinha, J. Framing the scope of the common data model for machine-actionable Data Management Plans. In Proceedings of the IEEE Conference on Big Data, Seattle, WA, USA, 10–13 December 2018; pp. 2733–2742. [Google Scholar] [CrossRef]
- Gray, J.; Liu, D.T.; Nieto-Santisteban, M.; Szalay, A.; DeWitt, D.J.; Heber, G. Scientific data management in the coming decade. ACM SIGMOD Rec. 2005, 34, 34–41. [Google Scholar] [CrossRef]
- Schadt, E.; Linderman, M.; Sorenson, J.; Lee, L.; Nolan, G. Computational solutions to large-scale data management and analysis. Nat. Rev. Genet. 2010, 11, 647–657. [Google Scholar] [CrossRef]
- Fürholz, A.; Jaekel, M. Data Life Cycle Management Pilot Projects and Implications for Research Data Management at Universities of Applied Sciences. Rev. Electron. Suisse Sci. Inf. 2021, 32–46. [Google Scholar] [CrossRef]
- Redkina, N.S. Current Trends in Research Data Management. Sci. Tech. Inf. Process. 2019, 46, 53–58. [Google Scholar] [CrossRef]
- Engelhardt, C.; Enke, H.; Klar, J.; Ludwig, J.; Neuroth, H. Research data management organiser. In Proceedings of the 14th International Conference on Digital Preservation, Kyoto, Japan, 25–29 September 2017; pp. 25–29. [Google Scholar]
- Rosen, R.; von Wichert, G.; Lo, G.; Bettenhausen, K.D. About The Importance of Autonomy and Digital Twins for the Future of Manufacturing. IFAC-PapersOnLine 2015, 48, 567–572. [Google Scholar] [CrossRef]
- Wang, Z. Digital Twin Technology. In Industry 4.0; Bányai, T., Felice, A.P.F.D., Eds.; IntechOpen: Rijeka, Croatia, 2020; Chapter 7. [Google Scholar] [CrossRef]
- Barricelli, B.R.; Casiraghi, E.; Fogli, D. A Survey on Digital Twin: Definitions, Characteristics, Applications, and Design Implications. IEEE Access 2019, 7, 167653–167671. [Google Scholar] [CrossRef]
- Shafto, M.; Conroy, M.; Doyle, R.; Glaessgen, E.; Kemp, C.; LeMoigne, J.; Wang, L. Modeling, Simulation, Information Technology and Processing Roadmap; National Aeronautics and Space Administration: Washington, DC, USA, 2010.
- Grieves, M. Intelligent digital twins and the development and management of complex systems. Digit. Twin 2022, 2, 8. [Google Scholar] [CrossRef]
- Dorofeev, K.; Zoitl, A. Skill-based Engineering Approach using OPC UA Programs. In Proceedings of the 2018 IEEE 16th International Conference on Industrial Informatics (INDIN), Porto, Portugal, 18–20 July 2018; pp. 1098–1103. [Google Scholar] [CrossRef]
- Sepasgozar, S.M.E. Differentiating Digital Twin from Digital Shadow: Elucidating a Paradigm Shift to Expedite a Smart, Sustainable Built Environment. Buildings 2021, 11, 151. [Google Scholar] [CrossRef]
- van der Valk, H.; Haße, H.; Möller, F.; Otto, B. Archetypes of Digital Twins. Bus. Inf. Syst. Eng. 2021, 64, 375–391. [Google Scholar] [CrossRef]
- Singh, M.; Fuenmayor, E.; Hinchy, E.; Qiao, Y.; Murray, N.; Devine, D. Digital Twin: Origin to Future. Appl. Syst. Innov. 2021, 4, 36. [Google Scholar] [CrossRef]
- Zehnder, P.; Riemer, D. Representing Industrial Data Streams in Digital Twins using Semantic Labeling. In Proceedings of the 2018 IEEE International Conference on Big Data (Big Data), Seattle, WA, USA, 10–13 December 2018; pp. 4223–4226. [Google Scholar] [CrossRef]
- Lehmann, J.; Lober, A.; Rache, A.; Baumgärtel, H.; Reichwald, J. Collaboration of Semantically Enriched Digital Twins based on a Marketplace Approach. In Proceedings of the 19th International Conference on Wireless Networks and Mobile Systems, Lisbon, Portugal, 11–13 July 2022; SciTePress: Setubal, Portugal; pp. 35–45. [Google Scholar] [CrossRef]
- Göppert, A.; Grahn, L.; Rachner, J.; Grunert, D.; Hort, S.; Schmitt, R.H. Pipeline for ontology-based modeling and automated deployment of digital twins for planning and control of manufacturing systems. J. Intell. Manuf. 2021. [Google Scholar] [CrossRef]
- Zhang, C.; Zhou, G.; He, J.; Li, Z.; Cheng, W. A data- and knowledge-driven framework for digital twin manufacturing cell. Procedia CIRP 2019, 83, 345–350. [Google Scholar] [CrossRef]
- Segovia, M.; Garcia-Alfaro, J. Design, Modeling and Implementation of Digital Twins. Sensors 2022, 22, 5396. [Google Scholar] [CrossRef]
- Lober, A.; Lehmann, J.; Häußermann, T.; Reichwald, J.; Baumgärtel, H. Improving the Engineering Process of Control Systems Based on Digital Twin Specifications. In Proceedings of the 2022 4th International Conference on Emerging Trends in Electrical, Electronic and Communications Engineering (ELECOM), Balaclava, Mauritius, 22–24 November 2022; pp. 1–6. [Google Scholar] [CrossRef]
- Onaji, I.; Tiwari, D.; Soulatiantork, P.; Song, B.; Tiwari, A. Digital twin in manufacturing: Conceptual framework and case studies. Int. J. Comput. Integr. Manuf. 2022, 35, 831–858. [Google Scholar] [CrossRef]
- Blinowski, G.; Ojdowska, A.; Przybyłek, A. Monolithic vs. Microservice Architecture: A Performance and Scalability Evaluation. IEEE Access 2022, 10, 20357–20374. [Google Scholar] [CrossRef]
- Kümmel, T.; Marwick, B.; Rittel, M.; Guevara, C.; Wühler, F.; Teumer, T.; Wängler, B.; Hopf, C.; Rädle, M. Rapid brain structure and tumour margin detection on whole frozen tissue sections by fast multiphotometric mid-infrared scanning. Sci. Rep. 2021, 11, 11307. [Google Scholar] [CrossRef] [PubMed]
- Beuermann, T.; Heintz, A.; Rädle, M.; Wühler, F. Design of a Multimodal Imaging System and Its First Application to Distinguish Grey and White Matter of Brain Tissue. A Proof-of-Concept-Study. Appl. Sci. 2021, 11, 4777. [Google Scholar] [CrossRef]
- NXP Semiconductors. i.MX RT1060 Crossover Processors for Consumer Products. 2019. Available online: https://www.pjrc.com/teensy/IMXRT1060CEC_rev0_1.pdf (accessed on 8 December 2022).
- ams OSRAM Group. AS89010 Datasheet. 2017. Available online: https://ams.com/as89010 (accessed on 6 December 2022).
- Texas Instruments Inc. DP83825I Low Power 10/100 Mbps Ethernet Physical Layer Transceiver. 2018. Available online: https://www.ti.com/product/DP83825I (accessed on 30 November 2022).
- Schmitt, L.; Meyer, C.; Schorz, S.; Manser, S.; Scholl, S.; Rädle, M. Use of a Scattered Light Sensor for Monitoring the Dispersed Surface in Crystallization. Chem. Ing. Tech. 2022, 8, 94. [Google Scholar] [CrossRef]
- Teumer, T.; Medina, I.; Strischakov, J.; Schorz, S.; Kumari, P.; Rädle, M.; Hohlen, A.; Scholl, S.; Welzel, S.; Schwede, C.; et al. Development and application of optical sensors and measurement devices for the detection of deposits during reaction fouling. In Proceedings of the 13th ECCE and 6th ECAB, Virtual Conference, Berlin, Germany, 20–23 September 2021; p. 13. [Google Scholar] [CrossRef]
- Guffart, J.; Bus, Y.; Nachtmann, M.; Lettau, M.; Schorz, S.; Nieder, H.; Repke, J.U.; Rädle, M. Photometrische Inline-Überwachung der Pigmentkonzentration hochgefüllter Lacke. Chem. Ing. Tech. 2020, 6, 8. [Google Scholar] [CrossRef]
- Eclipse Foundation. Eclipse Ditto™ Documentation. 2021. Available online: https://www.eclipse.org/ditto/intro-overview.html (accessed on 9 November 2022).
- Nguyen, D.T.; Do, H.D. Research on Large-Scale Knowledge Base Management Frameworks for Open-Domain Question Answering Systems. In Intelligent Systems and Networks; Springer: Singapore, 2021; pp. 87–92. [Google Scholar] [CrossRef]
- Hong, S.; Lee, S.; Lim, S.H.; Sukumar, S.R.; Vatsavai, R.R. Evaluation of Pattern Matching Workloads in Graph Analysis Systems. In Proceedings of the 25th ACM International Symposium on High-Performance Parallel and Distributed Computing, Kyoto, Japan, 31 May–4 June 2016; ACM: New York, NY, USA, 2016. [Google Scholar] [CrossRef]
- Lissandrini, M.; Brugnara, M.; Velegrakis, Y. Beyond macrobenchmarks: Microbenchmark-based graph database evaluation. Proc. VLDB Endow. 2018, 12, 390–403. [Google Scholar] [CrossRef]
- Vrgoc, D.; Rojas, C.; Angles, R.; Arenas, M.; Arroyuelo, D.; Aranda, C.B.; Hogan, A.; Navarro, G.; Riveros, C.; Romero, J. MillenniumDB: A Persistent, Open-Source, Graph Database. arXiv 2021, arXiv:2111.01540. [Google Scholar] [CrossRef]
- Apache Software Foundation. Apache Jena. 2022. Available online: https://jena.apache.org/ (accessed on 22 November 2022).
- InfluxDB®. InfluxDB OSS 2.5 Documentation. 2022. Available online: https://docs.influxdata.com/influxdb/v2.5/ (accessed on 22 November 2022).
- Hao, Y.; Qin, X.; Chen, Y.; Li, Y.; Sun, X.; Tao, Y.; Zhang, X.; Du, X. TS-Benchmark: A Benchmark for Time Series Databases. In Proceedings of the 2021 IEEE 37th International Conference on Data Engineering (ICDE), Chania, Greece, 19–22 April 2021. [Google Scholar] [CrossRef]
- Nasar, M.; Kausar, M.A. VOLUME-8 ISSUE-10, AUGUST 2019, REGULAR ISSUE. Int. J. Innov. Technol. Explor. Eng. 2019, 8, 1850–1857. [Google Scholar] [CrossRef]
- Dataverse Documentation. 2022. Available online: https://guides.dataverse.org/en/latest/ (accessed on 22 November 2022).
- Stall, S.; Martone, M.E.; Chandramouliswaran, I.; Crosas, M.; Federer, L.; Gautier, J.; Hahnel, M.; Larkin, J.; Lowenberg, D.; Pfeiffer, N.; et al. Generalist Repository Comparison Chart. 2020. Available online: https://zenodo.org/record/3946720#.Y7TX2xVByUk (accessed on 5 December 2022).
- Wittenberg, M.; Tykhonov, V.; Indarto, E.; Steinhoff, W.; Huis In ’T Veld, L.; Kasberger, S.; Conzett, P.; Concordia, C.; Kiraly, P.; Parkoła, T. D5.5 ‘Archive in a Box’ Repository Software and Proof of Concept of Centralised Installation in the Cloud. 2022. Available online: https://zenodo.org/record/6676391#.Y7TX6xVByUk (accessed on 5 December 2022).
- Light, R.A. Mosquitto: Server and client implementation of the MQTT protocol. J. Open Source Softw. 2017, 2, 265. [Google Scholar] [CrossRef]
- Uy, N.Q.; Nam, V.H. A comparison of AMQP and MQTT protocols for Internet of Things. In Proceedings of the 2019 6th NAFOSTED Conference on Information and Computer Science (NICS), Hanoi, Vietnam, 12–13 December 2019. [Google Scholar] [CrossRef]
- OpenJS Foundation & Contributors. Node-RED. 2022. Available online: https://nodered.org/docs/ (accessed on 23 November 2022).
- Roithner Lasertechnik. EPD-660-1-0.9. 2007. Available online: https://pdf1.alldatasheet.com/datasheet-pdf/view/332642/EPIGAP/EPD-660-1-0.9.html (accessed on 8 December 2022).
- Roithner Lasertechnik. ELD-650-523. 2010. Available online: http://www.roithner-laser.com/datasheets/led_div/eld_650_523.pdf (accessed on 8 December 2022).


Disclaimer/Publisher’s Note: The statements, opinions and data contained in all publications are solely those of the individual author(s) and contributor(s) and not of MDPI and/or the editor(s). MDPI and/or the editor(s) disclaim responsibility for any injury to people or property resulting from any ideas, methods, instructions or products referred to in the content. |
© 2023 by the authors. Licensee MDPI, Basel, Switzerland. This article is an open access article distributed under the terms and conditions of the Creative Commons Attribution (CC BY) license (https://creativecommons.org/licenses/by/4.0/).
Share and Cite
Lehmann, J.; Schorz, S.; Rache, A.; Häußermann, T.; Rädle, M.; Reichwald, J. Establishing Reliable Research Data Management by Integrating Measurement Devices Utilizing Intelligent Digital Twins. Sensors 2023, 23, 468. https://doi.org/10.3390/s23010468
Lehmann J, Schorz S, Rache A, Häußermann T, Rädle M, Reichwald J. Establishing Reliable Research Data Management by Integrating Measurement Devices Utilizing Intelligent Digital Twins. Sensors. 2023; 23(1):468. https://doi.org/10.3390/s23010468
Chicago/Turabian StyleLehmann, Joel, Stefan Schorz, Alessa Rache, Tim Häußermann, Matthias Rädle, and Julian Reichwald. 2023. "Establishing Reliable Research Data Management by Integrating Measurement Devices Utilizing Intelligent Digital Twins" Sensors 23, no. 1: 468. https://doi.org/10.3390/s23010468
APA StyleLehmann, J., Schorz, S., Rache, A., Häußermann, T., Rädle, M., & Reichwald, J. (2023). Establishing Reliable Research Data Management by Integrating Measurement Devices Utilizing Intelligent Digital Twins. Sensors, 23(1), 468. https://doi.org/10.3390/s23010468