
The Role of Different Retinal Imaging Modalities in Predicting Progression of Diabetic Retinopathy: A Survey

 ,
,  , , ,
, , ,  ,
,  ,
,  , ,
, ,  ,
, 
Abstract
:1. Introduction
2. Clinical Staging of Diabetic Retinopathy Using Retinal Imaging

| Stage | Characteristic |
|---|---|
| Normal | No retinal disease. |
| Mild NPDR | This stage contains a microaneurysms which are a small amount of fluid in the retinal blood vessels, causing the macula to swell. |
| Moderate NPDR | Retinal blood vessels become blocked due to their increased swelling, prohibiting the retina from being nourished. |
| Severe NPDR | Larger areas of retinal blood vessels are blocked, sending signals to the body to generate new blood vessels in the retina. |
| PDR | New blood vessels are generated in the retina abnormally, often leading to fluid leakage due to their fragility, causing a reduced field of vision, blurring, or blindness. |

3. Imaging Modalities for Diabetic Retinopathy
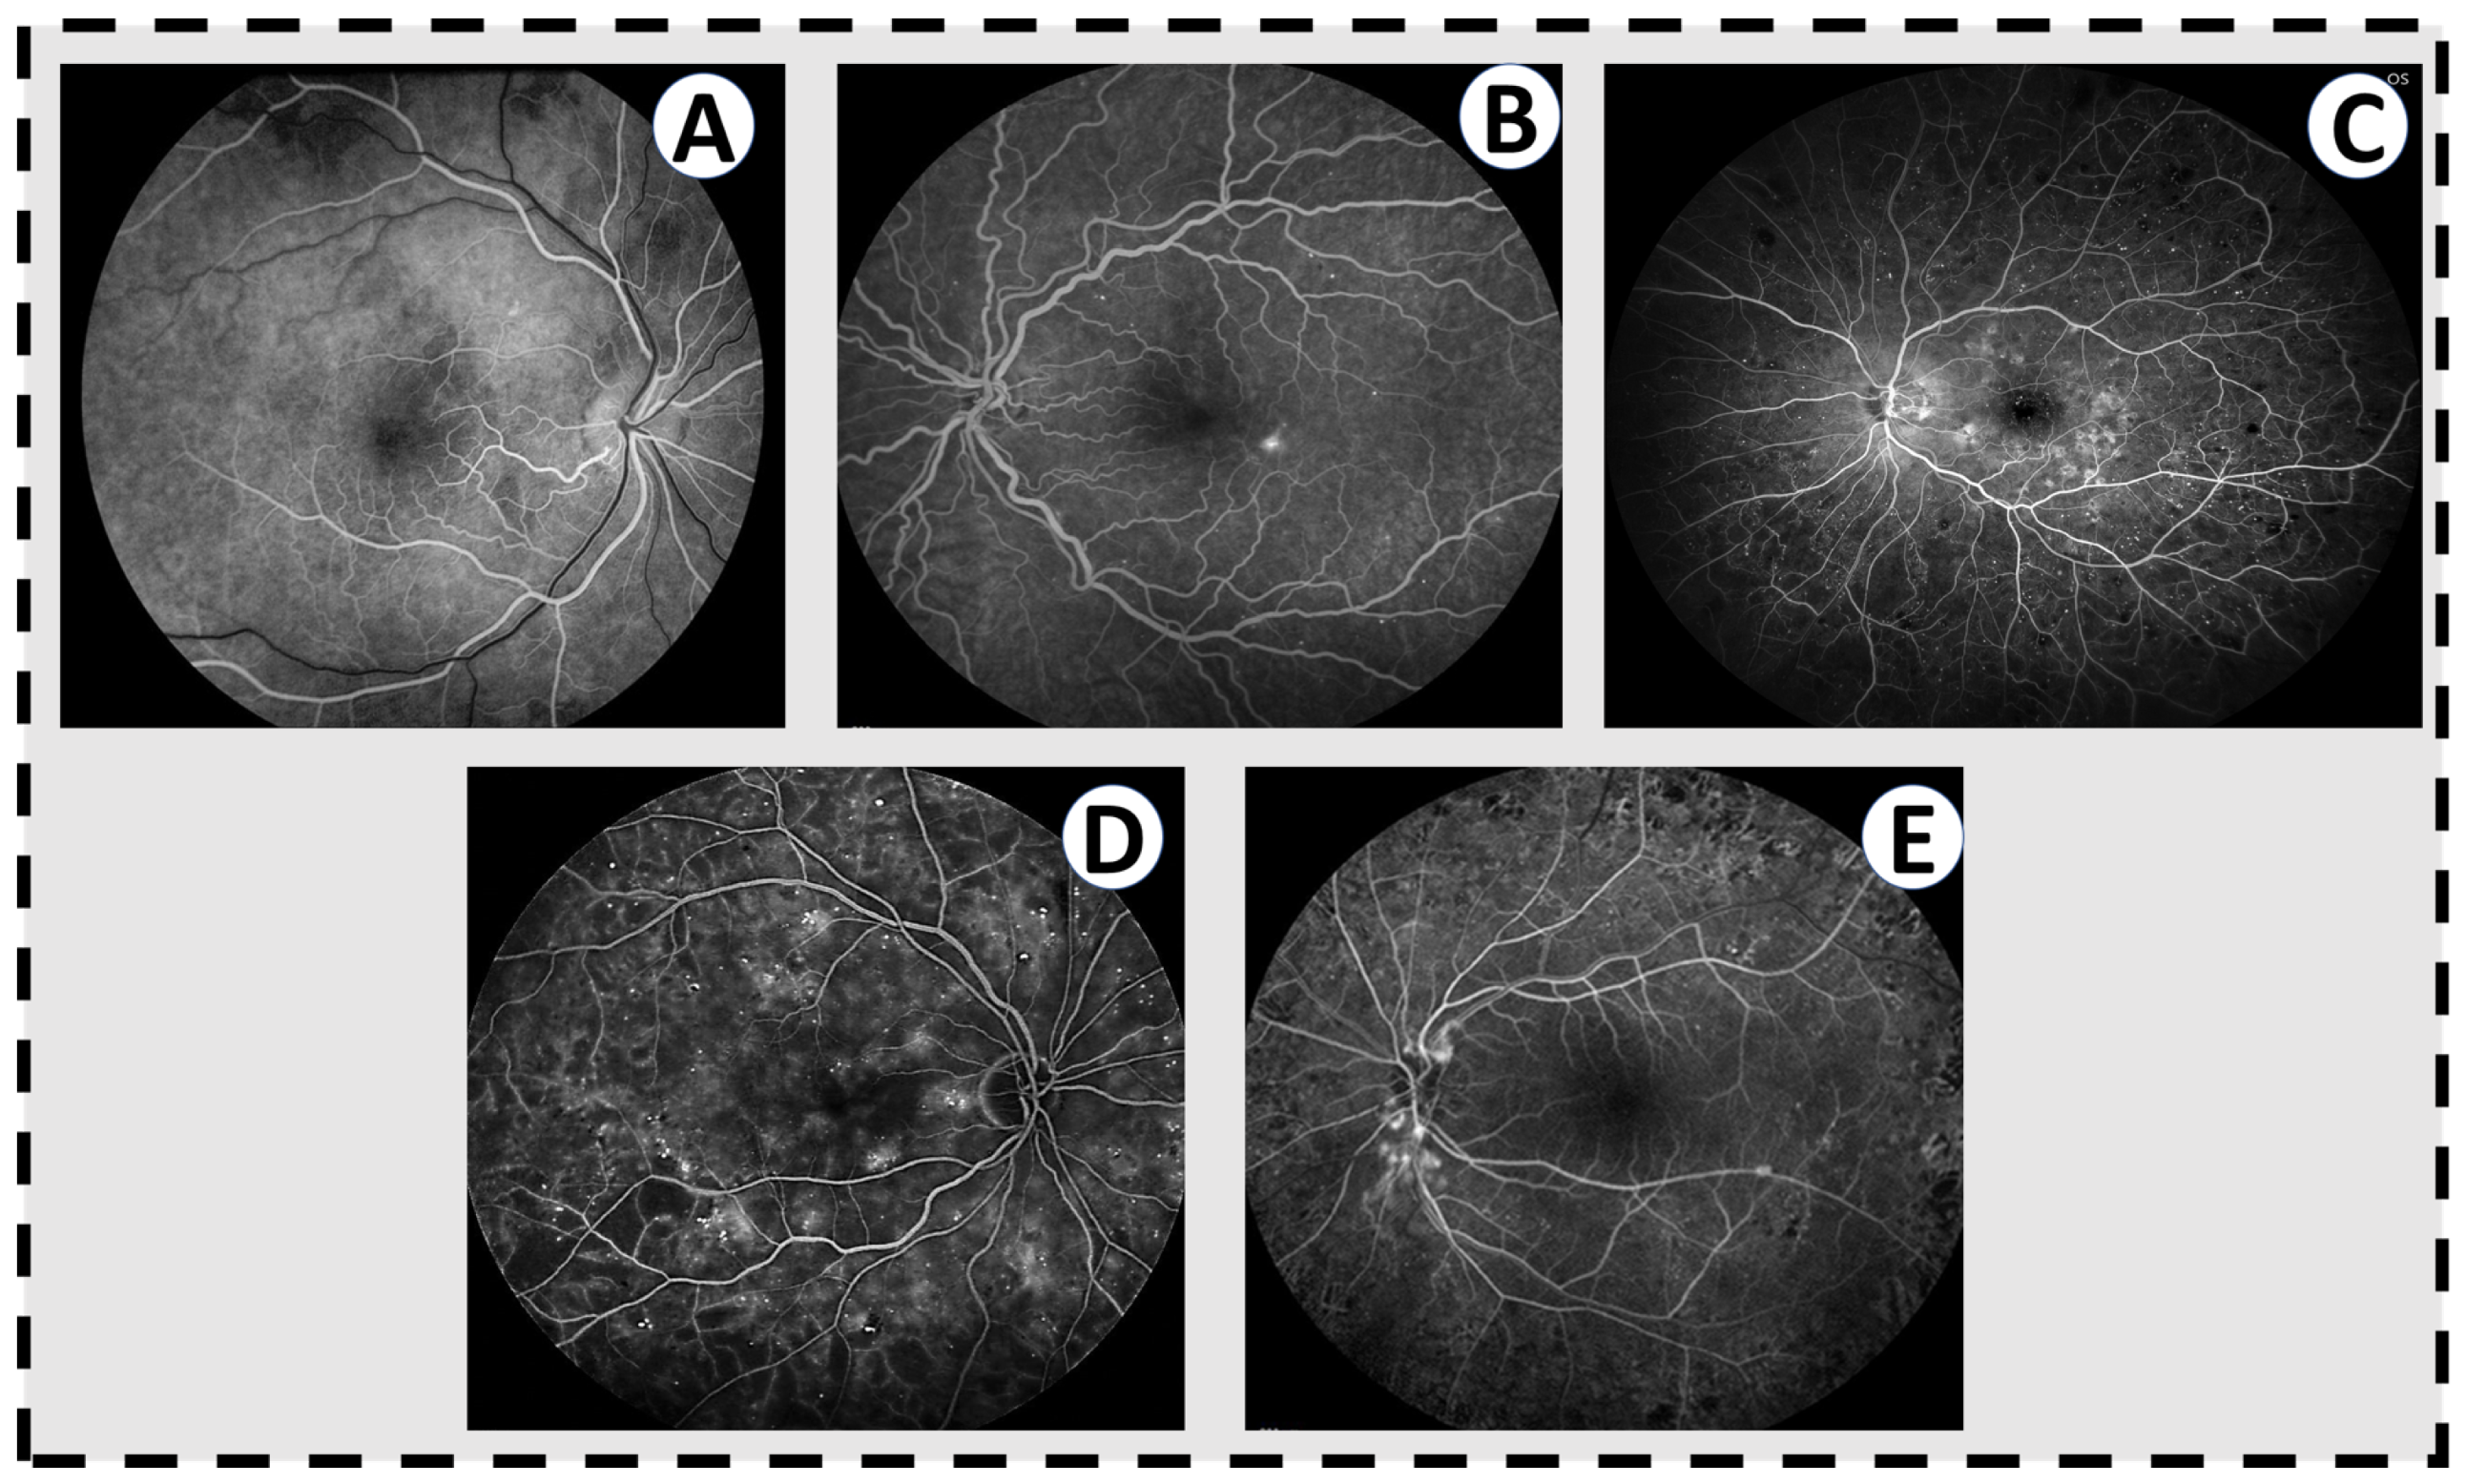
3.1. Fluorescein Angiography (FA)
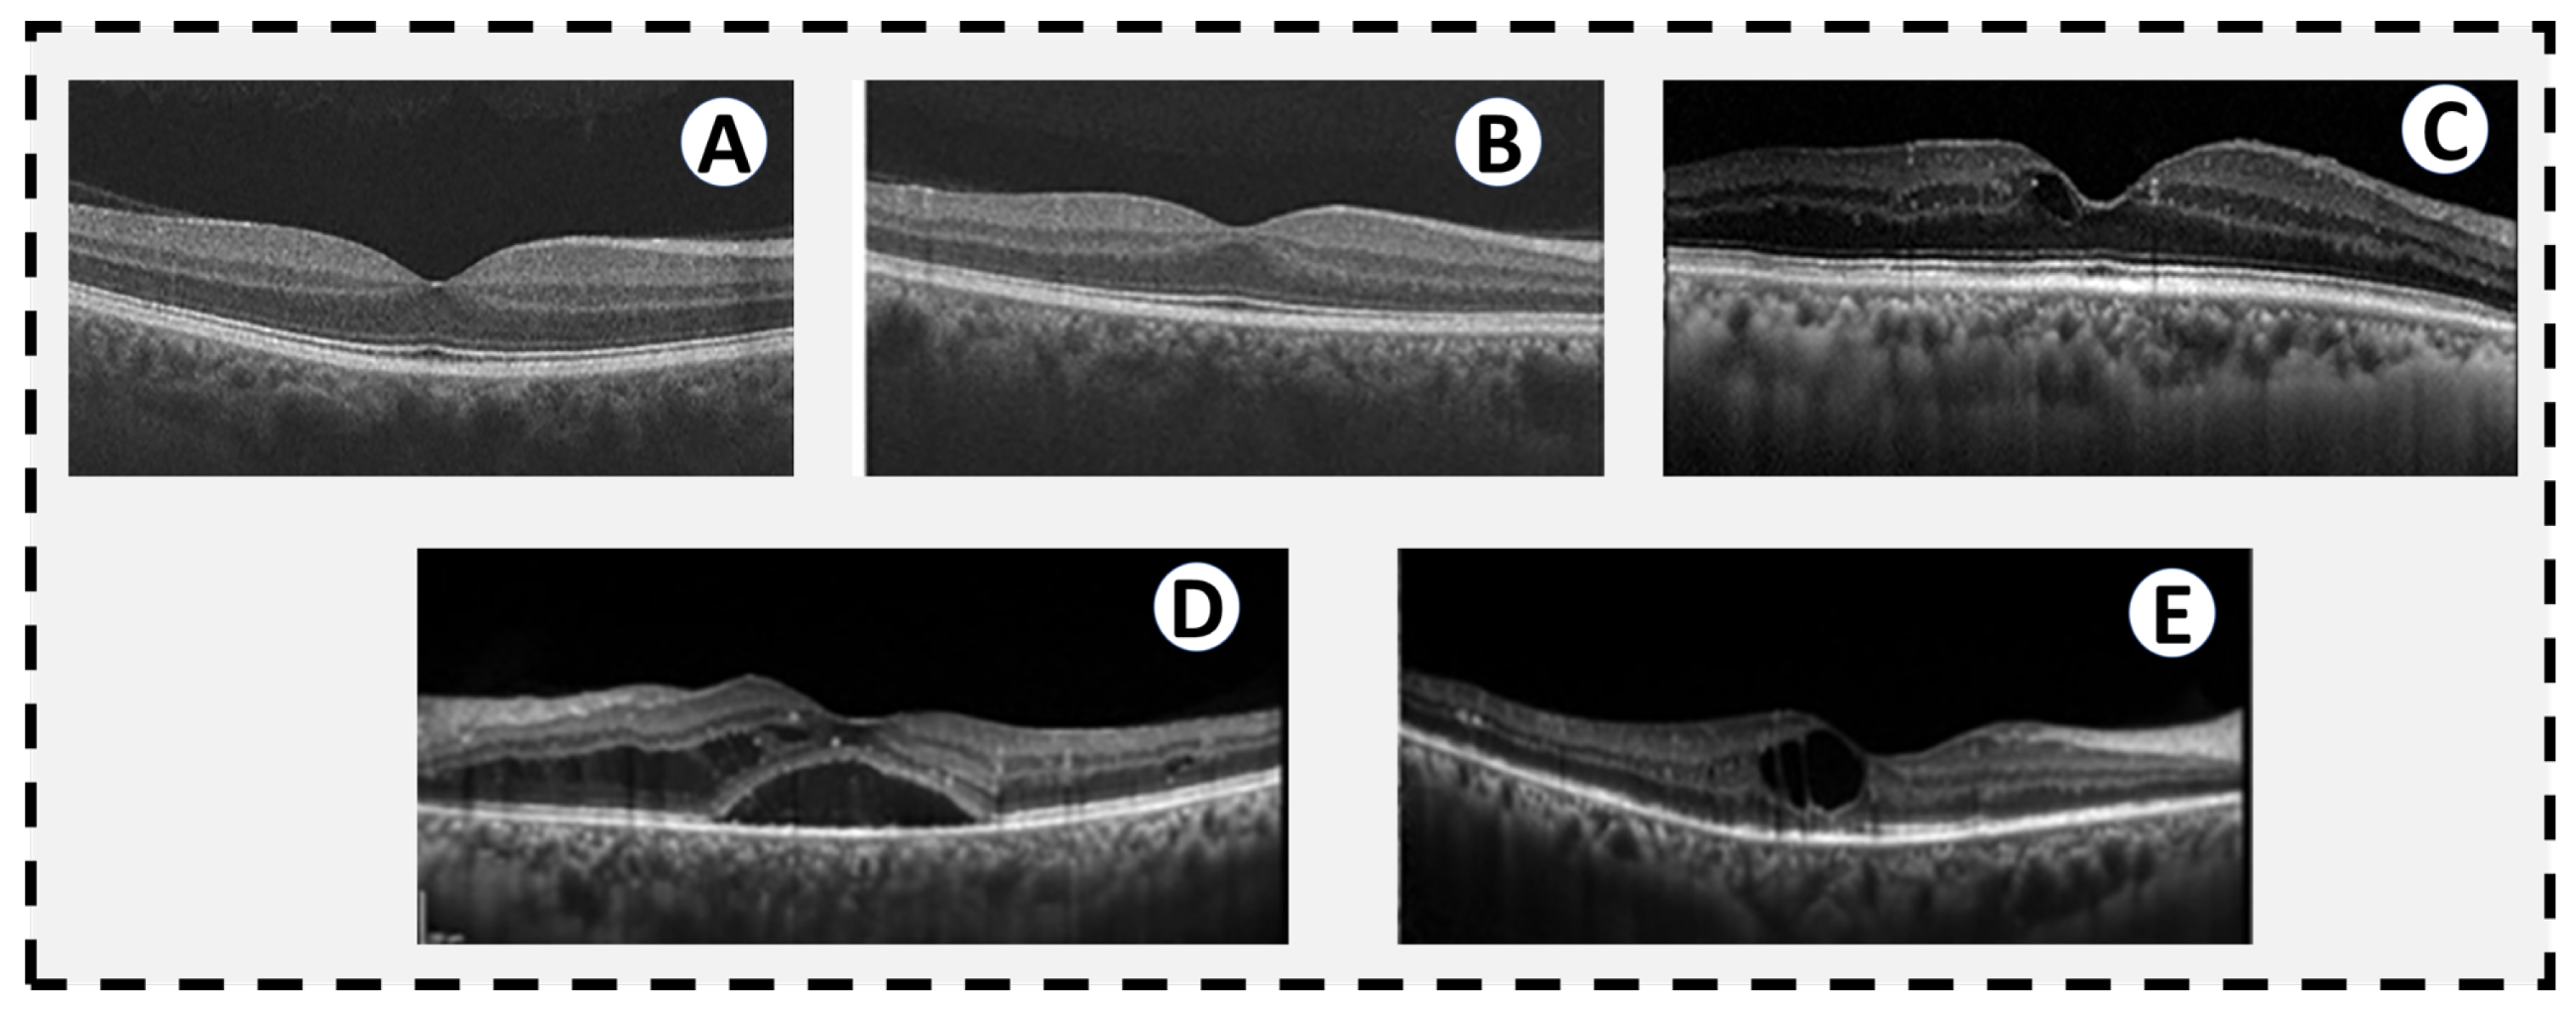
3.2. Optical Coherence Tomography (OCT)
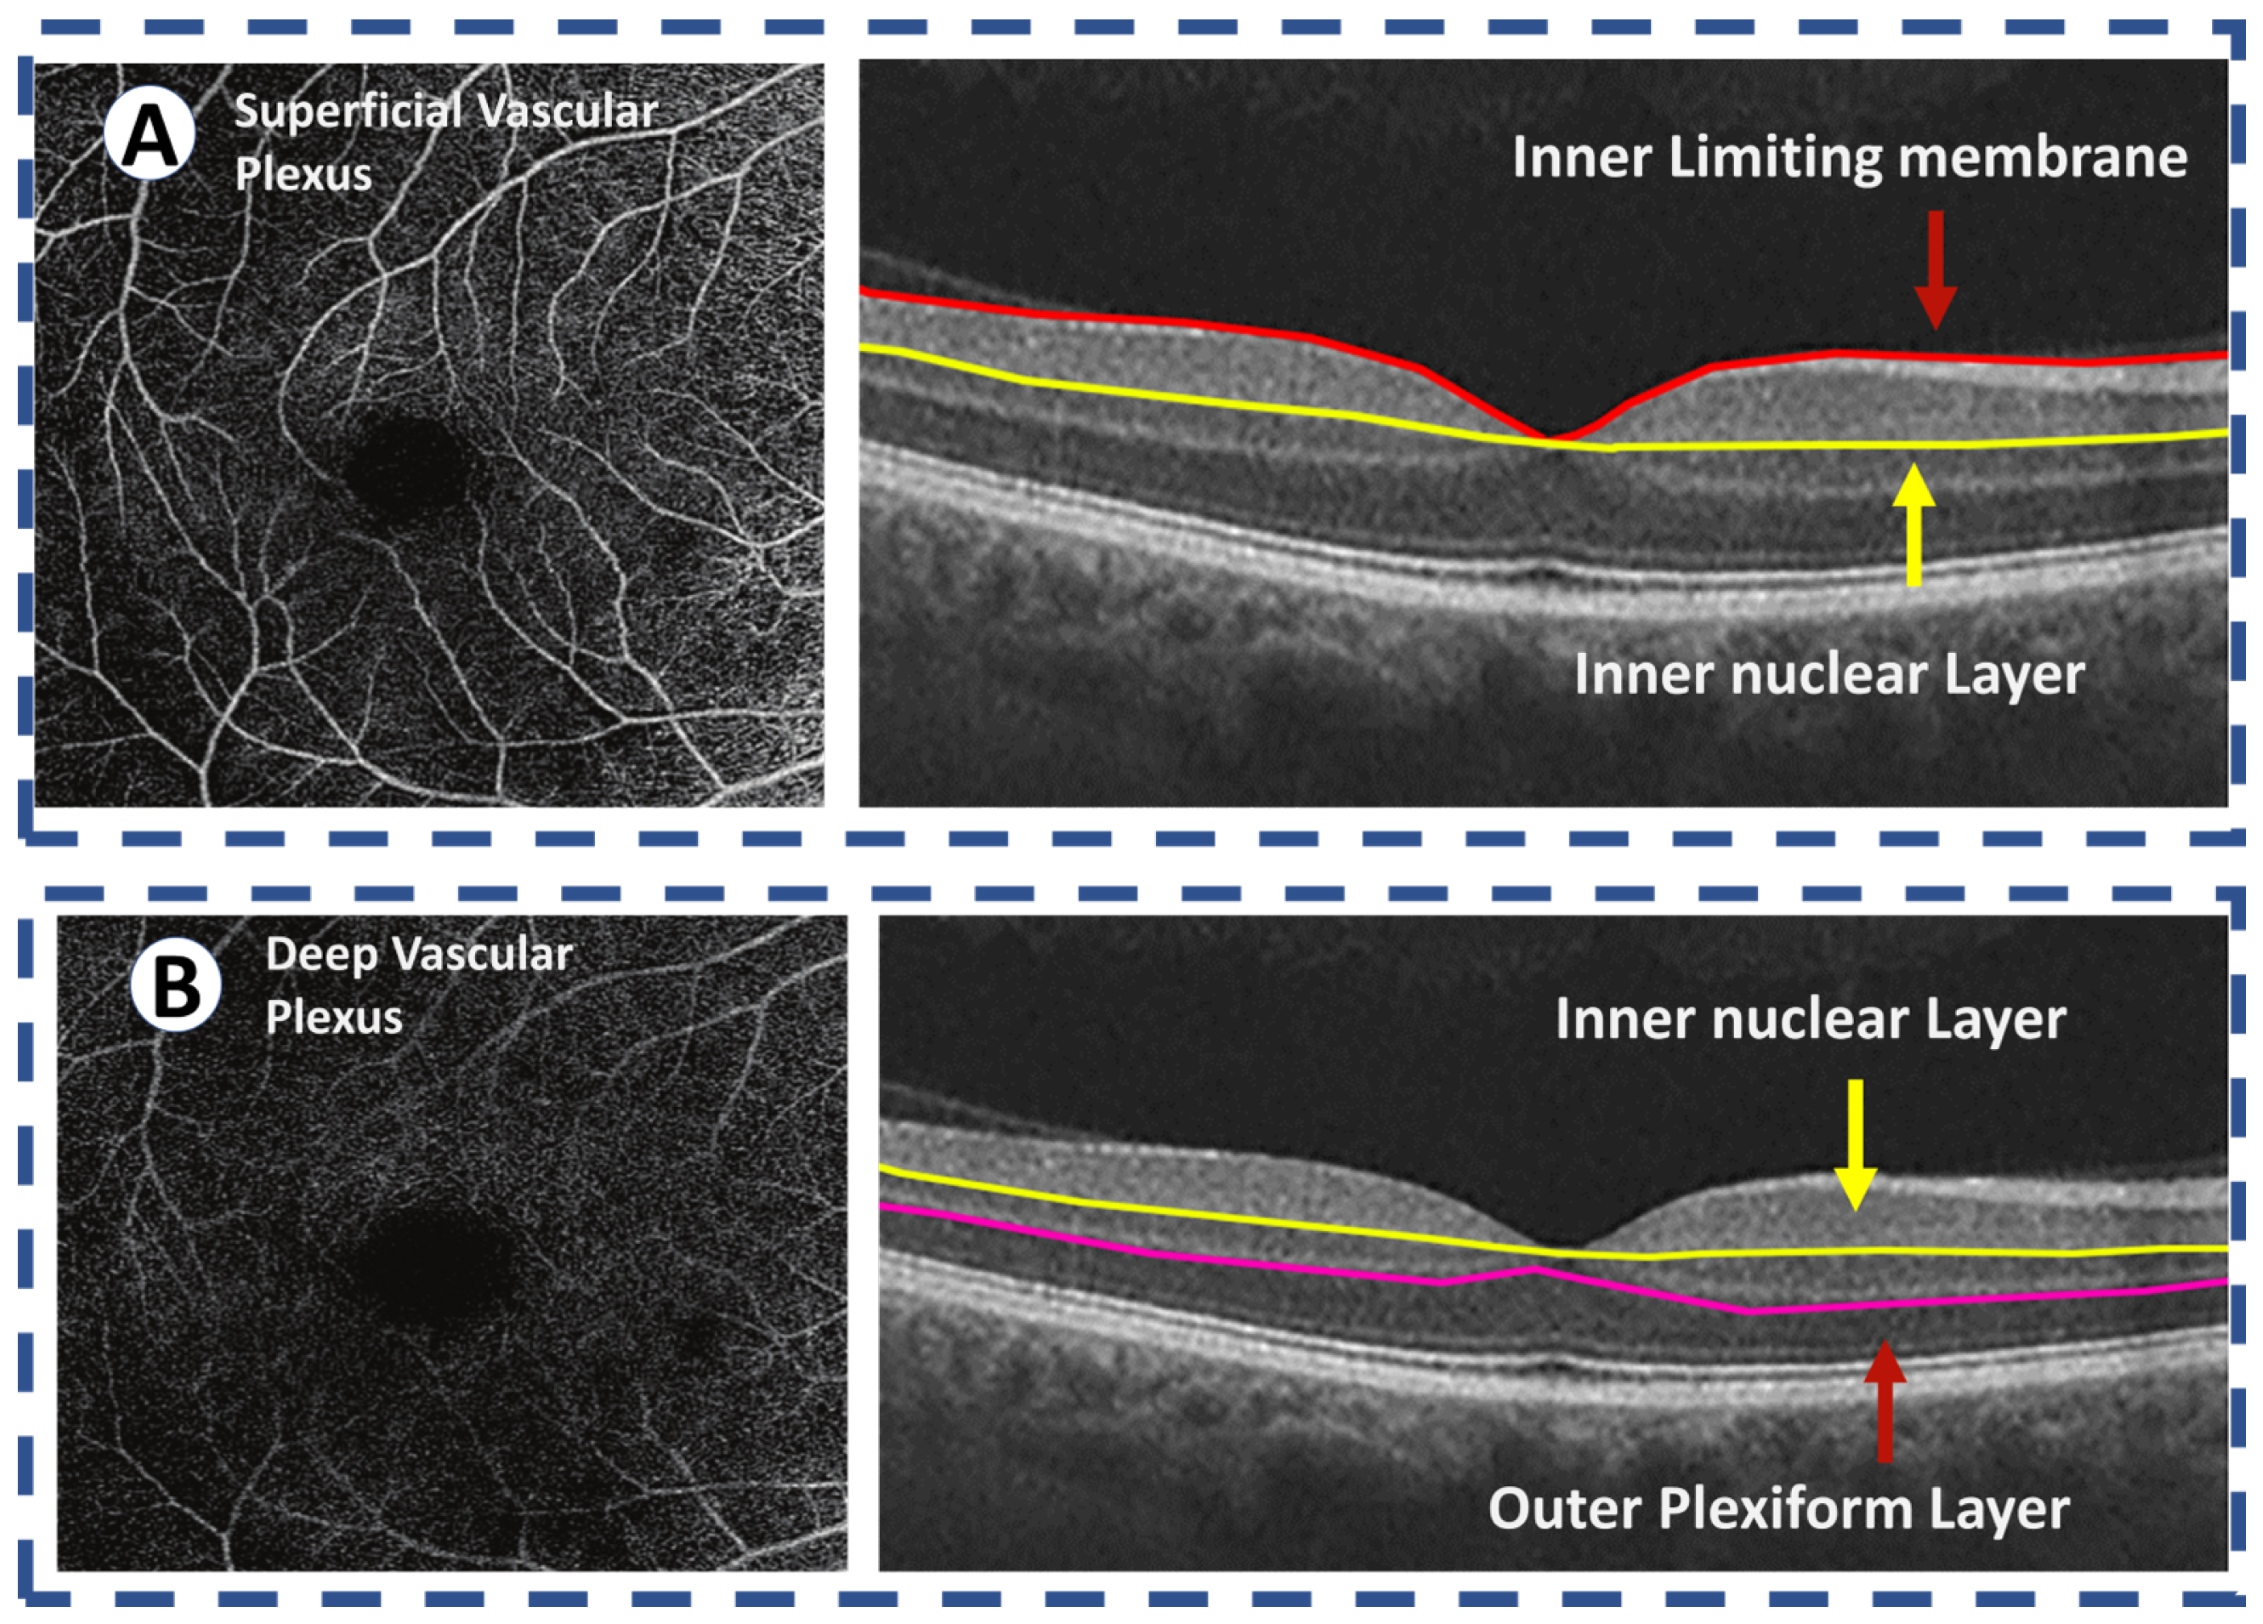
3.3. Optical Coherence Tomography Angiography (OCTA)
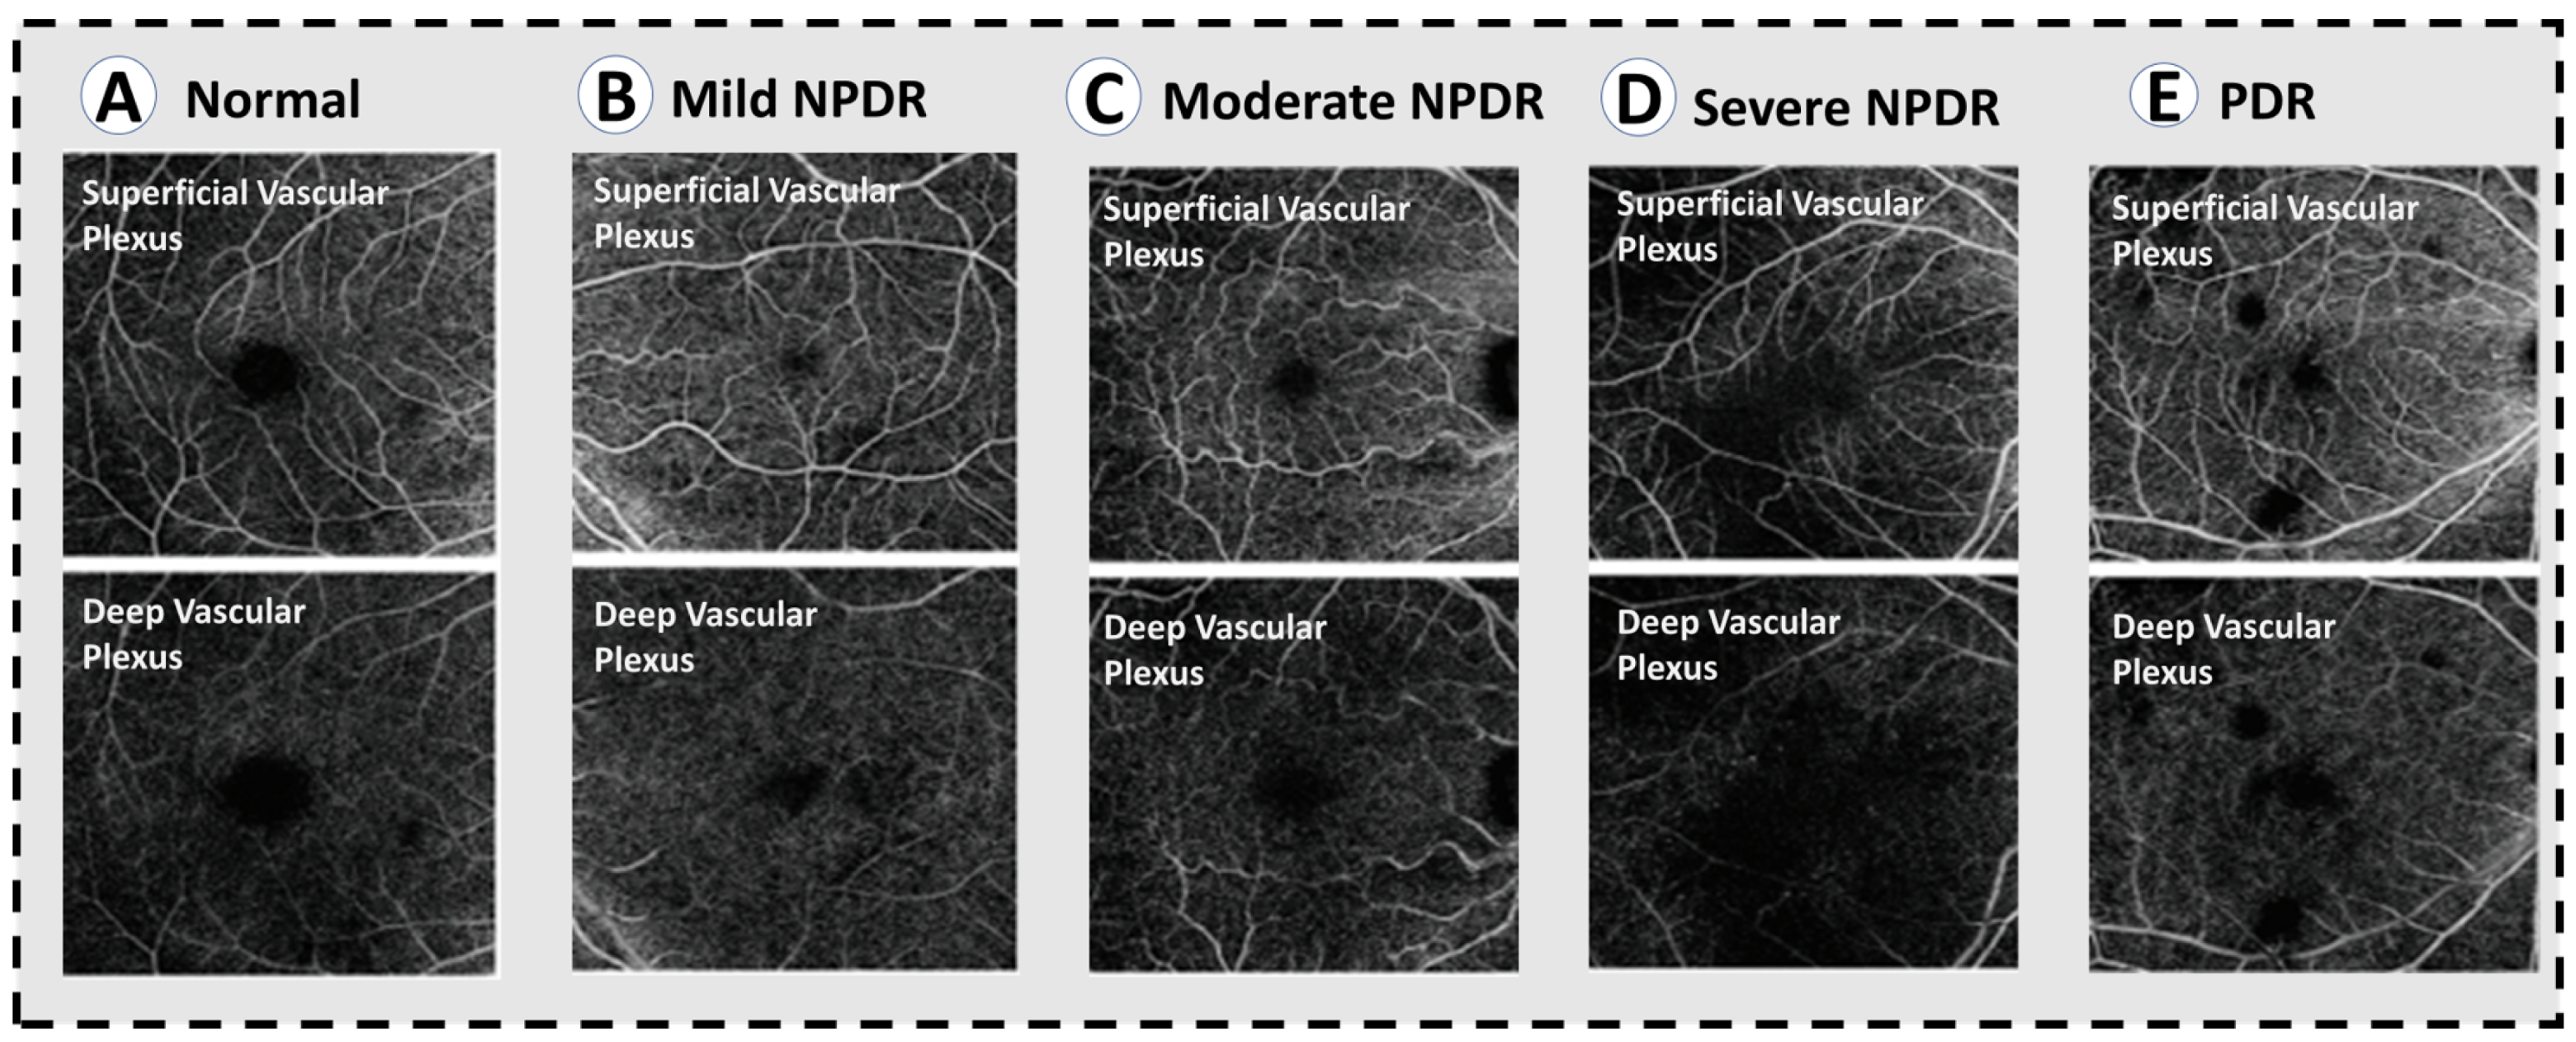


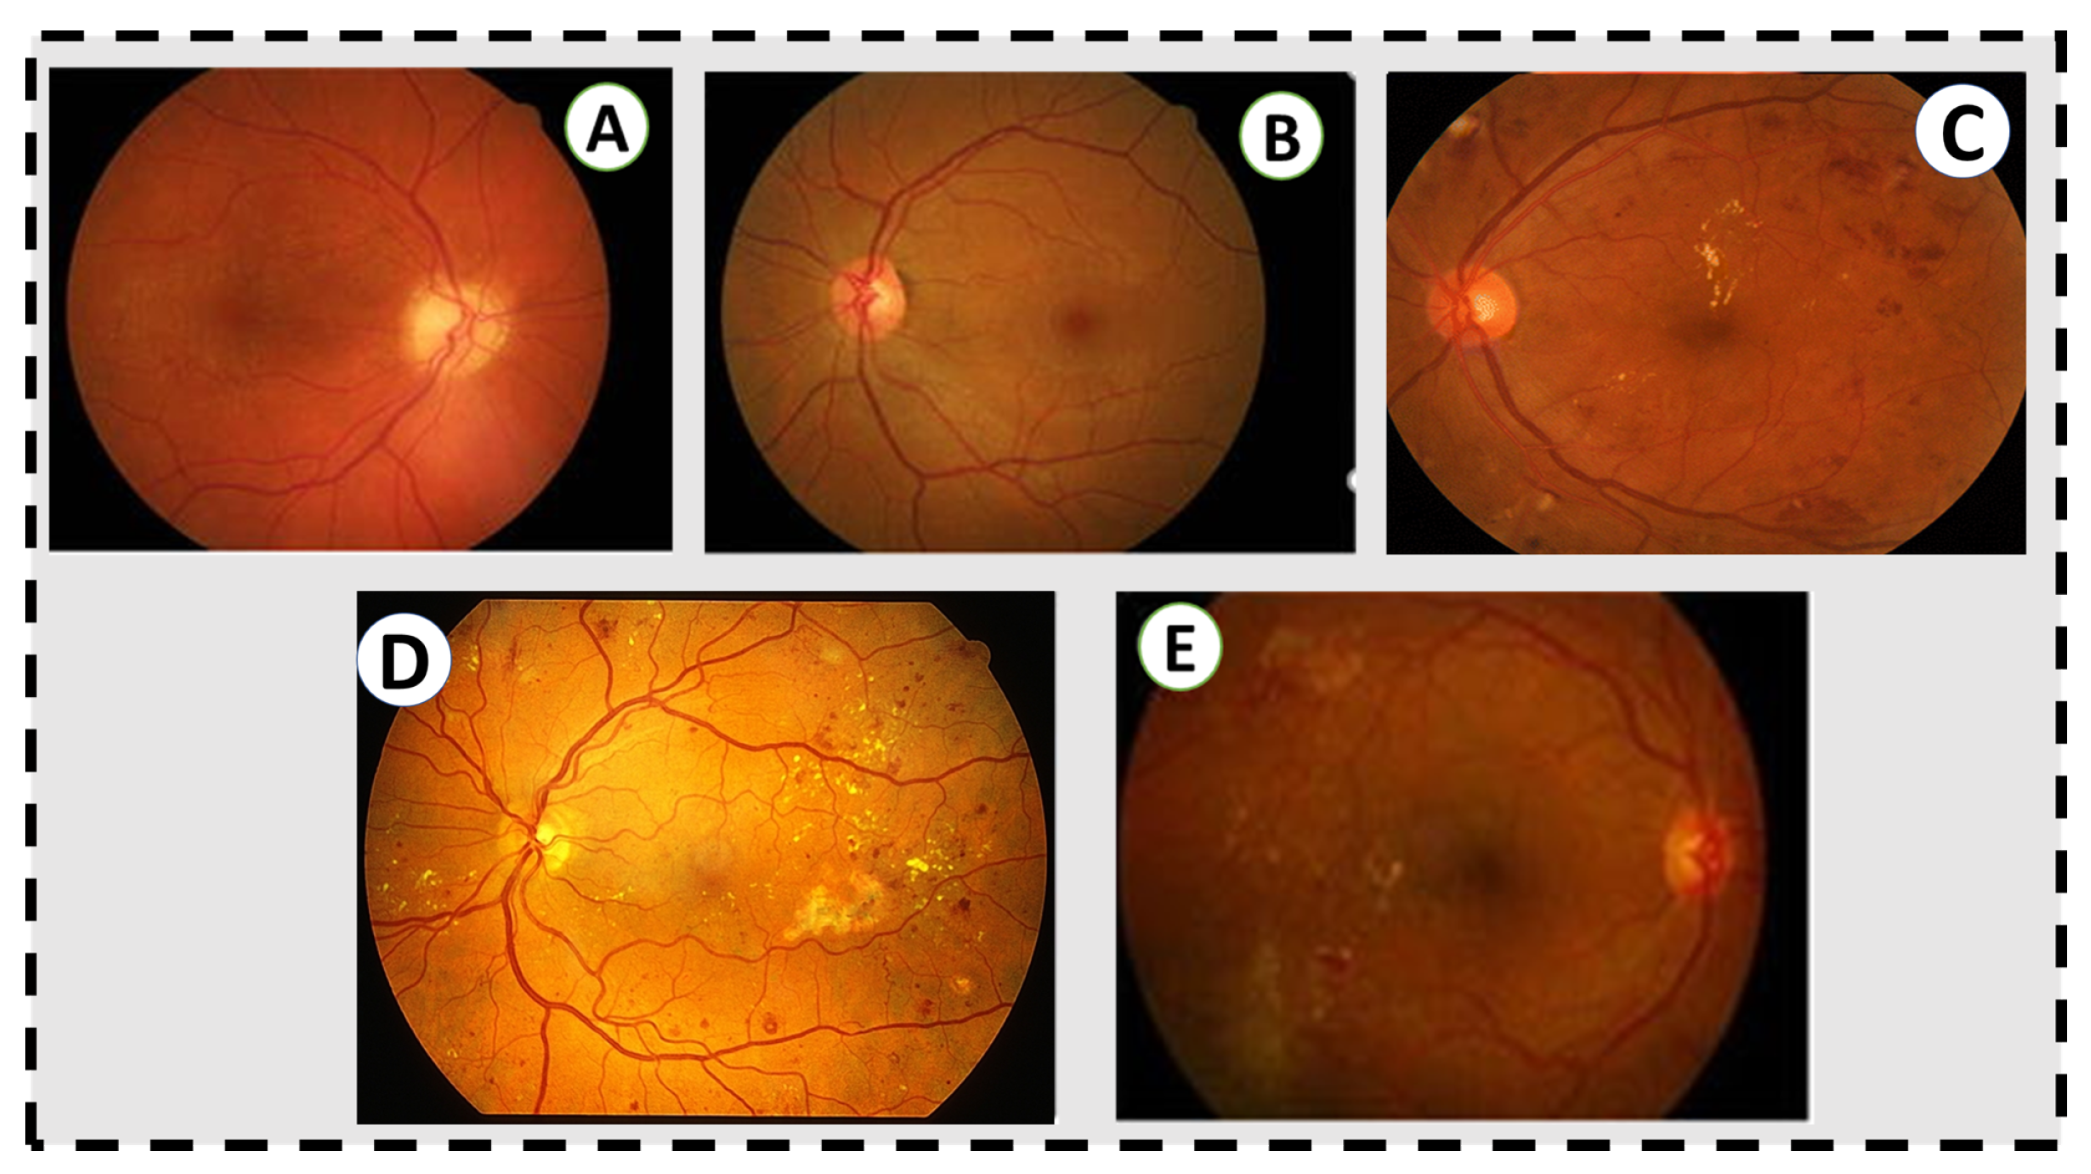
3.4. Color Fundus Photography
4. Literature on CAD Systems for DR Diagnosis and Grading
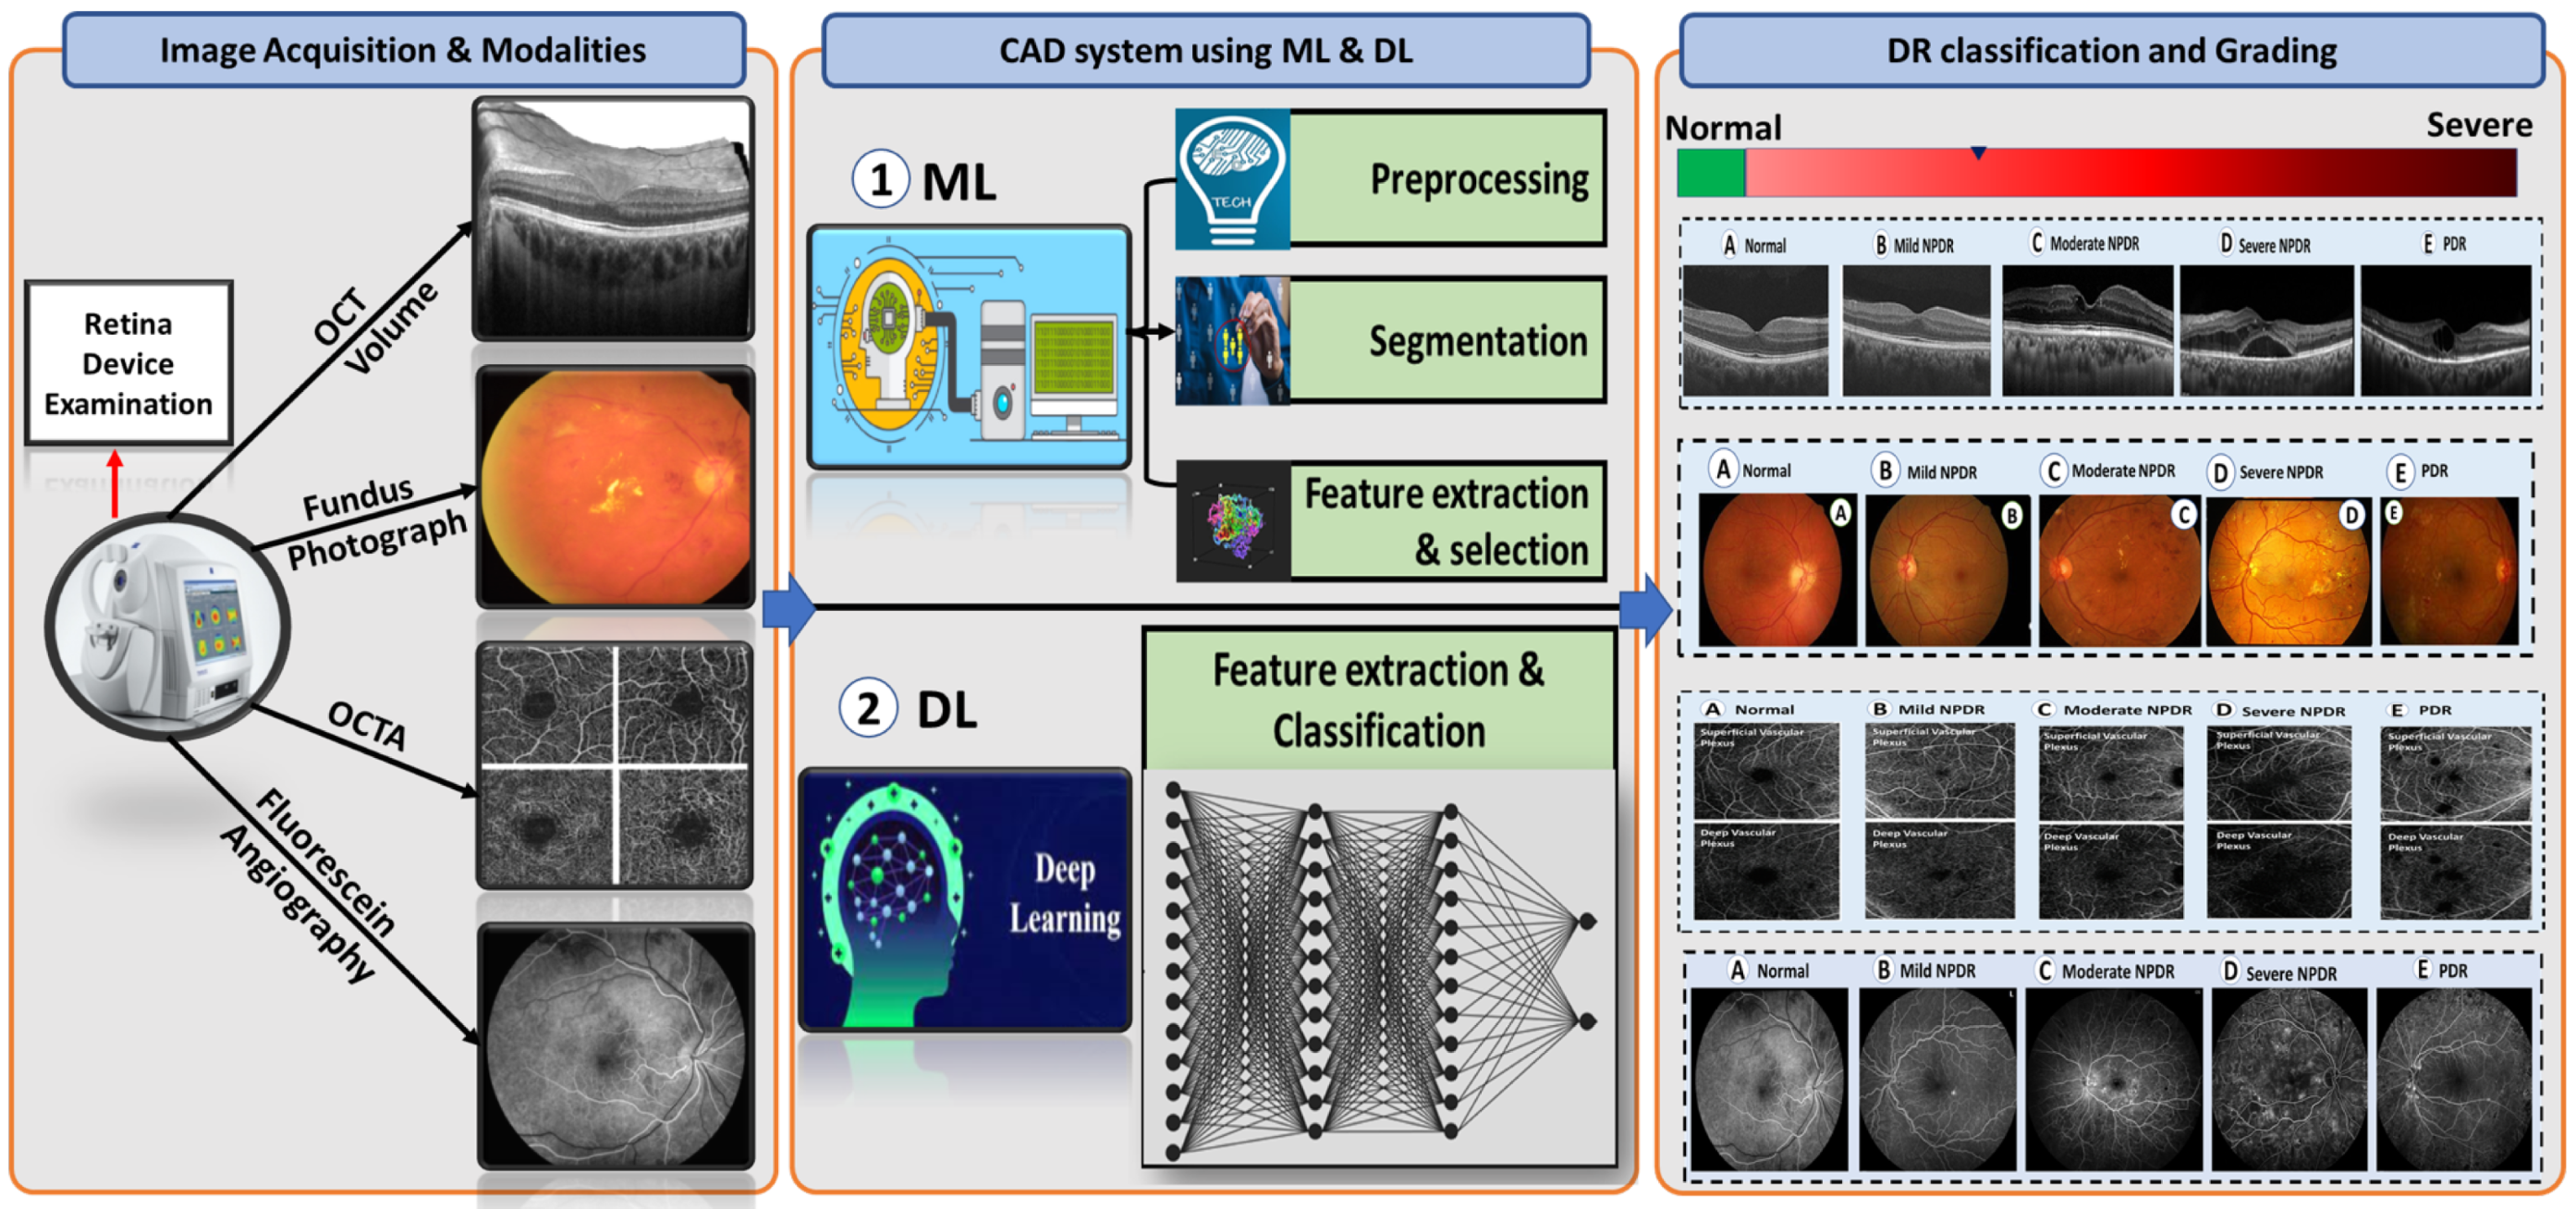
4.1. CAD System Based on Machine Learning Techniques
4.2. CAD System Based on Deep Learning Techniques
5. Discussion and Future Directions
5.1. Future Research Areas and Challenges
5.2. Research Gap
6. Conclusions
Author Contributions
Funding
Institutional Review Board Statement
Informed Consent Statement
Data Availability Statement
Conflicts of Interest
References
- Duh, E.J.; Sun, J.K.; Stitt, A.W. Diabetic retinopathy: Current understanding, mechanisms, and treatment strategies. JCI Insight 2017, 2, e93751. [Google Scholar] [CrossRef] [PubMed]
- Schwartz, S.S.; Epstein, S.; Corkey, B.E.; Grant, S.F.; Gavin, J.R., III; Aguilar, R.B.; Herman, M.E. A unified pathophysiological construct of diabetes and its complications. Trends Endocrinol. Metab. 2017, 28, 645–655. [Google Scholar] [CrossRef] [PubMed]
- Ruta, L.; Magliano, D.; Lemesurier, R.; Taylor, H.; Zimmet, P.; Shaw, J. Prevalence of diabetic retinopathy in Type 2 diabetes in developing and developed countries. Diabet. Med. 2013, 30, 387–398. [Google Scholar] [CrossRef] [PubMed]
- Lachin, J.M.; Genuth, S.; Nathan, D.M.; Zinman, B.; Rutledge, B.N. Effect of glycemic exposure on the risk of microvascular complications in the diabetes control and complications trial—Revisited. Diabetes 2008, 57, 995–1001. [Google Scholar] [CrossRef] [Green Version]
- Klein, R.; Klein, B.E.; Moss, S.E.; Cruickshanks, K.J. The Wisconsin Epidemiologic Study of Diabetic Retinopathy: XVII: The 14-year incidence and progression of diabetic retinopathy and associated risk factors in type 1 diabetes. Ophthalmology 1998, 105, 1801–1815. [Google Scholar] [CrossRef]
- Hietala, K.; Forsblom, C.; Summanen, P.; Groop, P.H. Heritability of proliferative diabetic retinopathy. Diabetes 2008, 57, 2176–2180. [Google Scholar] [CrossRef] [Green Version]
- Frank, R.N.; Keirn, R.J.; Kennedy, A.; Frank, K.W. Galactose-induced retinal capillary basement membrane thickening: Prevention by Sorbinil. Investig. Ophthalmol. Vis. Sci. 1983, 24, 1519–1524. [Google Scholar]
- Engerman, R.L.; Kern, T.S. Progression of incipient diabetic retinopathy during good glycemic control. Diabetes 1987, 36, 808–812. [Google Scholar] [CrossRef]
- Giugliano, D.; Ceriello, A.; Paolisso, G. Oxidative stress and diabetic vascular complications. Diabetes Care 1996, 19, 257–267. [Google Scholar] [CrossRef]
- Sinclair, S.H.; Schwartz, S.S. Diabetic retinopathy—An underdiagnosed and undertreated inflammatory, neuro-vascular complication of diabetes. Front. Endocrinol. 2019, 10, 843. [Google Scholar] [CrossRef] [Green Version]
- Gerendas, B.S.; Bogunovic, H.; Sadeghipour, A.; Schlegl, T.; Langs, G.; Waldstein, S.M.; Schmidt-Erfurth, U. Computational image analysis for prognosis determination in DME. Vis. Res. 2017, 139, 204–210. [Google Scholar] [CrossRef]
- Aiello, L.; Gardner, T.; King, G.; Blanken-ship, G.; Cavallerano, J.; Ferris, F. Diabetes Care (technical review). Diabetes Care 1998, 21, 56. [Google Scholar]
- Soomro, T.A.; Gao, J.; Khan, T.; Hani, A.F.M.; Khan, M.A.; Paul, M. Computerised approaches for the detection of diabetic retinopathy using retinal fundus images: A survey. Pattern Anal. Appl. 2017, 20, 927–961. [Google Scholar] [CrossRef]
- Sarki, R.; Ahmed, K.; Wang, H.; Zhang, Y. Automatic detection of diabetic eye disease through deep learning using fundus images: A survey. IEEE Access 2020, 8, 151133–151149. [Google Scholar] [CrossRef]
- Asiri, N.; Hussain, M.; Al Adel, F.; Alzaidi, N. Deep learning based computer-aided diagnosis systems for diabetic retinopathy: A survey. Artif. Intell. Med. 2019, 99, 101701. [Google Scholar] [CrossRef] [Green Version]
- ETDRS Research Group. Early photocoagulation for diabetic retinopathy. ETDRS report number 9. Ophthalmology 1991, 98, 766–785. [Google Scholar] [CrossRef]
- Klein, R.; Klein, B.E.; Moss, S.E.; Davis, M.D.; DeMets, D.L. The Wisconsin Epidemiologic Study of Diabetic Retinopathy: X. Four-year incidence and progression of diabetic retinopathy when age at diagnosis is 30 years or more. Arch. Ophthalmol. 1989, 107, 244–249. [Google Scholar] [CrossRef]
- Diabetic Retinopathy Study Research Group. Diabetic retinopathy study report number 6. Design, methods, and baseline results. Report number 7. A modification of the Airlie House classification of diabetic retinopathy. Prepared by the diabetic retinopathy. Investig. Ophthalmol. Vis. Sci. 1981, 21, 1–226. [Google Scholar]
- Early Treatment Diabetic Retinopathy Study Research Group. Classification of diabetic retinopathy from fluorescein angiograms: ETDRS report number 11. Ophthalmology 1991, 98, 807–822. [Google Scholar] [CrossRef]
- Early Treatment Diabetic Retinopathy Study Research Group. Grading diabetic retinopathy from stereoscopic color fundus photographs—An extension of the modified Airlie House classification: ETDRS report number 10. Ophthalmology 1991, 98, 786–806. [Google Scholar] [CrossRef]
- Wilkinson, C.; Ferris, F.L., III; Klein, R.E.; Lee, P.P.; Agardh, C.D.; Davis, M.; Dills, D.; Kampik, A.; Pararajasegaram, R.; Verdaguer, J.T.; et al. Proposed international clinical diabetic retinopathy and diabetic macular edema disease severity scales. Ophthalmology 2003, 110, 1677–1682. [Google Scholar] [CrossRef]
- Ffytche, T.; Shilling, J.; Chisholm, I.; Federman, J. Indications for fluorescein angiography in disease of the ocular fundus: A review. J. R. Soc. Med. 1980, 73, 362–365. [Google Scholar] [CrossRef] [Green Version]
- Novotny, H.R.; Alvis, D.L. A method of photographing fluorescence in circulating blood in the human retina. Circulation 1961, 24, 82–86. [Google Scholar] [CrossRef] [Green Version]
- Rabb, M.F.; Burton, T.C.; Schatz, H.; Yannuzzi, L.A. Fluorescein angiography of the fundus: A schematic approach to interpretation. Surv. Ophthalmol. 1978, 22, 387–403. [Google Scholar] [CrossRef]
- Mendis, K.R.; Balaratnasingam, C.; Yu, P.; Barry, C.J.; McAllister, I.L.; Cringle, S.J.; Yu, D.Y. Correlation of histologic and clinical images to determine the diagnostic value of fluorescein angiography for studying retinal capillary detail. Investig. Ophthalmol. Vis. Sci. 2010, 51, 5864–5869. [Google Scholar] [CrossRef] [Green Version]
- Balbino, M.; Silva, G.; Correia, G.C.T.P. Anafilaxia com convulsões após angiografia com fluoresceína em paciente ambulatorial. Einstein 2012, 10, 374–376. [Google Scholar] [CrossRef] [Green Version]
- Johnson, R.N.; McDonald, H.R.; Schatz, H. Rash, fever, and chills after intravenous fluorescein angiography. Am. J. Ophthalmol. 1998, 126, 837–838. [Google Scholar] [CrossRef]
- Yannuzzi, L.A.; Rohrer, K.T.; Tindel, L.J.; Sobel, R.S.; Costanza, M.A.; Shields, W.; Zang, E. Fluorescein angiography complication survey. Ophthalmology 1986, 93, 611–617. [Google Scholar] [CrossRef]
- Early Treatment Diabetic Retinopathy Study Research Group. Fundus photographic risk factors for progression of diabetic retinopathy: ETDRS report number 12. Ophthalmology 1991, 98, 823–833. [Google Scholar]
- Verdaguer, T. Screening para retinopatia diabetica en Latino America. Resultados. Rev. Soc. Brasil Retina Vitreo 2001, 4, 14–15. [Google Scholar]
- Fukuda, M. Clinical arrangement of classification of diabetic retinopathy. Tohoku J. Exp. Med. 1983, 141, 331–335. [Google Scholar] [CrossRef] [PubMed] [Green Version]
- Gyawali, R.; Toomey, M.; Stapleton, F.; Zangerl, B.; Dillon, L.; Keay, L.; Liew, G.; Jalbert, I. Quality of the Australian National Health and Medical Research Council’s clinical practice guidelines for the management of diabetic retinopathy. Clin. Exp. Optom. 2021, 104, 864–870. [Google Scholar] [CrossRef] [PubMed]
- Huang, D.; Swanson, E.A.; Lin, C.P.; Schuman, J.S.; Stinson, W.G.; Chang, W.; Hee, M.R.; Flotte, T.; Gregory, K.; Puliafito, C.A.; et al. Optical coherence tomography. Science 1991, 254, 1178–1181. [Google Scholar] [CrossRef] [PubMed] [Green Version]
- Rivellese, M.; George, A.; Sulkes, D.; Reichel, E.; Puliafito, C. Optical coherence tomography after laser photocoagulation for clinically significant macular edema. Ophthalmic Surgery Lasers Imaging Retin. 2000, 31, 192–197. [Google Scholar] [CrossRef]
- Agemy, S.A.; Scripsema, N.K.; Shah, C.M.; Chui, T.; Garcia, P.M.; Lee, J.G.; Gentile, R.C.; Hsiao, Y.S.; Zhou, Q.; Ko, T.; et al. Retinal vascular perfusion density mapping using optical coherence tomography angiography in normals and Diabetic Retinopathy patients. Retina 2015, 35, 2353–2363. [Google Scholar] [CrossRef] [PubMed]
- Di, G.; Weihong, Y.; Xiao, Z.; Zhikun, Y.; Xuan, Z.; Yi, Q.; Fangtian, D. A morphological study of the foveal avascular zone in patients with diabetes mellitus using optical coherence tomography angiography. Graefe’s Arch. Clin. Exp. Ophthalmol. 2016, 254, 873–879. [Google Scholar] [CrossRef]
- Freiberg, F.J.; Pfau, M.; Wons, J.; Wirth, M.A.; Becker, M.D.; Michels, S. Optical coherence tomography angiography of the foveal avascular zone in diabetic retinopathy. Graefe’s Arch. Clin. Exp. Ophthalmol. 2016, 254, 1051–1058. [Google Scholar] [CrossRef] [Green Version]
- Hwang, T.S.; Jia, Y.; Gao, S.S.; Bailey, S.T.; Lauer, A.r.K.; Flaxel, C.J.; Wilson, D.J.; Huang, D. Optical coherence tomography angiography features of diabetic RETINOPATHY. Retina 2015, 35, 2371. [Google Scholar] [CrossRef] [Green Version]
- Kim, D.Y.; Fingler, J.; Zawadzki, R.J.; Park, S.S.; Morse, L.S.; Schwartz, D.M.; Fraser, S.E.; Werner, J.S. Noninvasive imaging of the foveal avascular zone with high-speed, phase-variance optical coherence tomography. Investig. Ophthalmol. Vis. Sci. 2012, 53, 85–92. [Google Scholar] [CrossRef] [Green Version]
- Mastropasqua, R.; Di Antonio, L.; Di Staso, S.; Agnifili, L.; Di Gregorio, A.; Ciancaglini, M.; Mastropasqua, L. Optical coherence tomography angiography in retinal vascular diseases and choroidal neovascularization. J. Ophthalmol. 2015, 2015, 343515. [Google Scholar] [CrossRef]
- Takase, N.; Nozaki, M.; Kato, A.; Ozeki, H.; Yoshida, M.; Ogura, Y. Enlargement of foveal avascular zone in diabetic eyes evaluated by en face optical coherence tomography angiography. Retina 2015, 35, 2377–2383. [Google Scholar] [CrossRef]
- Mammo, Z.; Balaratnasingam, C.r.; Yu, P.; Xu, J.; Heisler, M.; Mackenzie, P.; Merkur, A.r.; Kirker, A.r.; Albiani, D.; Freund, K.B.; et al. Quantitative noninvasive angiography of the fovea centralis using speckle variance optical coherence tomography. Investig. Ophthalmol. Vis. Sci. 2015, 56, 5074–5086. [Google Scholar] [CrossRef] [Green Version]
- Tan, P.E.Z.; Balaratnasingam, C.r.; Xu, J.; Mammo, Z.; Han, S.X.; Mackenzie, P.; Kirker, A.r.W.; Albiani, D.; Merkur, A.r.B.; Sarunic, M.V.; et al. Quantitative comparison of retinal capillary images derived by speckle variance optical coherence tomography with histology. Investig. Ophthalmol. Vis. Sci. 2015, 56, 3989–3996. [Google Scholar] [CrossRef]
- Mo, S.; Krawitz, B.; Efstathiadis, E.; Geyman, L.; Weitz, R.; Chui, T.Y.; Carroll, J.; Dubra, A.; Rosen, R.B. Imaging foveal microvasculature: Optical coherence tomography angiography versus adaptive optics scanning light ophthalmoscope fluorescein angiography. Investig. Ophthalmol. Vis. Sci. 2016, 57, OCT130–OCT140. [Google Scholar] [CrossRef] [Green Version]
- Spaide, R.F.; Klancnik, J.M.; Cooney, M.J. Retinal vascular layers imaged by fluorescein angiography and optical coherence tomography angiography. JAMA Ophthalmol. 2015, 133, 45–50. [Google Scholar] [CrossRef]
- Arend, O.; Wolf, S.; Harris, A.; Reim, M. The relationship of macular microcirculation to visual acuity in diabetic patients. Arch. Ophthalmol. 1995, 113, 610–614. [Google Scholar] [CrossRef]
- Parodi, M.B.; Visintin, F.; Della Rupe, P.; Ravalico, G. Foveal avascular zone in macular branch retinal vein occlusion. Int. Ophthalmol. 1995, 19, 25–28. [Google Scholar] [CrossRef]
- Arend, O.; Wolf, S.; Jung, F.r.; Bertram, B.; Pöstgens, H.; Toonen, H.; Reim, M. Retinal microcirculation in patients with diabetes mellitus: Dynamic and morphological analysis of perifoveal capillary network. Br. J. Ophthalmol. 1991, 75, 514–518. [Google Scholar] [CrossRef]
- Bresnick, G.H.; Condit, R.; Syrjala, S.; Palta, M.; Groo, A.; Korth, K. Abnormalities of the foveal avascular zone in DIABETIC RETINOPATHY. Arch. Ophthalmol. 1984, 102, 1286–1293. [Google Scholar] [CrossRef]
- Conrath, J.; Giorgi, R.; Raccah, D.; Ridings, B. Foveal avascular zone in diabetic retinopathy: Quantitative vs. qualitative assessment. Eye 2005, 19, 322–326. [Google Scholar] [CrossRef] [Green Version]
- Mansour, A.; Schachat, A.R.; Bodiford, G.; Haymond, R. Foveal avascular zone in diabetes mellitus. Retina 1993, 13, 125–128. [Google Scholar] [CrossRef]
- Sanders, R.J.; Brown, G.C.; Rosenstein, R.B.; Magargal, L. Foveal avascular zone diameter and sickle cell disease. Arch. Ophthalmol. 1991, 109, 812–815. [Google Scholar] [CrossRef]
- Bennett, A.G.; Rudnicka, A.R.; Edgar, D.F. Improvements on Littmann’s method of determining the size of retinal features by fundus photography. Graefe’s Arch. Clin. Exp. Ophthalmol. 1994, 232, 361–367. [Google Scholar] [CrossRef]
- Popovic, Z.; Knutsson, P.; Thaung, J.; Owner-Petersen, M.; Sjöstrand, J. Noninvasive imaging of human foveal capillary network using dual-conjugate adaptive optics. Investig. Ophthalmol. Vis. Sci. 2011, 52, 2649–2655. [Google Scholar] [CrossRef] [Green Version]
- Tam, J.; Dhamdhere, K.P.; Tiruveedhula, P.; Manzanera, S.; Barez, S.; Bearse, M.A.; Adams, A.J.; Roorda, A. Disruption of the retinal parafoveal capillary network in type 2 diabetes before the onset of DIABETIC RETINOPATHY. Investig. Ophthalmol. Vis. Sci. 2011, 52, 9257–9266. [Google Scholar] [CrossRef]
- Hutchinson, A.; McIntosh, A.; Peters, J.; O’keeffe, C.; Khunti, K.; Baker, R.; Booth, A. Effectiveness of screening and monitoring tests for diabetic retinopathy–a systematic review. Diabet. Med. 2000, 17, 495–506. [Google Scholar] [CrossRef]
- Sussman, E.J.; Tsiaras, W.G.; Soper, K.A. Diagnosis of diabetic eye disease. JAMA 1982, 247, 3231–3234. [Google Scholar] [CrossRef]
- Bursell, S.E.; Cavallerano, J.D.; Cavallerano, A.A.; Clermont, A.C.; Birkmire-Peters, D.; Aiello, L.P.; Aiello, L.M.; Joslin Vision Network Research Team. Stereo nonmydriatic digital-video color retinal imaging compared with Early Treatment Diabetic Retinopathy Study seven standard field 35-mm stereo color photos for determining level of diabetic retinopathy. Ophthalmology 2001, 108, 572–585. [Google Scholar] [CrossRef]
- Cavallerano, A.A.; Cavallerano, J.D.; Katalinic, P.; Tolson, A.M.; Aiello, L.P.; Aiello, L.M. Use of Joslin Vision Network digital-video nonmydriatic retinal imaging to assess diabetic retinopathy in a clinical program. Retina 2003, 23, 215–223. [Google Scholar] [CrossRef]
- Fransen, S.R.; Leonard-Martin, T.C.; Feuer, W.J.; Hildebrand, P.L.; Inoveon Health Research Group. Clinical evaluation of patients with diabetic retinopathy: Accuracy of the Inoveon diabetic retinopathy-3DT system. Ophthalmology 2002, 109, 595–601. [Google Scholar] [CrossRef]
- Zeimer, R.; Zou, S.; Meeder, T.; Quinn, K.; Vitale, S. A fundus camera dedicated to the screening of diabetic retinopathy in the primary-care physician’s office. Investig. Ophthalmol. Vis. Sci. 2002, 43, 1581–1587. [Google Scholar]
- Taylor, D.; Fisher, J.; Jacob, J.; Tooke, J. The use of digital cameras in a mobile retinal screening environment. Diabet. Med. 1999, 16, 680–686. [Google Scholar] [CrossRef] [PubMed]
- Pugh, J.A.; Jacobson, J.M.; Van Heuven, W.; Watters, J.A.; Tuley, M.R.; Lairson, D.R.; Lorimor, R.J.; Kapadia, A.S.; Velez, R. Screening for diabetic retinopathy: The wide-angle retinal camera. Diabetes Care 1993, 16, 889–895. [Google Scholar] [CrossRef] [PubMed]
- Joannou, J.; Kalk, W.; Ntsepo, S.; Berzin, M.; Joffe, B.; Raal, F.; Sachs, E.; van der Merwe, M.; Wing, J.; Mahomed, I. Screening for Diabetic retinopathy in South Africa with 60 retinal colour photography. J. Intern. Med. 1996, 239, 43–47. [Google Scholar] [CrossRef]
- Abràmoff, M.D.; Lou, Y.; Erginay, A.; Clarida, W.; Amelon, R.; Folk, J.C.; Niemeijer, M. Improved automated detection of diabetic retinopathy on a publicly available dataset through integration of deep learning. Investig. Ophthalmol. Vis. Sci. 2016, 57, 5200–5206. [Google Scholar] [CrossRef] [Green Version]
- Chen, X.; Niemeijer, M.; Zhang, L.; Lee, K.; Abramoff, M.D.; Sonka, M. Three-Dimensional Segmentation of Fluid-Associated Abnormalities in Retinal OCT: Probability Constrained Graph-Search-Graph-Cut. IEEE Trans. Med. Imaging 2012, 31, 1521–1531. [Google Scholar] [CrossRef] [Green Version]
- Sophie, R.; Lu, N.; Campochiaro, P.A. Predictors of functional and anatomic outcomes in patients with diabetic macular edema treated with ranibizumab. Ophthalmology 2015, 122, 1395–1401. [Google Scholar] [CrossRef] [Green Version]
- Yohannan, J.; Bittencourt, M.; Sepah, Y.J.; Hatef, E.; Sophie, R.; Moradi, A.R.; Liu, H.; Ibrahim, M.; Do, D.V.; Coulantuoni, E.; et al. Association of retinal sensitivity to integrity of photoreceptor inner/outer segment junction in patients with diabetic macular edema. Ophthalmology 2013, 120, 1254–1261. [Google Scholar] [CrossRef]
- Gerendas, B.S.; Waldstein, S.M.; Simader, C.; Deak, G.; Hajnajeeb, B.; Zhang, L.; Bogunovic, H.; Abramoff, M.D.; Kundi, M.; Sonka, M.; et al. Three-dimensional automated choroidal volume assessment on standard spectral-domain optical coherence tomography and correlation with the level of diabetic macular edema. Am. J. Ophthalmol. 2014, 158, 1039–1048. [Google Scholar] [CrossRef] [Green Version]
- Schlegl, T.; Waldstein, S.M.; Vogl, W.D.; Schmidt-Erfurth, U.; Langs, G. Predicting semantic descriptions from medical images with convolutional neural networks. Inf. Process. Med. Imaging 2015, 24, 437–448. [Google Scholar]
- Schmidt-Erfurth, U.; Waldstein, S.M.; Deak, G.G.; Kundi, M.; Simader, C. Pigment epithelial detachment followed by retinal cystoid degeneration leads to vision loss in treatment of neovascular age-related macular degeneration. Ophthalmology 2015, 122, 822–832. [Google Scholar] [CrossRef]
- Ritter, M.; Simader, C.; Bolz, M.; Deák, G.G.; Mayr-Sponer, U.; Sayegh, R.; Kundi, M.; Schmidt-Erfurth, U.M. Intraretinal cysts are the most relevant prognostic biomarker in neovascular age-related macular degeneration independent of the therapeutic strategy. Br. J. Ophthalmol. 2014, 98, 1629–1635. [Google Scholar] [CrossRef]
- Elsharkawy, M.; Sharafeldeen, A.; Soliman, A.; Khalifa, F.; Widjajahakim, R.; Switala, A.; Elnakib, A.; Schaal, S.; Sandhu, H.S.; Seddon, J.M.; et al. Automated diagnosis and grading of dry age-related macular degeneration using optical coherence tomography imaging. Investig. Ophthalmol. Vis. Sci. 2021, 62, 107. [Google Scholar]
- Elsharkawy, M.; Elrazzaz, M.; Ghazal, M.; Alhalabi, M.; Soliman, A.; Mahmoud, A.; El-Daydamony, E.; Atwan, A.; Thanos, A.; Sandhu, H.S.; et al. Role of Optical Coherence Tomography Imaging in Predicting Progression of Age-Related Macular Disease: A Survey. Diagnostics 2021, 11, 2313. [Google Scholar] [CrossRef]
- Gerendas, B.; Simader, C.; Deak, G.G.; Prager, S.G.r.; Lammer, J.; Waldstein, S.M.; Kundi, M.; Schmidt-Erfurth, U. Morphological parameters relevant for visual and anatomic outcomes during anti-VEGF therapy of diabetic macular edema in the RESTORE trial. Investig. Ophthalmol. Vis. Sci. 2014, 55, 1791. [Google Scholar]
- Welikala, R.A.; Fraz, M.M.; Dehmeshki, J.; Hoppe, A.; Tah, V.; Mann, S.; Williamson, T.H.; Barman, S.A. Genetic algorithm based feature selection combined with dual classification for the automated detection of proliferative diabetic retinopathy. Comput. Med. Imaging Graph. 2015, 43, 64–77. [Google Scholar] [CrossRef] [Green Version]
- Decencière, E.; Zhang, X.; Cazuguel, G.; Lay, B.; Cochener, B.; Trone, C.; Gain, P.; Ordonez, R.; Massin, P.; Erginay, A.; et al. Feedback on a publicly distributed image database: The Messidor database. Image Anal. Stereol. 2014, 33, 231–234. [Google Scholar] [CrossRef] [Green Version]
- Prasad, D.K.; Vibha, L.; Venugopal, K. Early detection of diabetic retinopathy from digital retinal fundus images. In Proceedings of the 2015 IEEE Recent Advances in Intelligent Computational Systems (RAICS), Trivandrum, India, 10–12 December 2015; pp. 240–245. [Google Scholar]
- DIARETDB1—Standard Diabetic Retinopathy Database. Available online: http://www2.it.lut.fi/project/imageret/diaretdb1/index.html (accessed on 1 February 2022).
- Mahendran, G.; Dhanasekaran, R. Investigation of the severity level of diabetic retinopathy using supervised classifier algorithms. Comput. Electr. Eng. 2015, 45, 312–323. [Google Scholar] [CrossRef]
- Bhatkar, A.P.; Kharat, G. Detection of diabetic retinopathy in retinal images using MLP classifier. In Proceedings of the 2015 IEEE International Symposium on Nanoelectronic and Information Systems, Indore, India, 21–23 December 2015; pp. 331–335. [Google Scholar]
- Labhade, J.D.; Chouthmol, L.; Deshmukh, S. Diabetic retinopathy detection using soft computing techniques. In Proceedings of the 2016 International Conference on Automatic Control and Dynamic Optimization Techniques (ICACDOT), Pune, India, 9–10 September 2016; pp. 175–178. [Google Scholar]
- Rahim, S.S.; Palade, V.; Shuttleworth, J.; Jayne, C. Automatic screening and classification of diabetic retinopathy and maculopathy using fuzzy image processing. Brain Inform. 2016, 3, 249–267. [Google Scholar] [CrossRef]
- Bhatia, K.; Arora, S.; Tomar, R. Diagnosis of diabetic retinopathy using machine learning classification algorithm. In Proceedings of the 2016 2nd International Conference on Next Generation Computing Technologies (NGCT), Dehradun, India, 14–16 October 2016; pp. 347–351. [Google Scholar]
- Gulshan, V.; Peng, L.; Coram, M.; Stumpe, M.C.; Wu, D.; Narayanaswamy, A.; Venugopalan, S.; Widner, K.; Madams, T.; Cuadros, J.; et al. Development and validation of a deep learning algorithm for detection of diabetic retinopathy in retinal fundus photographs. JAMA 2016, 316, 2402–2410. [Google Scholar] [CrossRef]
- Colas, E.; Besse, A.; Orgogozo, A.; Schmauch, B.; Meric, N.; Besse, E. Deep learning approach for diabetic retinopathy screening. Acta Ophthalmol. 2016, 94, 635. [Google Scholar] [CrossRef]
- Ghosh, R.; Ghosh, K.; Maitra, S. Automatic detection and classification of diabetic retinopathy stages using CNN. In Proceedings of the 2017 4th International Conference on Signal Processing and Integrated Networks (SPIN), Noida, India, 2–3 February 2017; pp. 550–554. [Google Scholar]
- Islam, M.; Dinh, A.V.; Wahid, K.A. Automated diabetic retinopathy detection using bag of words approach. J. Biomed. Sci. Eng. 2017, 10, 86–96. [Google Scholar] [CrossRef] [Green Version]
- Carrera, E.V.; González, A.; Carrera, R. Automated detection of diabetic retinopathy using SVM. In Proceedings of the 2017 IEEE XXIV International Conference on Electronics, Electrical Engineering and Computing (INTERCON), Cusco, Peru, 15–18 August 2017; pp. 1–4. [Google Scholar]
- Somasundaram, S.K.; Alli, P. A machine learning ensemble classifier for early prediction of diabetic retinopathy. J. Med. Syst. 2017, 41, 1–12. [Google Scholar]
- Kälviäinen, R.; Uusitalo, H. DIARETDB1 diabetic retinopathy database and evaluation protocol. Medical Image Understanding and Analysis. 2007, Volume 2007, p. 61. Available online: http://citeseerx.ist.psu.edu/viewdoc/download?doi=10.1.1.692.2635&rep=rep1&type=pdf#page=72 (accessed on 28 April 2022).
- ElTanboly, A.; Ismail, M.; Shalaby, A.; Switala, A.; El-Baz, A.; Schaal, S.; Gimel’farb, G.; El-Azab, M. A computer-aided diagnostic system for detecting diabetic retinopathy in optical coherence tomography images. Med. Phys. 2017, 44, 914–923. [Google Scholar] [CrossRef]
- Takahashi, H.; Tampo, H.; Arai, Y.; Inoue, Y.; Kawashima, H. Applying artificial intelligence to disease staging: Deep learning for improved staging of diabetic retinopathy. PLoS ONE 2017, 12, e0179790. [Google Scholar] [CrossRef] [Green Version]
- Quellec, G.; Charrière, K.; Boudi, Y.; Cochener, B.; Lamard, M. Deep image mining for diabetic retinopathy screening. Med. Image Anal. 2017, 39, 178–193. [Google Scholar] [CrossRef] [Green Version]
- Ting, D.S.W.; Cheung, C.Y.L.; Lim, G.; Tan, G.S.W.; Quang, N.D.; Gan, A.; Hamzah, H.; Garcia-Franco, R.; San Yeo, I.Y. Development and validation of a deep learning system for diabetic retinopathy and related eye diseases using retinal images from multiethnic populations with diabetes. JAMA 2017, 318, 2211–2223. [Google Scholar] [CrossRef]
- Wang, Z.; Yin, Y.; Shi, J.; Fang, W.; Li, H.; Wang, X. Zoom-in-net: Deep mining lesions for diabetic retinopathy detection. In Proceedings of the International Conference on Medical Image Computing and Computer-Assisted Intervention, Quebec City, QC, Canada, 11–13 September 2017; pp. 267–275. [Google Scholar]
- Eladawi, N.; Elmogy, M.; Fraiwan, L.; Pichi, F.; Ghazal, M.; Aboelfetouh, A.; Riad, A.; Keynton, R.; Schaal, S.; El-Baz, A. Early diagnosis of diabetic retinopathy in octa images based on local analysis of retinal blood vessels and foveal avascular zone. In Proceedings of the 2018 24th International Conference on Pattern Recognition (ICPR), Beijing, China, 20–24 August 2018; pp. 3886–3891. [Google Scholar]
- Dutta, S.; Manideep, B.; Basha, S.M.; Caytiles, R.D.; Iyengar, N. Classification of diabetic retinopathy images by using deep learning models. Int. J. Grid Distrib. Comput. 2018, 11, 89–106. [Google Scholar] [CrossRef]
- ElTanboly, A.; Ghazal, M.; Khalil, A.; Shalaby, A.; Mahmoud, A.; Switala, A.; El-Azab, M.; Schaal, S.; El-Baz, A. An integrated framework for automatic clinical assessment of diabetic retinopathy grade using spectral domain OCT images. In Proceedings of the 2018 IEEE 15th International Symposium on Biomedical Imaging (ISBI 2018), Washington, DC, USA, 4–7 April 2018; pp. 1431–1435. [Google Scholar]
- Zhang, X.; Zhang, W.; Fang, M.; Xue, J.; Wu, L. Automatic classification of diabetic retinopathy based on convolutional neural networks. In Proceedings of the 2018 International Conference on Image and Video Processing, and Artificial Intelligence. International Society for Optics and Photonics, Shanghai, China, 15–17 August 2018; Volume 10836, p. 1083608. [Google Scholar]
- Costa, P.; Galdran, A.; Smailagic, A.; Campilho, A. A weakly-supervised framework for interpretable diabetic retinopathy detection on retinal images. IEEE Access 2018, 6, 18747–18758. [Google Scholar] [CrossRef]
- Pires, R.; Jelinek, H.F.; Wainer, J.; Goldenstein, S.; Valle, E.; Rocha, A. Assessing the need for referral in automatic diabetic retinopathy detection. IEEE Trans. Biomed. Eng. 2013, 60, 3391–3398. [Google Scholar] [CrossRef]
- Chakrabarty, N. A deep learning method for the detection of diabetic retinopathy. In Proceedings of the 2018 5th IEEE Uttar Pradesh Section International Conference on Electrical, Electronics and Computer Engineering (UPCON), Gorakhpur, India, 2–4 November 2018; pp. 1–5. [Google Scholar]
- Kwasigroch, A.; Jarzembinski, B.; Grochowski, M. Deep CNN based decision support system for detection and assessing the stage of diabetic retinopathy. In Proceedings of the 2018 International Interdisciplinary PhD Workshop (IIPhDW), Swinoujscie, Poland, 9–12 May 2018; pp. 111–116. [Google Scholar]
- EyePACS, LLC. Available online: http://www.eyepacs.com/ (accessed on 1 February 2022).
- Li, F.; Liu, Z.; Chen, H.; Jiang, M.; Zhang, X.; Wu, Z. Automatic detection of diabetic retinopathy in retinal fundus photographs based on deep learning algorithm. Transl. Vis. Sci. Technol. 2019, 8, 4. [Google Scholar] [CrossRef] [PubMed] [Green Version]
- Nagasawa, T.; Tabuchi, H.; Masumoto, H.; Enno, H.; Niki, M.; Ohara, Z.; Yoshizumi, Y.; Ohsugi, H.; Mitamura, Y. Accuracy of ultrawide-field fundus ophthalmoscopy-assisted deep learning for detecting treatment-naïve proliferative diabetic retinopathy. Int. Ophthalmol. 2019, 39, 2153–2159. [Google Scholar] [CrossRef] [PubMed] [Green Version]
- Metan, A.C.; Lambert, A.; Pickering, M. Small Scale Feature Propagation Using Deep Residual Learning for Diabetic Retinopathy Classification. In Proceedings of the 2019 IEEE 4th International Conference on Image, Vision and Computing (ICIVC), Xiamen, China, 5–7 July 2019; pp. 392–396. [Google Scholar]
- Qummar, S.; Khan, F.G.; Shah, S.; Khan, A.; Shamshirband, S.; Rehman, Z.U.; Khan, I.A.; Jadoon, W. A deep learning ensemble approach for diabetic retinopathy detection. IEEE Access 2019, 7, 150530–150539. [Google Scholar] [CrossRef]
- Sayres, R.; Taly, A.; Rahimy, E.; Blumer, K.; Coz, D.; Hammel, N.; Krause, J.; Narayanaswamy, A.; Rastegar, Z.; Wu, D.; et al. Using a deep learning algorithm and integrated gradients explanation to assist grading for diabetic retinopathy. Ophthalmology 2019, 126, 552–564. [Google Scholar] [CrossRef] [Green Version]
- Sengupta, S.; Singh, A.; Zelek, J.; Lakshminarayanan, V. Cross-domain diabetic retinopathy detection using deep learning. Appl. Mach. Learn. Int. Soc. Opt. Photonics 2019, 11139, 111390V. [Google Scholar]
- Hathwar, S.B.; Srinivasa, G. Automated grading of diabetic retinopathy in retinal fundus images using deep learning. In Proceedings of the 2019 IEEE International Conference on Signal and Image Processing Applications (ICSIPA), Kuala Lumpur, 17–19 September 2019; pp. 73–77. [Google Scholar]
- Li, X.; Shen, L.; Shen, M.; Tan, F.; Qiu, C.S. Deep learning based early stage diabetic retinopathy detection using optical coherence tomography. Neurocomputing 2019, 369, 134–144. [Google Scholar] [CrossRef]
- Heisler, M.; Karst, S.; Lo, J.; Mammo, Z.; Yu, T.; Warner, S.; Maberley, D.; Beg, M.F.; Navajas, E.V.; Sarunic, M.V. Ensemble deep learning for diabetic retinopathy detection using optical coherence tomography angiography. Transl. Vis. Sci. Technol. 2020, 9, 20. [Google Scholar] [CrossRef] [Green Version]
- Alam, M.; Zhang, Y.; Lim, J.I.; Chan, R.V.; Yang, M.; Yao, X. Quantitative optical coherence tomography angiography features for objective classification and staging of diabetic retinopathy. Retina 2020, 40, 322–332. [Google Scholar] [CrossRef]
- Zang, P.; Gao, L.; Hormel, T.T.; Wang, J.; You, Q.; Hwang, T.S.; Jia, Y. DcardNet: Diabetic retinopathy classification at multiple levels based on structural and angiographic optical coherence tomography. IEEE Trans. Biomed. Eng. 2020, 68, 1859–1870. [Google Scholar] [CrossRef]
- Ghazal, M.; Ali, S.S.; Mahmoud, A.H.; Shalaby, A.M.; El-Baz, A. Accurate detection of non-proliferative diabetic retinopathy in optical coherence tomography images using convolutional neural networks. IEEE Access 2020, 8, 34387–34397. [Google Scholar] [CrossRef]
- Sandhu, H.S.; Elmogy, M.; Sharafeldeen, A.T.; Elsharkawy, M.; El-Adawy, N.; Eltanboly, A.; Shalaby, A.; Keynton, R.; El-Baz, A. Automated diagnosis of diabetic retinopathy using clinical biomarkers, optical coherence tomography, and optical coherence tomography angiography. Am. J. Ophthalmol. 2020, 216, 201–206. [Google Scholar] [CrossRef]
- Narayanan, B.N.; Hardie, R.C.; De Silva, M.S.; Kueterman, N.K. Hybrid machine learning architecture for automated detection and grading of retinal images for diabetic retinopathy. J. Med. Imaging 2020, 7, 034501. [Google Scholar] [CrossRef]
- Shankar, K.; Sait, A.R.W.; Gupta, D.; Lakshmanaprabu, S.; Khanna, A.; Pandey, H.M. Automated detection and classification of fundus diabetic retinopathy images using synergic deep learning model. Pattern Recognit. Lett. 2020, 133, 210–216. [Google Scholar] [CrossRef]
- Ryu, G.; Lee, K.; Park, D.; Park, S.H.; Sagong, M. A deep learning model for identifying diabetic retinopathy using optical coherence tomography angiography. Sci. Rep. 2021, 11, 1–9. [Google Scholar] [CrossRef]
- He, A.; Li, T.; Li, N.; Wang, K.; Fu, H. CABNet: Category Attention Block for Imbalanced Diabetic Retinopathy Grading. IEEE Trans. Med. Imaging 2021, 40, 143–153. [Google Scholar] [CrossRef]
- Li, T.; Gao, Y.; Wang, K.; Guo, S.; Liu, H.; Kang, H. Diagnostic assessment of deep learning algorithms for diabetic retinopathy screening. Inf. Sci. 2019, 501, 511–522. [Google Scholar] [CrossRef]
- Saeed, F.; Hussain, M.; Aboalsamh, H.A. Automatic diabetic retinopathy diagnosis using adaptive fine-tuned convolutional neural network. IEEE Access 2021, 9, 41344–41359. [Google Scholar] [CrossRef]
- Wang, Y.; Yu, M.; Hu, B.; Jin, X.; Li, Y.; Zhang, X.; Zhang, Y.; Gong, D.; Wu, C.; Zhang, B.; et al. Deep learning-based detection and stage grading for optimising diagnosis of diabetic retinopathy. Diabetes/Metab. Res. Rev. 2021, 37, e3445. [Google Scholar] [CrossRef]
- Liu, Z.; Wang, C.; Cai, X.; Jiang, H.; Wang, J. Discrimination of Diabetic Retinopathy From Optical Coherence Tomography Angiography Images Using Machine Learning Methods. IEEE Access 2021, 9, 51689–51694. [Google Scholar] [CrossRef]
- Sharafeldeen, A.; Elsharkawy, M.; Khalifa, F.; Soliman, A.; Ghazal, M.; AlHalabi, M.; Yaghi, M.; Alrahmawy, M.; Elmougy, S.; Sandhu, H.; et al. Precise higher-order reflectivity and morphology models for early diagnosis of diabetic retinopathy using OCT images. Sci. Rep. 2021, 11, 1–16. [Google Scholar] [CrossRef]
- Hsieh, Y.T.; Chuang, L.M.; Jiang, Y.D.; Chang, T.J.; Yang, C.M.; Yang, C.H.; Chan, L.W.; Kao, T.Y.; Chen, T.C.; Lin, H.C.; et al. Application of deep learning image assessment software VeriSee™ for diabetic retinopathy screening. J. Formos. Med Assoc. 2021, 120, 165–171. [Google Scholar] [CrossRef]
- Khan, Z.; Khan, F.G.; Khan, A.; Rehman, Z.U.; Shah, S.; Qummar, S.; Ali, F.; Pack, S. Diabetic Retinopathy Detection Using VGG-NIN a Deep Learning Architecture. IEEE Access 2021, 9, 61408–61416. [Google Scholar] [CrossRef]
- Wang, X.; Han, Y.; Sun, G.; Yang, F.; Liu, W.; Luo, J.; Cao, X.; Yin, P.; Myers, F.L.; Zhou, L. Detection of the Microvascular Changes of Diabetic Retinopathy Progression Using Optical Coherence Tomography Angiography. Transl. Vis. Sci. Technol. 2021, 10, 31. [Google Scholar] [CrossRef]
- Abdelsalam, M.M.; Zahran, M. A novel approach of diabetic retinopathy early detection based on multifractal geometry analysis for OCTA macular images using support vector machine. IEEE Access 2021, 9, 22844–22858. [Google Scholar] [CrossRef]
- Gao, Z.; Jin, K.; Yan, Y.; Liu, X.; Shi, Y.; Ge, Y.; Pan, X.; Lu, Y.; Wu, J.; Wang, Y.; et al. End-to-end diabetic retinopathy grading based on fundus fluorescein angiography images using deep learning. Graefe’s Arch. Clin. Exp. Ophthalmol. 2022, 260, 1–11. [Google Scholar] [CrossRef] [PubMed]
- Elsharkawy, M.; Sharafeldeen, A.; Soliman, A.; Khalifa, F.; Ghazal, M.; El-Daydamony, E.; Atwan, A.; Sandhu, H.S.; El-Baz, A. A Novel Computer-Aided Diagnostic System for Early Detection of Diabetic Retinopathy Using 3D-OCT Higher-Order Spatial Appearance Model. Diagnostics 2022, 12, 461. [Google Scholar] [CrossRef] [PubMed]
- Zia, F.; Irum, I.; Qadri, N.N.; Nam, Y.; Khurshid, K.; Ali, M.; Ashraf, I.; Khan, M.A. A Multilevel Deep Feature Selection Framework for Diabetic Retinopathy Image Classification. Comput. Mater. Contin 2022, 70, 2261–2276. [Google Scholar] [CrossRef]
- kag 2019. APTOS 2019 Blindness Detection. Available online: https://www.kaggle.com/c/aptos2019-blindness-detection. (accessed on 2 February 2022).
- Tsai, C.Y.; Chen, C.T.; Chen, G.A.; Yeh, C.F.; Kuo, C.T.; Hsiao, Y.C.; Hu, H.Y.; Tsai, I.L.; Wang, C.H.; Chen, J.R.; et al. Necessity of Local Modification for Deep Learning Algorithms to Predict Diabetic Retinopathy. Int. J. Environ. Res. Public Health 2022, 19, 1204. [Google Scholar] [CrossRef]
- Das, S.; Saha, S.K. Diabetic retinopathy detection and classification using CNN tuned by genetic algorithm. Multimed. Tools Appl. 2022, 81, 8007–8020. [Google Scholar] [CrossRef]
- Singh, H.; Sharma, V.; Singh, D. Comparative analysis of proficiencies of various textures and geometric features in breast mass classification using k-nearest neighbor. Vis. Comput. Ind. Biomed. Art 2022, 5, 1–19. [Google Scholar] [CrossRef]
- Sharafeldeen, A.; Elsharkawy, M.; Khaled, R.; Shaffie, A.; Khalifa, F.; Soliman, A.; Abdel Razek, A.A.; Hussein, M.M.; Taman, S.; Naglah, A.; et al. Texture and shape analysis of diffusion-weighted imaging for thyroid nodules classification using machine learning. Med. Phys. 2021, 49, 988–999. [Google Scholar] [CrossRef]
- Elsharkawy, M.; Sharafeldeen, A.; Taher, F.; Shalaby, A.; Soliman, A.; Mahmoud, A.; Ghazal, M.; Khalil, A.; Alghamdi, N.S.; Razek, A.A.K.A.; et al. Early assessment of lung function in coronavirus patients using invariant markers from chest X-rays images. Sci. Rep. 2021, 11, 1–11. [Google Scholar] [CrossRef]
- Zwanenburg, A.; Vallières, M.; Abdalah, M.A.; Aerts, H.J.W.L.; Andrearczyk, V.; Apte, A.; Ashrafinia, S.; Bakas, S.; Beukinga, R.J.; Boellaard, R.; et al. The Image Biomarker Standardization Initiative: Standardized Quantitative Radiomics for High-Throughput Image-based Phenotyping. Radiology 2020, 295, 328–338. [Google Scholar] [CrossRef] [Green Version]
- Eltrass, A.S.; Salama, M.S. Fully automated scheme for computer-aided detection and breast cancer diagnosis using digitised mammograms. IET Image Process. 2020, 14, 495–505. [Google Scholar] [CrossRef]
- Salama, M.S.; Eltrass, A.S.; Elkamchouchi, H.M. An Improved Approach for Computer-Aided Diagnosis of Breast Cancer in Digital Mammography. In Proceedings of the 2018 IEEE International Symposium on Medical Measurements and Applications (MeMeA), Rome, Italy, 11–13 June 2018. [Google Scholar] [CrossRef]
- Chetoui, M.; Akhloufi, M.A.; Kardouchi, M. Diabetic Retinopathy Detection Using Machine Learning and Texture Features. In Proceedings of the 2018 IEEE Canadian Conference on Electrical & Computer Engineering (CCECE), Quebec, QC, Canada, 13–16 May 2018. [Google Scholar] [CrossRef]
- Nijalingappa, P.; Sandeep, B. Machine learning approach for the identification of diabetes retinopathy and its stages. In Proceedings of the 2015 International Conference on Applied and Theoretical Computing and Communication Technology (iCATccT), Davangere, India, 29–31 October 2015. [Google Scholar] [CrossRef]
- Radovic, M.; Ghalwash, M.; Filipovic, N.; Obradovic, Z. Minimum redundancy maximum relevance feature selection approach for temporal gene expression data. BMC Bioinform. 2017, 18, 1–14. [Google Scholar] [CrossRef] [Green Version]
- Jolliffe, I.T. Principal Component Analysis, 2nd ed.; Springer Series in Statistics; Springer: New York, NY, USA, 2002. [Google Scholar]
- Akram, M.U.; Khalid, S.; Tariq, A.; Khan, S.A.; Azam, F. Detection and classification of retinal lesions for grading of diabetic retinopathy. Comput. Biol. Med. 2014, 45, 161–171. [Google Scholar] [CrossRef]
- Szymkowski, M.; Saeed, E.; Saeed, K.; Mariak, Z. A simple algorithm for hard exudate detection in diabetic retinopathy using spectral-domain Optical Coherence Tomography. In Proceedings of the Computer Graphics International Conference, Calgary, AB, Canada, 17–20 June 2019; pp. 179–189. [Google Scholar]
- Sleman, A.A.; Soliman, A.; Elsharkawy, M.; Giridharan, G.; Ghazal, M.; Sandhu, H.; Schaal, S.; Keynton, R.; Elmaghraby, A.; El-Baz, A. A novel 3D segmentation approach for extracting retinal layers from optical coherence tomography images. Med. Phys. 2021, 48, 1584–1595. [Google Scholar] [CrossRef]
- El-Baz, A.S.; Gimel’farb, G.L.; Suri, J.S. Stochastic Modeling for Medical Image Analysis; OCLC: Boca Raton, FL, USA, 2016. [Google Scholar]
- Khansari, M.M.; Zhang, J.; Qiao, Y.; Gahm, J.K.; Sarabi, M.S.; Kashani, A.H.; Shi, Y. Automated deformation-based analysis of 3D optical coherence tomography in diabetic retinopathy. IEEE Trans. Med. Imaging 2019, 39, 236–245. [Google Scholar] [CrossRef]
- Leela Jancy, P.; Lazha, A.; Prabha, R.; Sridevi, S.; Thenmozhi, T. Hard Exudates Detection for Diabetic Retinopathy Early Diagnosis Using Deep Learning. In Sustainable Communication Networks and Application; Springer: Berlin/Heidelberg, Germany, 2022; pp. 309–319. [Google Scholar]
- Holmberg, O.G.; Köhler, N.D.; Martins, T.; Siedlecki, J.; Herold, T.; Keidel, L.; Asani, B.; Schiefelbein, J.; Priglinger, S.; Kortuem, K.U.; et al. Self-supervised retinal thickness prediction enables deep learning from unlabelled data to boost classification of diabetic retinopathy. Nat. Mach. Intell. 2020, 2, 719–726. [Google Scholar] [CrossRef]
- Guo, Y.; Camino, A.; Wang, J.; Huang, D.; Hwang, T.S.; Jia, Y. MEDnet, a neural network for automated detection of avascular area in OCT angiography. Biomed. Opt. Express 2018, 9, 5147–5158. [Google Scholar] [CrossRef]
- Hua, C.H.; Huynh-The, T.; Kim, K.; Yu, S.Y.; Le-Tien, T.; Park, G.H.; Bang, J.; Khan, W.A.; Bae, S.H.; Lee, S. Bimodal learning via trilogy of skip-connection deep networks for diabetic retinopathy risk progression identification. Int. J. Med Inform. 2019, 132, 103926. [Google Scholar] [CrossRef]
- Gatys, L.A.; Ecker, A.S.; Bethge, M. Image style transfer using convolutional neural networks. In Proceedings of the IEEE Conference on Computer Vision and Pattern Recognition, Las Vegas, NV, USA, 27–30 June 2016; pp. 2414–2423. [Google Scholar]
- Lakshminarayanan, V.; Kheradfallah, H.; Sarkar, A.; Jothi Balaji, J. Automated Detection and Diagnosis of Diabetic Retinopathy: A Comprehensive Survey. J. Imaging 2021, 7, 165. [Google Scholar] [CrossRef]
| Study | Methodology | # of Grades | System Performance | Dataset Info. |
|---|---|---|---|---|
| Welikala et al. [76], 2015 | Implemented a method that segments new vessels from FP images, then applied SVM on selected morphological features obtained from a genetic algorithm | Differentiated between normal and PDR | Sensitivity was 91.83% and specificity was 96%, while AUC was 96.93% | 60 FP images from MESSIDOR [77] and St, Thomas’ Hospital ophthalmology department |
| Prasad et al. [78], 2015 | Developed a method that used a back propagation neural network and PCA with extracted features from some morphological operations | Differentiated between normal and DR | Sensitivity and specificity were 97.8% and 97.5%, respectively; accuracy was 97.75% | Publicly available 89 FP images from DIARETDB1 [79] |
| Mahendran et al. [80], 2015 | Introduced an SVM with probabilistic neural network and neighborhood-based segmentation technique to automatically detect FP lesions exudates | Differentiated between normal, moderate NPDR, and severe NPDR | Overall accuracy of SVM and neural network were 97.8% and 94.7%, respectively. | Publicly available 1200 FP images from MESSIDOR dataset |
| Bhatkar et al. [81], 2015 | Introduced a multi-layer perception neural network with features extracted from discrete cosine transform | Differentiated between normal and DR | Overall accuracy was 100% | 130 FP images from DIARETDB0 dataset |
| Labhade et al. [82], 2016 | Applied different ML models (SVM, RF, gradient boost, and AdaBoost) on extracted CLCM features from FP images | Differentiated between normal, mild NPDR, severe NPDR, and PDR | Accuracy of SVM was 88.71%, RF was 83.34%, gradient boost was 83.34%, and AdaBoost was 54.3% | 1200 FP images from public Messidor dataset |
| Rahim et al. [83], 2016 | Introduced an ML algorithm (SVM with RBF kernel) and a combination of fuzzy fuzzy image processing techniques and circular Hough transform | Differentiated between no DR, mild NPDR, moderate NPDR, severe NPDR, and PDR | SVM with RBF kernel: accuracy was 93%, specificity was 93.62%, and sensitivity was 92.45% | 600 FP images from 300 patients collected at the Hospital Melaka, Malaysia |
| Bhatia et al. [84], 2016 | Applied different ML algorithms on extracted lesions from FP (microaneurysms and exudates) and calculation of the optic disk diameter | Differentiated between normal and different severity levels of DR | Overall accuracy was 94% and F1-score was 93% | 1200 FP images from public MESSIDOR dataset |
| Gulshan et al. [85], 2016 | Designed a DCNN for automated detection and diagnosis of DR and DME using three different datasets from FP images | Differentiated between normal, different levels of DR and DME | The AUC was 99.1% for EyePACS-1 and The AUC was 99% for Messidor-2 | 128,175 FP + 9963 FP from EyePACS-1 + 1748 from Messidor-2 |
| Colas et al. [86], 2016 | Built algorithm to detect the anomalies locations for FP images | Grading based on ICDR severity scale | The AUC was 94.6%, sensitivity was 96.2%, and 66.6% specificity | 70,000 FP images for training + 15,000 FP images for testing |
| Ghosh et al. [87], 2017 | Designed a DCNN model to identify different lessions in FP images such as micro-aneurysms and hemorrhages | Grading based on ICDR severity scale | 95% accuracy for binary classification and 85% accuracy for 5-class classification | 88,702 FP images from EyePACS dataset |
| Islam et al. [88], 2017 | Designed an ML algorithm that used the bag of words model to identify some lesions in FP images | Differentiated between normal and DR | 94.4% accuracy, 94% precision, 94% F1-score, and 95% AUC | 180 FP images from four public dataset |
| Carrera et al. [89], 2017 | Implemented CAD system based on SVM model and extracted features from blood vessels, microaneurysms, and hard exudates | Differentiated between four grades from NPDR | Accuracy of SVM was 92.4%, specificity was 97.4%, AUC was 93.8% | 400 FP images from public Messidor dataset |
| Somasundaram et al. [90], 2017 | Designed an ML bagging ensemble classifier and t-distributed stochastic neighbor embedding | Differentiated between NPDR and PDR. | ML-BEC approach accomplishes accuracies of 40% and 49% for DR detection | 89 FP images from public dataset [91] |
| Eltanboly et al. [92], 2017 | Implemented deep fusion classification network (DFCN) with extracted morphological features from segmented retina layers | Differentiated between normal and DR | Accuracy was 92%, specificity was 100%, sensitivity was 83% | 52 OCT images from University of Louisville, USA |
| Takahashi et al. [93], 2017 | Modified GoggleNet DCNN approach | Differentiated between NPDR, severe NPDR, and PDR | The grading accuracy was 81% | 9939 FP images from Jichi Medical University |
| Quellec et al. [94], 2017 | A DL approach depending on ConvNets and the backpropagation method | Grading based on ICDR severity scale | Detection performance was 95.4% and 94.9% on two different datasets | 90,000 FP images from Public and private dataset |
| Ting et al. [95], 2017 | Designed a DCNN pretrained to diagnose and grade DR using FP images | Differentiated between PDR, vision-threatening DR, glaucoma, and AMD | AUC for PDR was 0.93 and AUC for vision-threatening DR was 0.95 | 494,661 FP images from Singapore National DR Program |
| Wang et al. [96], 2017 | Designed a CNN called Zoom-in-Net to identify suspicious areas using the created attention maps | Grading based on ICDR severity scale | AUC for Messidor dataset was 0.95 and AUC for EyePACS dataset was 0.92 | 1200 FP images from Messidor + 89,000 FP images from EyePACS public dataset |
| Eladawi et al. [97], 2018 | Designed system used MGRF to segment blood vessels from SVP and DVP, then, used SVM with local features extracted | Differentiated between healthy eye and DR | Accuracy was 97.3%, specificity of 96.4%, sensitivity was 97.9%, and AUC was 97.2% | 105 OCTA images from the University of Louisville, USA |
| Dutta et al. [98], 2018 | Designed backpropagation NN, DNN, and CNN (VGGNet) | Differentiated between mild NPDR, moderate NPDR, severe NPDR, and PDR | 86.3% accuracy for DNN, 78.3% accuracy for VGGNet, 42% accuracy for backpropagation NN | 2000 FP images selected from public dataset |
| Eltanboly et al. [99], 2018 | Introduced a stacked non-negativity constraint autoencoder and fed it with extracted features from the segmented retinal OCT layers | Differentiated between healthy, early DR, mild, or moderate DR | Using LOSO, accuracy of the first stage was 93%, and the second stage was 98% | 74 OCT images from the University of Louisville, USA |
| Zhang et al. [100], 2018 | Designed DCNN model called DR-Net with a new adaptive cross-entropy loss | Grading based on ICDR severity scale | The overall accuracy was 82.10%, and kappa score was 66% | 88,702 FP images from EyePACS dataset |
| Costa et al. [101], 2018 | Developed an ML technique depending on new multiple instances learning for DR detection using FP images | Grading DR based on ICDR severity scale | Messidor: AUC was 90%, DR1: AUC was 93%, DR2: AUC was 96% | 1200 FP from Messidor dataset + 1077 FP from DR1 and DR2 dataset [102] |
| Chakrabarty et al. [103], 2018 | Designed a DL approach and applied it on enhanced high-resolution FP images | Differentiated between healthy eye and DR | Accuracy of 91.67%, sensitivity of 100%, and precision of 100% | 30 high-resolution FP images |
| Kwasigroch et al. [104], 2018 | Proposed a CAD system based on a DCNN approach called VGG-D | Grading based on ICDR severity scale | Accuracy was 81.7%, specificity was 50.5%, and sensitivity was 89.5% | Over 88,000 FP images from EyePACKS [105] |
| Li et al. [106], 2019 | Proposed a CAD system based on a deep transfer learning approach called Inception-v3 | Grading based on ICDR severity scale | Accuracy of 93.49%, sensitivity of 96.93%, specificity of 93.45%, and AUC of 0.99 | 19,233 FP images from public Messidor-2 dataset |
| Nagasawa et al. [107], 2019 | Proposed a CAD system based on a deep transfer learning approach called Inception-v3 | Differentiated between non-PDR and PDR | AUC of 96.9%, sensitivity of 94.7%, and specificity of 97.2% | 378 FP images from Tokushima University and Saneikai Tsukazaki Hospitals |
| Metan et al. [108], 2019 | Proposed a CAD system based on ResNet with shallow and deep skip connections | Grading based on ICDR severity scale | The performance accuracy of system was 81% | 88,702 FP images from EyePACKS [105] |
| Qummar et al. [109], 2019 | Designed five different DCNNs (Resnet50, Inceptionv3, Xception, Dense121, Dense169) | Grading based on ICDR severity scale | Accuracy of 80.80%, recall of 51.50%, specificity of 86.72%, and F1-score of 53.74% | 88,702 FP images from public EyePACKS [105] |
| Sayres et al. [110], 2019 | Trained the Inception V4 model on a large dataset from FP | Grading based on ICDR severity scale | The overall accuracy was 88.40% | 88,702 FP images from public EyePACKS [105] |
| Sengupta et al. [111], 2019 | Trained a DCNN called InceptionV3 model on a large dataset from FP | Grading based on ICDR severity scale | The overall accuracy was 90.40%, specificity of 91.94%, and sensitivity of 90% | 88,702 FP images from public EyePACKS [105], and MESSIDOR1 [77] |
| Hathwar et al. [112], 2019 | Designed pretrained CNN called Xception-TL to diagnose and grade DR using FP images | Grading DR based on ICDR severity scale | quadratic
weighted kappa score was 88% for grading DR; sensitivity of 94.3% for DR vs. No DR | 35,124 FP images from EyePACS and 413 FP from IDRiD dataset |
| Li et al. [113], 2019 | Developed and designed a DCNN model called OCTD_Net for early detection of DR | Differentiated between healthy eye, and grade 0 DR, and Grade 1 DR | Accuracy was 92%, specificity was 95%, and sensitivity was 92% | 4168 OCT images from Wenzhou Medical University |
| Heisler et al. [114], 2020 | Designed DCNN models based on VGG19, ResNet50, and DenseNet and ensembled using majority soft voting and stacking techniques | Grading based on ICDR severity scale | The overall accuracy for VGG19 was 92% and 90% for the majority soft voting and stacking methods, respectively | 463 volumes from OCT and OCTA images from 380 eyes |
| Alam et al. [115], 2020 | Introduced an SVM model, which is fed with six different features extracted from OCTA images | Differentiated between normal and three stages from NPDR | Accuracy of 94.41% for control vs. DR; Accuracy of 92.96% for control vs. NPDR specificity | 120 OCTA images from 60 patients |
| Zang et al. [116], 2020 | Introduced a DCNN called DcardNet with adaptive label smoothing to suppress overfitting using en-face OCT and OCTA images | Differentiated between healthy, mild NPDR, moderate NPDR, severe NPDR, and PDR | Accuracies of 95.7%, 85.0%, and 71% for three-level classifiction | 303 OCT and OCTA images from 250 participants |
| Ghazal et al. [117], 2020 | Introduced a CAD system based on a novel seven-CNN model with SVM to early diagnose DR | Differentiated between healthy and DR | Accuracies of 94%, recall of 100%, and specificity of 88% | 52 OCT images from University of Louisville, USA |
| Sandhu et al. [118], 2020 | Introduced a CAD system based on a random forest classifier and fed with extracted features from OCT and OCTA images in addition to clinical markers | Differentiated between healthy, mild NPDR, and moderate NPDR | Accuracy of 96%, sensitivity of 100%, specificity of 94.1%, and AUC of 0.96 | 111 volumes from OCT and OCTA images, University of Louisville, USA |
| Narayanan et al. [119], 2020 | Established a hybrid ML algorithm with CNN and PCA to detect and grade DR | Grading DR based on ICDR severity scale | AUC was 98.5%, and the overall accuracy was 98.4% | 3662 FP images from APTOS 2019 |
| Shankar et al. [120], 2020 | Introduced DL model to diagnose and grade DR by applying histogram-based segmentation to segment the ROI regions in FP images and then applying synergic DL model | Grading DR based on ICDR severity scale | Overall accuracy was 99.28%, sensitivity was 98%, and specificity was 99% | 3662 FP images from APTOS 2019 |
| Ryu et al. [121], 2021 | Developed fully automated system based on CNN model called ResNet101 for early detection of DR using OCTA images | Grading based on ICDR severity scale | The range of AUC was 93% to 97% for detecting DR, while accuracy was 90% to 95%, and sensitivity was 91% to 98% | OCTA images from 496 eyes |
| He et al. [122], 2021 | Developed an attention module with global attention block (GAB) and with a backbone network to identify different lesions in different DR grades | Grading DR based on ICDR severity scale | Messidor: accuracy of 84.08% and 0.8723 kappa score | 1200 FP from Messidor + 13,673 FP from DDR DataSet [123] + 88,702 FP from EyePACS |
| Saeed et al. [124], 2021 | Developed a CAD system based on two pretrained DCNN for DR grading using FP images | Grading DR based on ICDR severity scale | EyePACS: accuracy of 99.73% and AUC of 89% | 1200 FP from Messidor + 88,702 FP from EyePACS |
| Wang et al. [125], 2021 | Developed a CAD system based on two pretrained DCNN for DR grading using FP images | Grading DR based on ICDR severity scale | AUC of 94.3%, kappa score of 69.6%, and F1-score of 85.54% | 22,948 FP images from EyePACS and Peking Union Medical College Hospital |
| Liu et al. [126], 2021 | Introduced four ML algorithms (LR, LR-EN, SVM, and XGBoost) fed with extracted features from a discrete wavelet transform | Differentiated between healthy and DR | LR-EN and LR had the highest accuracy of 82% and AUC of 83% and 84%, respectively. | 246 OCTA images from 44 patients |
| Sharafeldeen et al. [127], 2021 | Introduced a CAD system based on a fused NN and SVM model and fed with extracted texture and morphological features from OCT retinal layers | Differentiated between healthy and NPDR | Using LOSO, accuracy of 97.69%, sensitivity of 96.15%, specificity of 99.23%, and F1-score of 97.66% | 260 OCT images from 130 patients |
| Hsieh et al. [128], 2021 | Designed a two-DCNN Inception v4 and ResNet, the first for distinguishing between DR and RDR and the second for PDR | Differentiated between DR, RDR, and PDR | The AUCs for DR, RDR, and PDR were 0.955, 0.955 and 0.984, respectively | 7524 FP and 31,612 FP images from EyePACS |
| Khan et al. [129], 2021 | Designed a DCNN called VGG-NiN model that is a stacked layers from spatial pyramid pooling layer and VGG16 layers | Differentiated between DR, RDR, and PDR | The average AUC was 83.8, The average recall was 55.6, and the average F1-score was 59.6 | 88,702 FP images from EyePACS |
| Wang et al. [130], 2021 | Analyzed OCTA images from SVP, DVP, and radial peripapillary capillary plexus images | Differentiated between DR, NPDR, and PDR | Sensitivity was 83.7%, and specificity was 78.3% | 150 OCTA images from 105 diabetic patients |
| Abdelsalam et al. [131], 2021 | Designed an ML method that used SVM with multifractal geometry and lacunarity parameters to diagnose early DR using OCTA images | Differentiated between normal and mild NPDR | Sensitivity was 100%, specificity was 97.3%, and precision was 96.8% | 113 OCTA used for training and 67 OCTA for testing |
| Gao et al. [132], 2022 | Designed three pretrained DCNN models called VGG16, ResNet50, and DenseNet for grading DR | Differentiated between DR, RDR, and PDR | The overall accuracies for VGG16, ResNet50, and DenseNet were 91.11%, 90.22%, and 90.87%, respectively | 11,214 FA images from Xian and Ningbo dataset |
| Elsharkawy et al. [133], 2022 | Introduced a CAD system based on an NN classifier and fed with extracted higher-order appearance features from OCT images | Differentiated between healthy and DR | Accuracies were 90.56%, 93.11%, and 96.88% using different k-folds cross validation | 188 volumes from OCT images |
| Zia et al. [134], 2022 | Introduced a hybrid system from DL (pretrained CNN, i.e., VGG VD-19 and Inception V3) and ML (cubic-SVM) to grade DR using FP images | Grading based on ICDR severity scale | Cubic-SVM: AUC of 99.80%, sensitivity of 96.4%, and precision of 96.4% | 35,126 FP images from the Kaggle dataset |
| Zang et al. [116], 2022 | Developed a DCNN to grade the different severity levels of DR using FP images with applying custom weight loss to solve unbalanced problems found in the dataset | Differentiated between healthy, mild NPDR, moderate NPDR, severe NPDR, and PDR | Accuracy of 92.49%, kappa score of 94.5%, while weighted average F1-score was 93%, recall 92%, precision 93% | 5590 FP images from APTOS 2019! [135] |
| Tsai et al. [136], 2022 | Designed three DCNNs to grade the different severity levels of DR using pretrained CNNs called ResNet101, DenseNet121, and Inception-v3 | Differentiated between healthy, mild NPDR, moderate NPDR, severe NPDR, and PDR | Inception-v3 gave the highest accuracies of 84.64% and 83.80 for Kaggle test and Taiwanese dataset, respectively | 88,702 FP images from EyePACS + local Taiwanese dataset of 4038 FP images |
| Das et al. [137], 2022 | Built DCNN based on genetic algorithm based technique and used SVM for final classification | Differentiated between healthy, mild NPDR, severe NPDR, and PDR | Overall accuracy of 98.67% and AUC of 99.33% | 1200 FP images from public Messidor [77] |
Publisher’s Note: MDPI stays neutral with regard to jurisdictional claims in published maps and institutional affiliations. |
© 2022 by the authors. Licensee MDPI, Basel, Switzerland. This article is an open access article distributed under the terms and conditions of the Creative Commons Attribution (CC BY) license (https://creativecommons.org/licenses/by/4.0/).
Share and Cite
Elsharkawy, M.; Elrazzaz, M.; Sharafeldeen, A.; Alhalabi, M.; Khalifa, F.; Soliman, A.; Elnakib, A.; Mahmoud, A.; Ghazal, M.; El-Daydamony, E.; et al. The Role of Different Retinal Imaging Modalities in Predicting Progression of Diabetic Retinopathy: A Survey. Sensors 2022, 22, 3490. https://doi.org/10.3390/s22093490
Elsharkawy M, Elrazzaz M, Sharafeldeen A, Alhalabi M, Khalifa F, Soliman A, Elnakib A, Mahmoud A, Ghazal M, El-Daydamony E, et al. The Role of Different Retinal Imaging Modalities in Predicting Progression of Diabetic Retinopathy: A Survey. Sensors. 2022; 22(9):3490. https://doi.org/10.3390/s22093490
Chicago/Turabian StyleElsharkawy, Mohamed, Mostafa Elrazzaz, Ahmed Sharafeldeen, Marah Alhalabi, Fahmi Khalifa, Ahmed Soliman, Ahmed Elnakib, Ali Mahmoud, Mohammed Ghazal, Eman El-Daydamony, and et al. 2022. "The Role of Different Retinal Imaging Modalities in Predicting Progression of Diabetic Retinopathy: A Survey" Sensors 22, no. 9: 3490. https://doi.org/10.3390/s22093490
APA StyleElsharkawy, M., Elrazzaz, M., Sharafeldeen, A., Alhalabi, M., Khalifa, F., Soliman, A., Elnakib, A., Mahmoud, A., Ghazal, M., El-Daydamony, E., Atwan, A., Sandhu, H. S., & El-Baz, A. (2022). The Role of Different Retinal Imaging Modalities in Predicting Progression of Diabetic Retinopathy: A Survey. Sensors, 22(9), 3490. https://doi.org/10.3390/s22093490