
Automatic Detection Method of Dairy Cow Feeding Behaviour Based on YOLO Improved Model and Edge Computing

 , ,
, ,
Abstract
:1. Introduction
2. Related Work
3. Materials and Methods
3.1. Materials
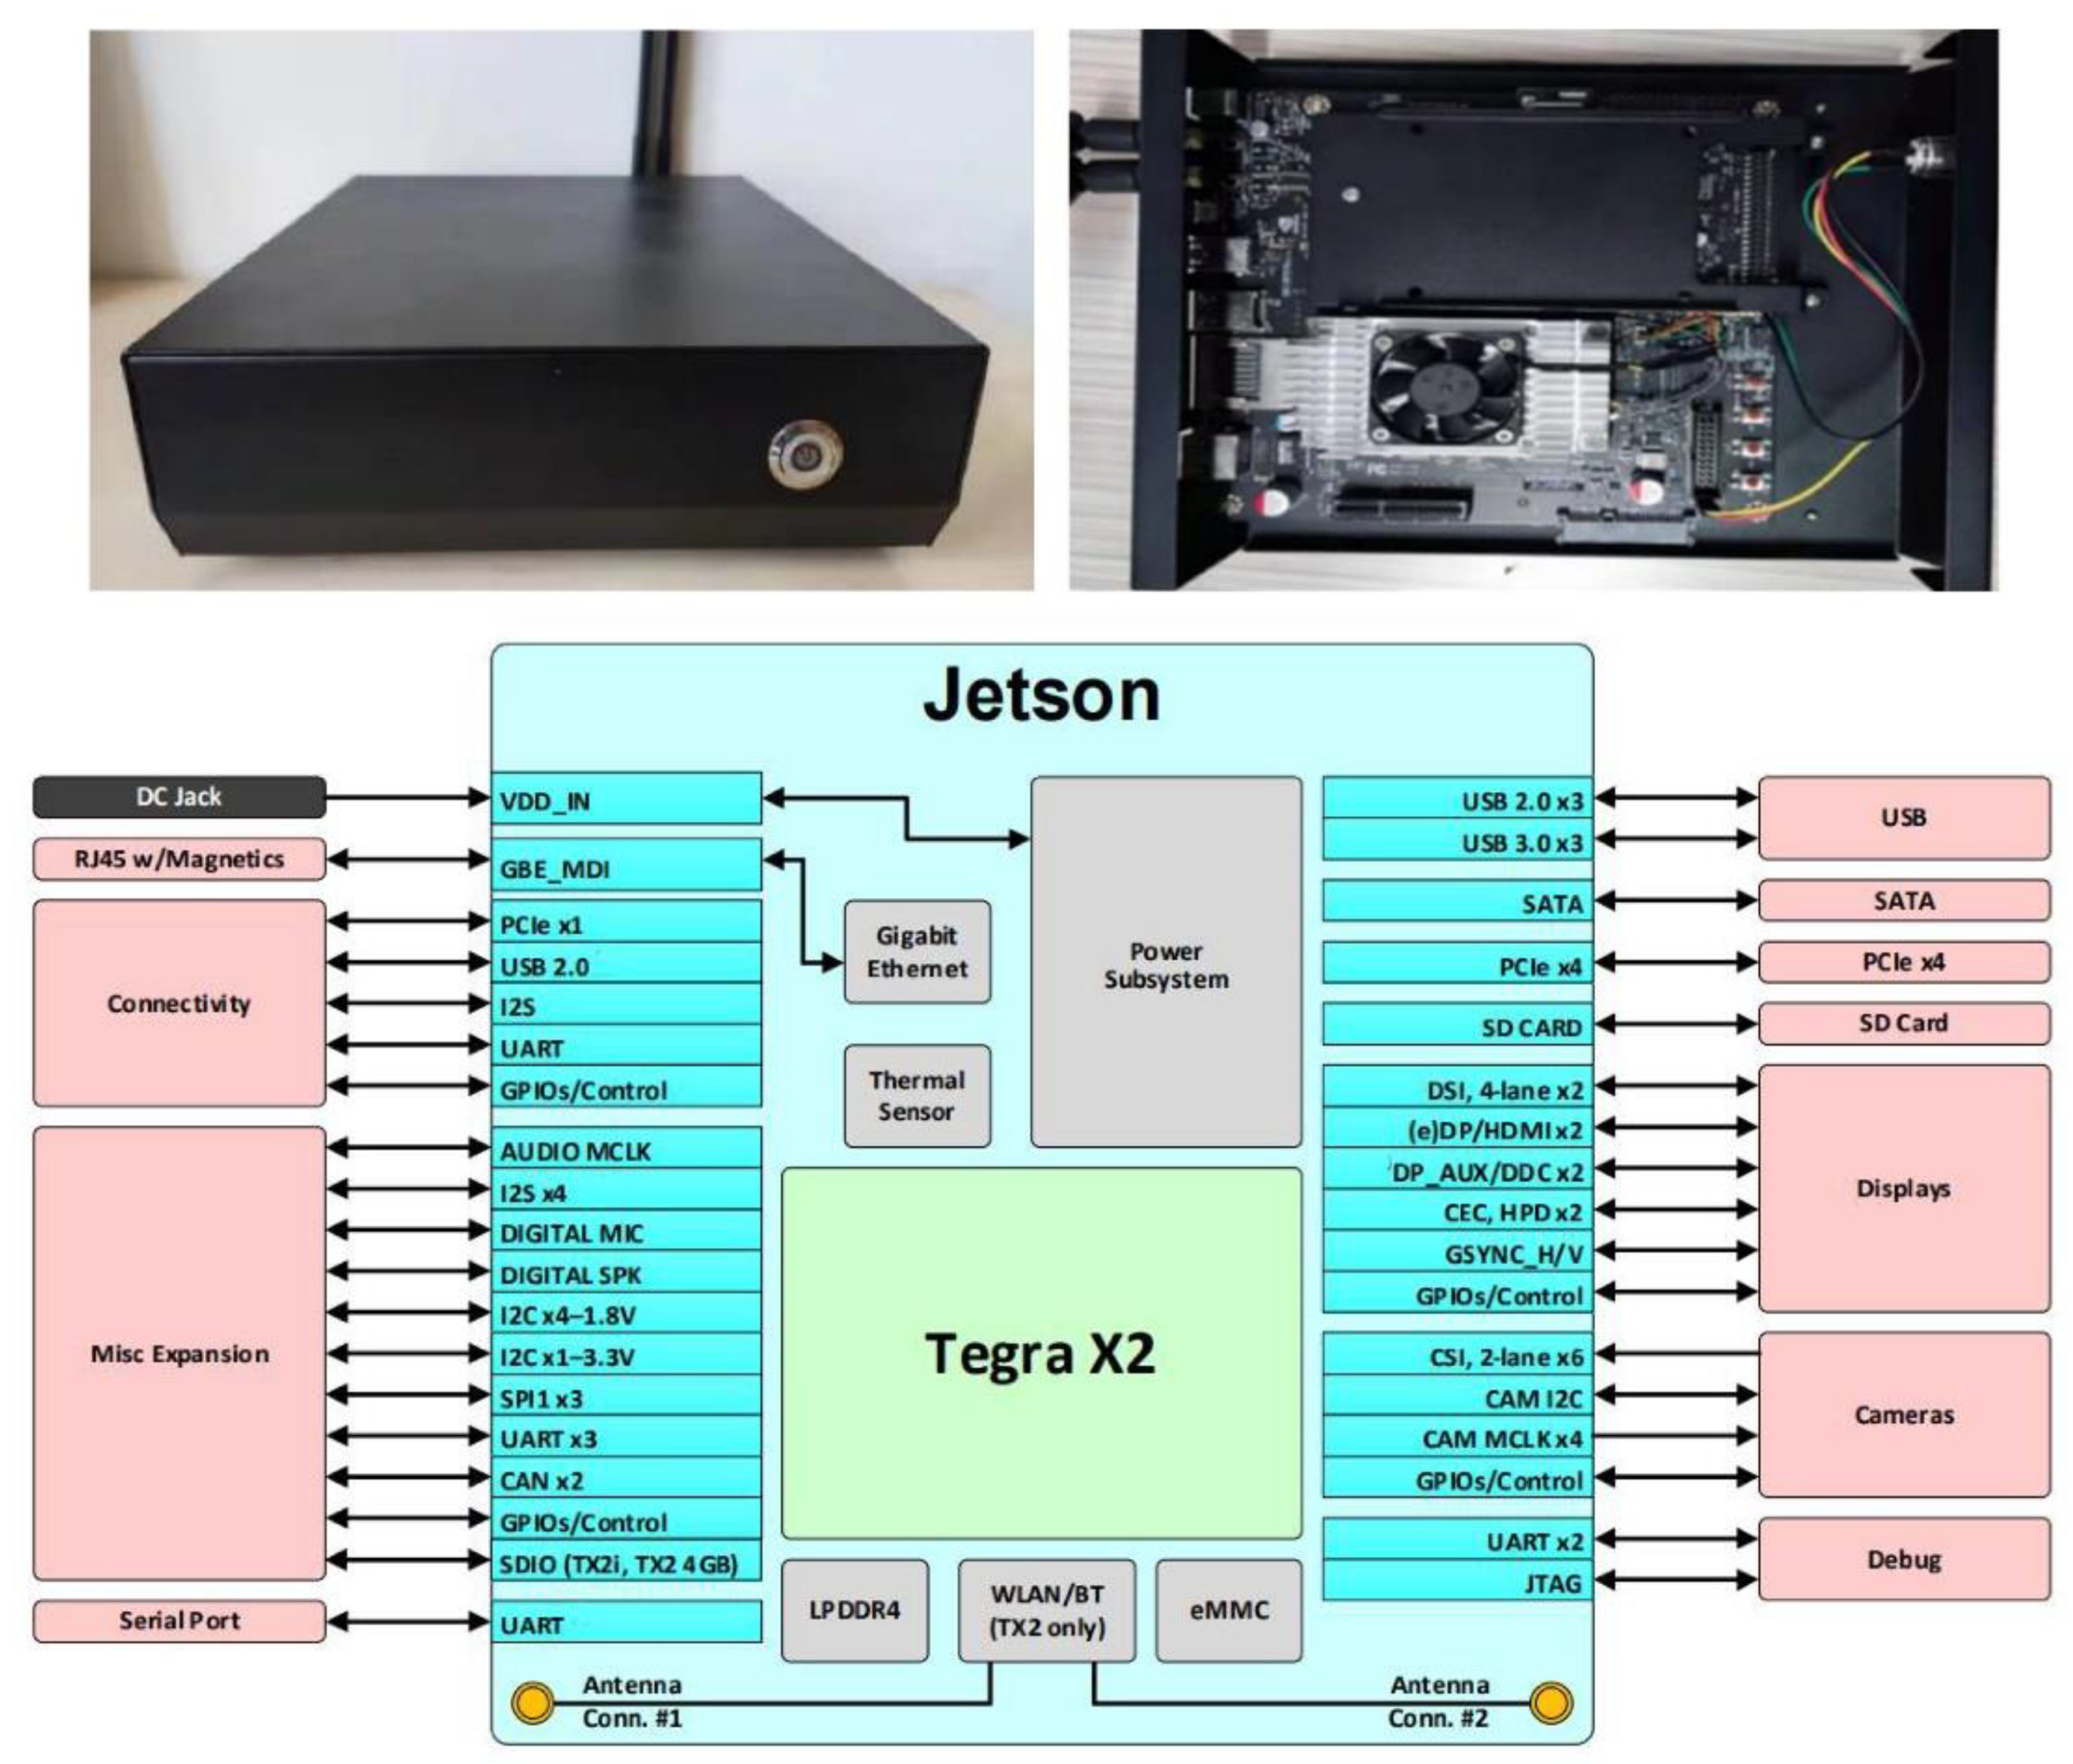
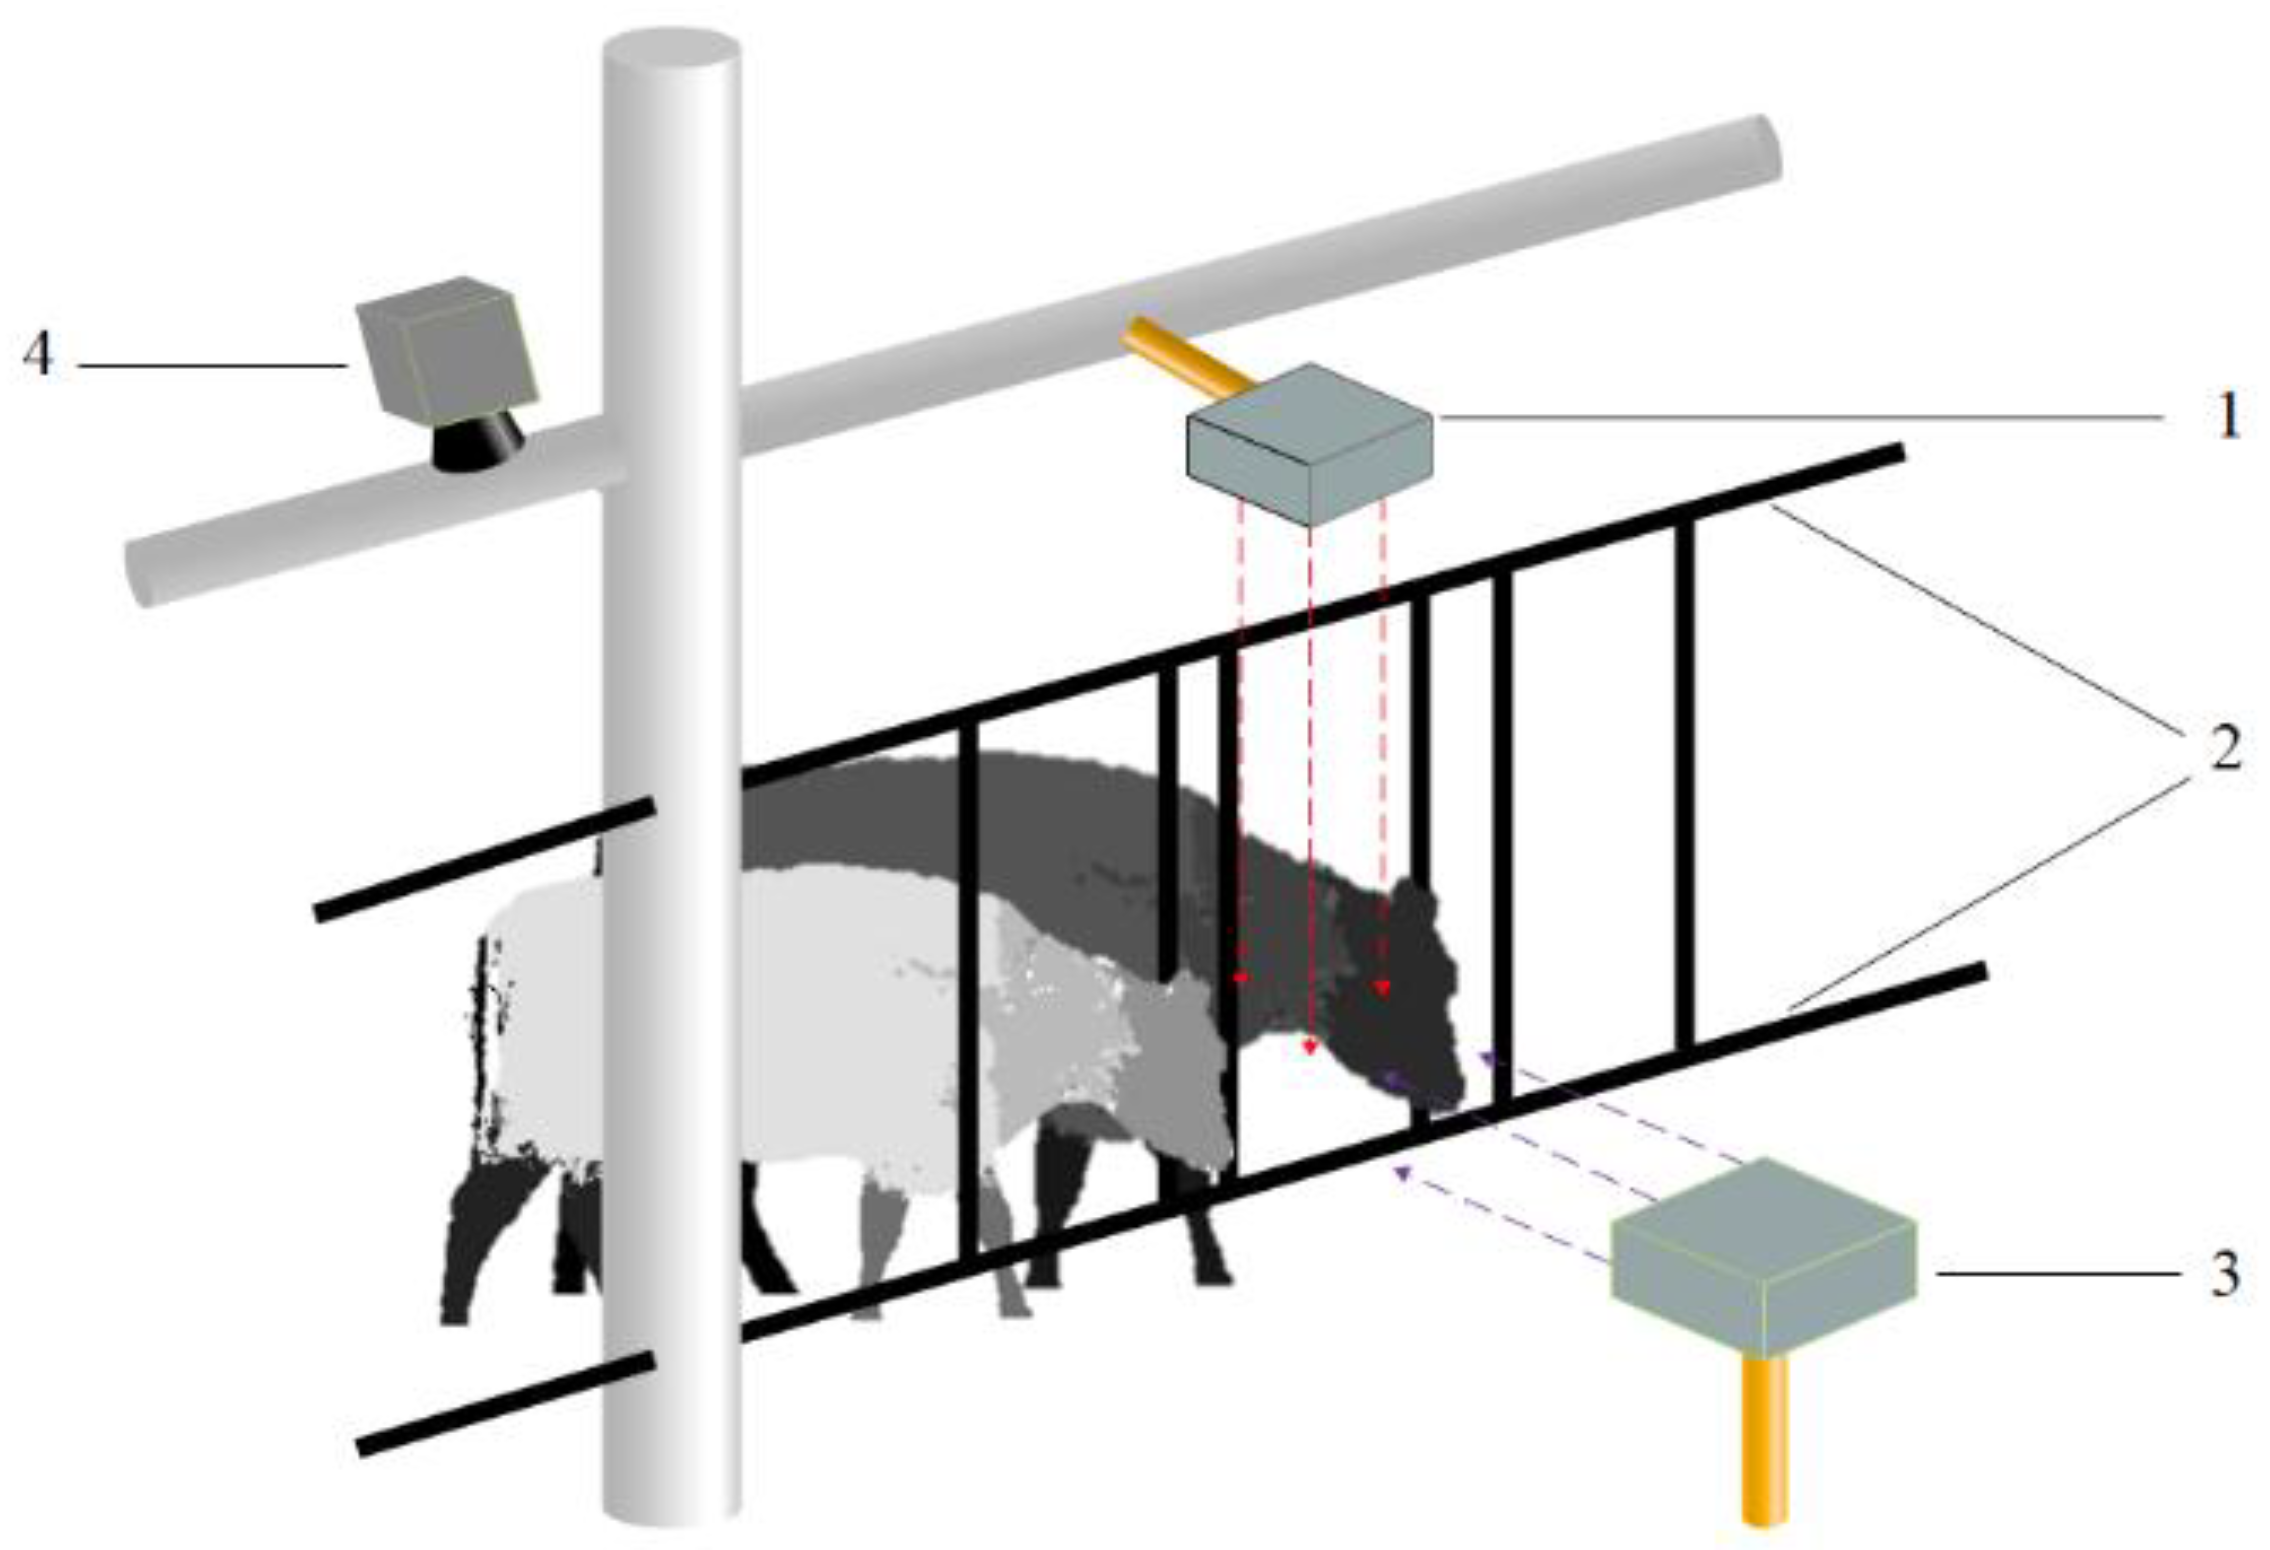
3.1.1. Edge Computing Device
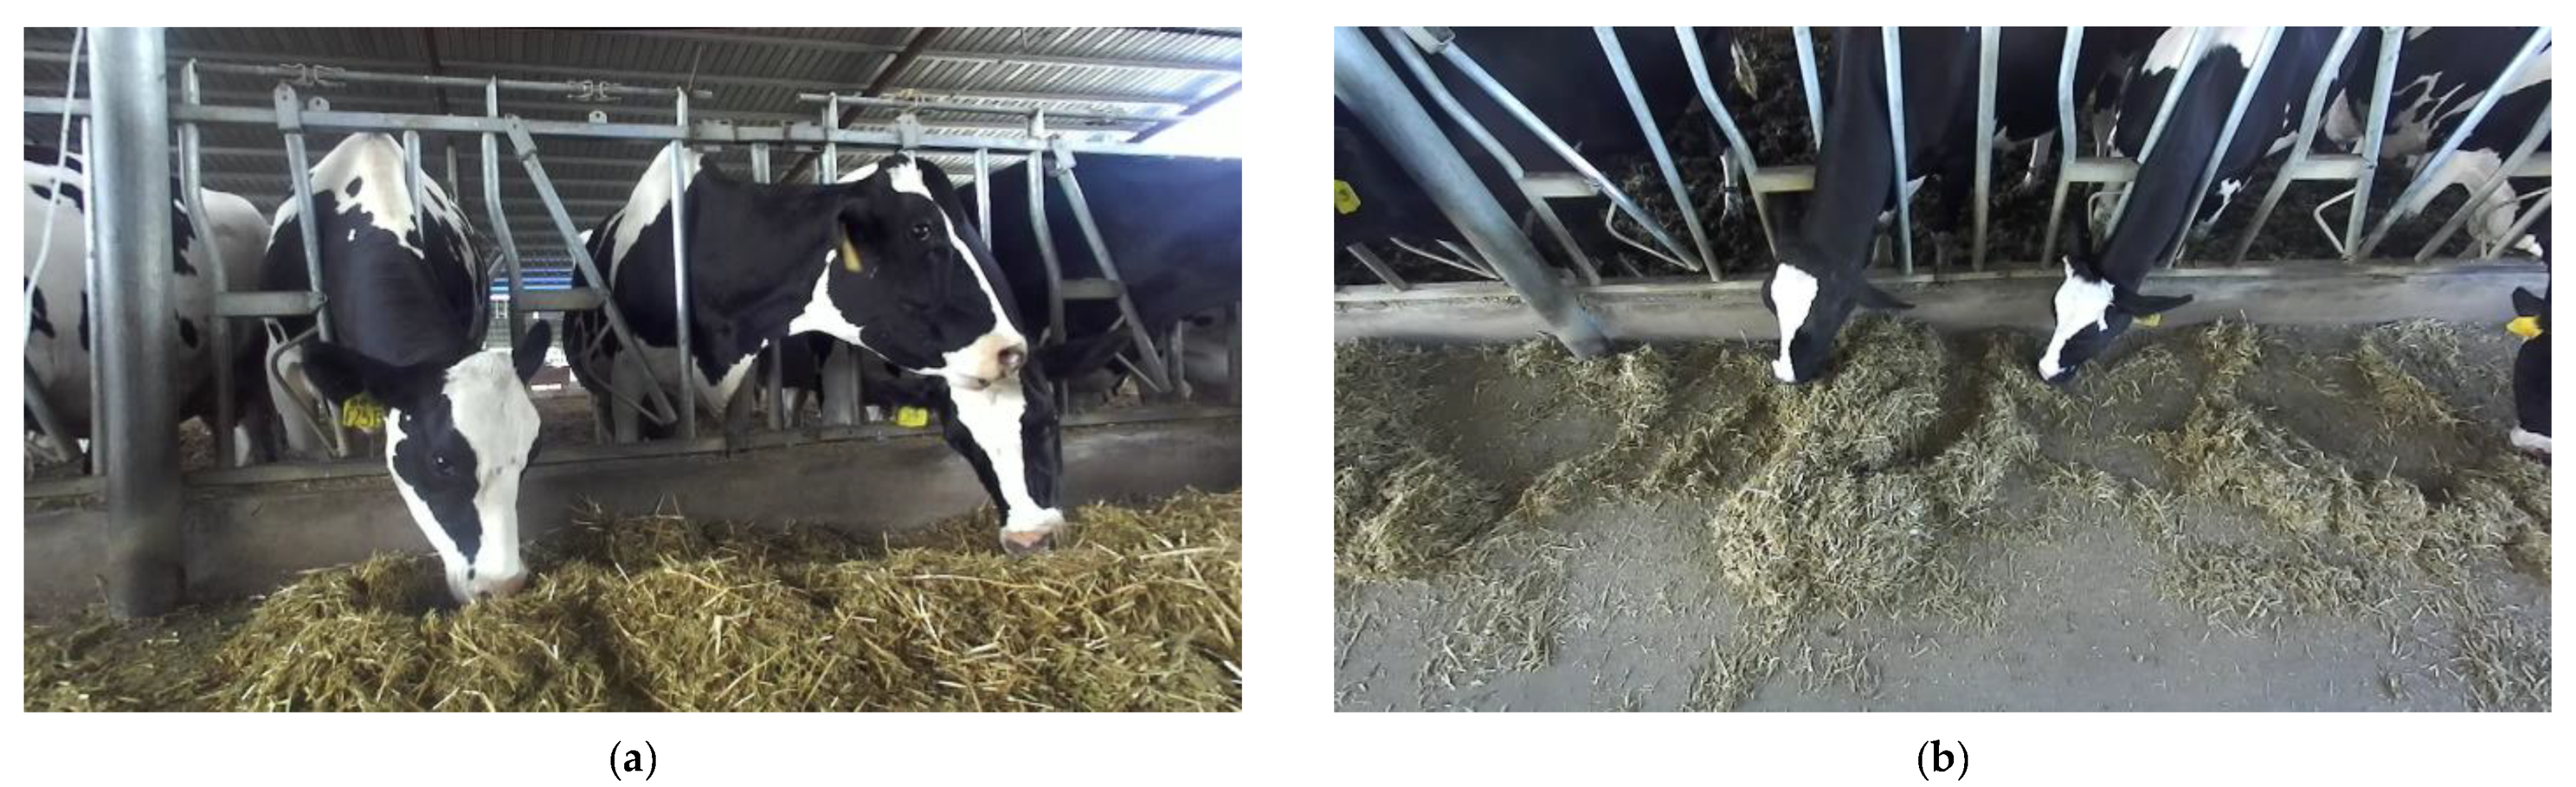
3.1.2. Image Acquisition
3.1.3. Dataset
3.2. Improved YOLO Model
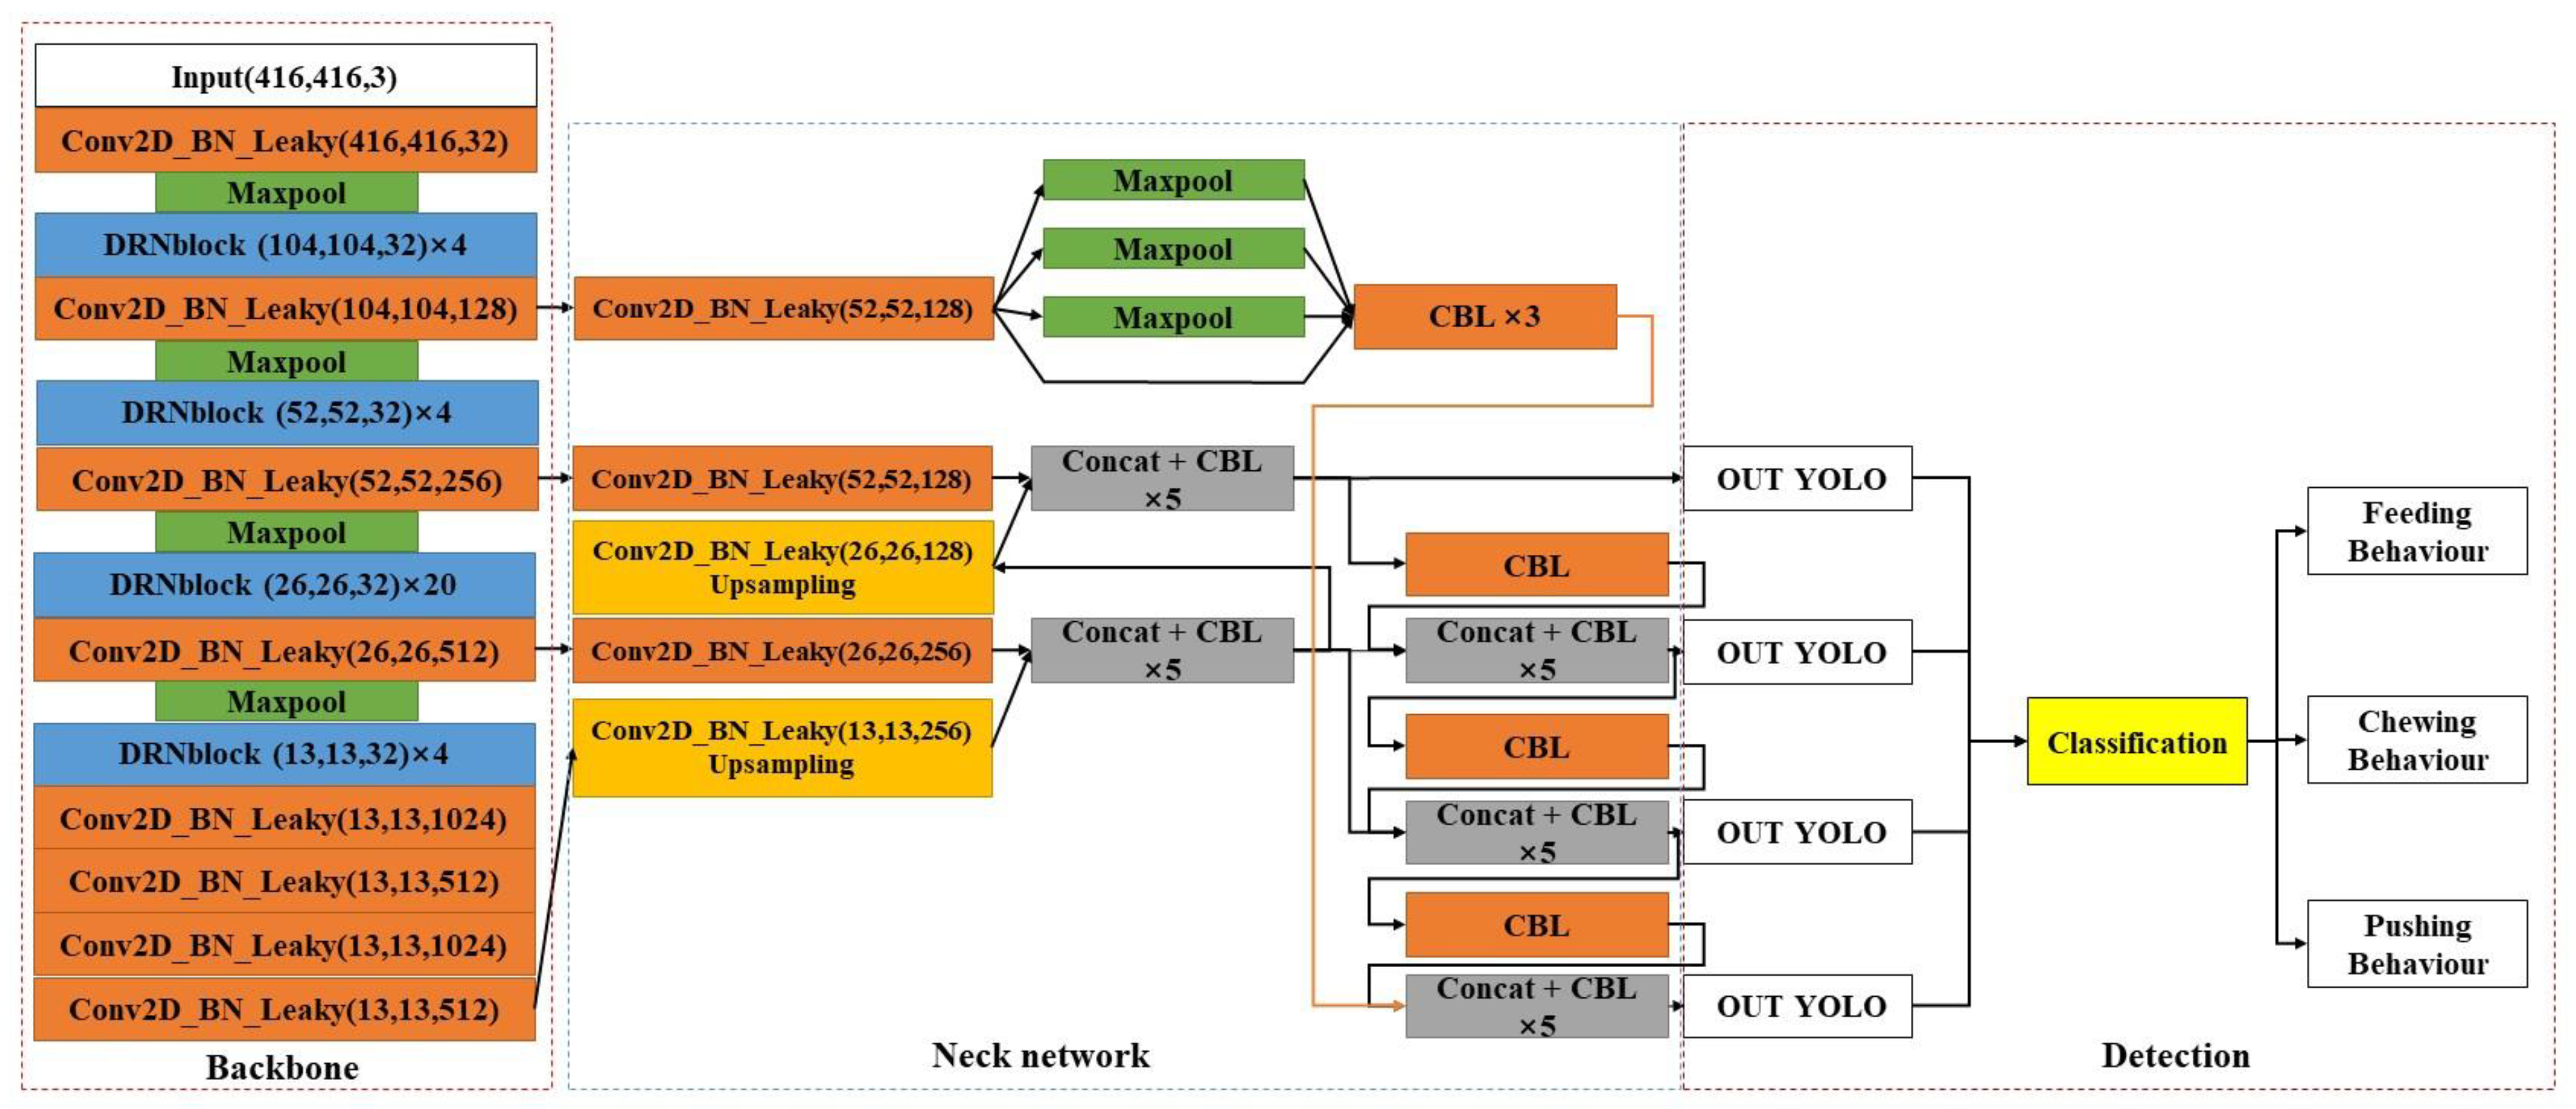
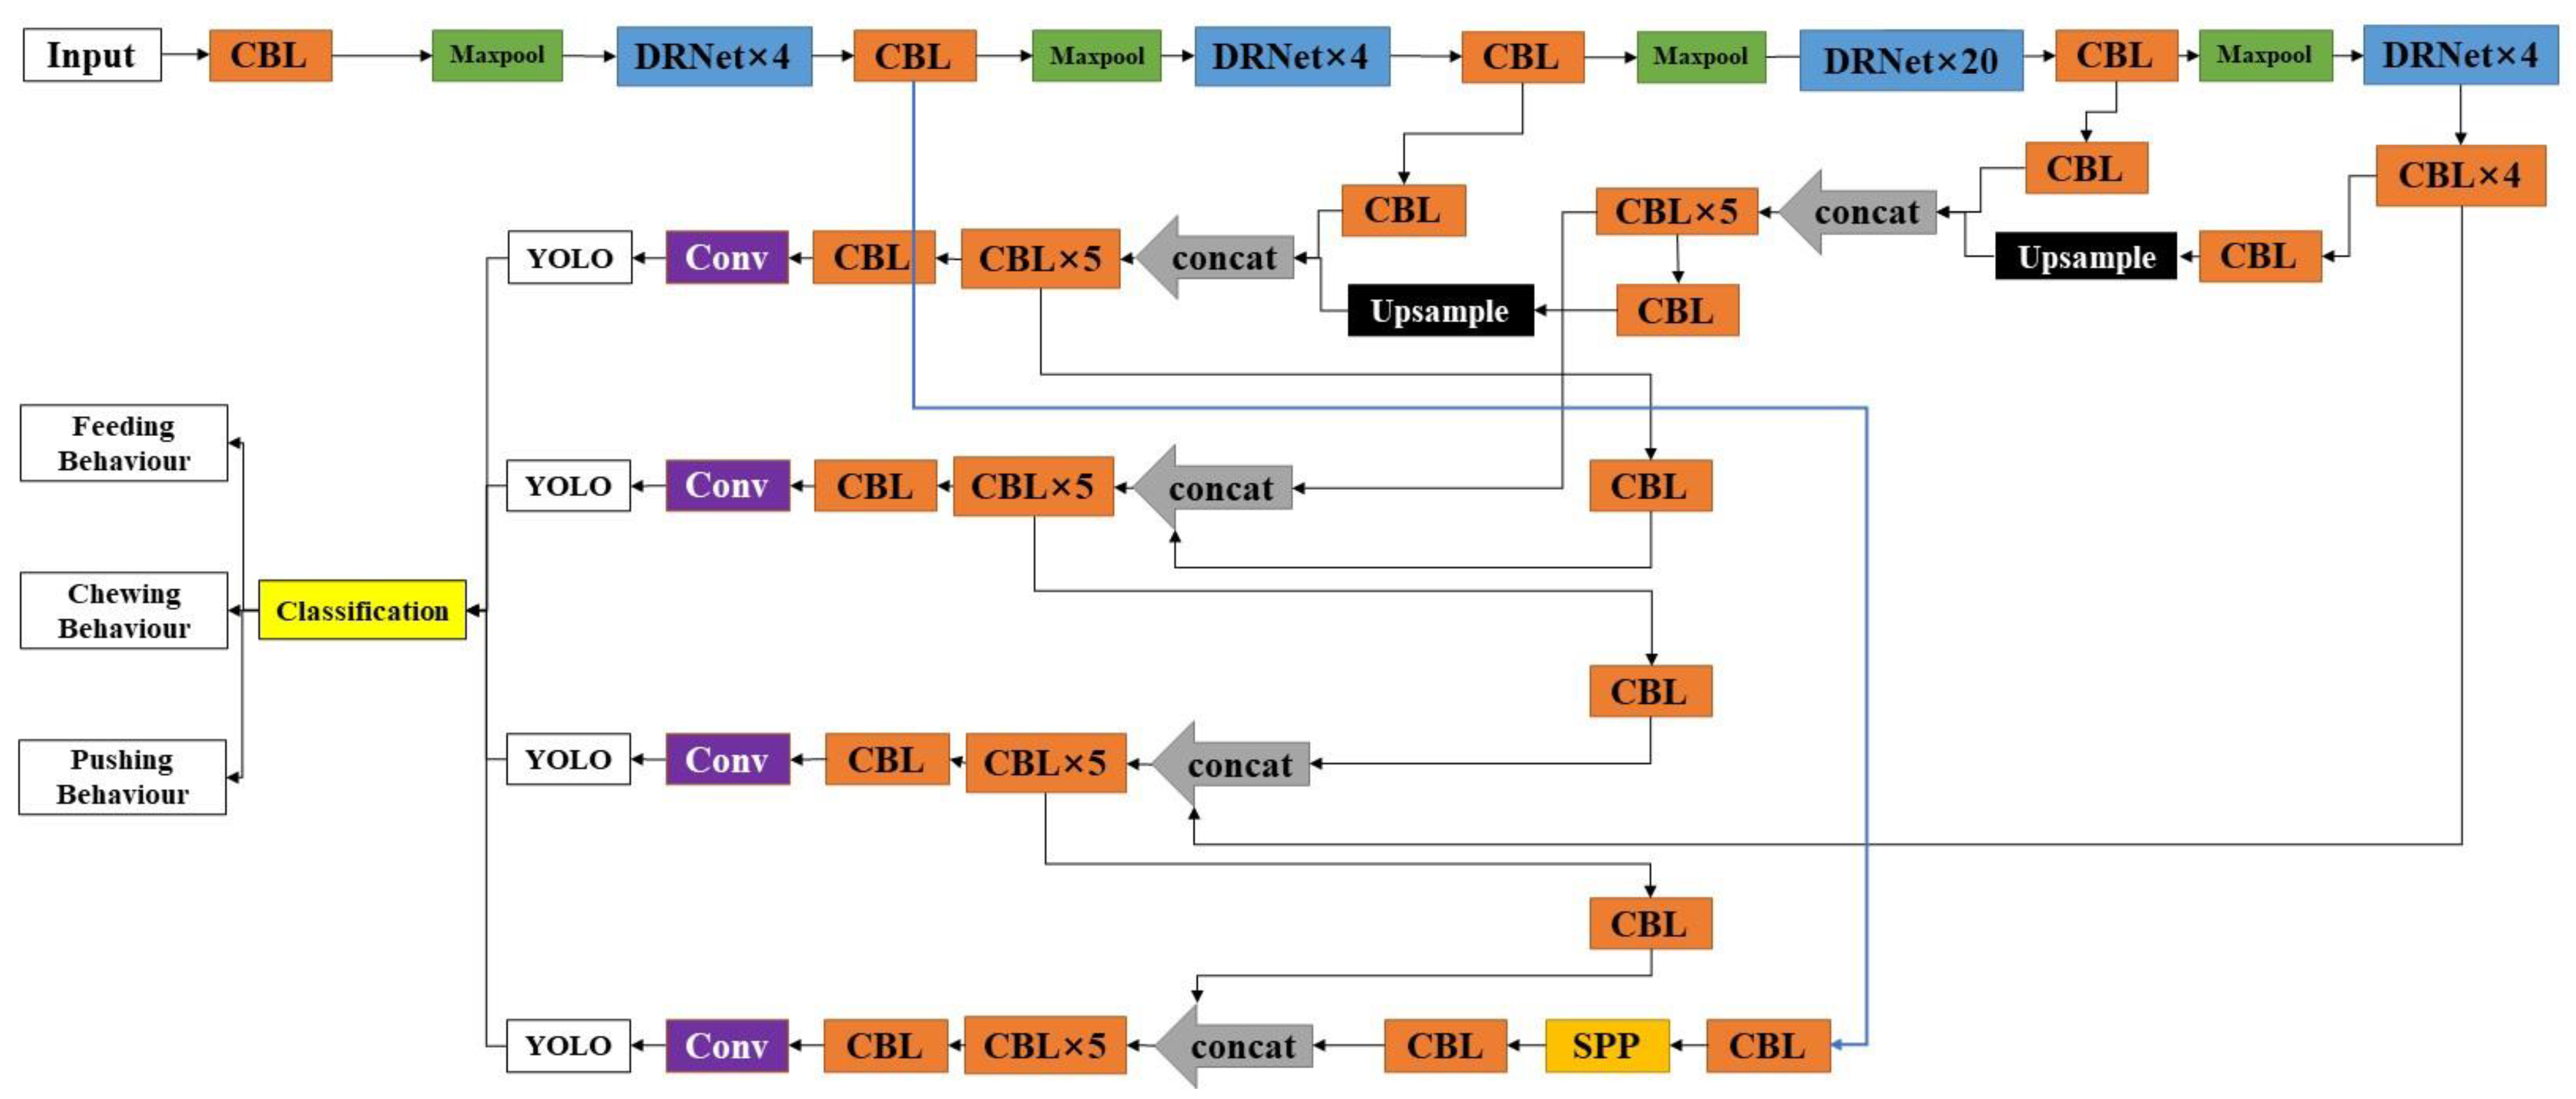
3.2.1. DRN-YOLO
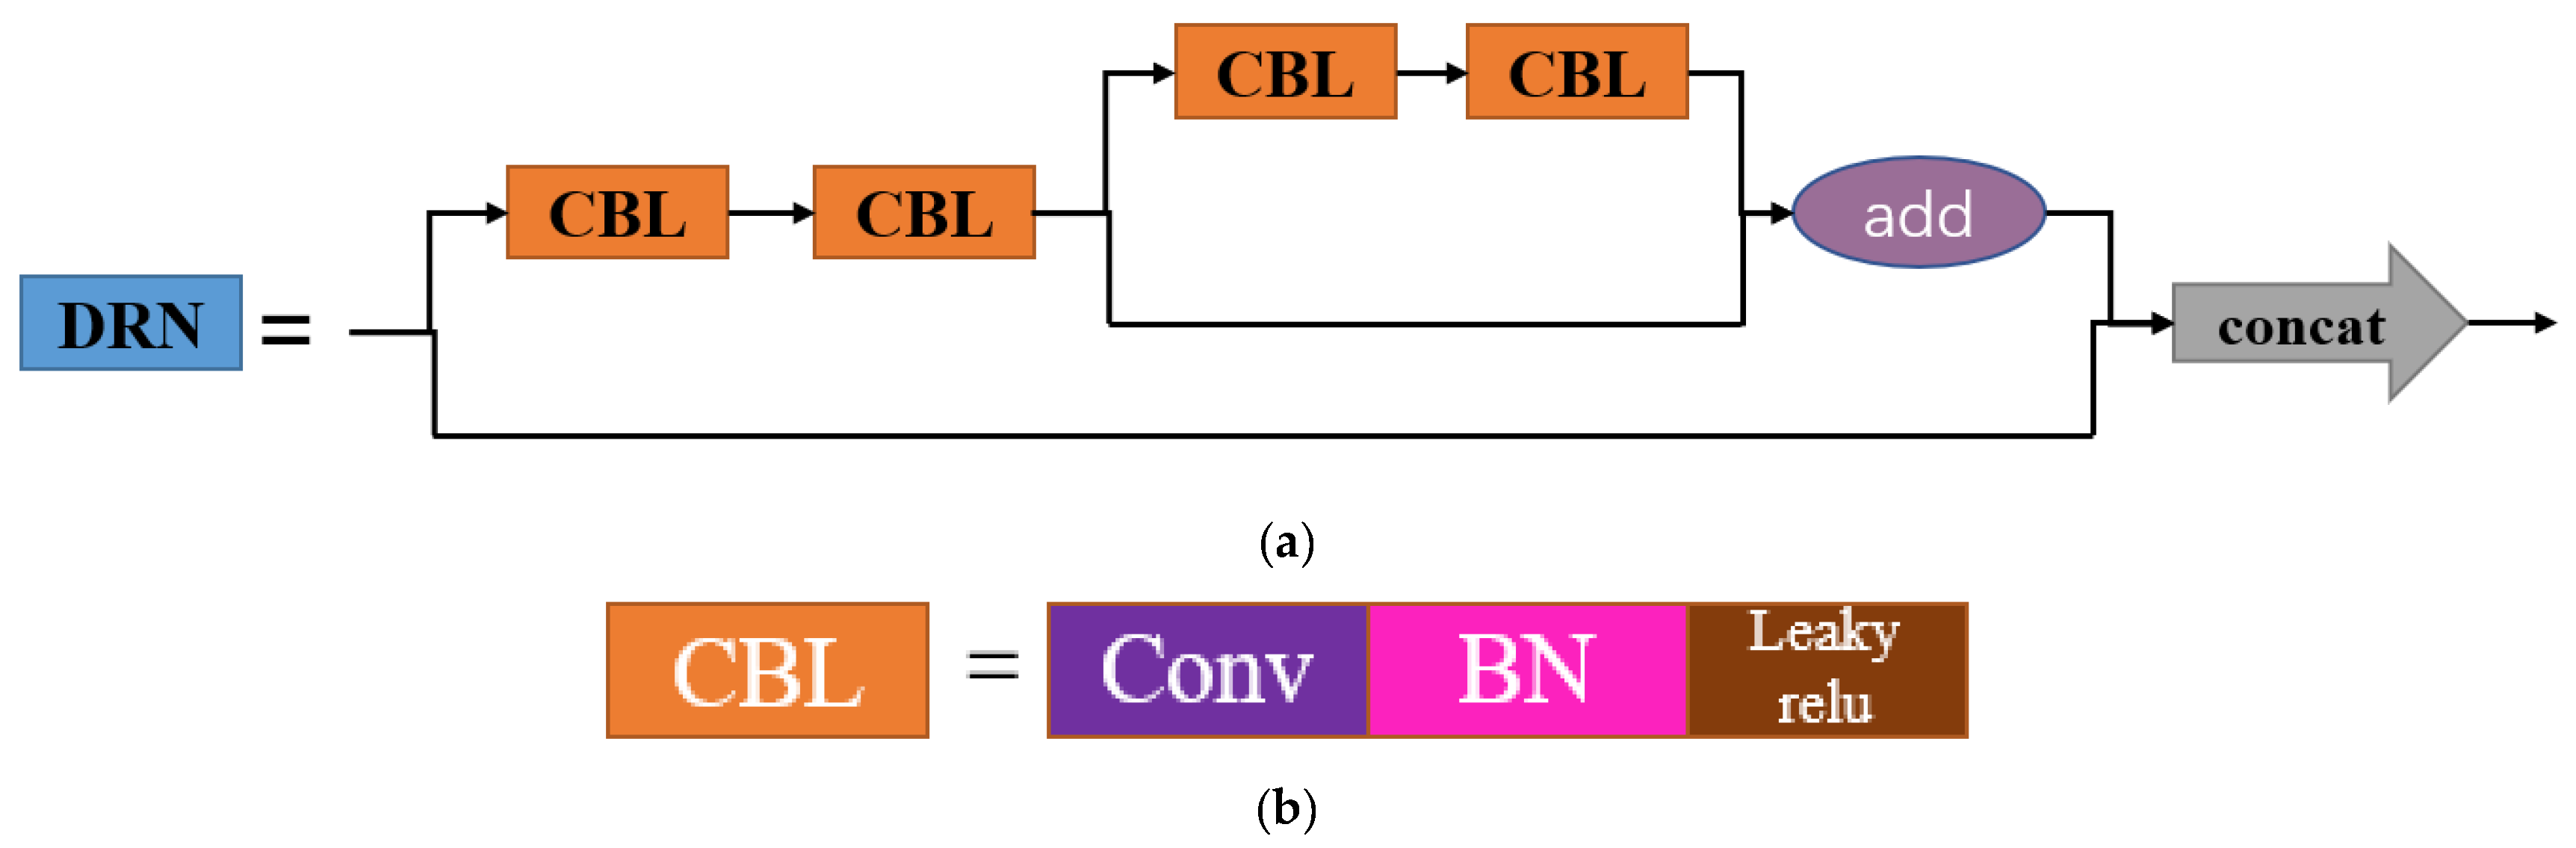
3.2.2. DRNet
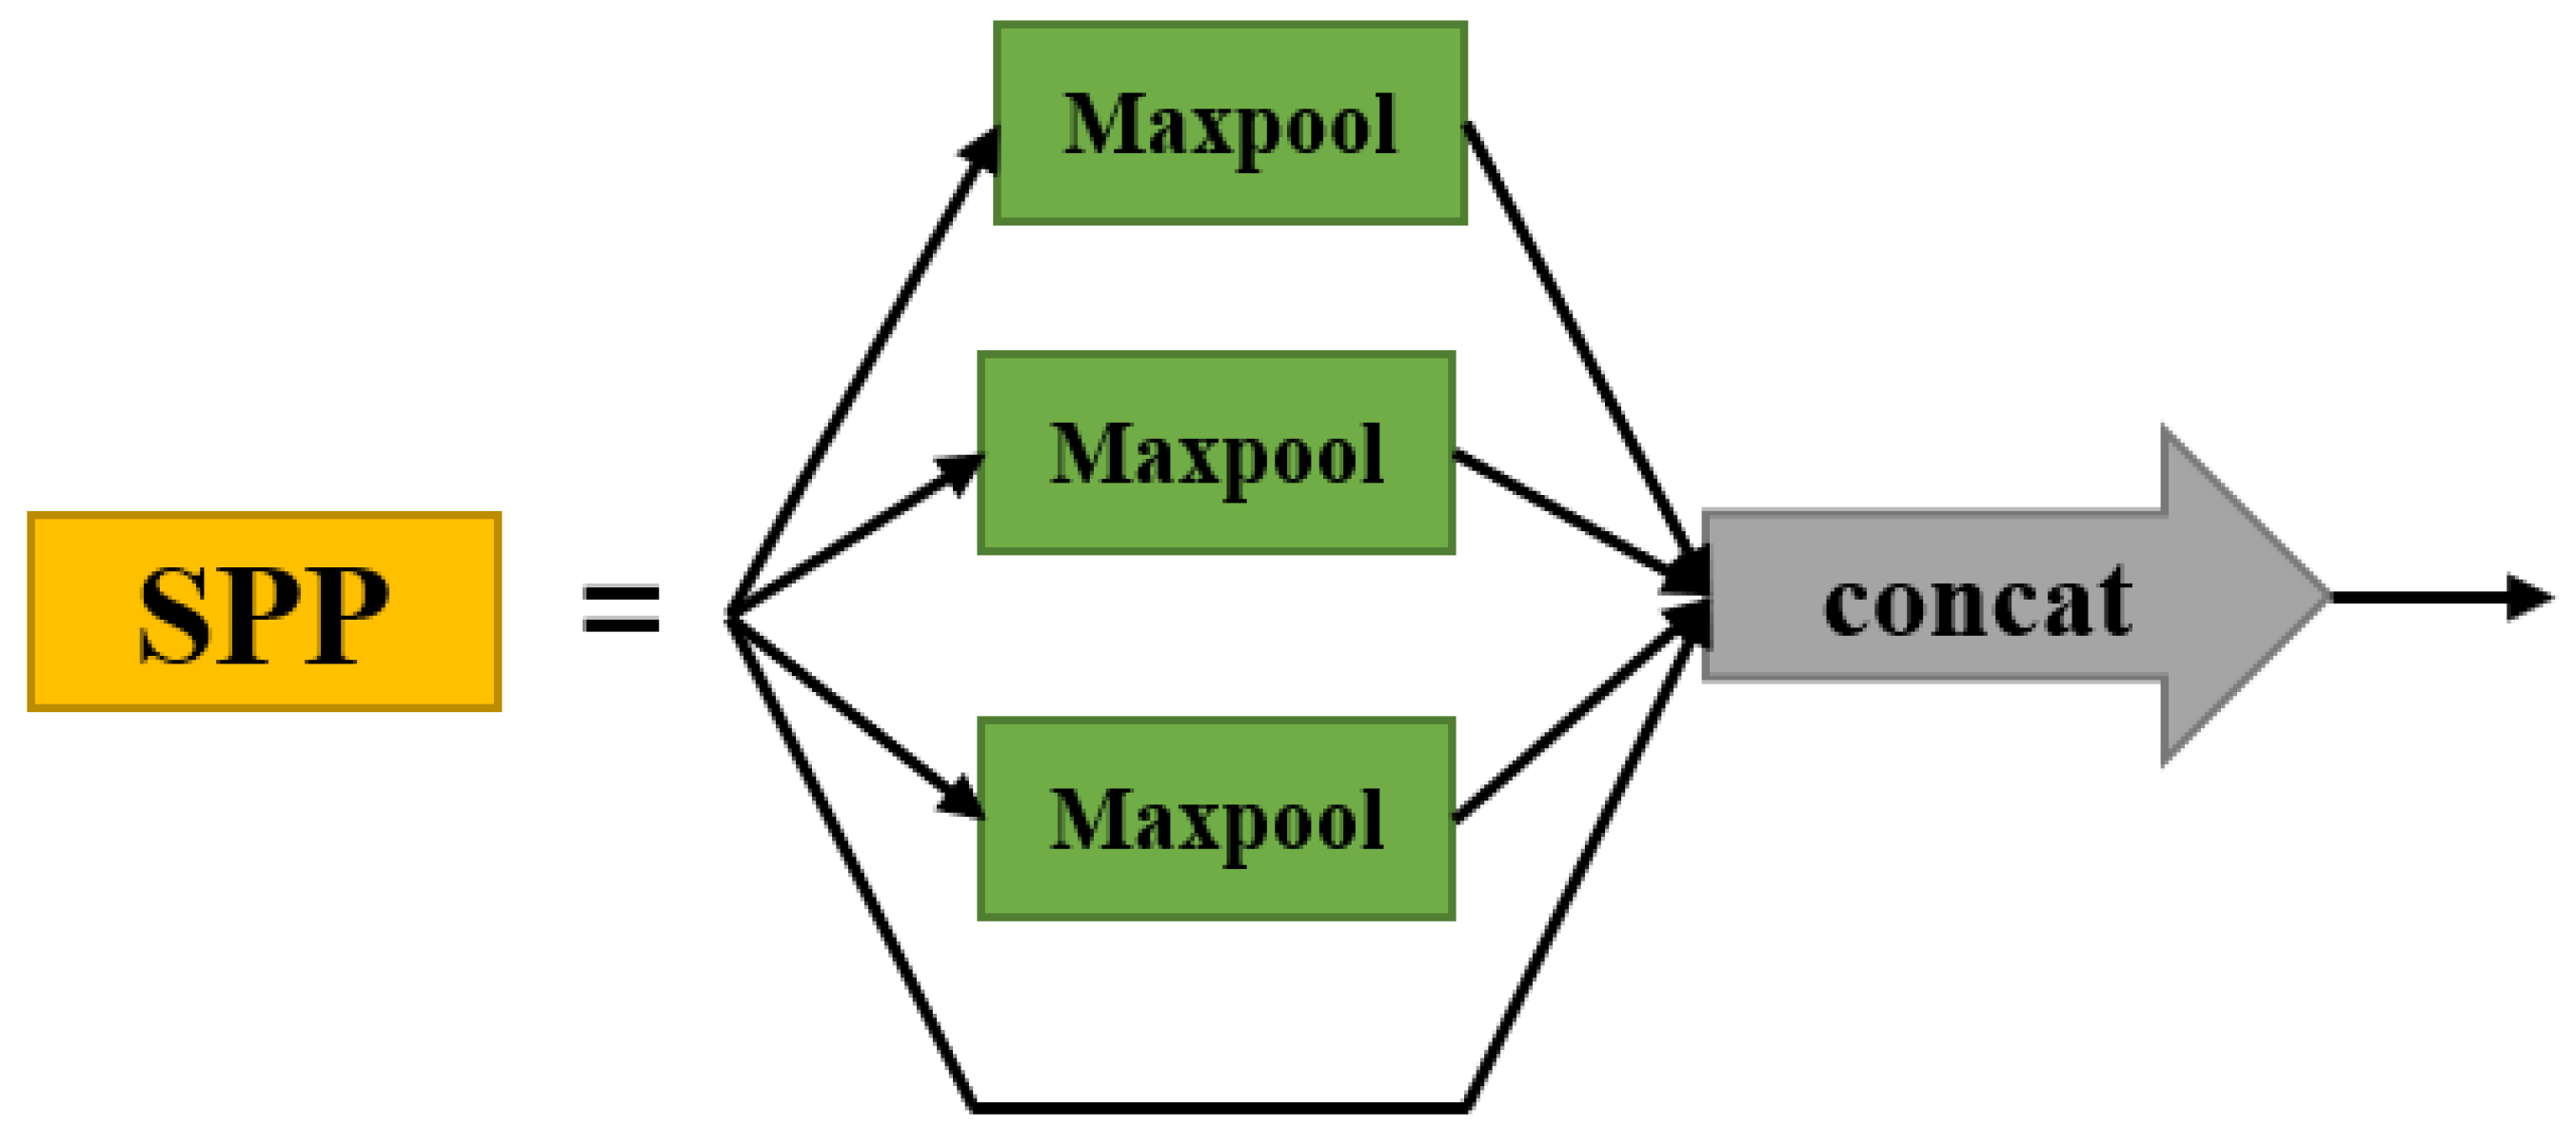
3.2.3. SPP Structure
3.2.4. CIOU Loss
3.3. DRN-YOLO Working Process
4. Results
4.1. Evaluation Indicators
4.2. Test Configurations
4.3. Testing Results
4.4. Ablation Test
5. Discussion
5.1. Model Feature Map Analysis
5.2. Comparative Performance Analysis
5.2.1. Performance Comparison of Characteristic Scales
5.2.2. Performance Comparison of SPP Pooling Structures
5.2.3. Performance Comparison of DRN Modules
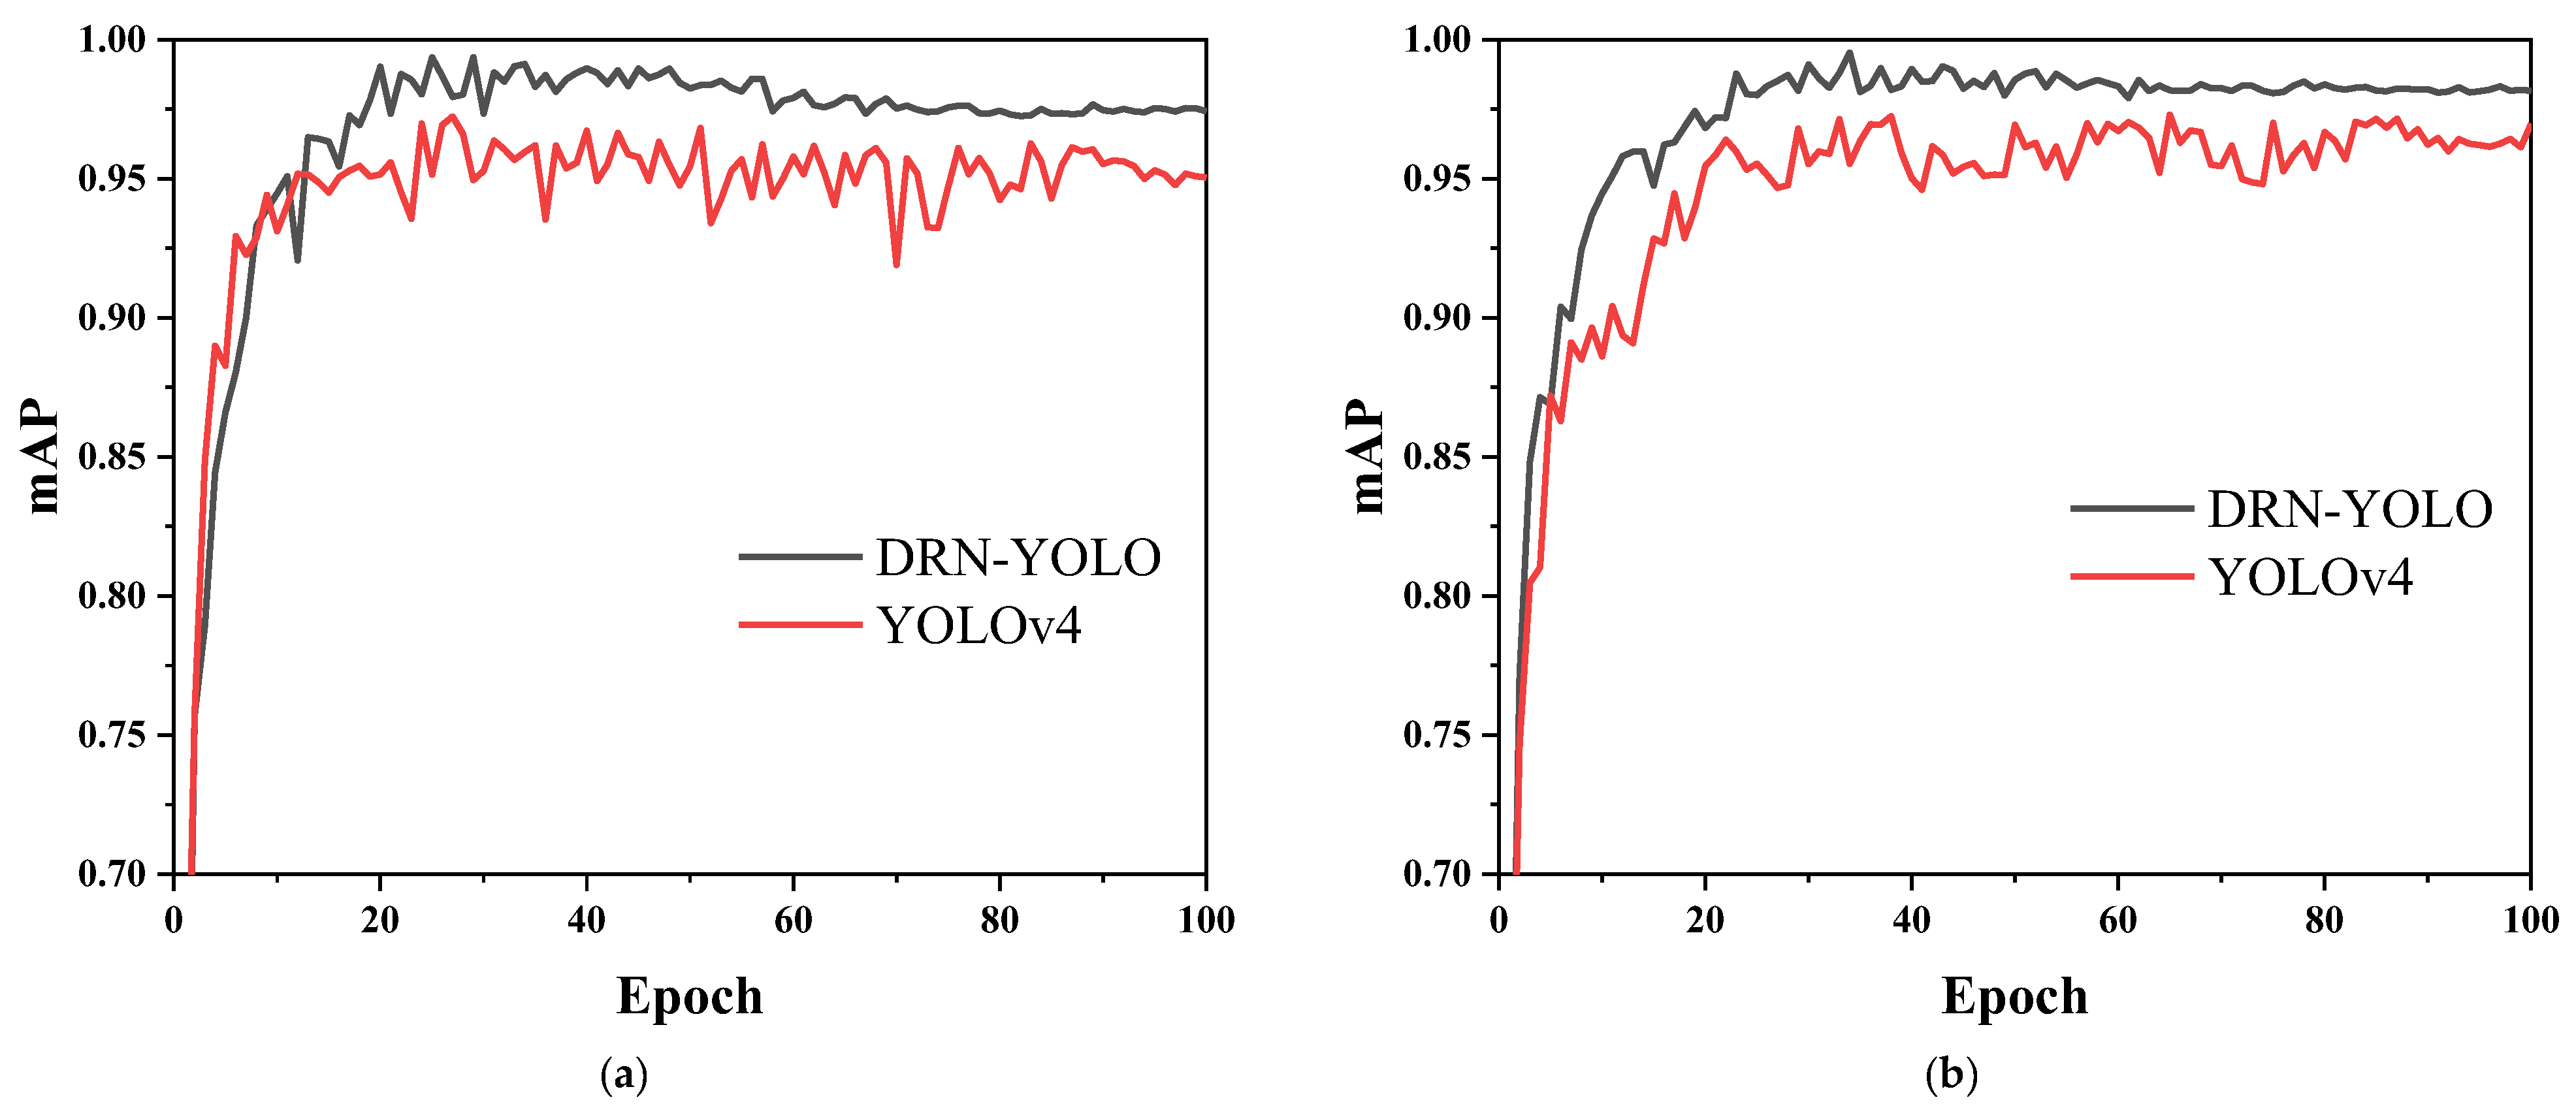
5.3. DRN-YOLO vs. YOLOv4
5.4. Comparison of DRN-YOLO with Classical Object Detection Algorithms
5.5. Limitations Analysis
6. Conclusions
Author Contributions
Funding
Institutional Review Board Statement
Informed Consent Statement
Data Availability Statement
Conflicts of Interest
References
- Bareille, N.; Beaudeau, F.; Billon, S.; Robert, A.; Faverdin, P. Effects of health disorders on feed intake and milk production in dairy cows. Livest. Prod. Sci. 2003, 83, 53–62. [Google Scholar] [CrossRef]
- Fogsgaard, K.K.; Rontved, C.M.; Sorensen, P.; Herskin, M.S. Sickness behavior in dairy cows during Escherichia coli mastitis. J. Dairy Sci. 2012, 95, 630–638. [Google Scholar] [CrossRef] [PubMed]
- Fogsgaard, K.K.; Bennedsgaard, T.W.; Herskin, M.S. Behavioral changes in freestall-housed dairy cows with naturally occurring clinical mastitis. J. Dairy Sci. 2015, 98, 1730–1738. [Google Scholar] [CrossRef] [PubMed] [Green Version]
- Thorup, V.M.; Nielsen, B.L.; Robert, P.E.; Giger-Reverdin, S.; Konka, J.; Michie, C.; Friggens, N.C. Lameness Affects Cow Feeding But Not Rumination Behavior as Characterized from Sensor Data. Front. Vet. Sci. 2016, 3, 37. [Google Scholar] [CrossRef] [PubMed] [Green Version]
- Achour, B.; Belkadi, M.; Filali, I.; Laghrouche, M.; Lahdir, M. Image analysis for individual identification and feeding behaviour monitoring of dairy cows based on Convolutional Neural Networks (CNN). Biosyst. Eng. 2020, 198, 31–49. [Google Scholar] [CrossRef]
- Chen, C.; Zhu, W.; Norton, T. Behaviour recognition of pigs and cattle: Journey from computer vision to deep learning. Comput. Electron. Agric. 2021, 187, 106255. [Google Scholar] [CrossRef]
- Shane, D.D.; White, B.J.; Larson, R.L.; Amrine, D.E.; Kramer, J.L. Probabilities of cattle participating in eating and drinking behavior when located at feeding and watering locations by a real time location system. Comput. Electron. Agric. 2016, 127, 460–466. [Google Scholar] [CrossRef]
- Pastell, M.; Frondelius, L. A hidden Markov model to estimate the time dairy cows spend in feeder based on indoor positioning data. Comput. Electron. Agric. 2018, 152, 182–185. [Google Scholar] [CrossRef]
- Porto, S.M.C.; Arcidiacono, C.; Giummarra, A.; Anguzza, U.; Cascone, G. Localisation and identification performances of a real-time location system based on ultra wide band technology for monitoring and tracking dairy cow behaviour in a semi-open free-stall barn. Comput. Electron. Agric. 2014, 108, 221–229. [Google Scholar] [CrossRef]
- Li, W.; Ji, Z.; Wang, L.; Sun, C.; Yang, X. Automatic individual identification of Holstein dairy cows using tailhead images. Comput. Electron. Agric. 2017, 142, 622–631. [Google Scholar] [CrossRef]
- Li, G.; Xiong, Y.; Du, Q.; Shi, Z.; Gates, R.S. Classifying Ingestive Behavior of Dairy Cows via Automatic Sound Recognition. Sensors 2021, 21, 5231. [Google Scholar] [CrossRef]
- Shen, W.; Sun, Y.; Zhang, Y.; Fu, X.; Hou, H.; Kou, S.; Zhang, Y. Automatic recognition method of cow ruminating behaviour based on edge computing. Comput. Electron. Agric. 2021, 191, 106495. [Google Scholar] [CrossRef]
- Kang, X.; Zhang, X.D.; Liu, G. A Review: Development of Computer Vision-Based Lameness Detection for Dairy Cows and Discussion of the Practical Applications. Sensors 2021, 21, 753. [Google Scholar] [CrossRef]
- Tian, F.; Wang, J.; Xiong, B.; Jiang, L.; Song, Z.; Li, F. Real-Time Behavioral Recognition in Dairy Cows Based on Geomagnetism and Acceleration Information. IEEE Access 2021, 9, 109497–109509. [Google Scholar] [CrossRef]
- Campos, D.P.; Abatti, P.J.; Bertotti, F.L.; Hill, J.A.G.; da Silveira, A.L.F. Surface electromyography segmentation and feature extraction for ingestive behavior recognition in ruminants. Comput. Electron. Agric. 2018, 153, 325–333. [Google Scholar] [CrossRef]
- Liu, T.; Pang, B.; Ai, S.; Sun, X. Study on Visual Detection Algorithm of Sea Surface Targets Based on Improved YOLOv3. Sensors 2020, 20, 7263. [Google Scholar] [CrossRef] [PubMed]
- Jiang, A.; Noguchi, R.; Ahamed, T. Tree Trunk Recognition in Orchard Autonomous Operations under Different Light Conditions Using a Thermal Camera and Faster R-CNN. Sensors 2022, 22, 2065. [Google Scholar] [CrossRef]
- Porto, S.M.C.; Arcidiacono, C.; Anguzza, U.; Cascone, G. The automatic detection of dairy cow feeding and standing behaviours in free-stall barns by a computer vision-based system. Biosyst. Eng. 2015, 133, 46–55. [Google Scholar] [CrossRef]
- Bezen, R.; Edan, Y.; Halachmi, I. Computer vision system for measuring individual cow feed intake using RGB-D camera and deep learning algorithms. Comput. Electron. Agric. 2020, 172, 105345. [Google Scholar] [CrossRef]
- Yang, A.; Huang, H.; Zheng, B.; Li, S.; Gan, H.; Chen, C.; Yang, X.; Xue, Y. An automatic recognition framework for sow daily behaviours based on motion and image analyses. Biosyst. Eng. 2020, 192, 56–71. [Google Scholar] [CrossRef]
- Lao, F.; Brown-Brandl, T.; Stinn, J.P.; Liu, K.; Teng, G.; Xin, H. Automatic recognition of lactating sow behaviors through depth image processing. Comput. Electron. Agric. 2016, 125, 56–62. [Google Scholar] [CrossRef] [Green Version]
- Shelley, A.N.; Lau, D.L.; Stone, A.E.; Bewley, J.M. Short communication: Measuring feed volume and weight by machine vision. J. Dairy Sci. 2016, 99, 386–391. [Google Scholar] [CrossRef] [PubMed] [Green Version]
- Singh, D.; Kumar, V.; Kaur, M. Densely connected convolutional networks-based COVID-19 screening model. Appl. Intell. 2021, 51, 3044–3051. [Google Scholar] [CrossRef] [PubMed]
- He, K.; Zhang, X.; Ren, S.; Sun, J. Deep Residual Learning for Image Recognition. In Proceedings of the 2016 IEEE Conference on Computer Vision and Pattern Recognition (CVPR 2016), Las Vegas, NV, USA, 27–30 June 2016. [Google Scholar]
- Huang, Z.; Wang, J.; Fu, X.; Yu, T.; Guo, Y.; Wang, R. DC-SPP-YOLO: Dense connection and spatial pyramid pooling based YOLO for object detection. Inf. Sci. 2020, 522, 241–258. [Google Scholar] [CrossRef] [Green Version]
- Liu, S.; Qi, L.; Qin, H.; Shi, J.; Jia, J. Path Aggregation Network for Instance Segmentation. In Proceedings of the 2018 IEEE Conference on Computer Vision and Pattern Recognition (CVPR 2018), Salt Lake City, UT, USA, 18–23 June 2018. [Google Scholar]
- Lin, T.Y.; Dollár, P.; Girshick, R.; He, K.; Hariharan, B.; Belongie, S. Feature Pyramid Networks for Object Detection. In Proceedings of the 2017 IEEE Conference on Computer Vision and Pattern Recognition (CVPR 2017), Honolulu, HI, USA, 21–26 July 2017. [Google Scholar]
- Zhang, H.; Li, F.; Liu, S.; Zhang, L.; Su, H.; Zhu, J.; Shum, H.Y. DINO: DETR with Improved DeNoising Anchor Boxes for End-to-End Object Detection. arXiv 2022, arXiv:2203.03605. [Google Scholar]


| Items | Parameters |
|---|---|
| GPU | NVIDIA PascalTM architecture with 256 CUDA cores |
| CPU | Dual-core Denver2 64-bit CPU and quad-core ARM A57 Complex |
| Video encoding/decoding | 4 K × 2 K 60 Hz encoding (HEVC); 4 K × 2 K 60 Hz decoding (12-bit support) |
| Video memory | 8 GB 128-bit LPDDR4 59.7 GB/s |
| Display | 2 DSI ports, 2 DP 1.2/HDMI 2.0 ports/eDP 1.4 ports |
| CSI | CSI support for up to 6 cameras (2 channels) CSI2 D-PHY 1.2 (2.5 Gbps per channel) |
| PCIE | Gen 2|1 × 4 + 1 × 1 or 2 × 1 + 1 × 2 |
| Data storage | 32 GB eMMC, SDIO, SATA |
| Other | CAN, UART, SPI, I2C, I2S, GPIO |
| Connectable | 1 Gigabit Ethernet, 802.11ac WLAN, Bluetooth |
| Mechanical | 50 mm × 87 mm (400-pin compatible board-to-board connector) |
| Shooting Direction | Number of Training Datasets | Number of Test Datasets | Number of Feeding Behaviours | Number of Chewing Behaviours | Number of Pushing Behaviours |
|---|---|---|---|---|---|
| Front | 4484 | 758 | 5684 | 792 | 1613 |
| Top | 4320 | 726 | 6958 | 960 | 1946 |
| YOLOv4 | DRNet | Four-Feature Scale | SPP | mAP (%) | Precision (%) | Recall (%) | F1-Score |
|---|---|---|---|---|---|---|---|
| √ | 95.13 | 95.46 | 94.69 | 95.07 | |||
| √ | √ | 95.86 | 96.03 | 95.24 | 95.63 | ||
| √ | √ | √ | 96.27 | 96.42 | 95.75 | 96.08 | |
| √ | √ | 96.16 | 96.24 | 95.53 | 95.88 | ||
| √ | √ | √ | 96.58 | 96.72 | 96.17 | 96.44 | |
| √ | √ | √ | √ | 96.91 | 97.16 | 96.51 | 96.83 |
| YOLOv4 | DRNet | Four-Feature Scale | SPP | mAP (%) | Precision (%) | Recall (%) | F1-Score |
|---|---|---|---|---|---|---|---|
| √ | 95.01 | 95.17 | 94.98 | 95.07 | |||
| √ | √ | 95.53 | 95.73 | 95.03 | 95.38 | ||
| √ | √ | √ | 95.97 | 96.12 | 95.48 | 95.80 | |
| √ | √ | 95.69 | 95.96 | 95.26 | 95.61 | ||
| √ | √ | √ | 96.08 | 96.44 | 95.70 | 96.07 | |
| √ | √ | √ | √ | 96.49 | 96.84 | 96.25 | 96.54 |
| Model | Precision (%) | Recall (%) | mAP (%) | F1-Score (%) | Time (ms) |
|---|---|---|---|---|---|
| YOLOv4 | 95.46 | 94.69 | 95.13 | 95.07 | 31.17 |
| SSD | 95.34 | 95.08 | 95.14 | 95.21 | - |
| Faster RCNN | 97.11 | 96.50 | 96.88 | 96.80 | 160 |
| DRN-YOLO(OURS) | 97.16 | 96.51 | 96.91 | 96.83 | 22.65 |
| Model | Precision (%) | Recall (%) | mAP (%) | F1-Score (%) | Time (ms) |
|---|---|---|---|---|---|
| YOLOv4 | 95.17 | 94.98 | 95.01 | 95.07 | 31.17 |
| SSD | 95.14 | 94.96 | 95.04 | 95.04 | - |
| Faster RCNN | 96.81 | 96.21 | 96.43 | 96.51 | 160 |
| DRN-YOLO(OURS) | 96.84 | 96.25 | 96.49 | 96.55 | 22.65 |
Publisher’s Note: MDPI stays neutral with regard to jurisdictional claims in published maps and institutional affiliations. |
© 2022 by the authors. Licensee MDPI, Basel, Switzerland. This article is an open access article distributed under the terms and conditions of the Creative Commons Attribution (CC BY) license (https://creativecommons.org/licenses/by/4.0/).
Share and Cite
Yu, Z.; Liu, Y.; Yu, S.; Wang, R.; Song, Z.; Yan, Y.; Li, F.; Wang, Z.; Tian, F. Automatic Detection Method of Dairy Cow Feeding Behaviour Based on YOLO Improved Model and Edge Computing. Sensors 2022, 22, 3271. https://doi.org/10.3390/s22093271
Yu Z, Liu Y, Yu S, Wang R, Song Z, Yan Y, Li F, Wang Z, Tian F. Automatic Detection Method of Dairy Cow Feeding Behaviour Based on YOLO Improved Model and Edge Computing. Sensors. 2022; 22(9):3271. https://doi.org/10.3390/s22093271
Chicago/Turabian StyleYu, Zhenwei, Yuehua Liu, Sufang Yu, Ruixue Wang, Zhanhua Song, Yinfa Yan, Fade Li, Zhonghua Wang, and Fuyang Tian. 2022. "Automatic Detection Method of Dairy Cow Feeding Behaviour Based on YOLO Improved Model and Edge Computing" Sensors 22, no. 9: 3271. https://doi.org/10.3390/s22093271
APA StyleYu, Z., Liu, Y., Yu, S., Wang, R., Song, Z., Yan, Y., Li, F., Wang, Z., & Tian, F. (2022). Automatic Detection Method of Dairy Cow Feeding Behaviour Based on YOLO Improved Model and Edge Computing. Sensors, 22(9), 3271. https://doi.org/10.3390/s22093271