
Tomek Link and SMOTE Approaches for Machine Fault Classification with an Imbalanced Dataset


Abstract
:1. Introduction
2. Background
2.1. Overview
2.2. Imbalanced Dataset
2.3. Intelligent Approaches
2.4. Resampling Techniques
2.5. Assessment Metrics

| Positive | Negative | |
|---|---|---|
| Positive | True positive (TP) | False negative(FN) |
| Negative | False positive (FP) | True negative (TN) |
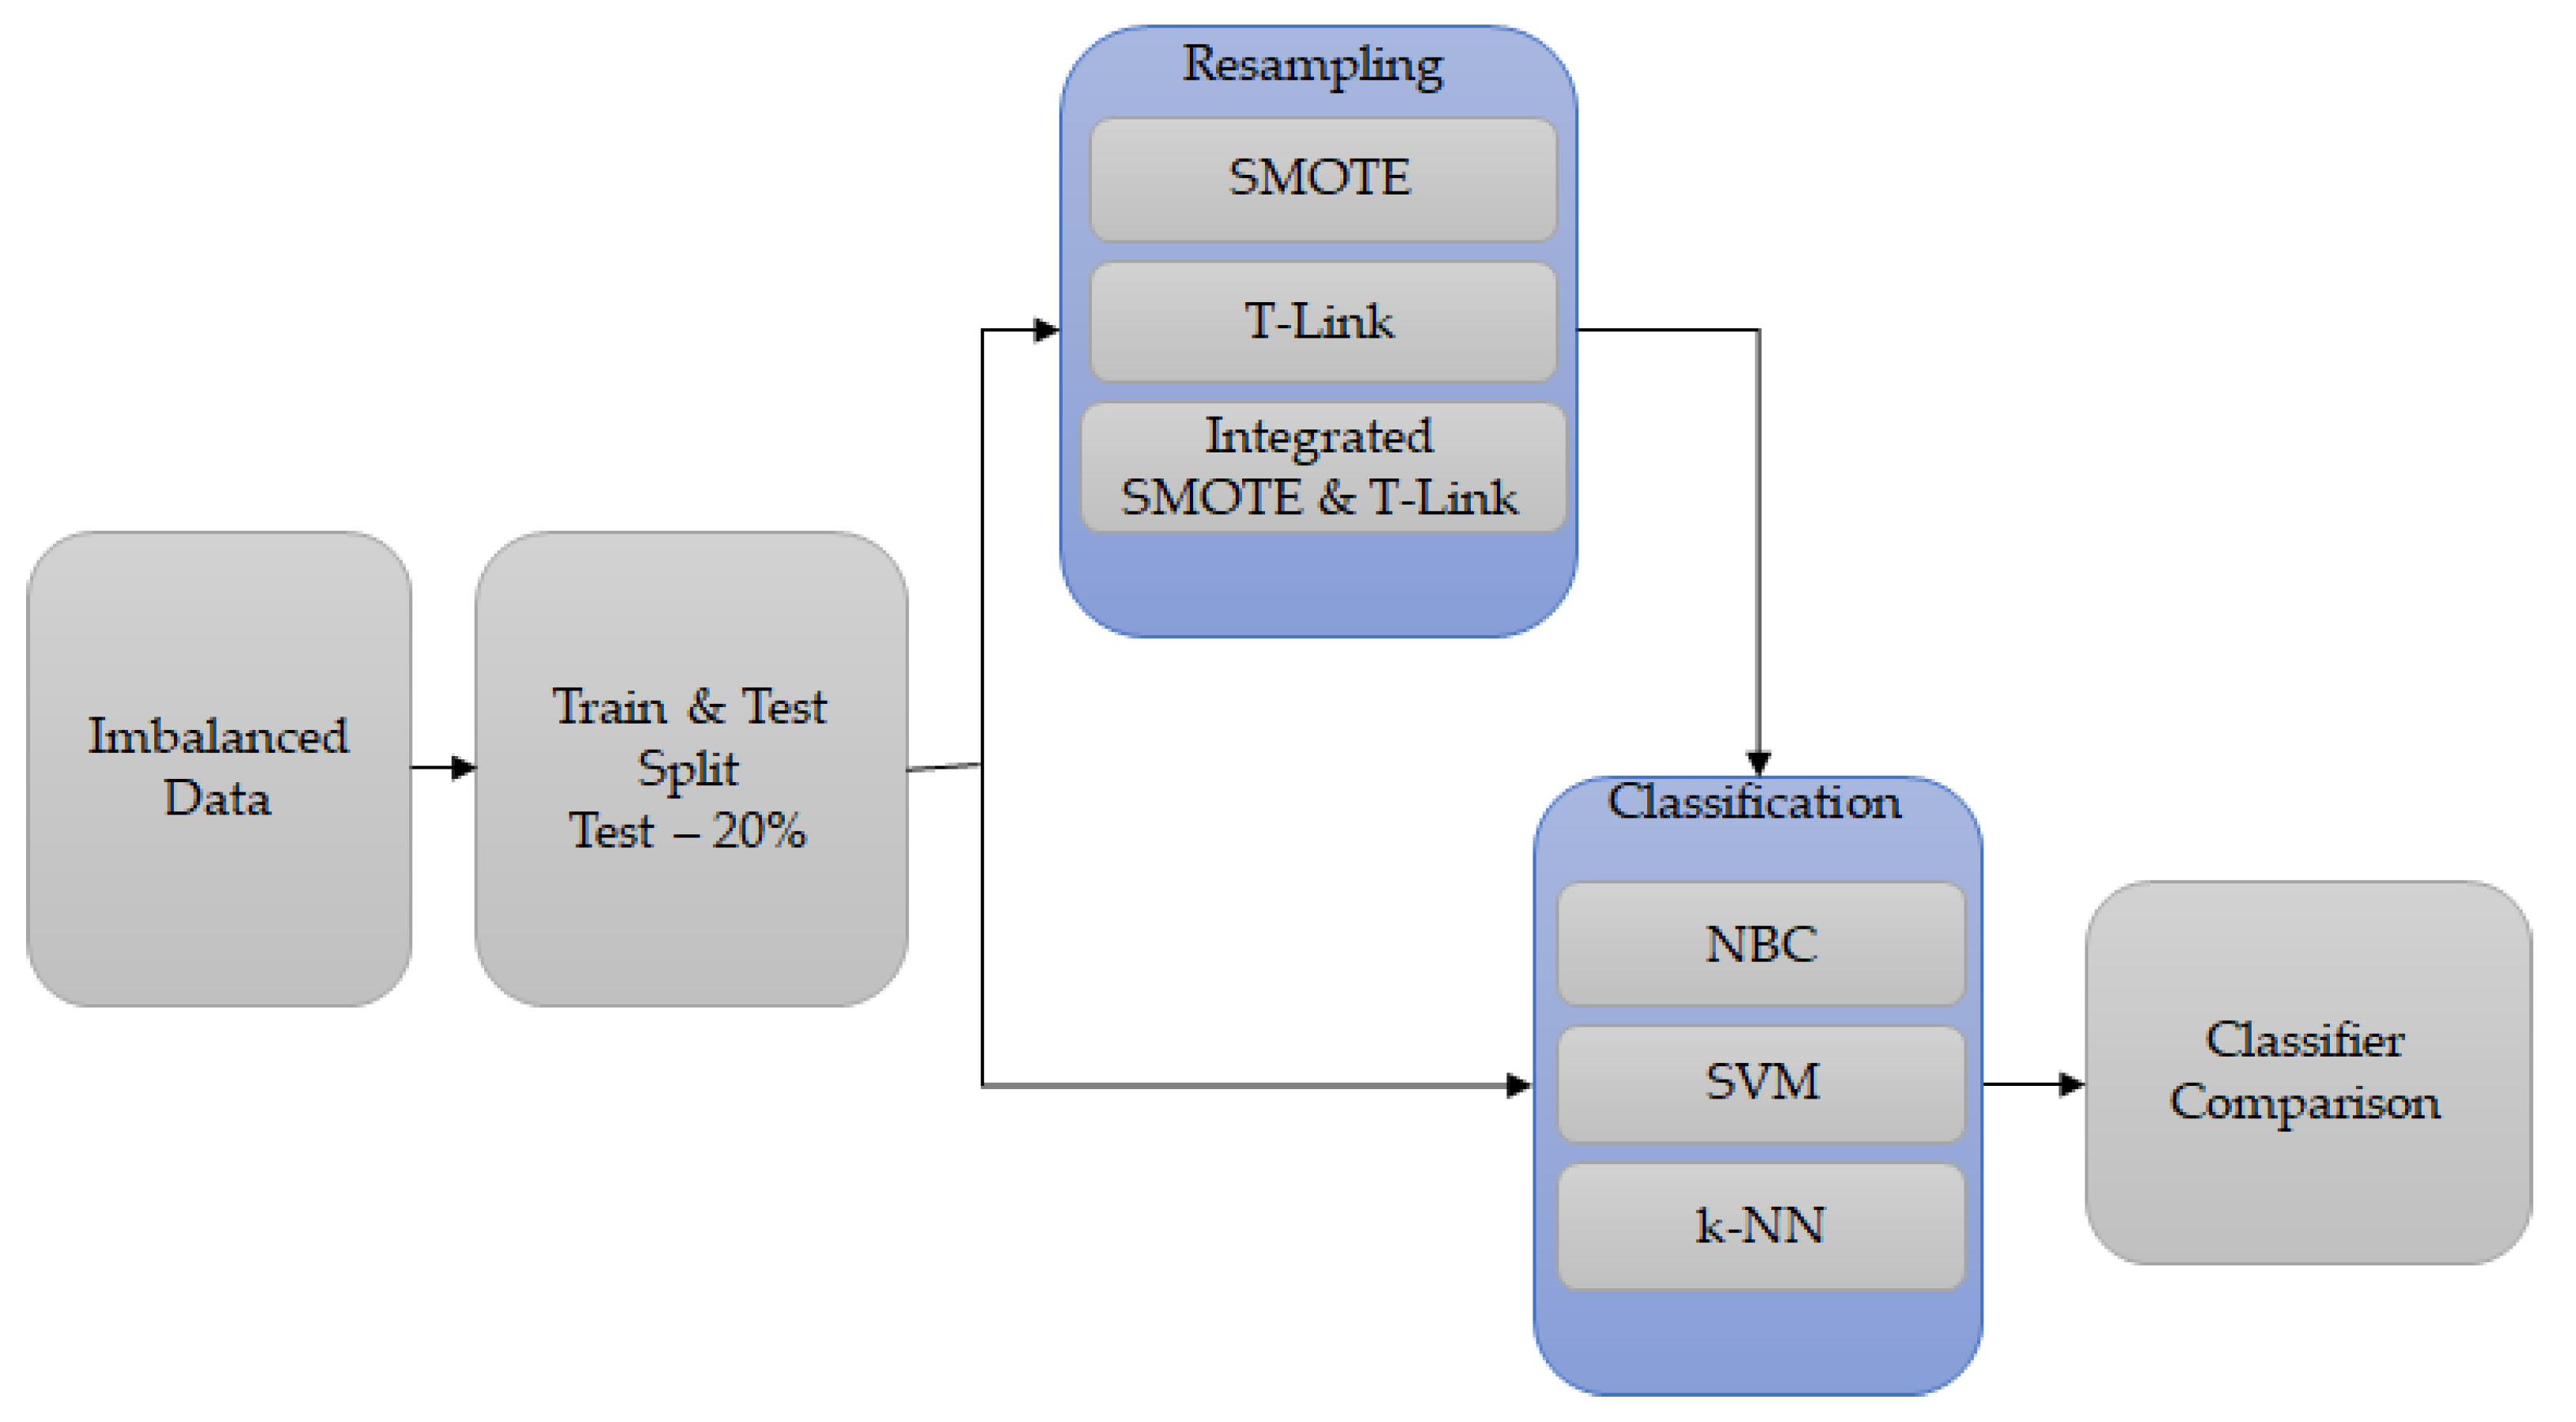
3. Methodology
3.1. Overview
3.2. Process Description
3.3. Feature Extraction
3.4. Classification Process
4. Results and Analysis
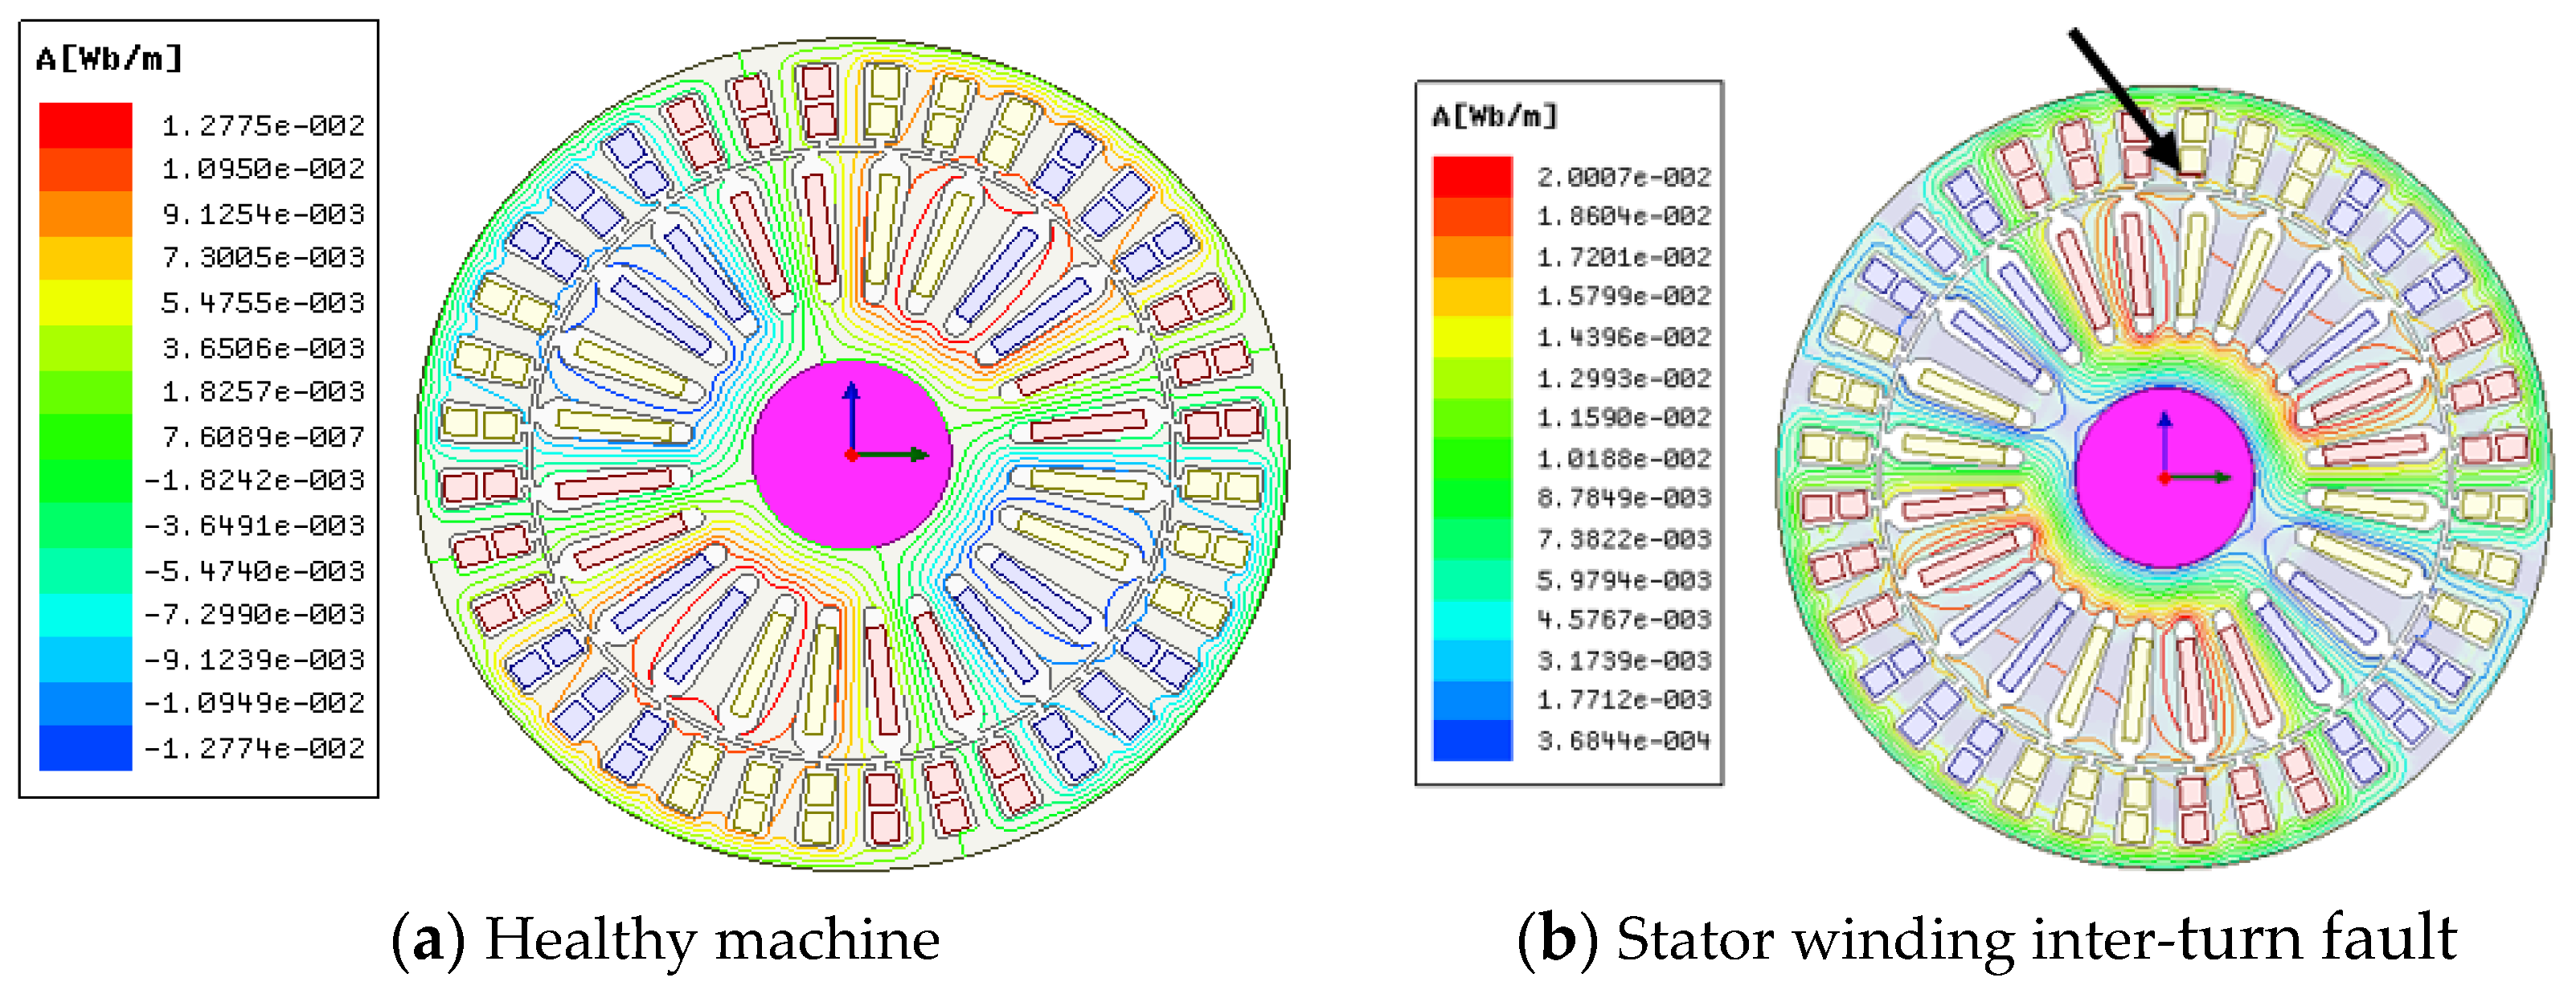
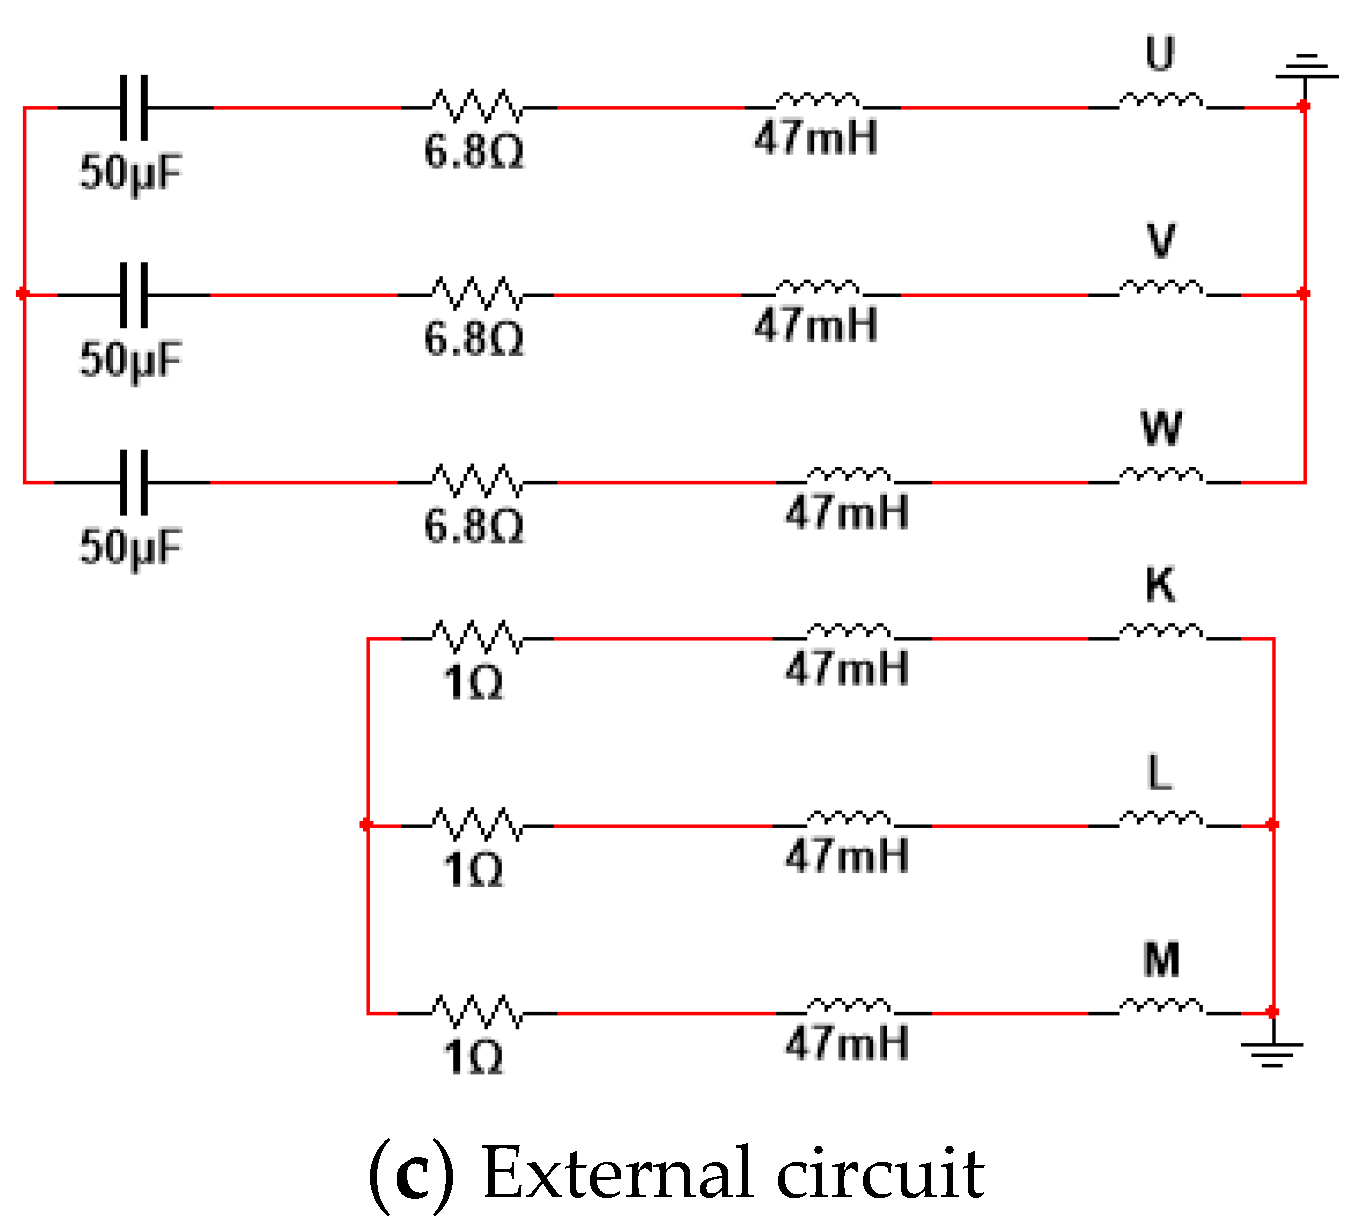
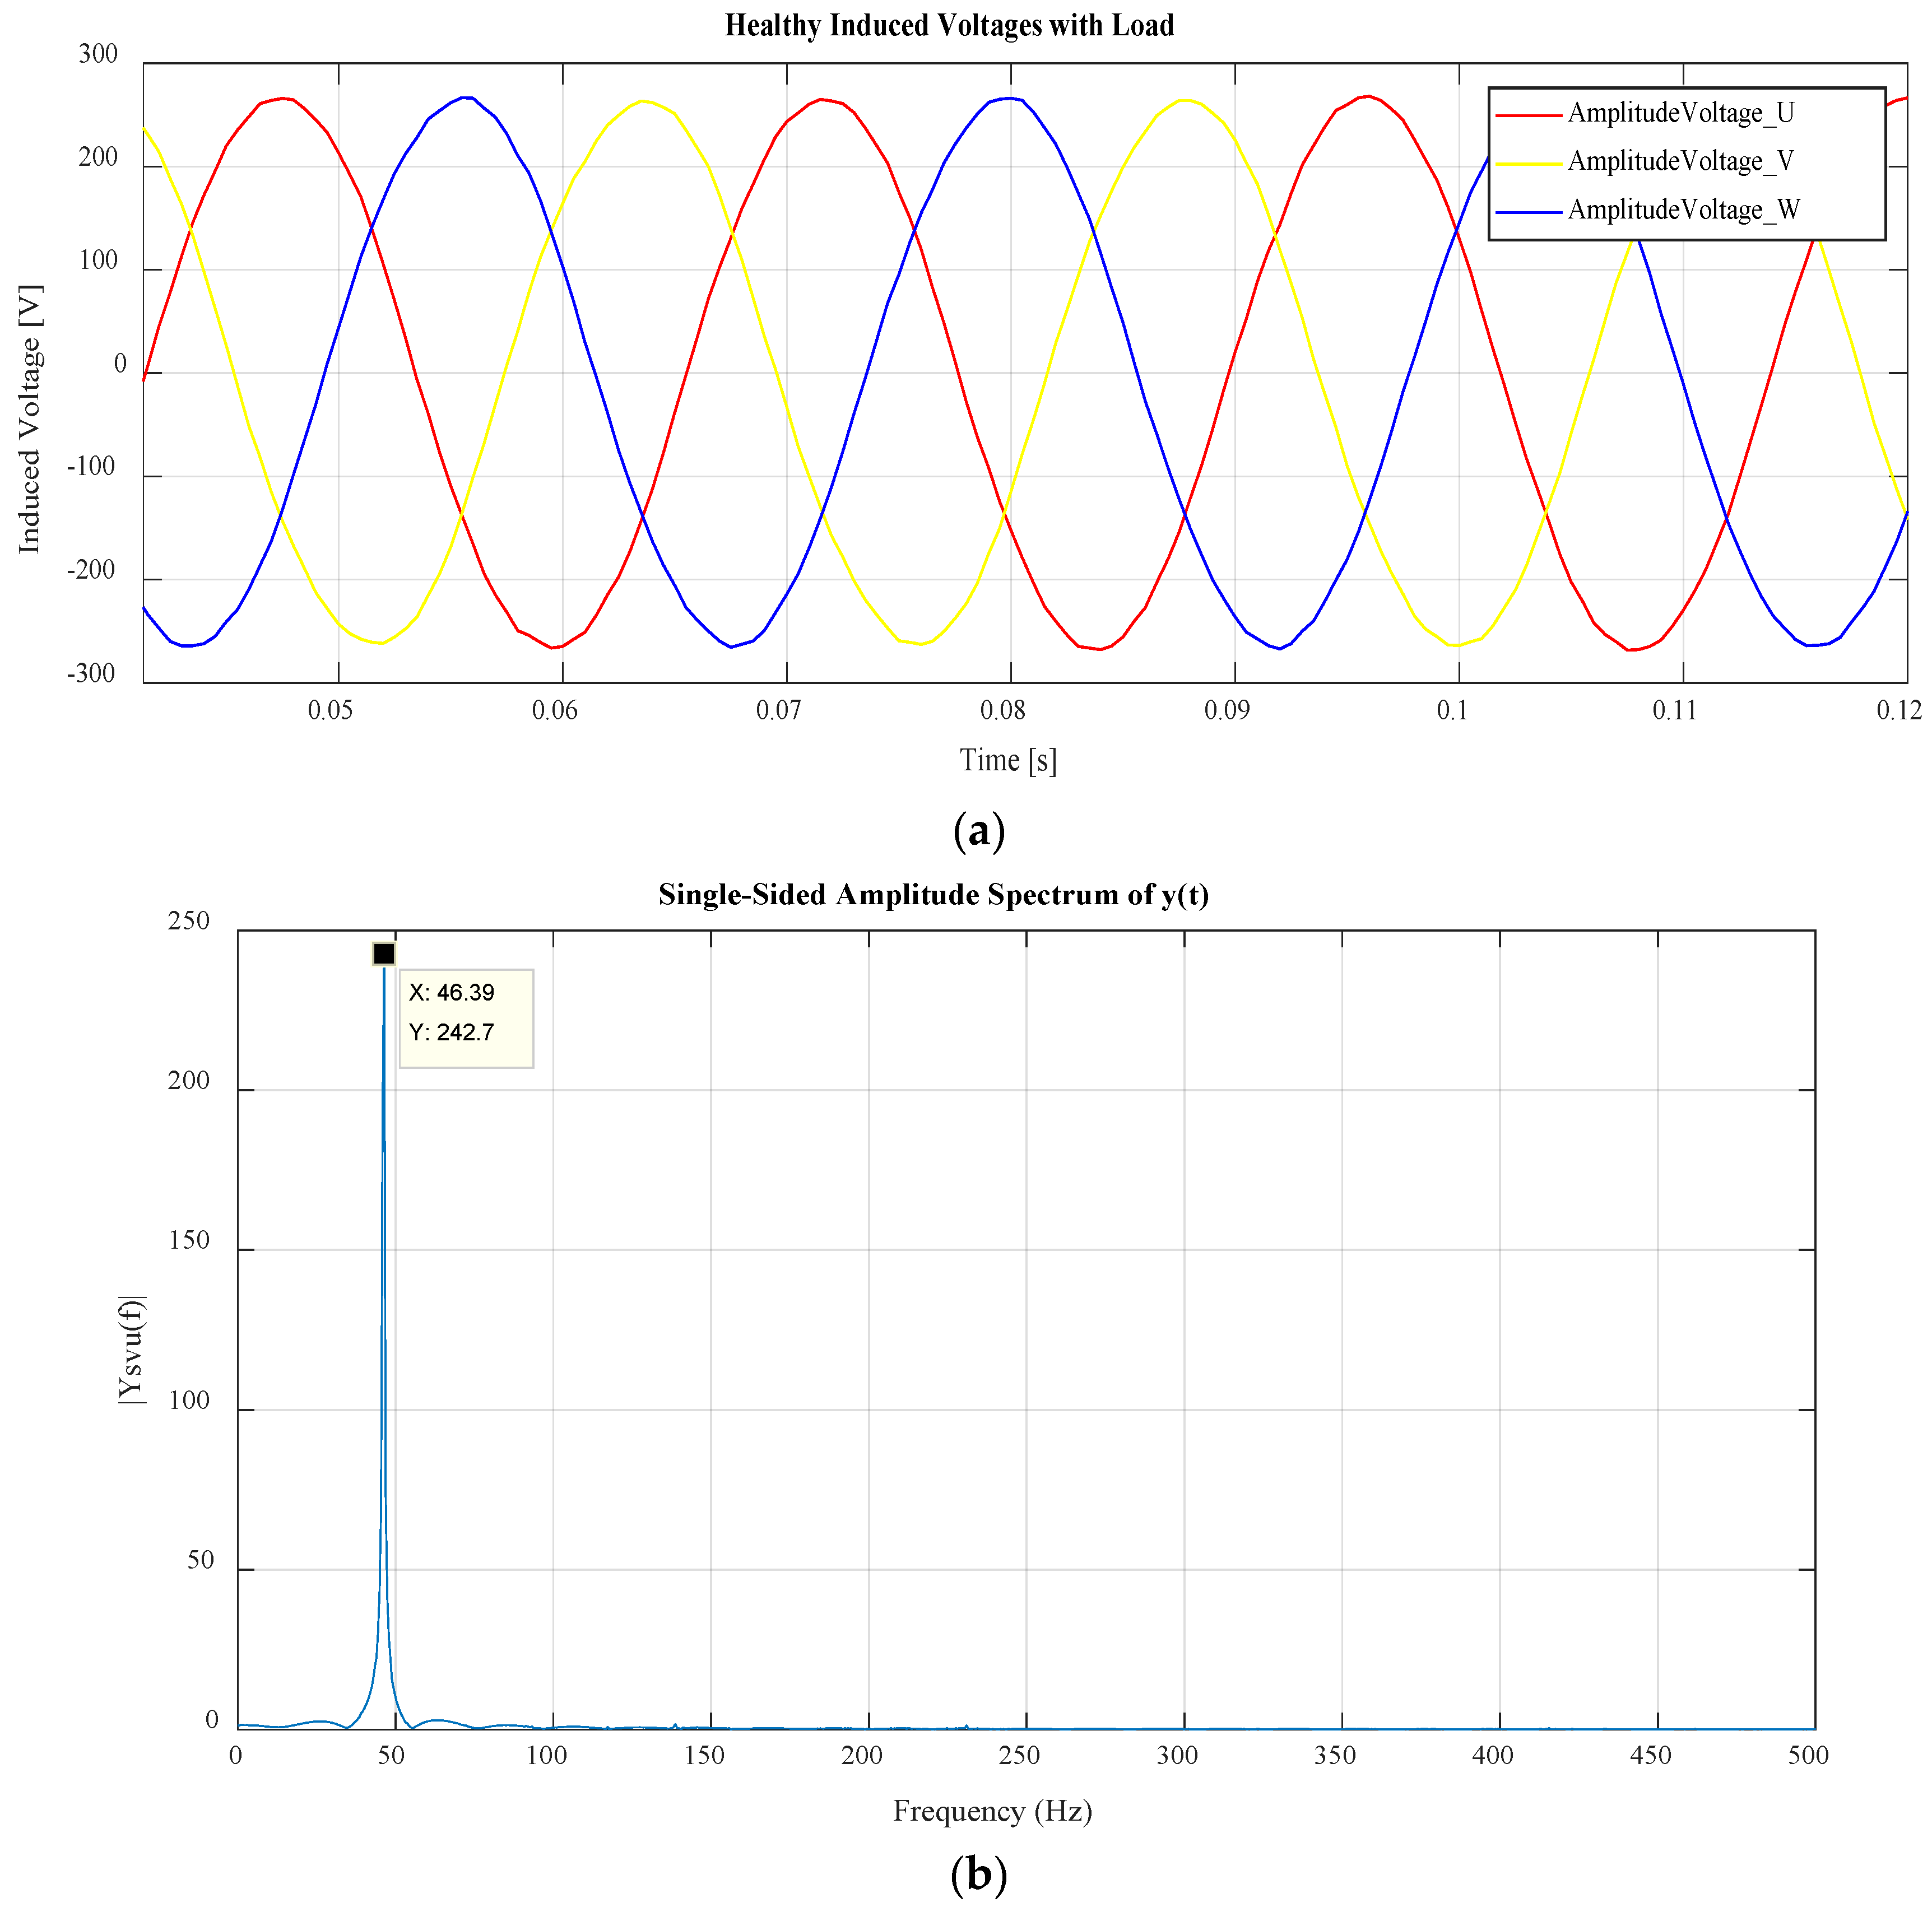
4.1. Simulation Analysis
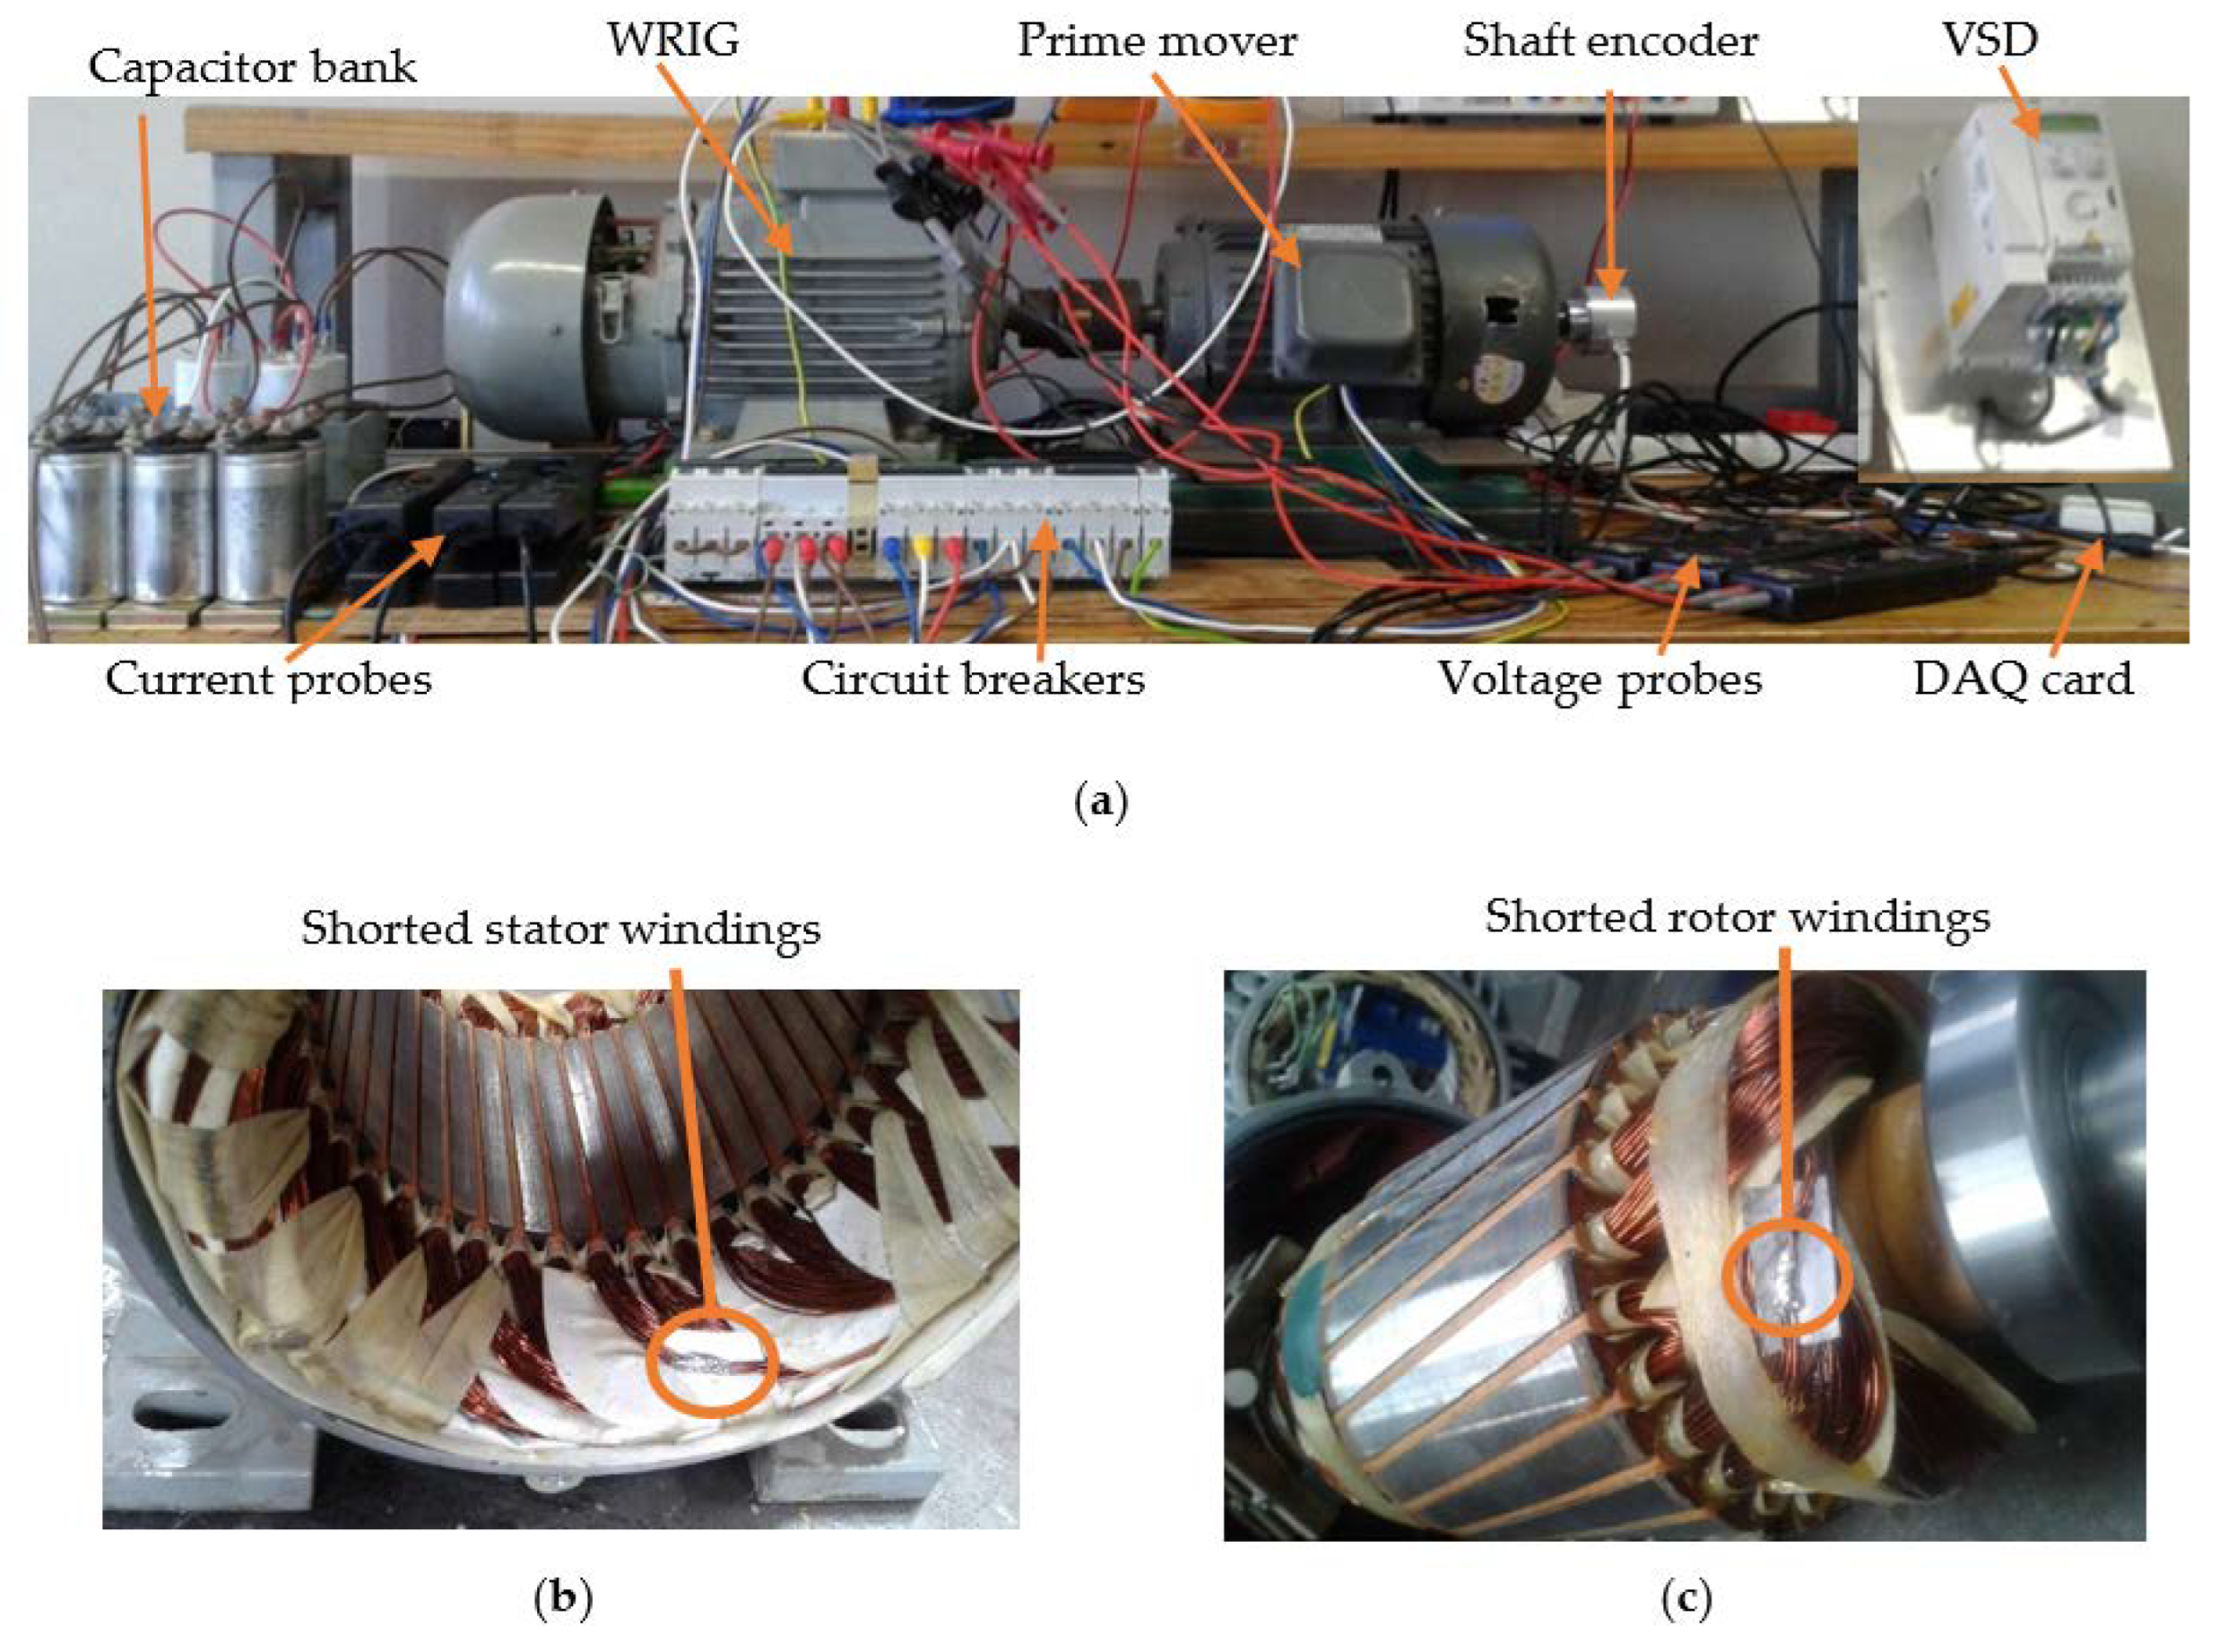
4.2. Experimental Analysis
4.3. Discussions
5. Conclusions
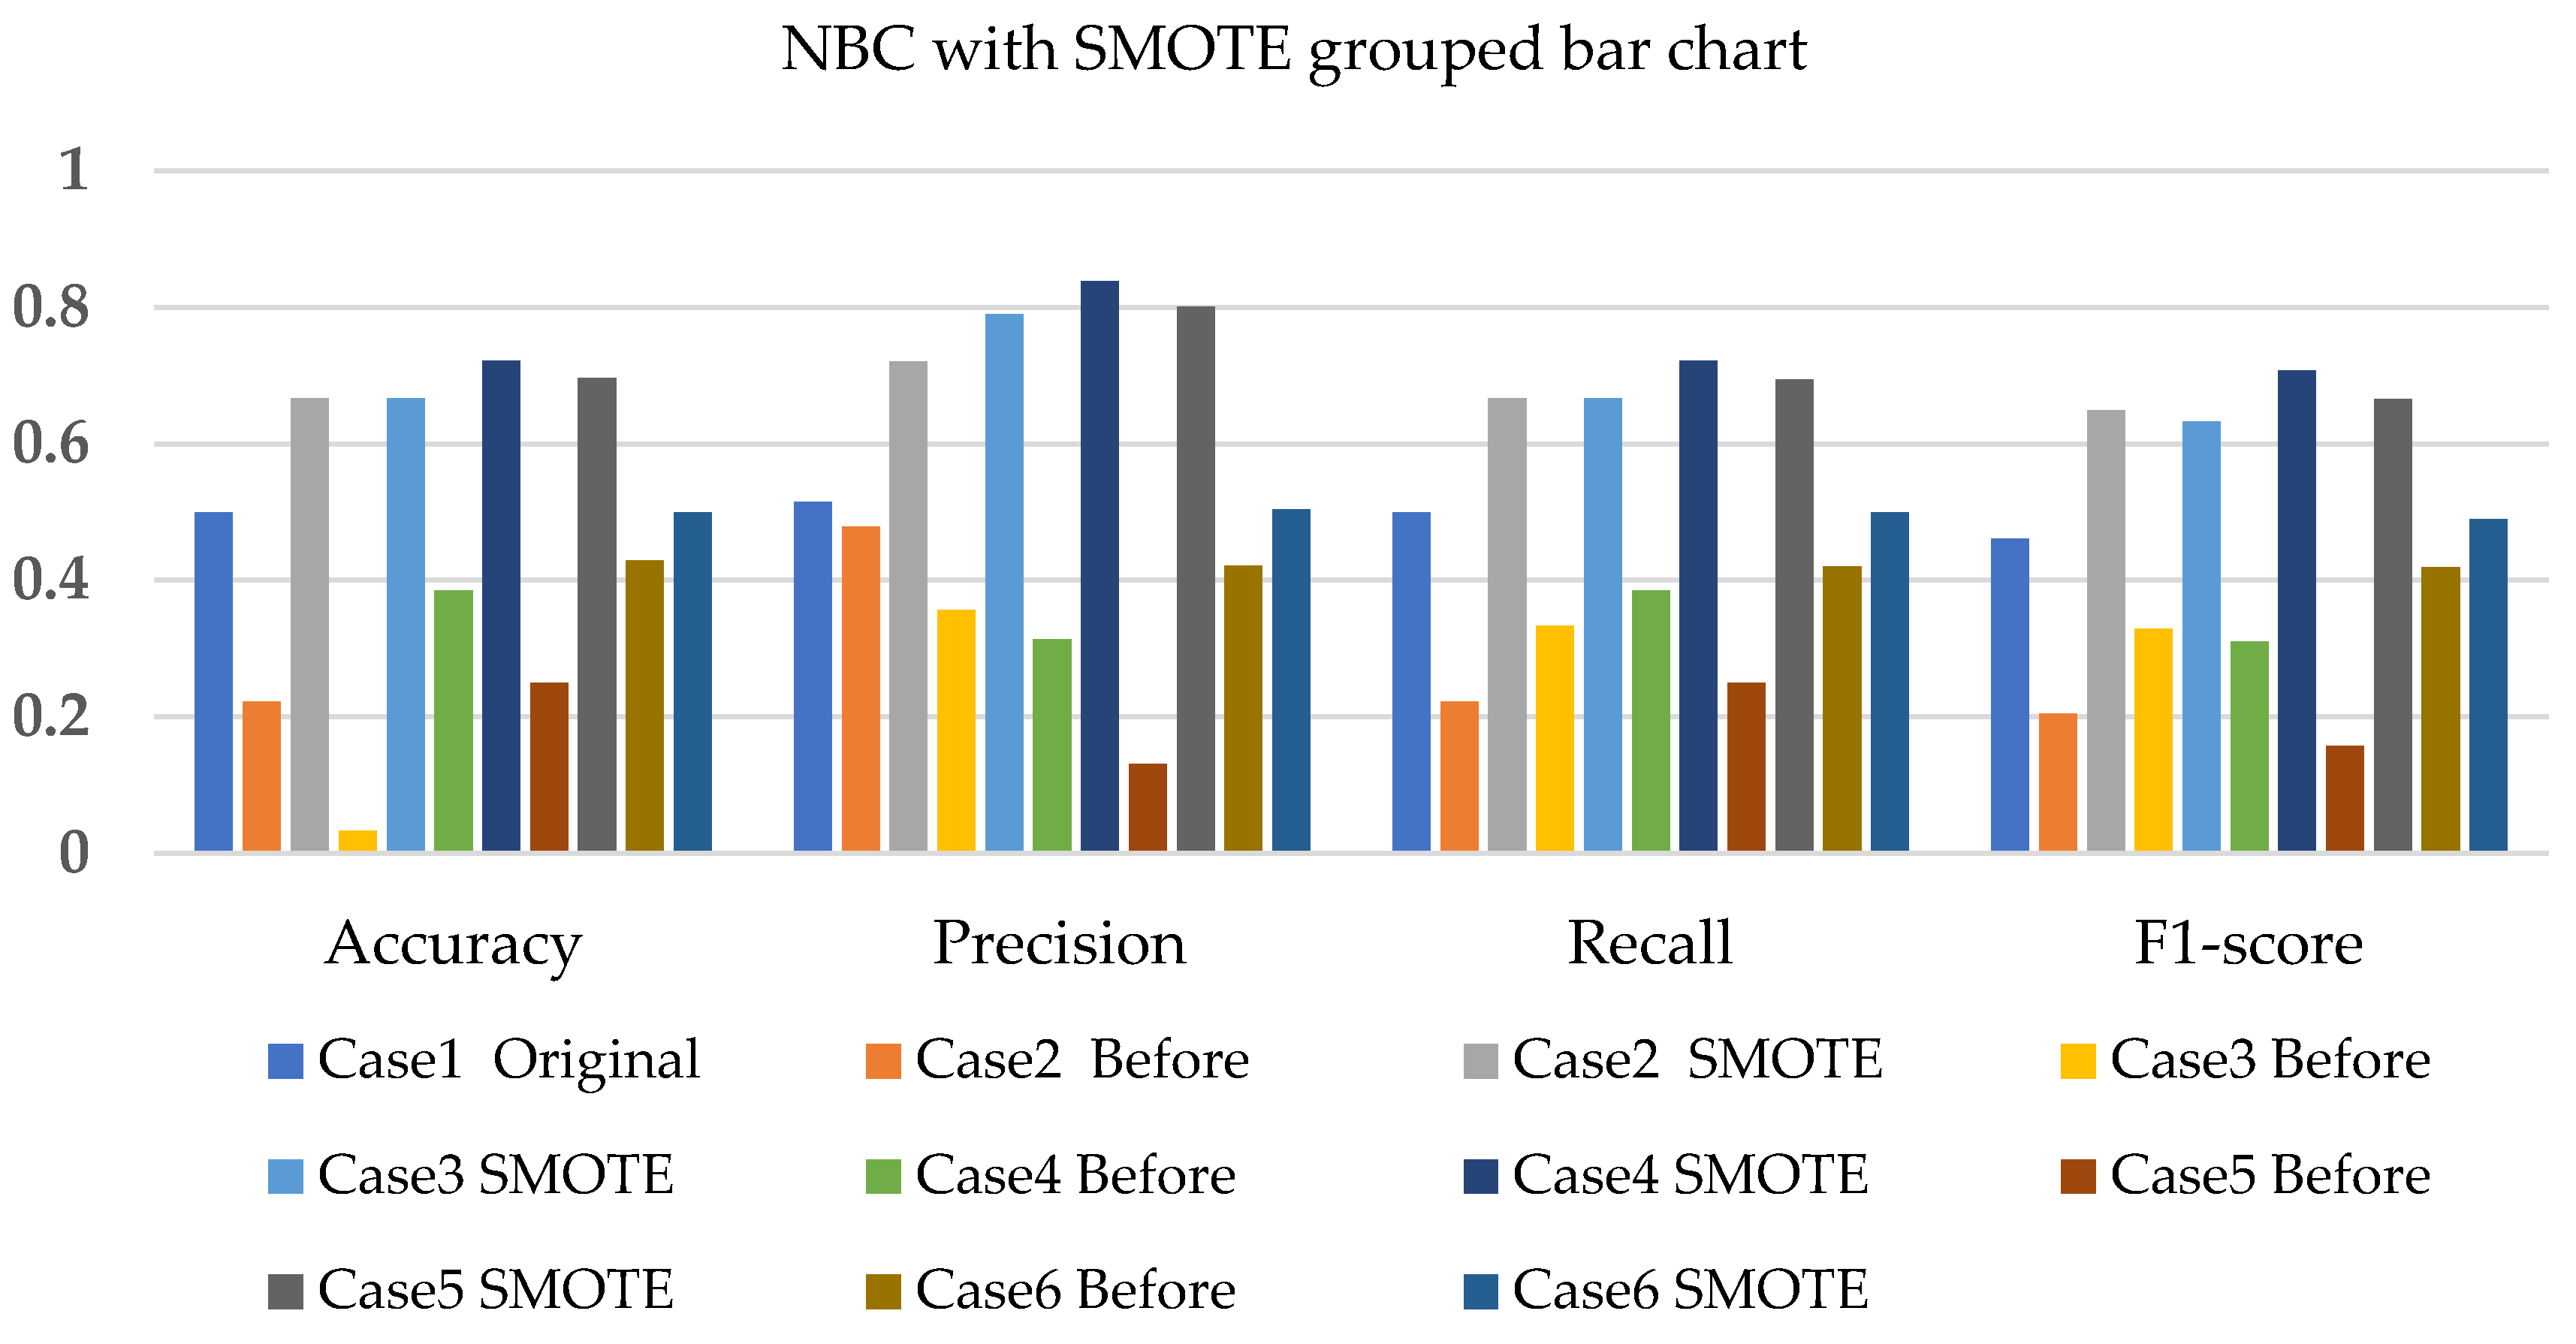
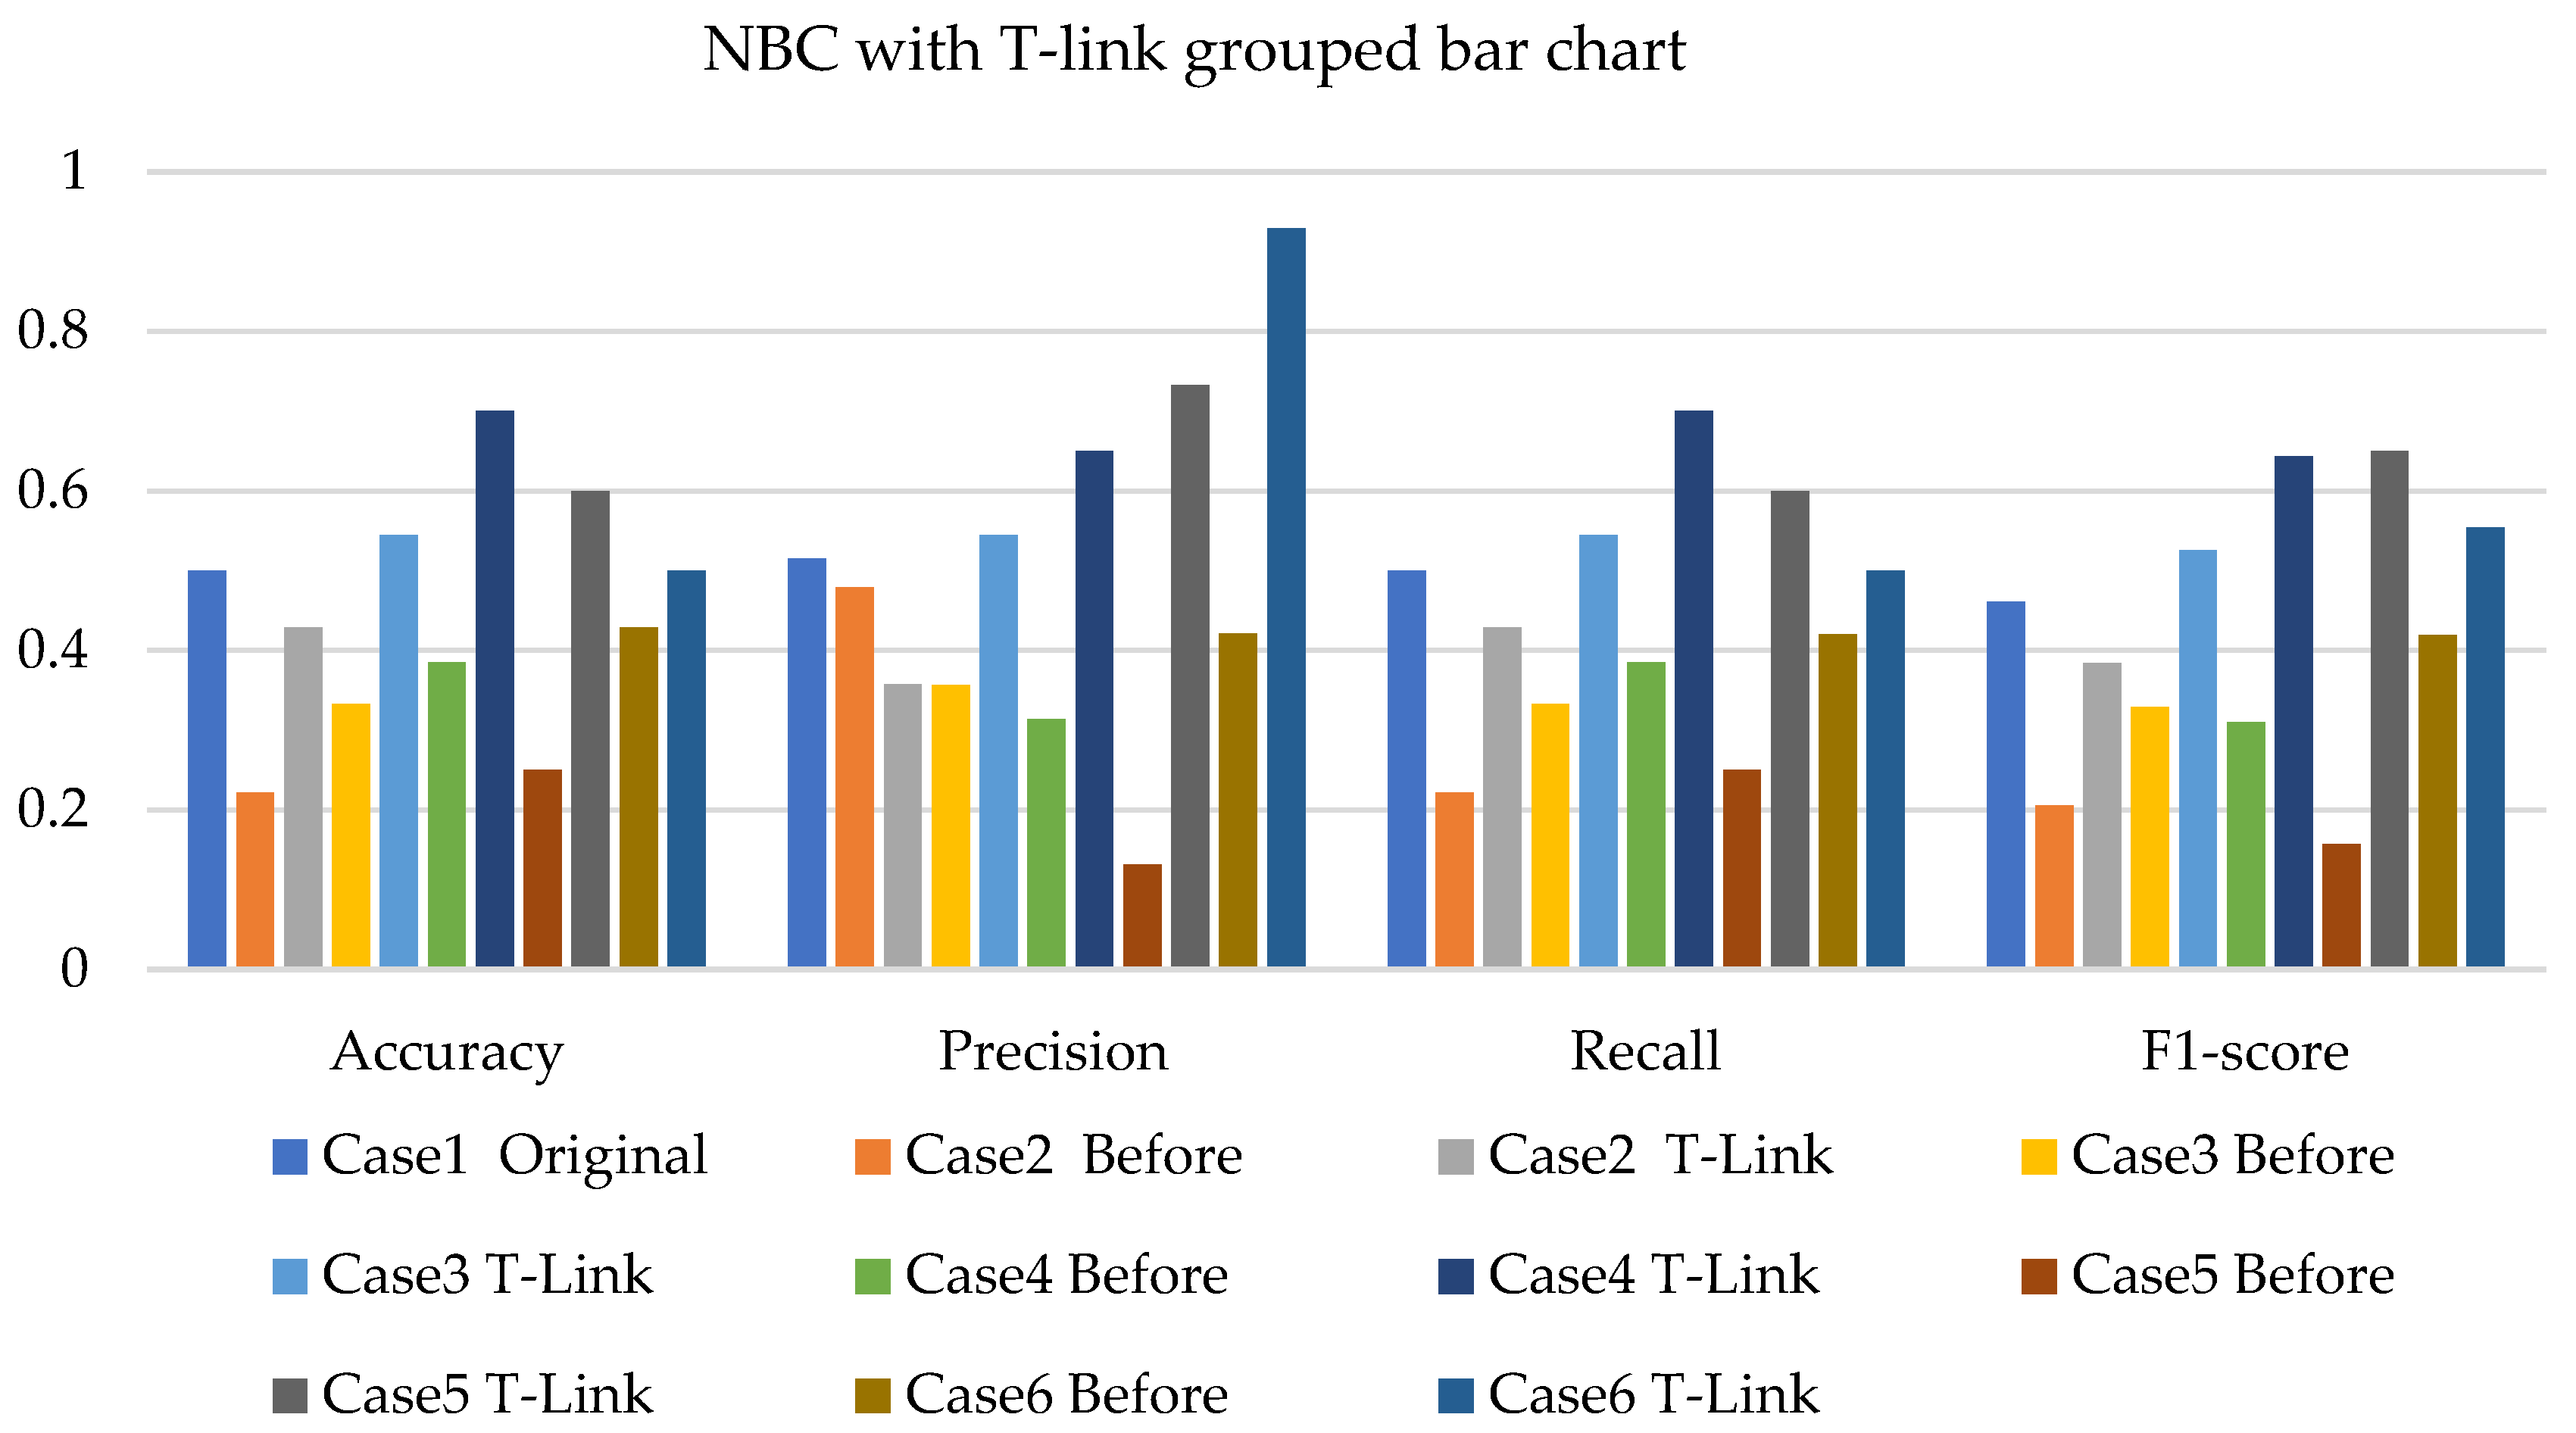
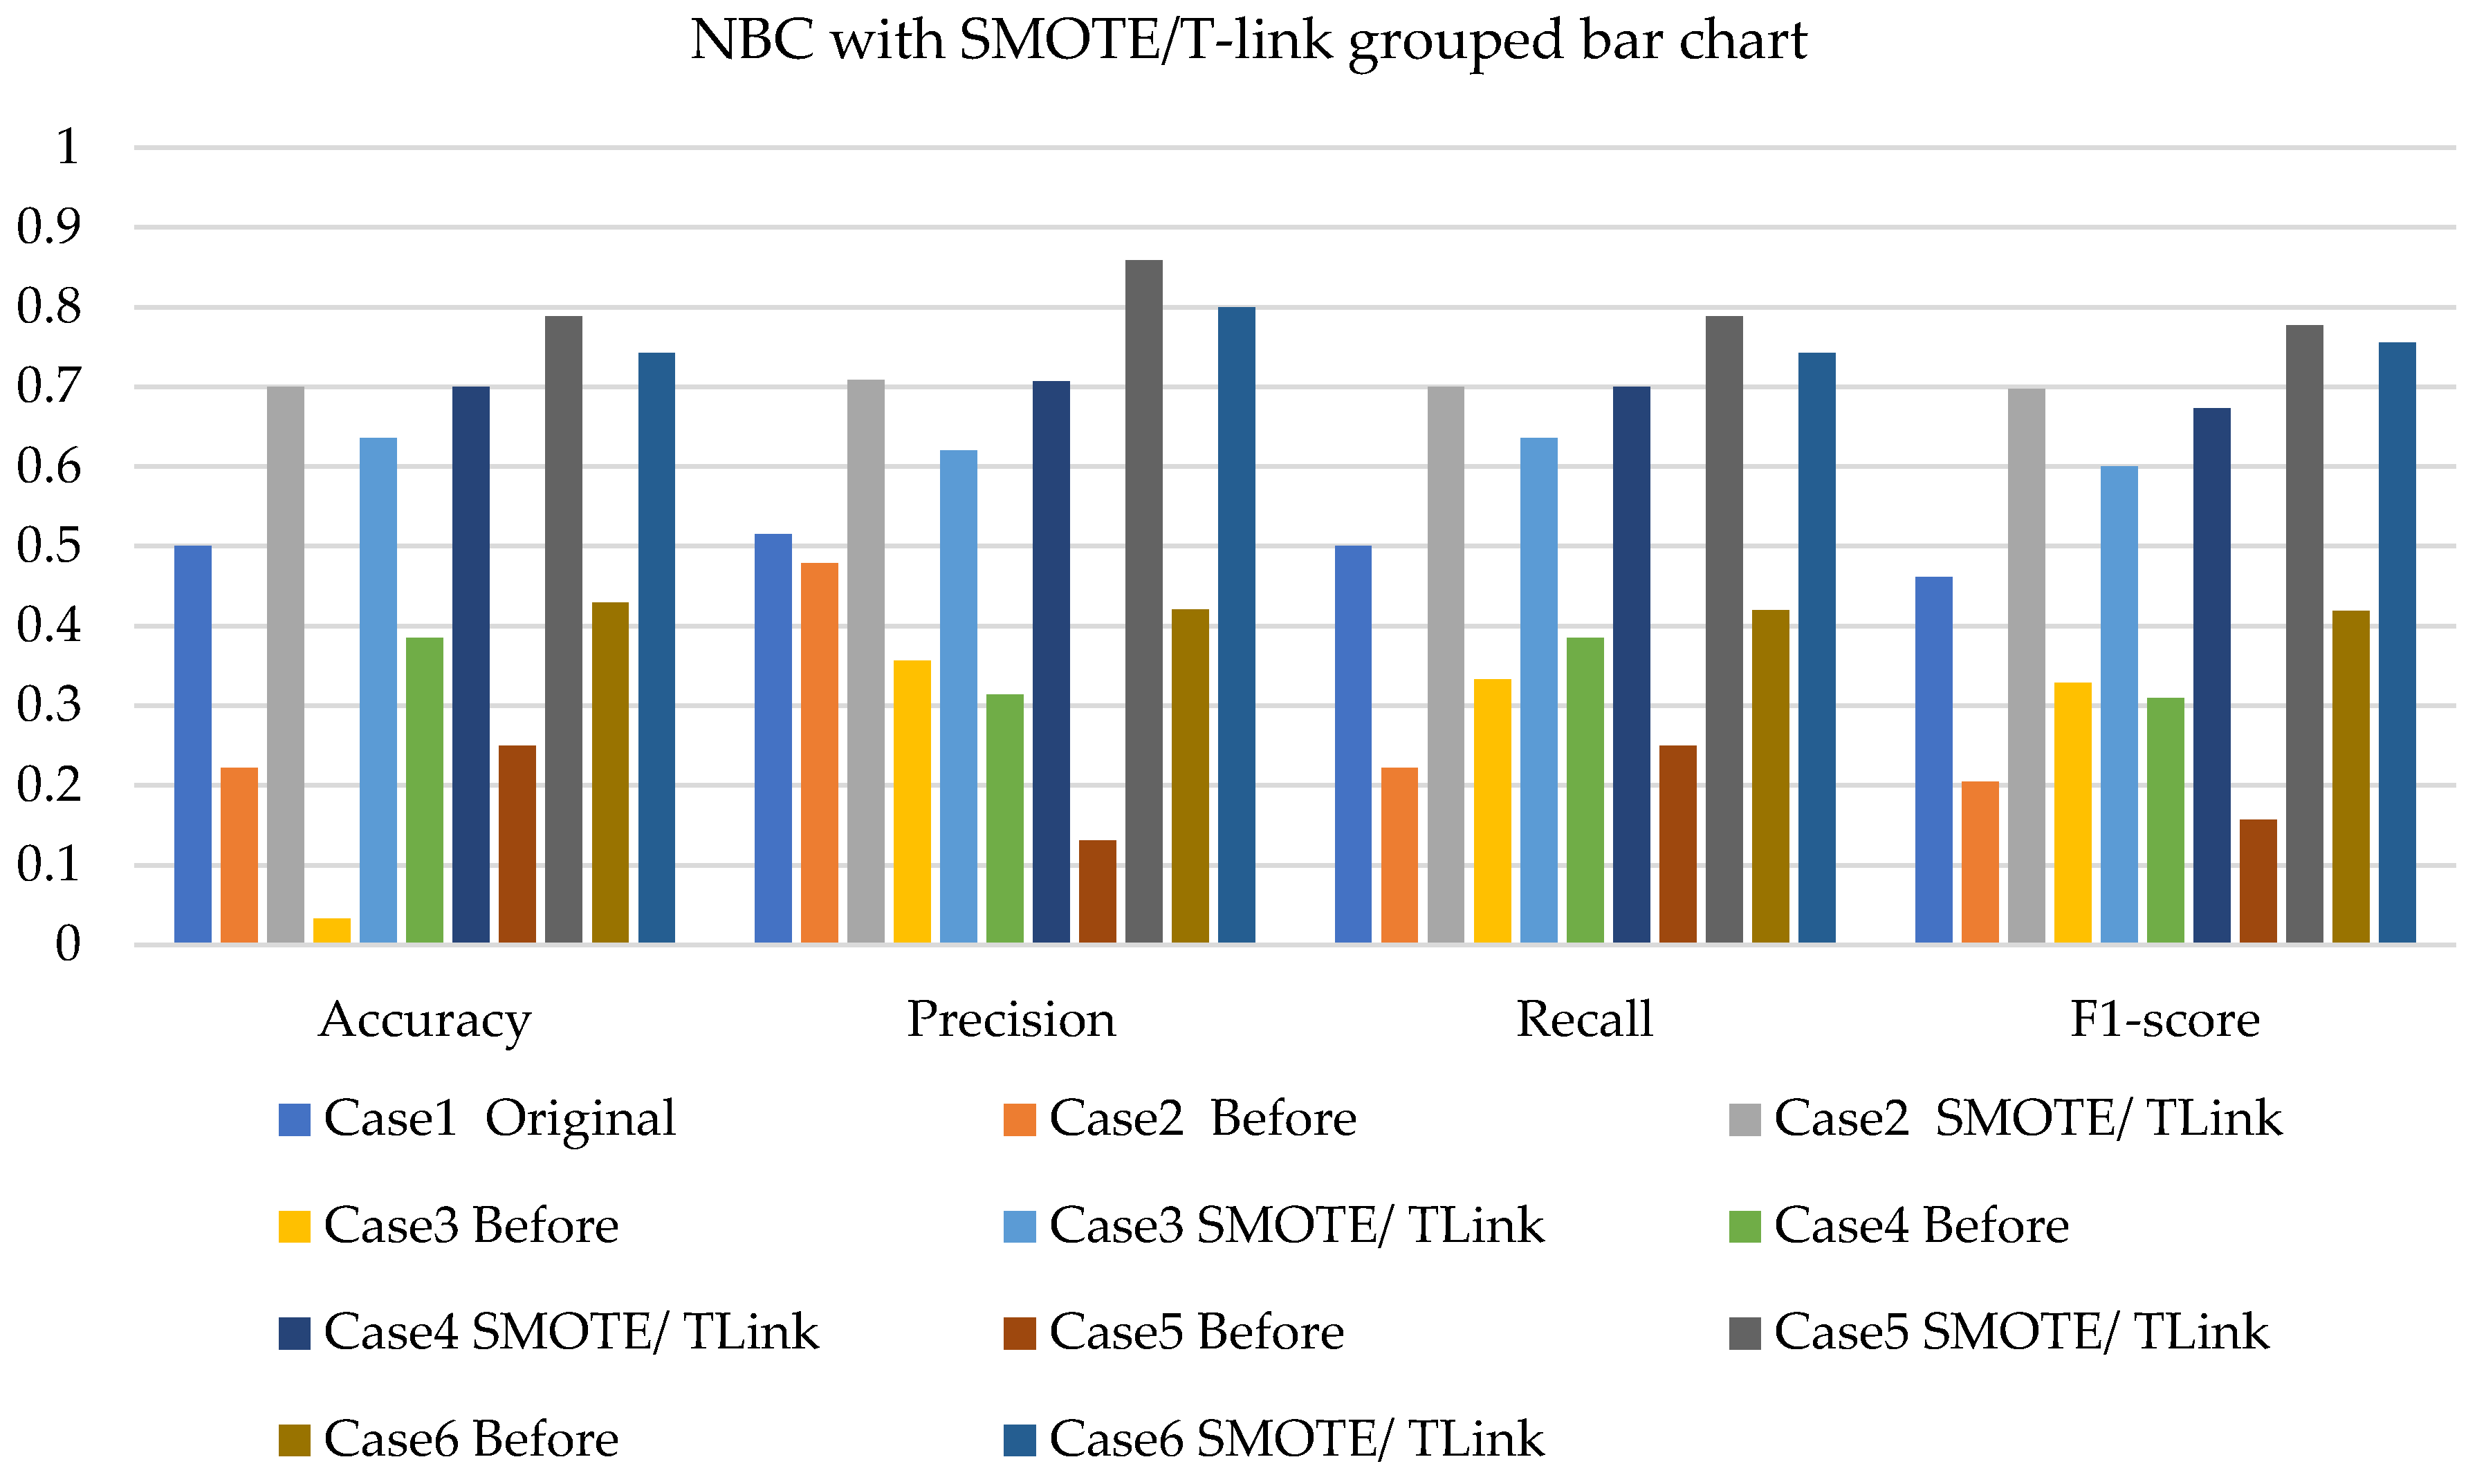
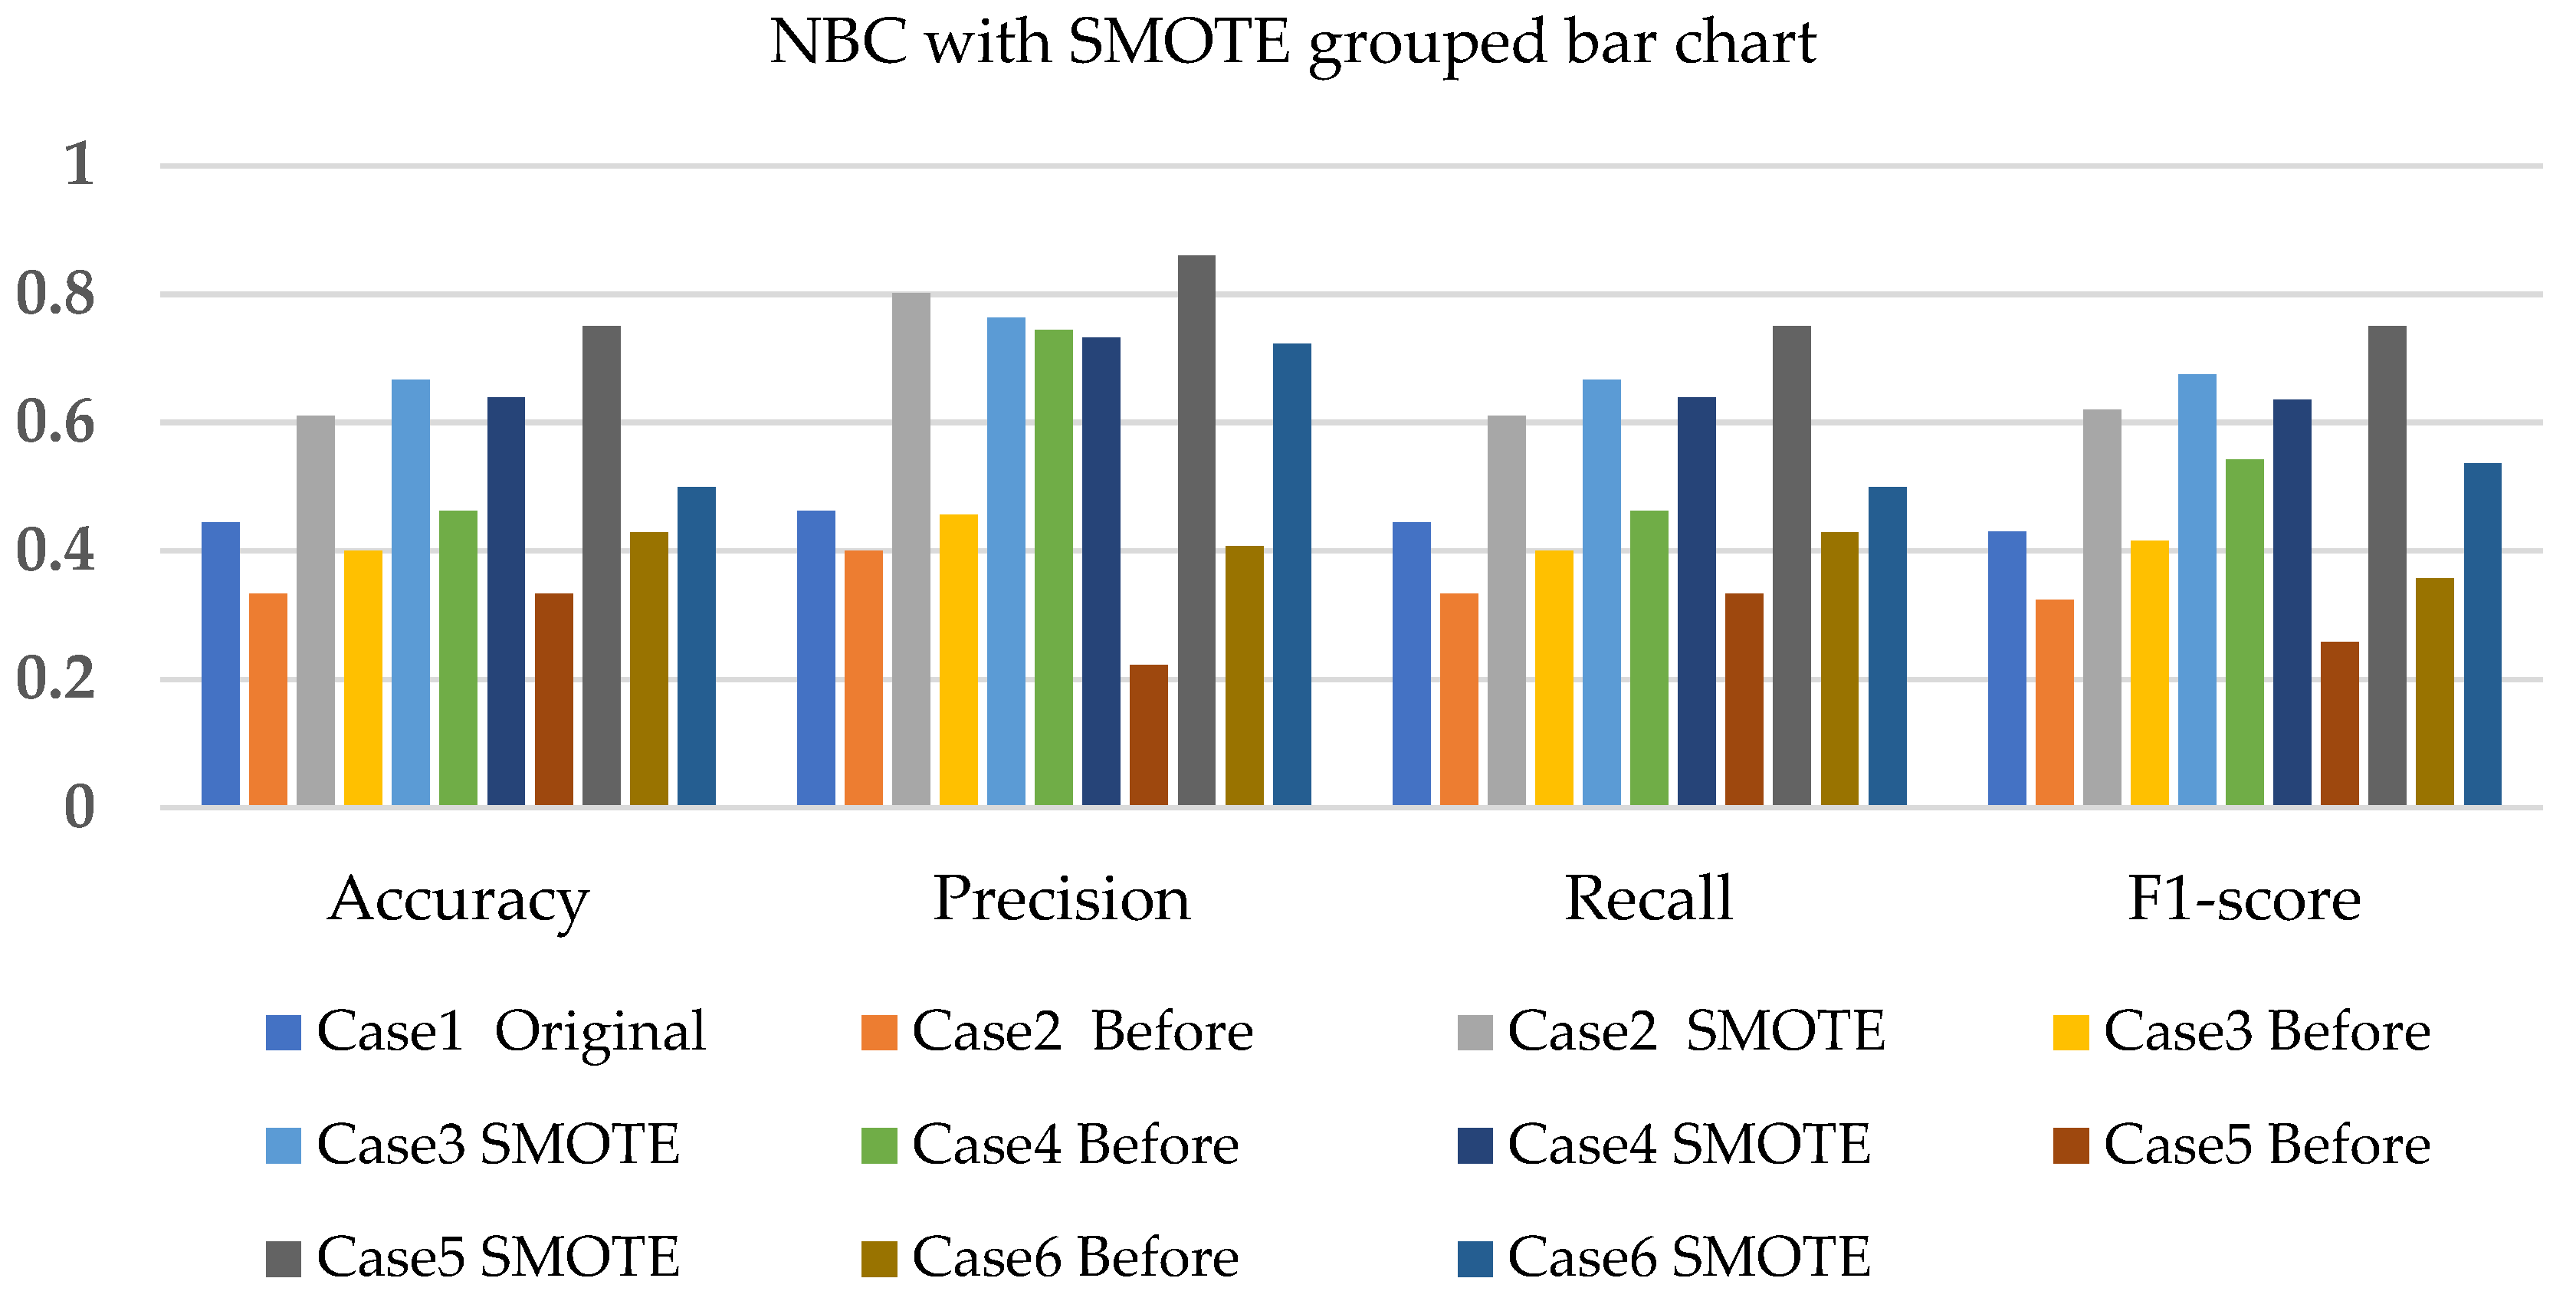
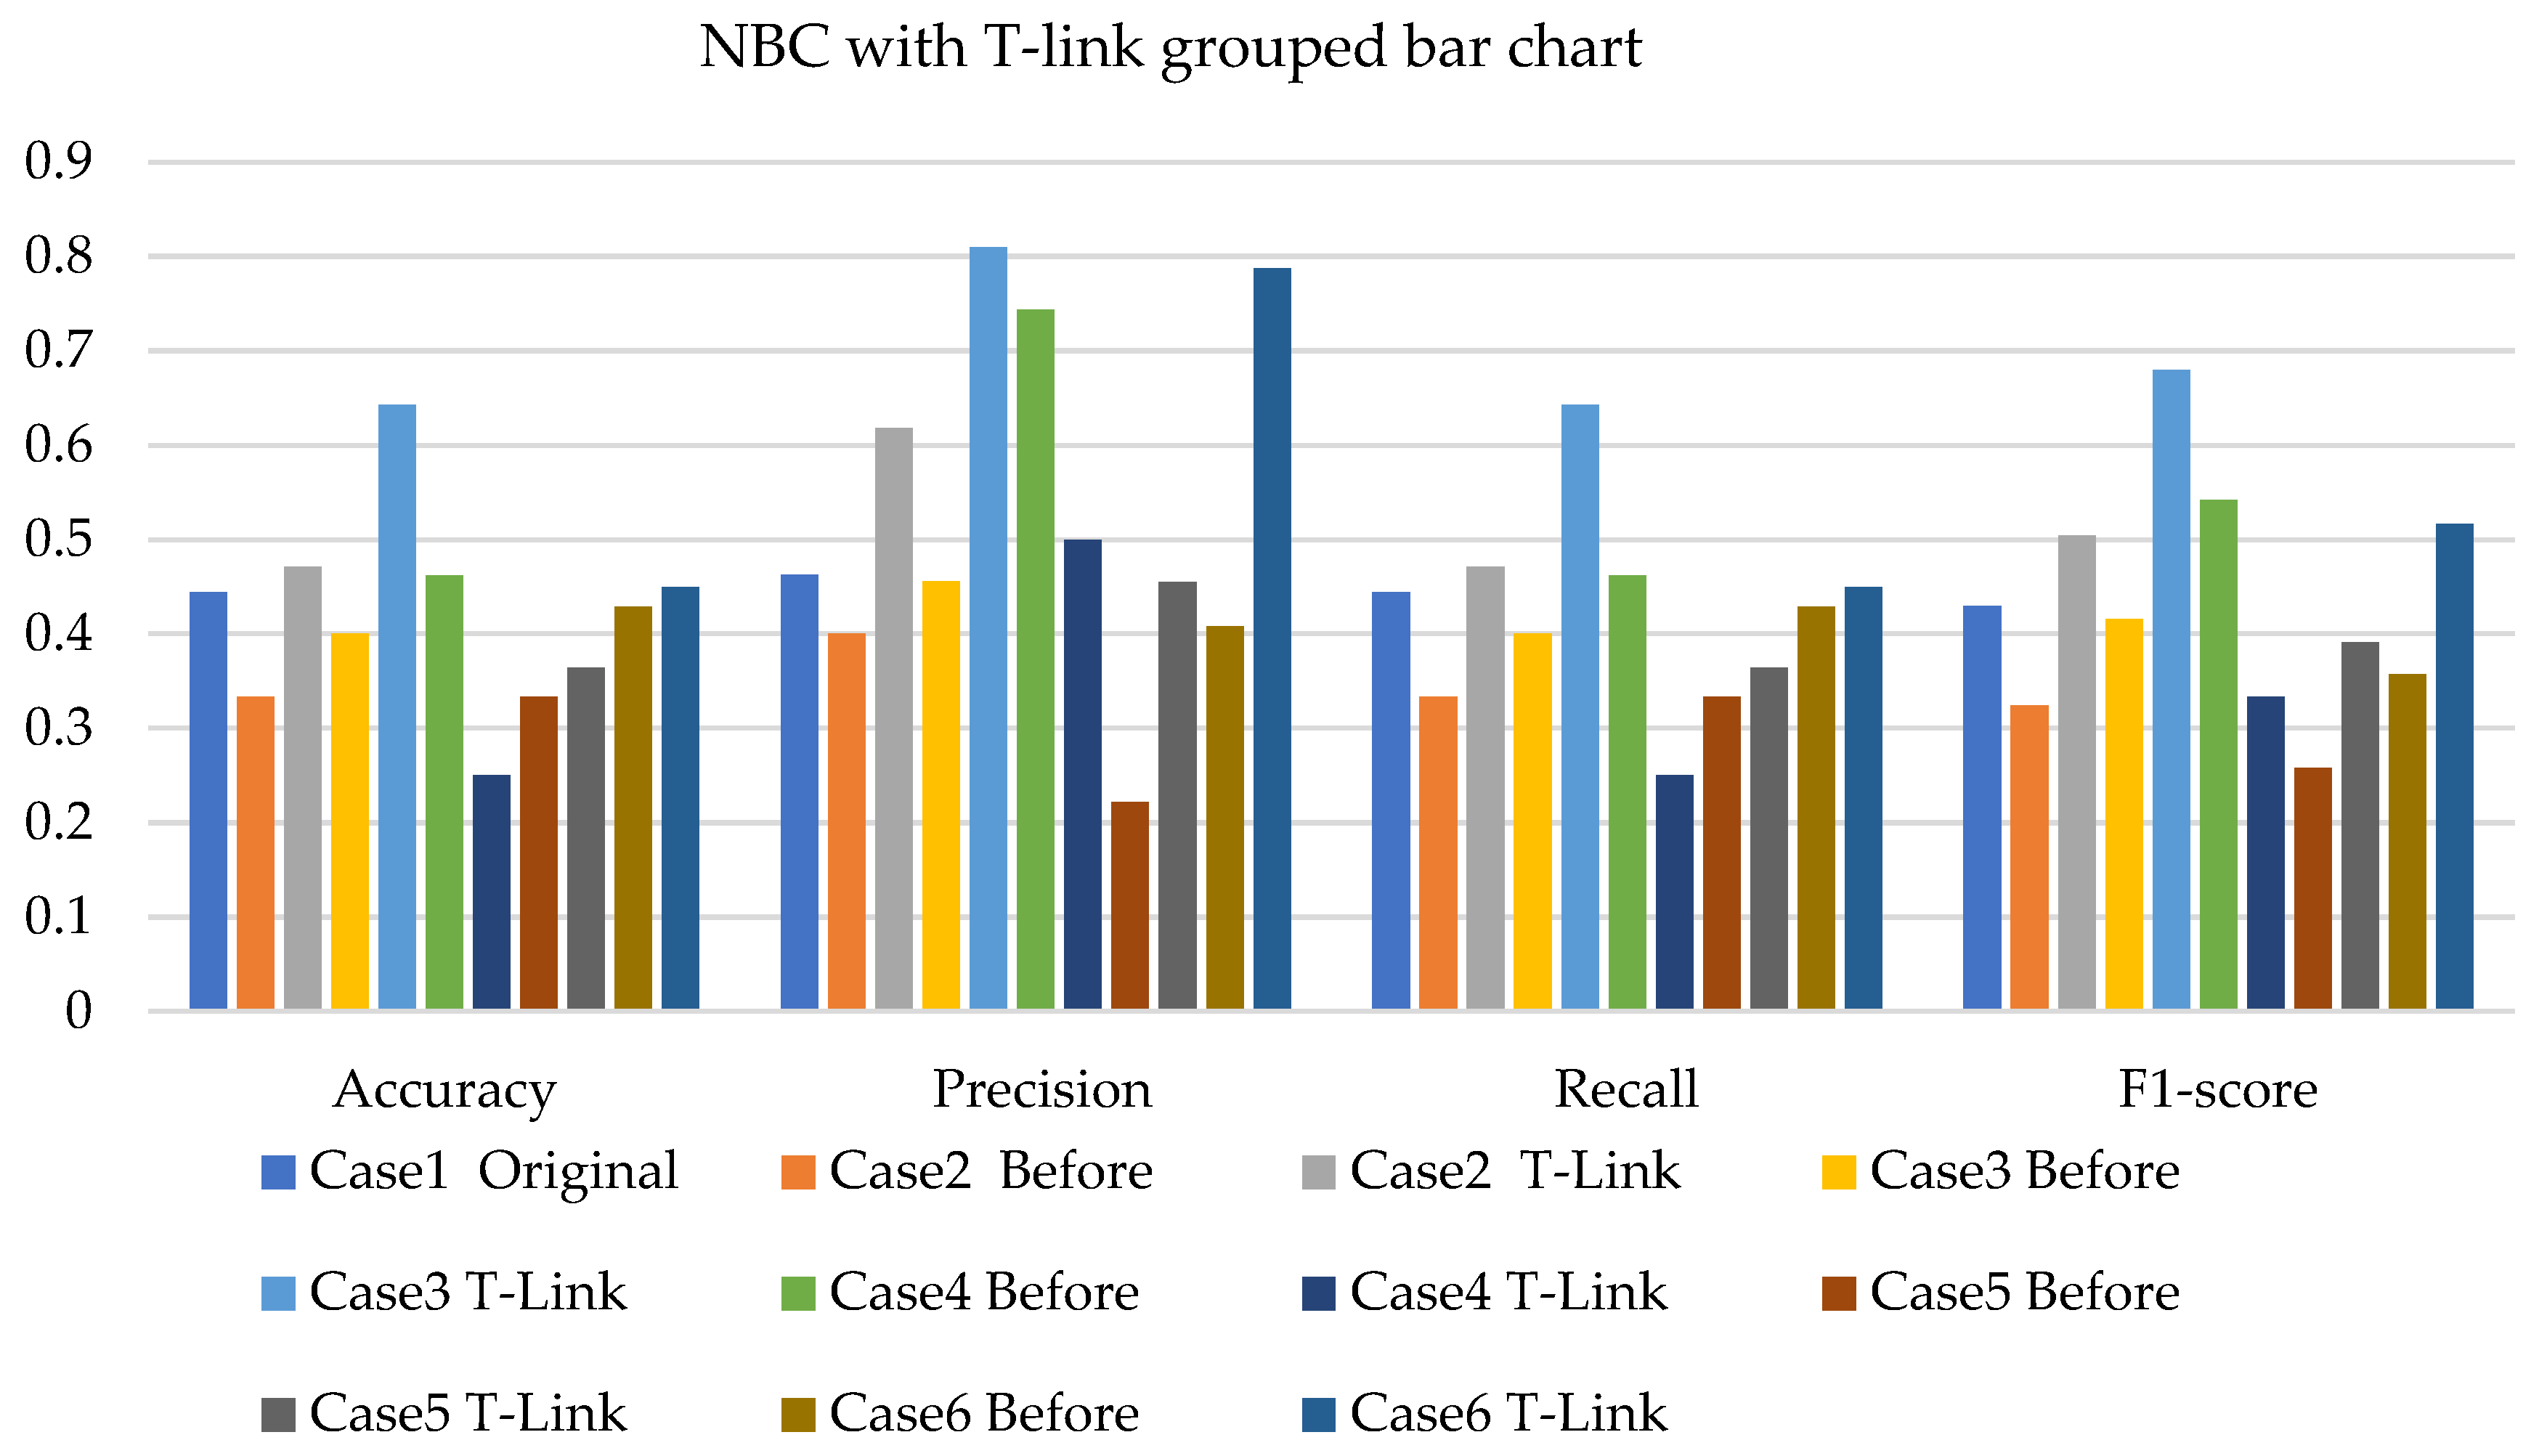
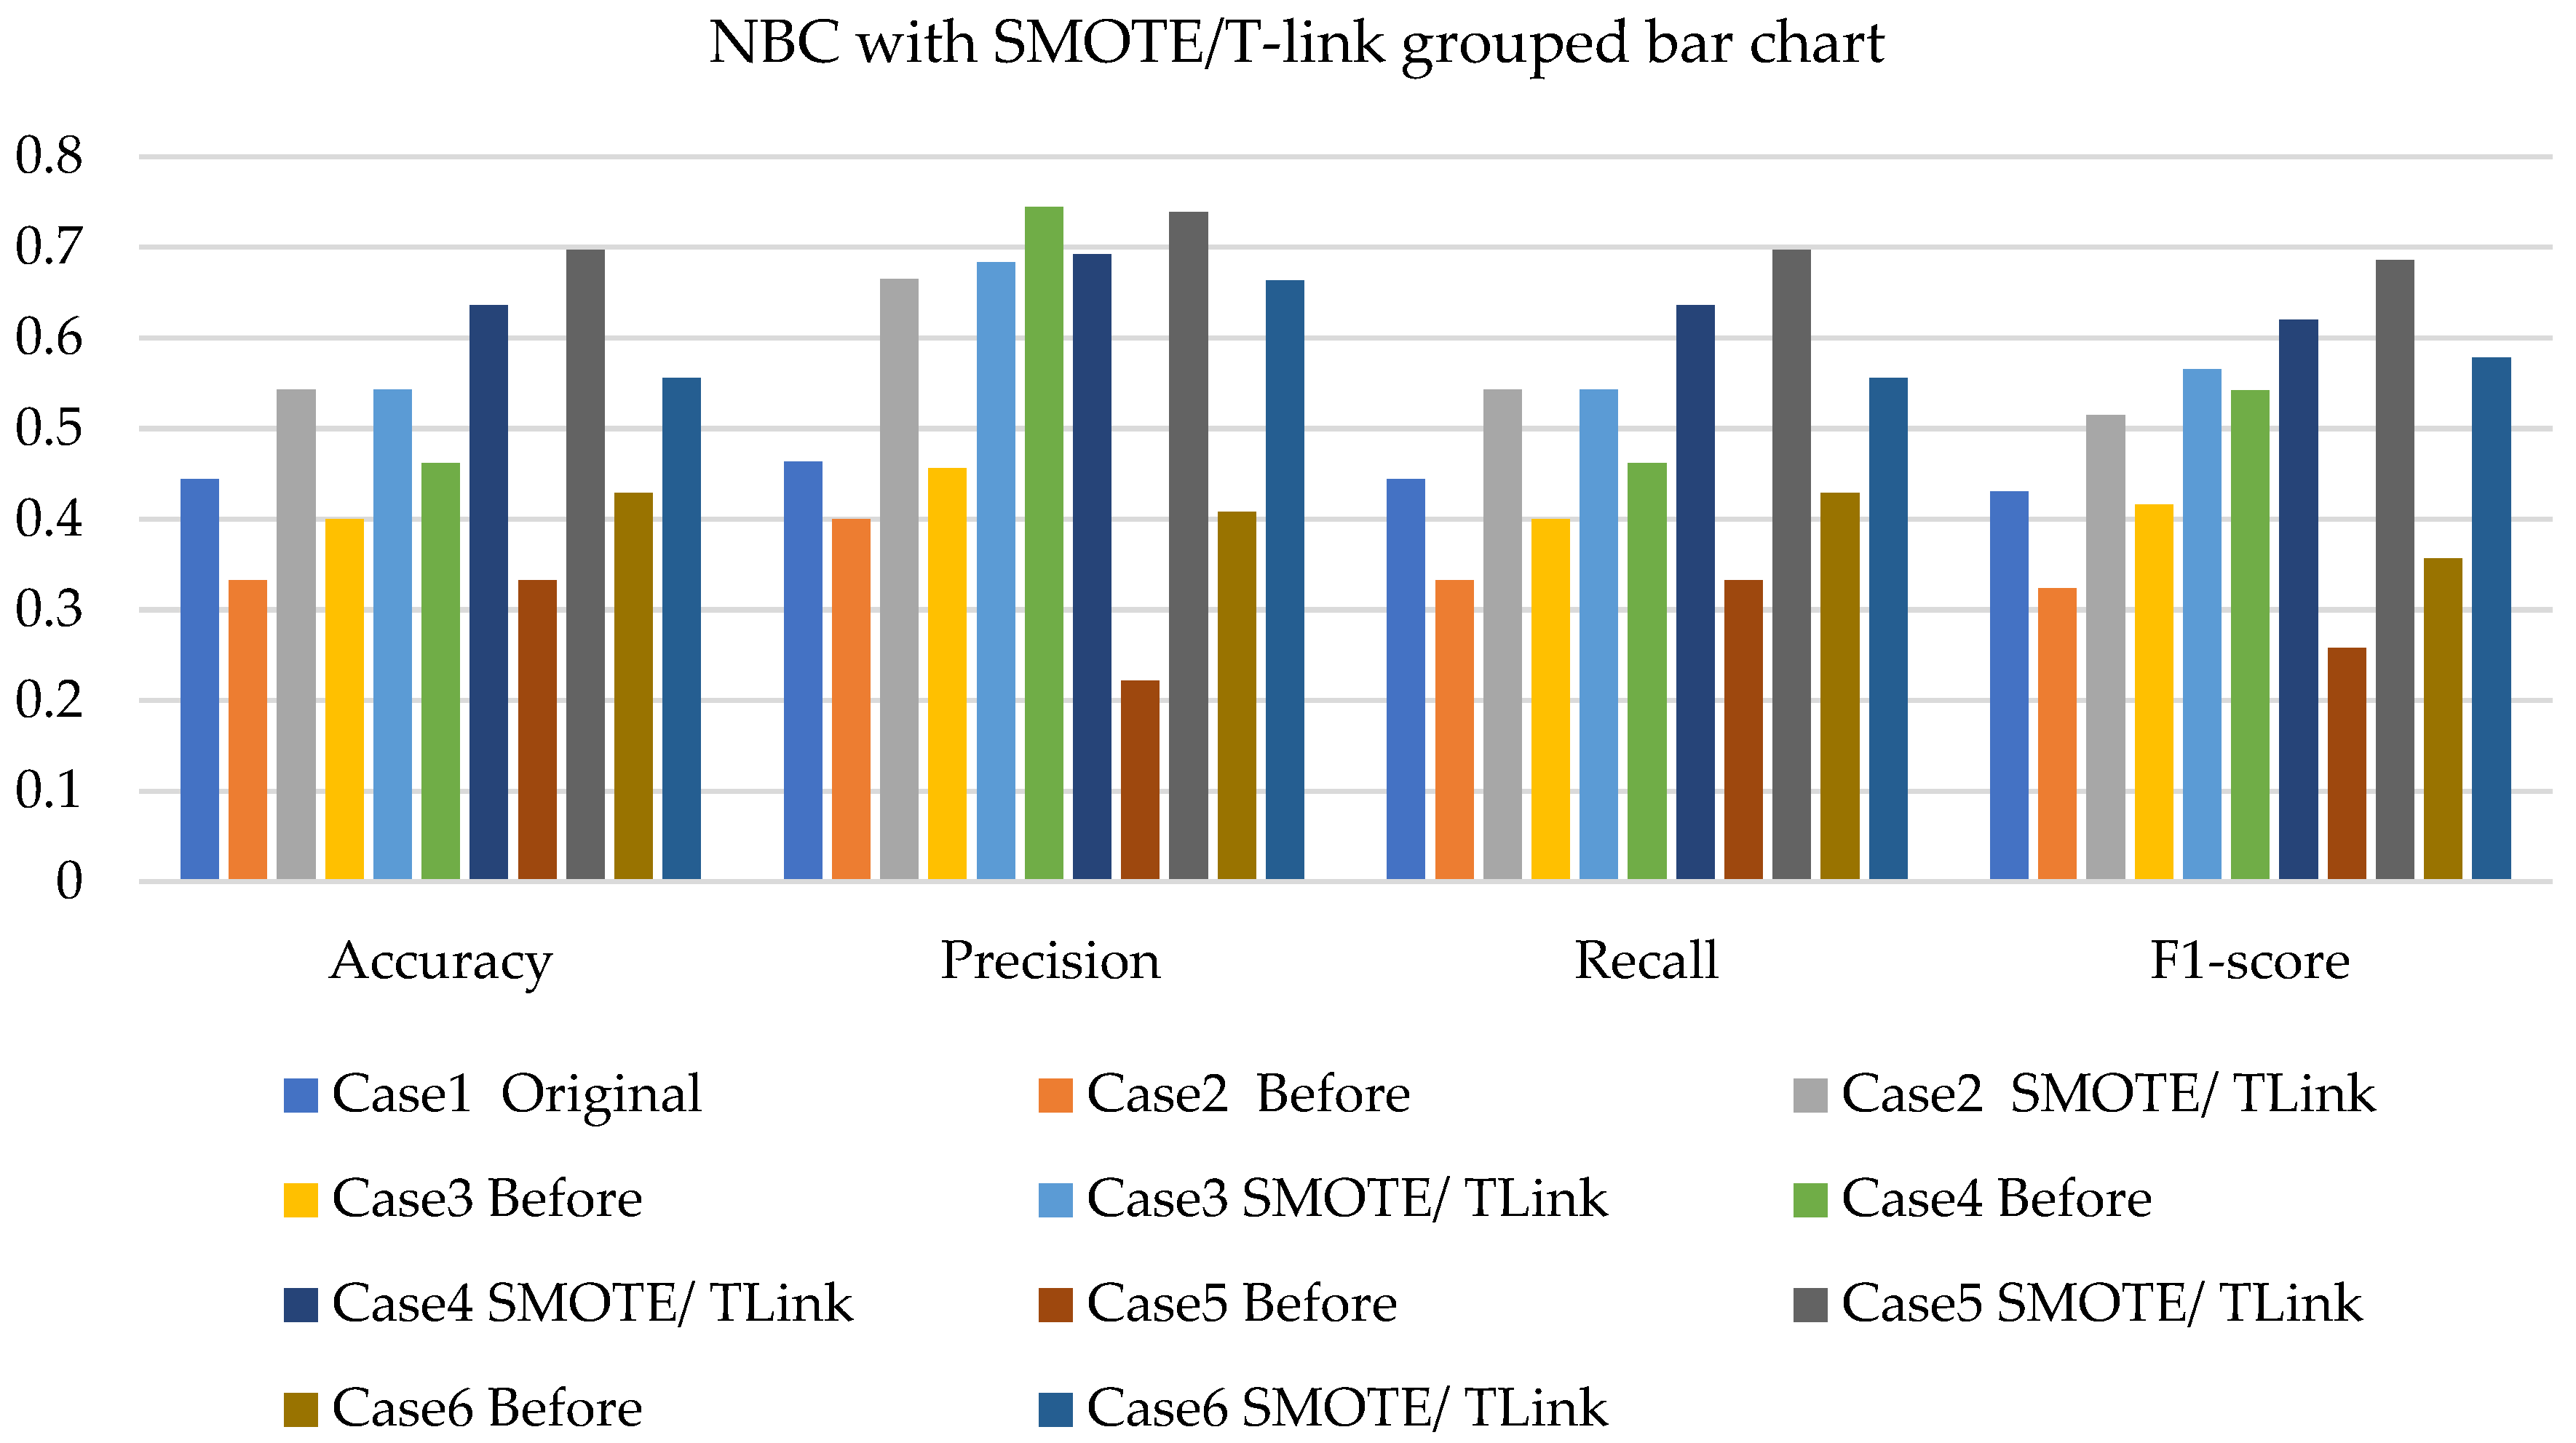
- The NBC with resampling methods for simulated and experimental data has a minimum accuracy of 40% and 50% and a maximum of 78% and 75%, respectively.
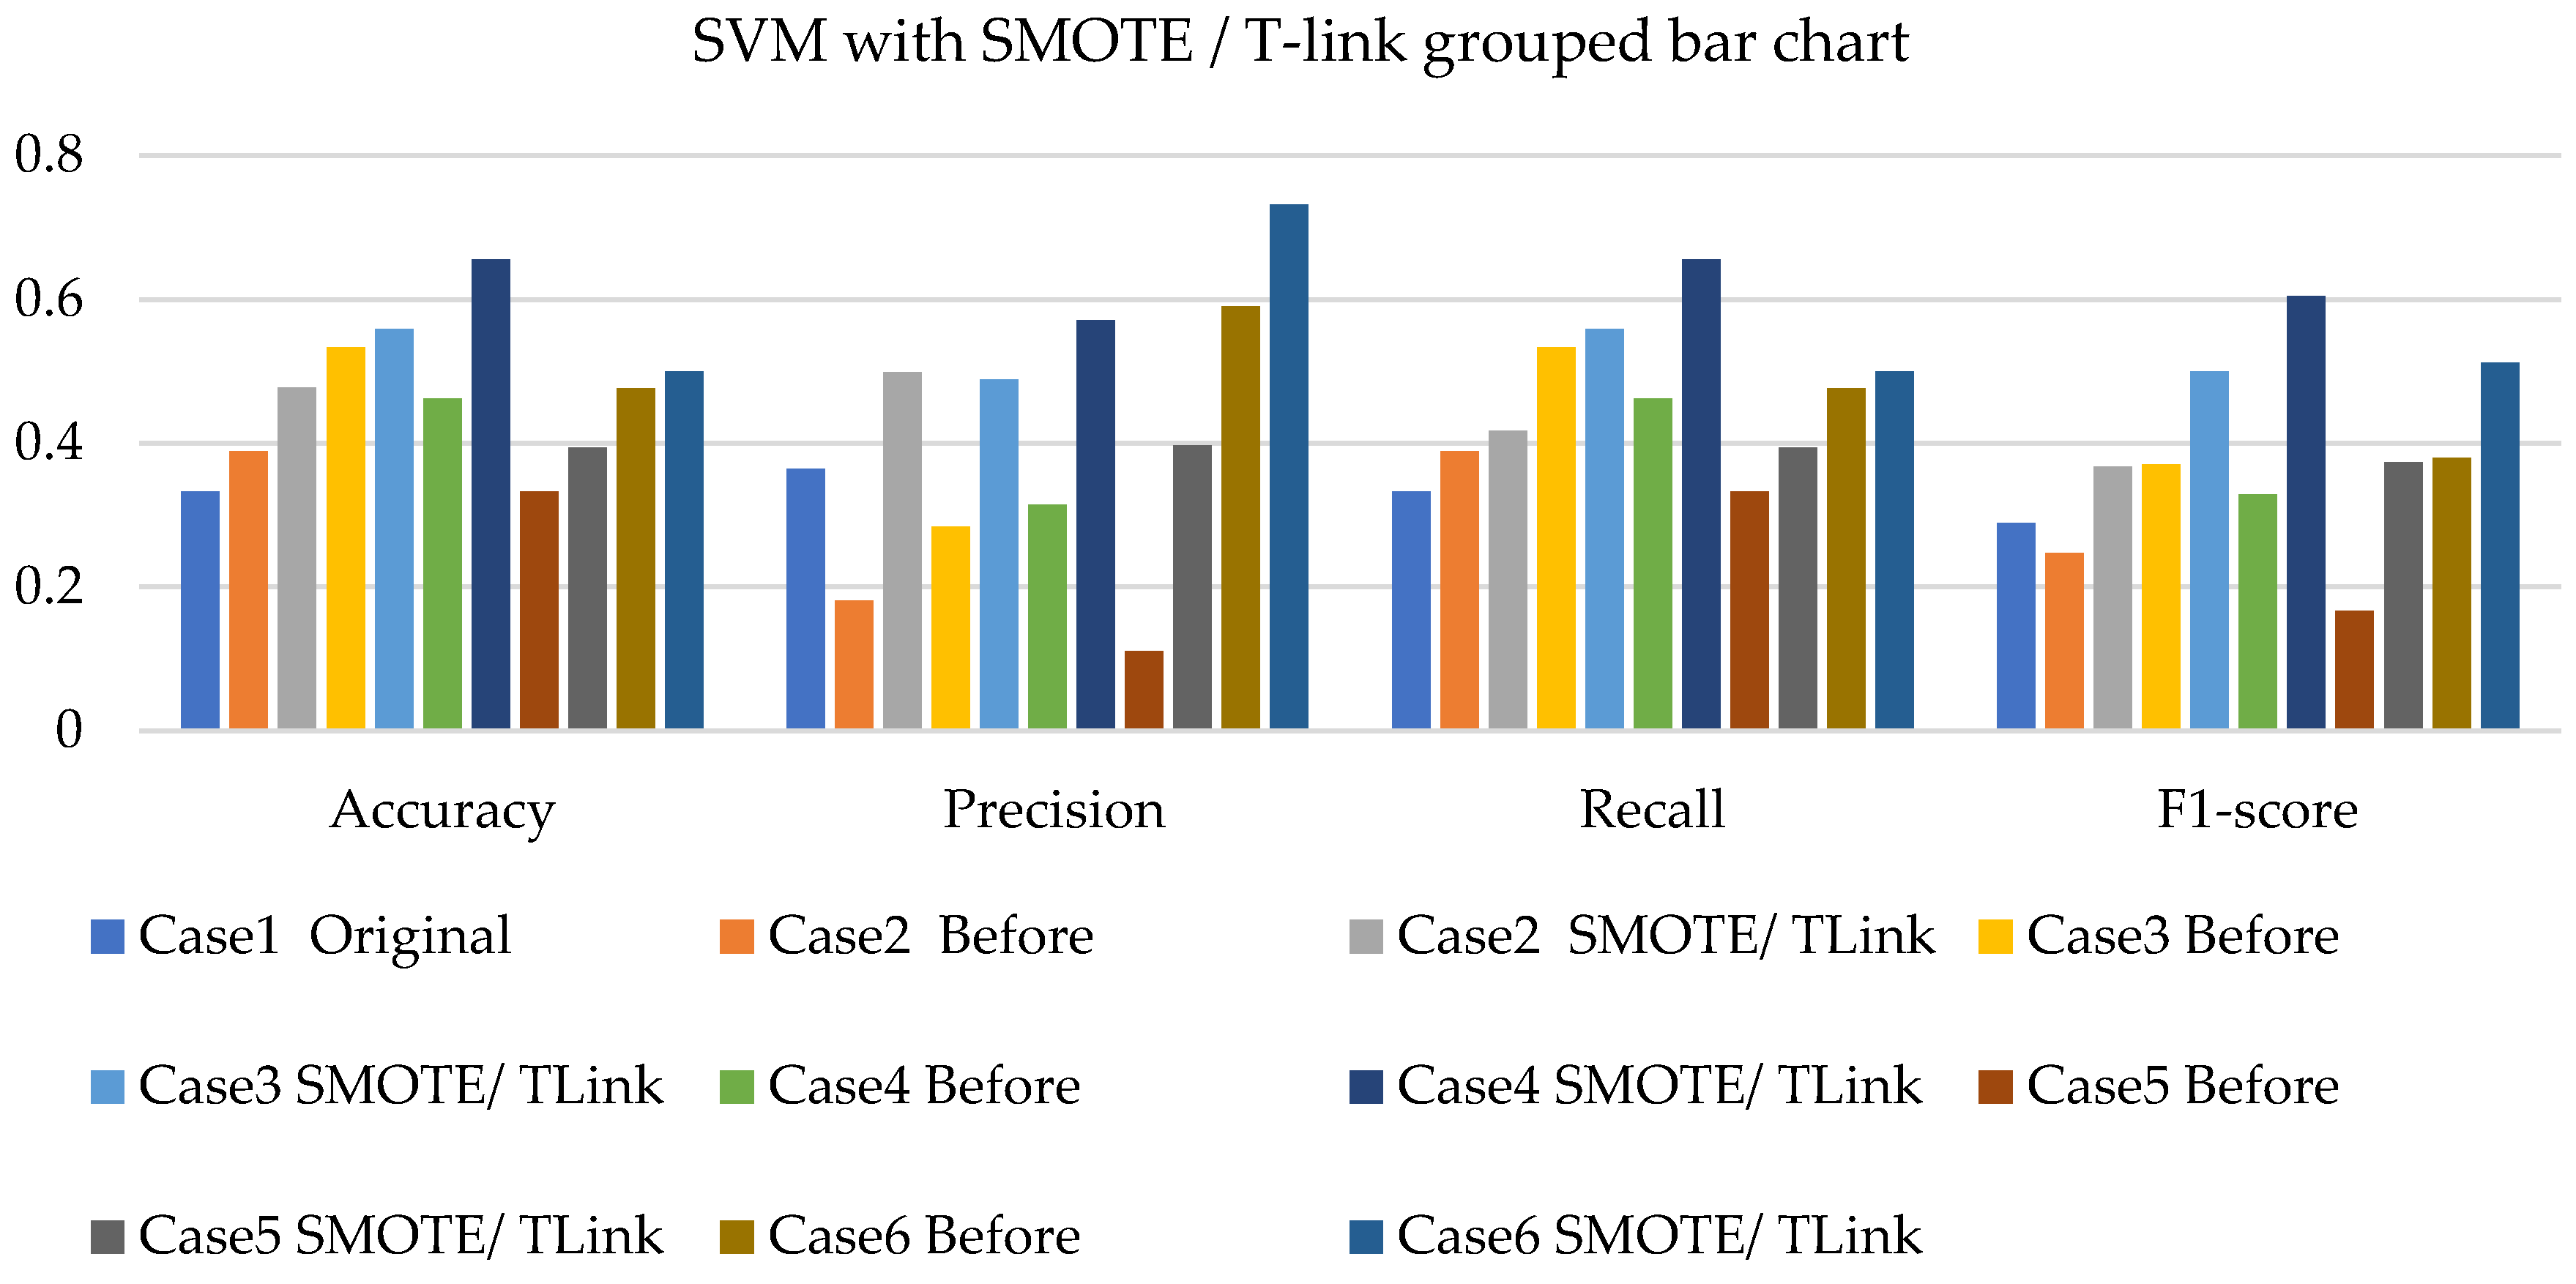
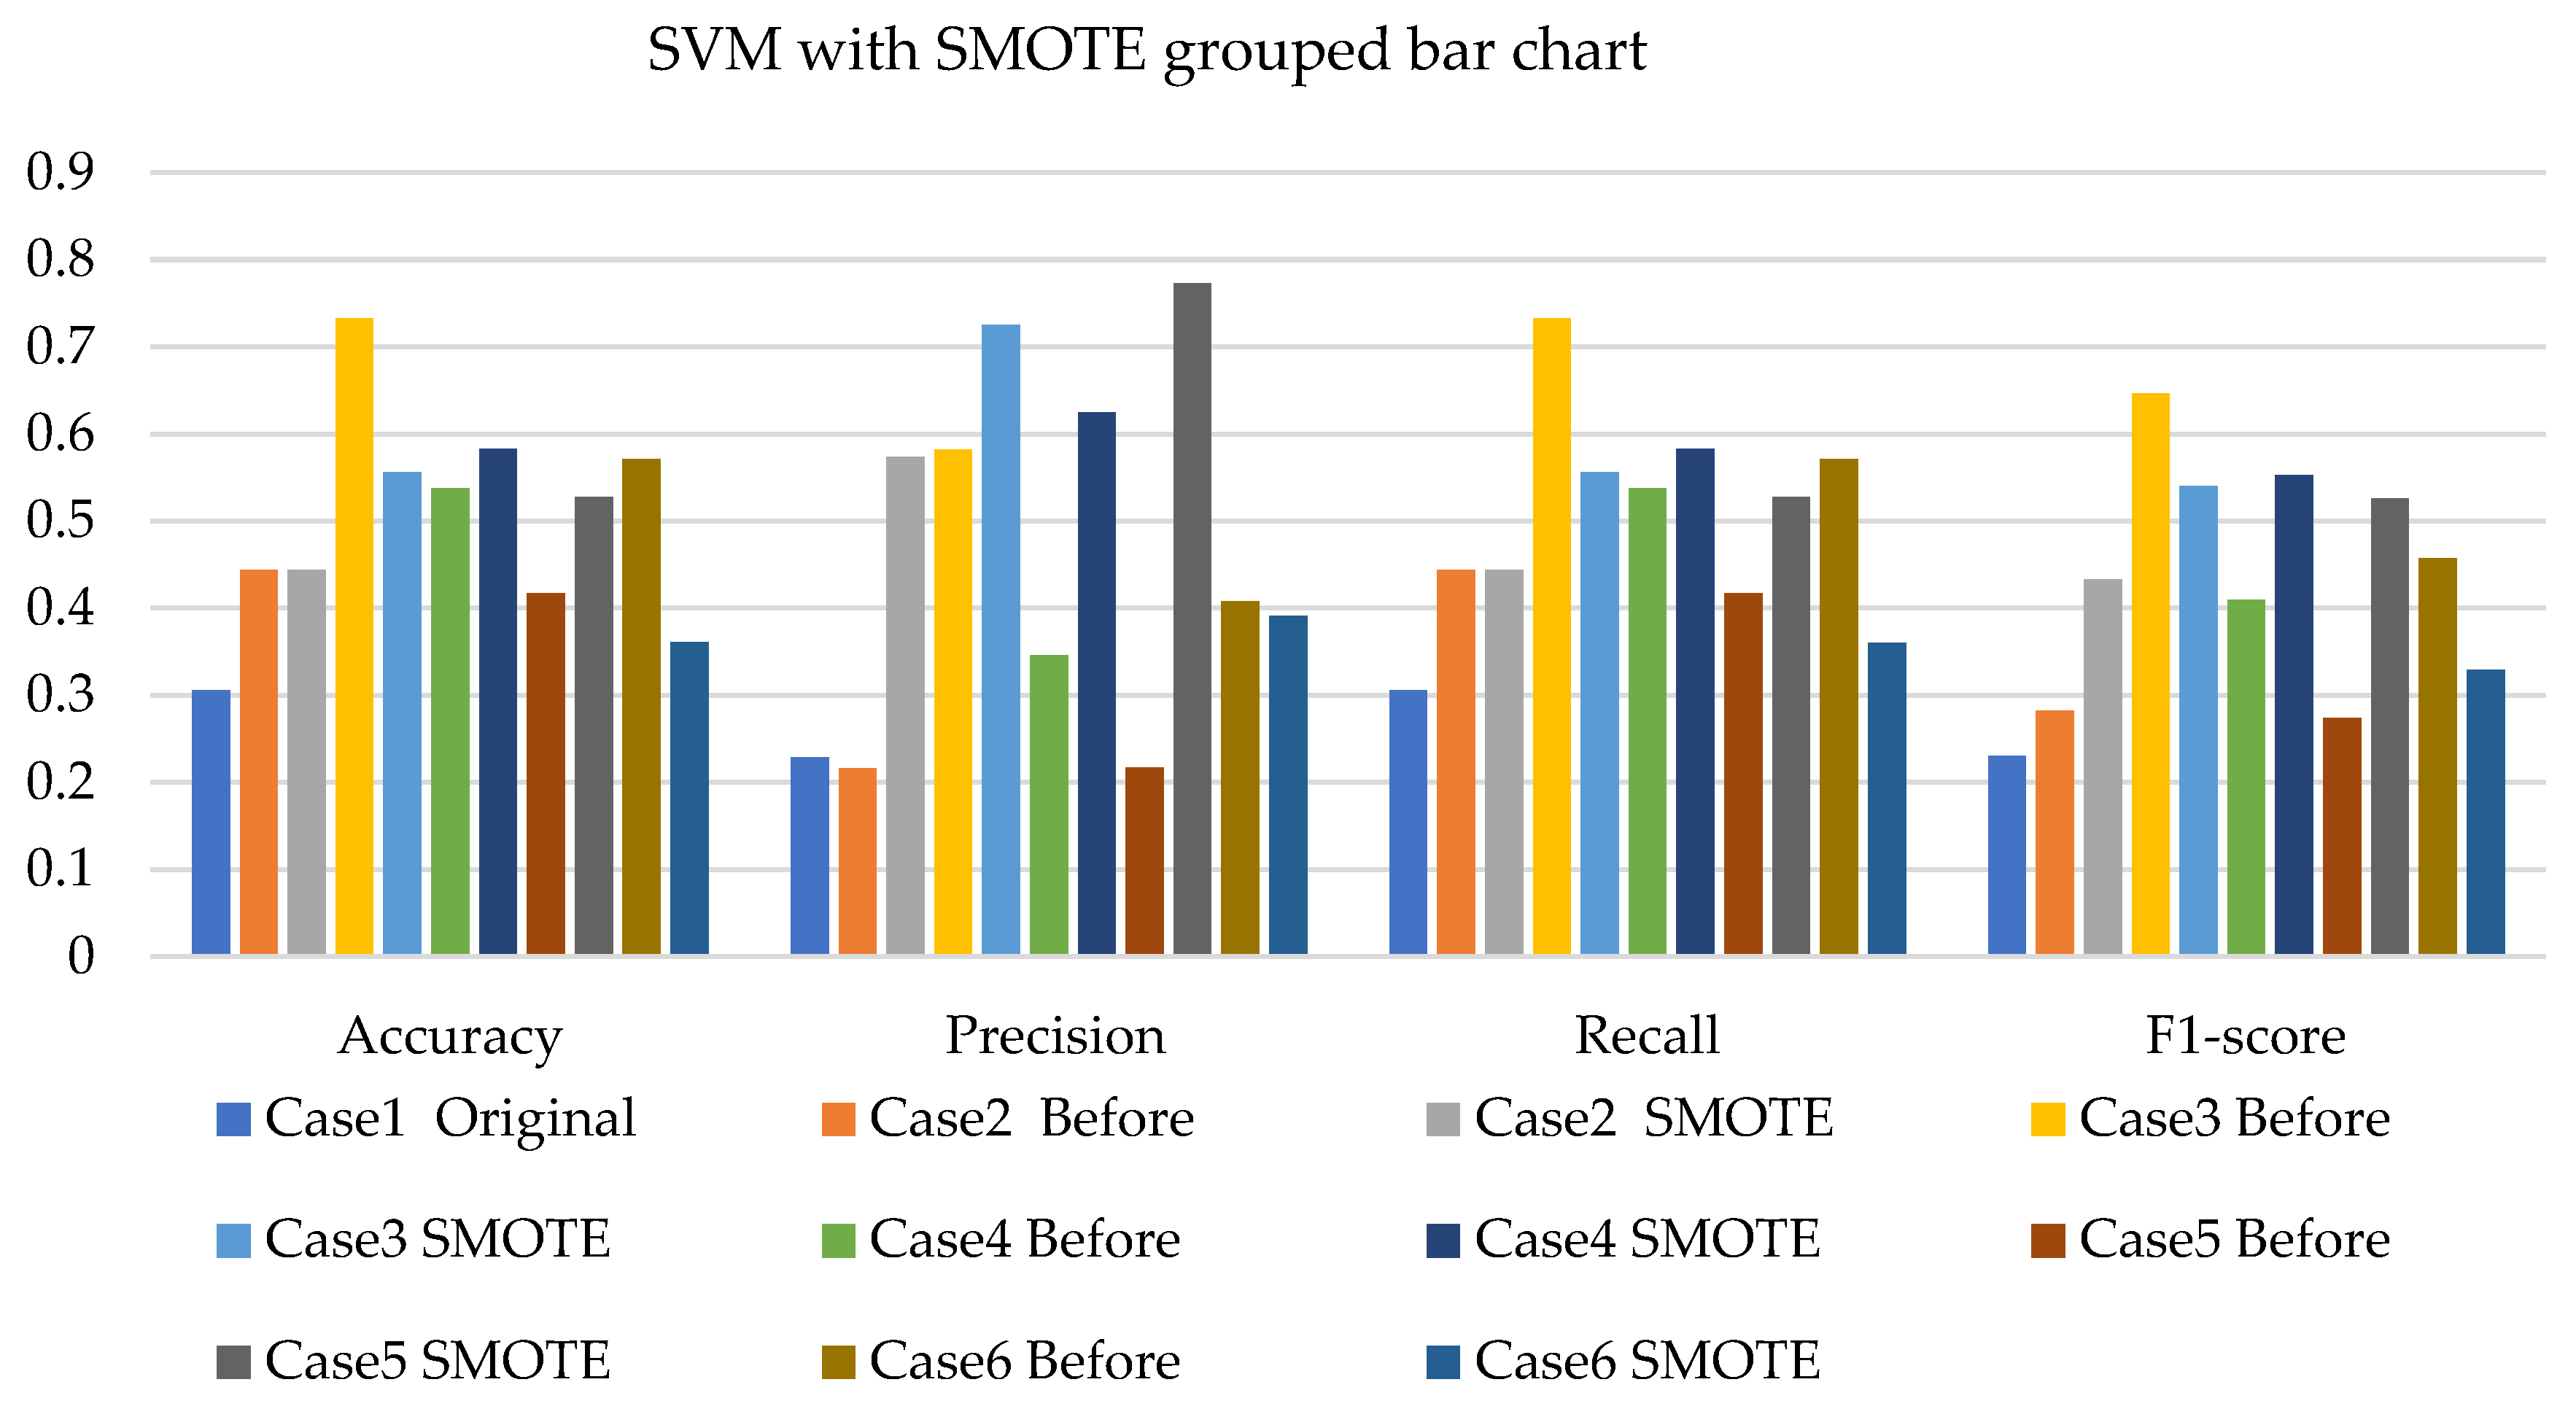
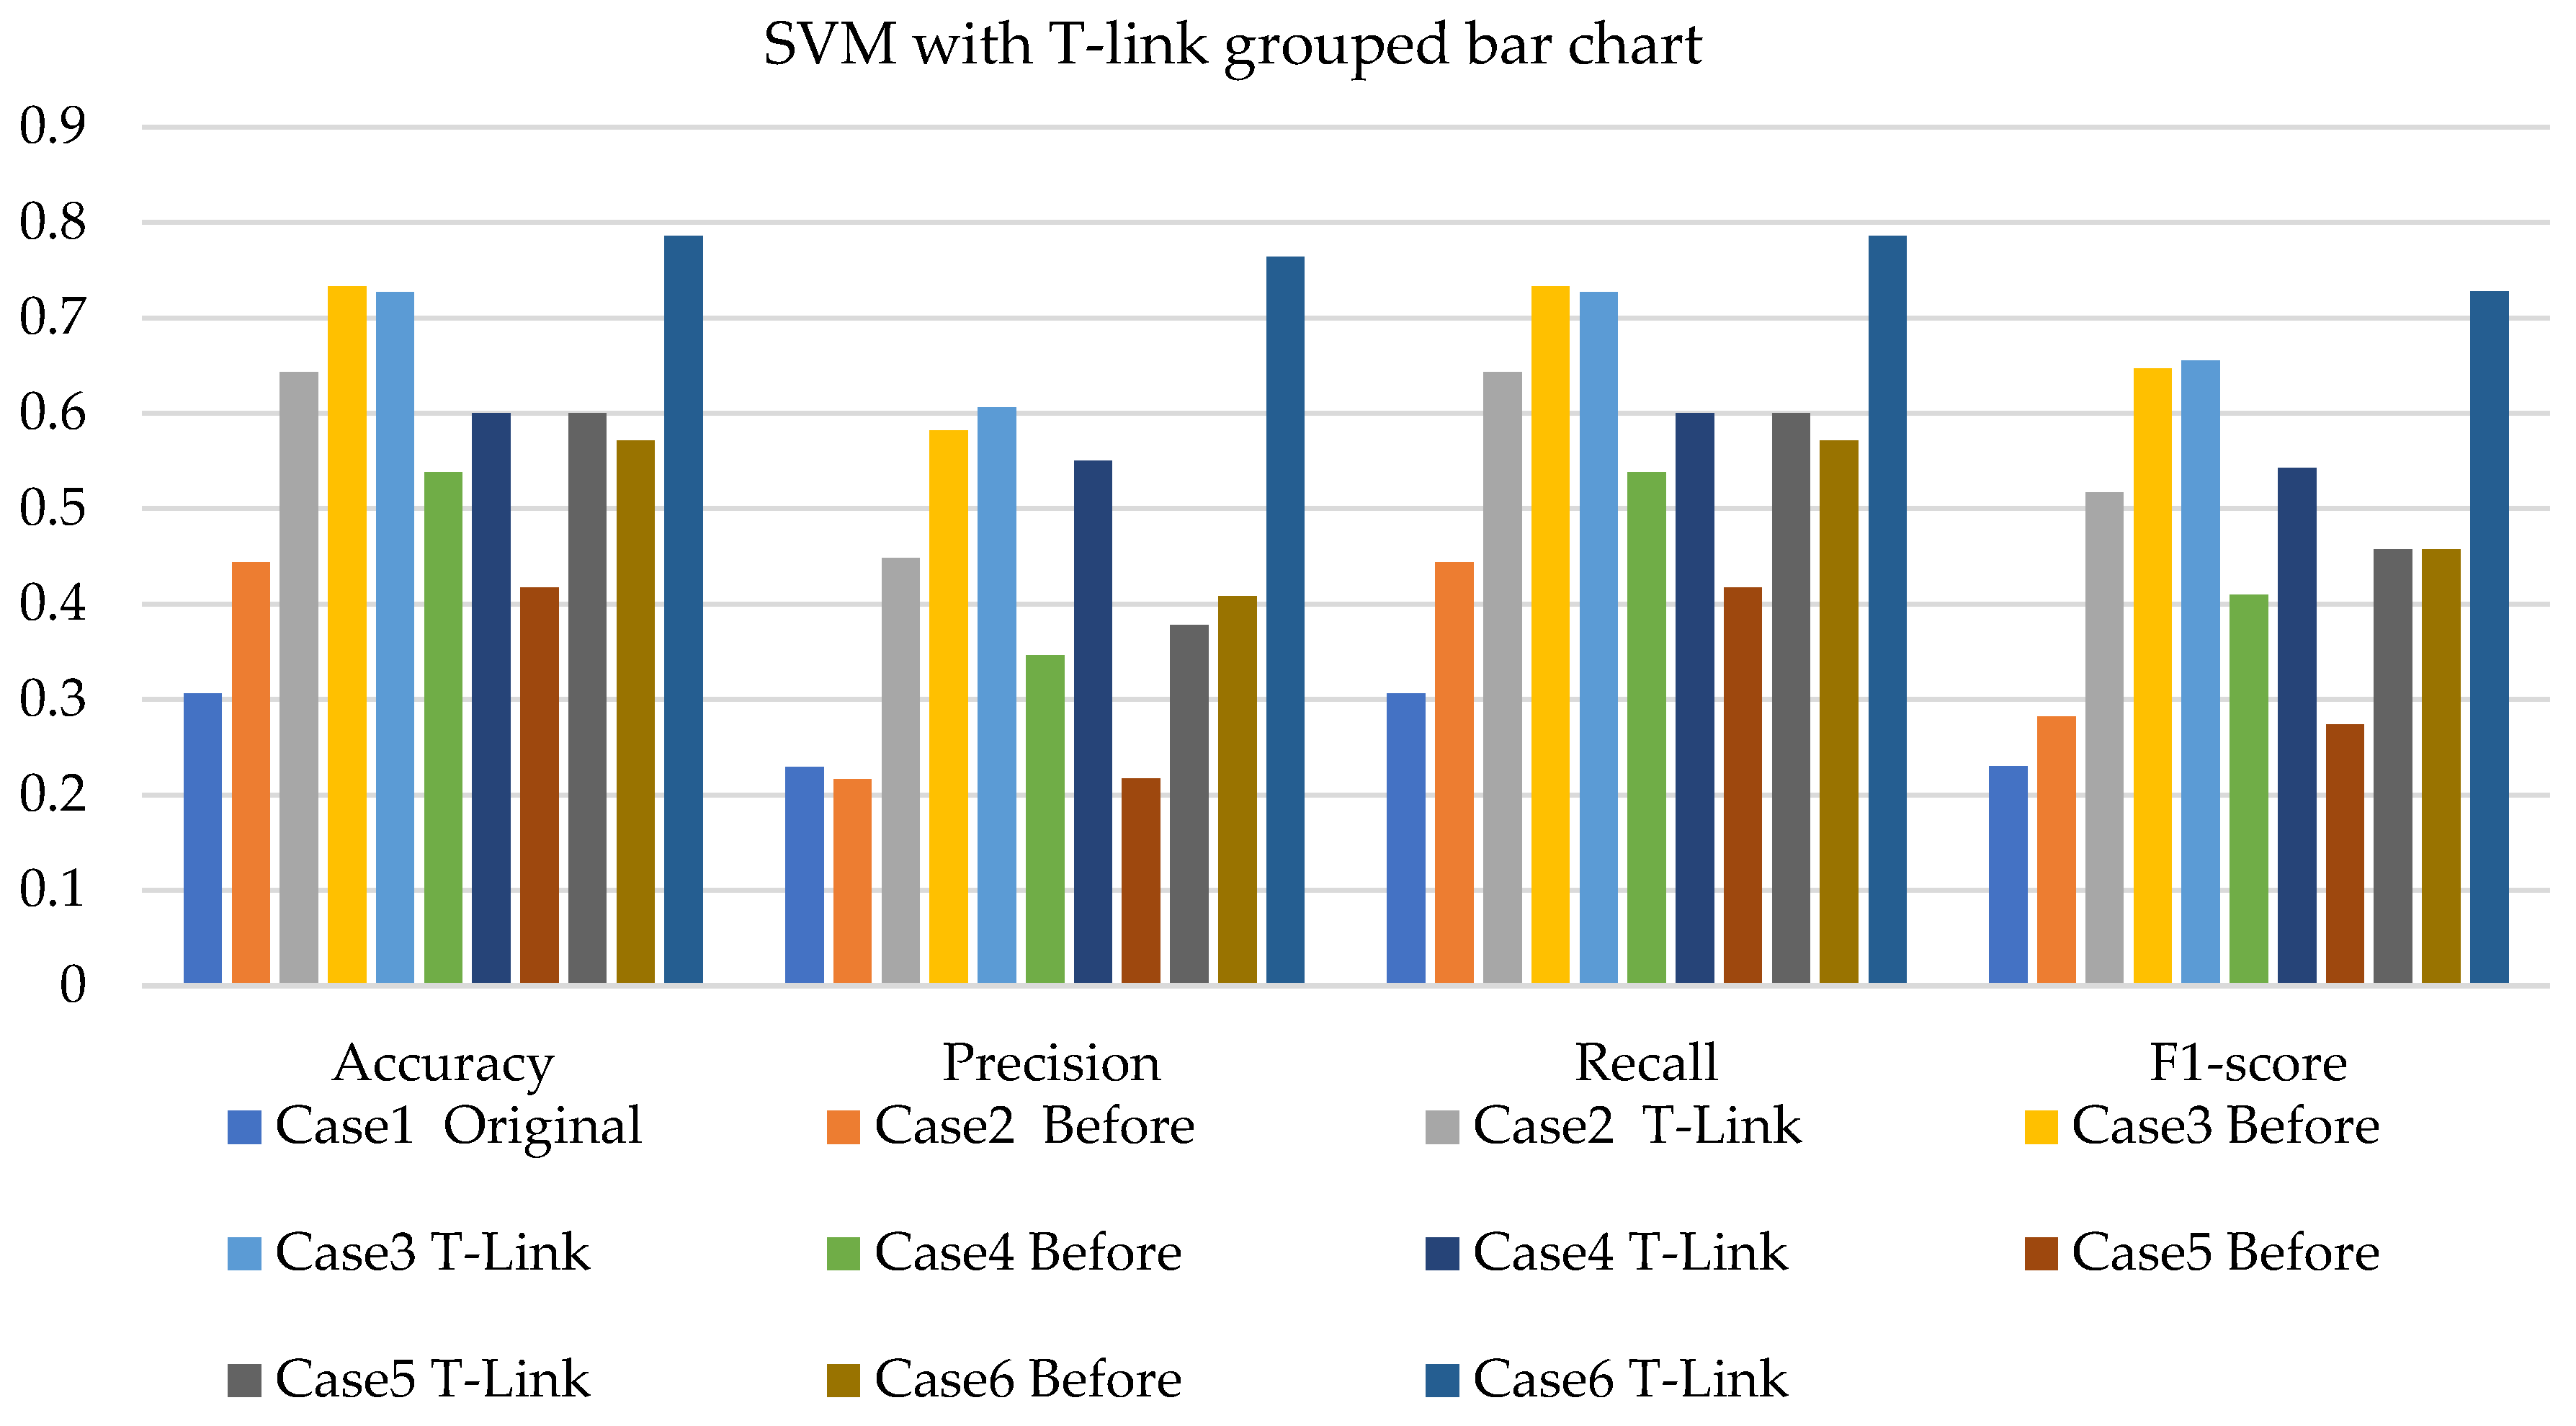
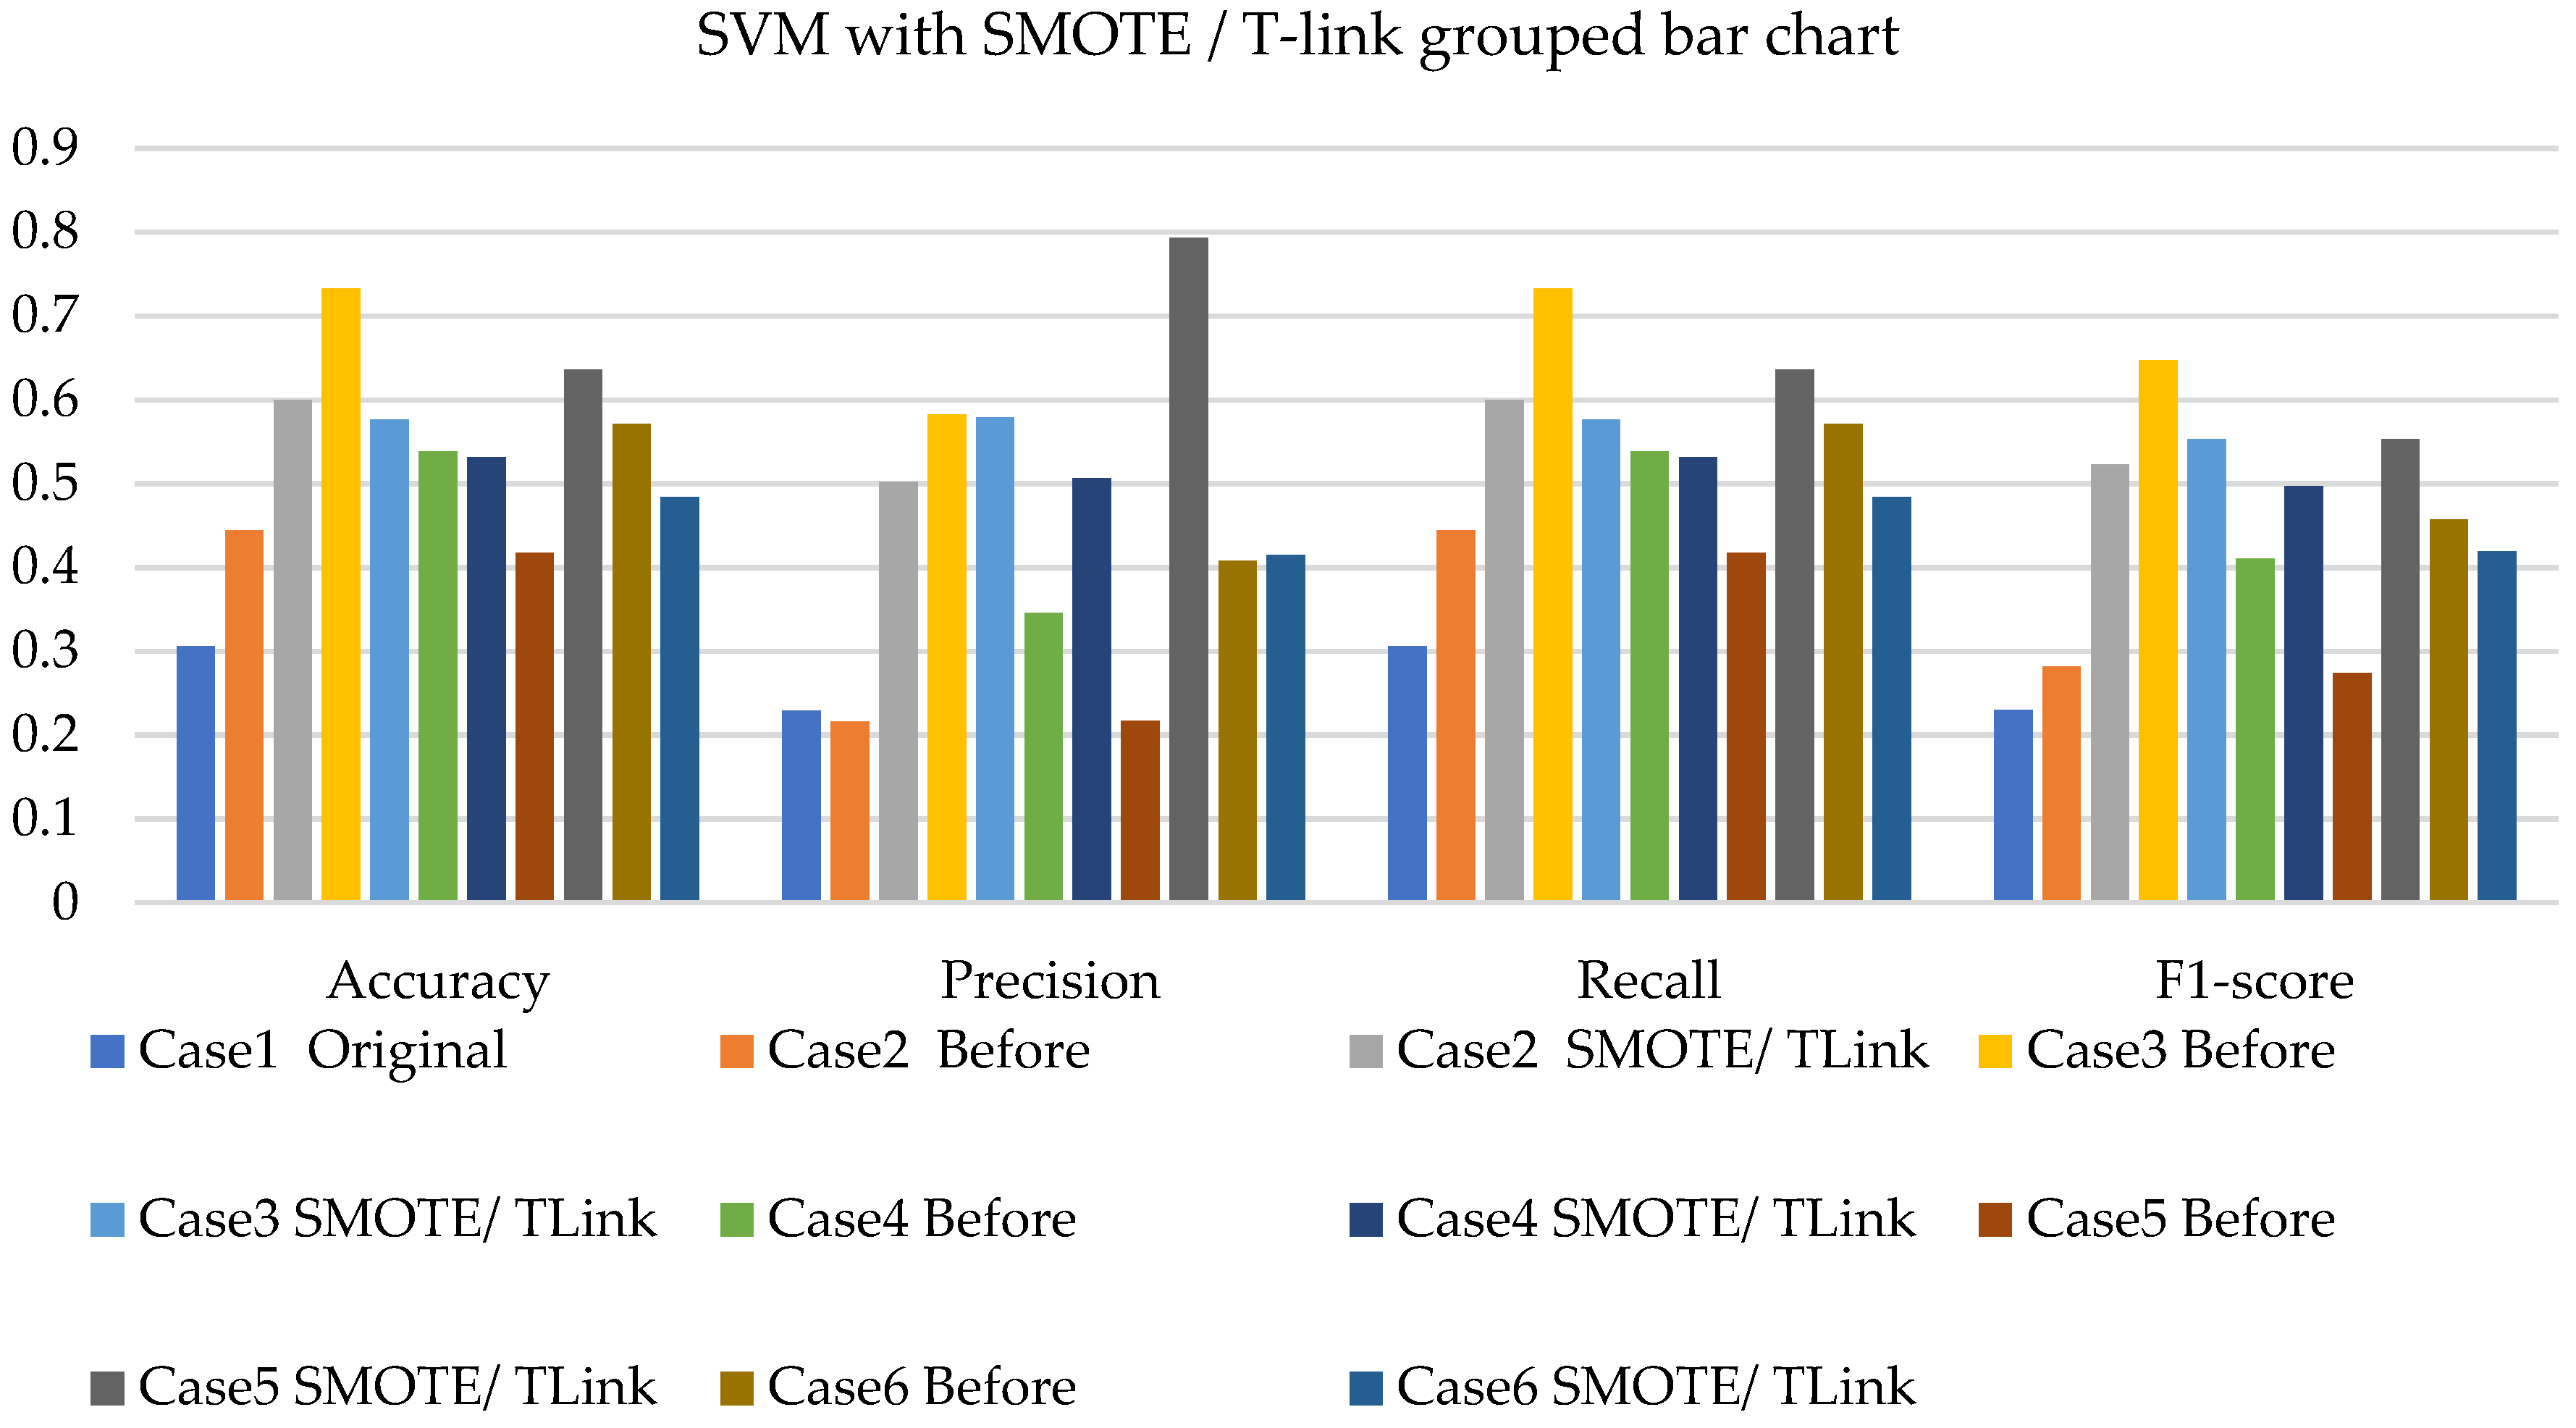
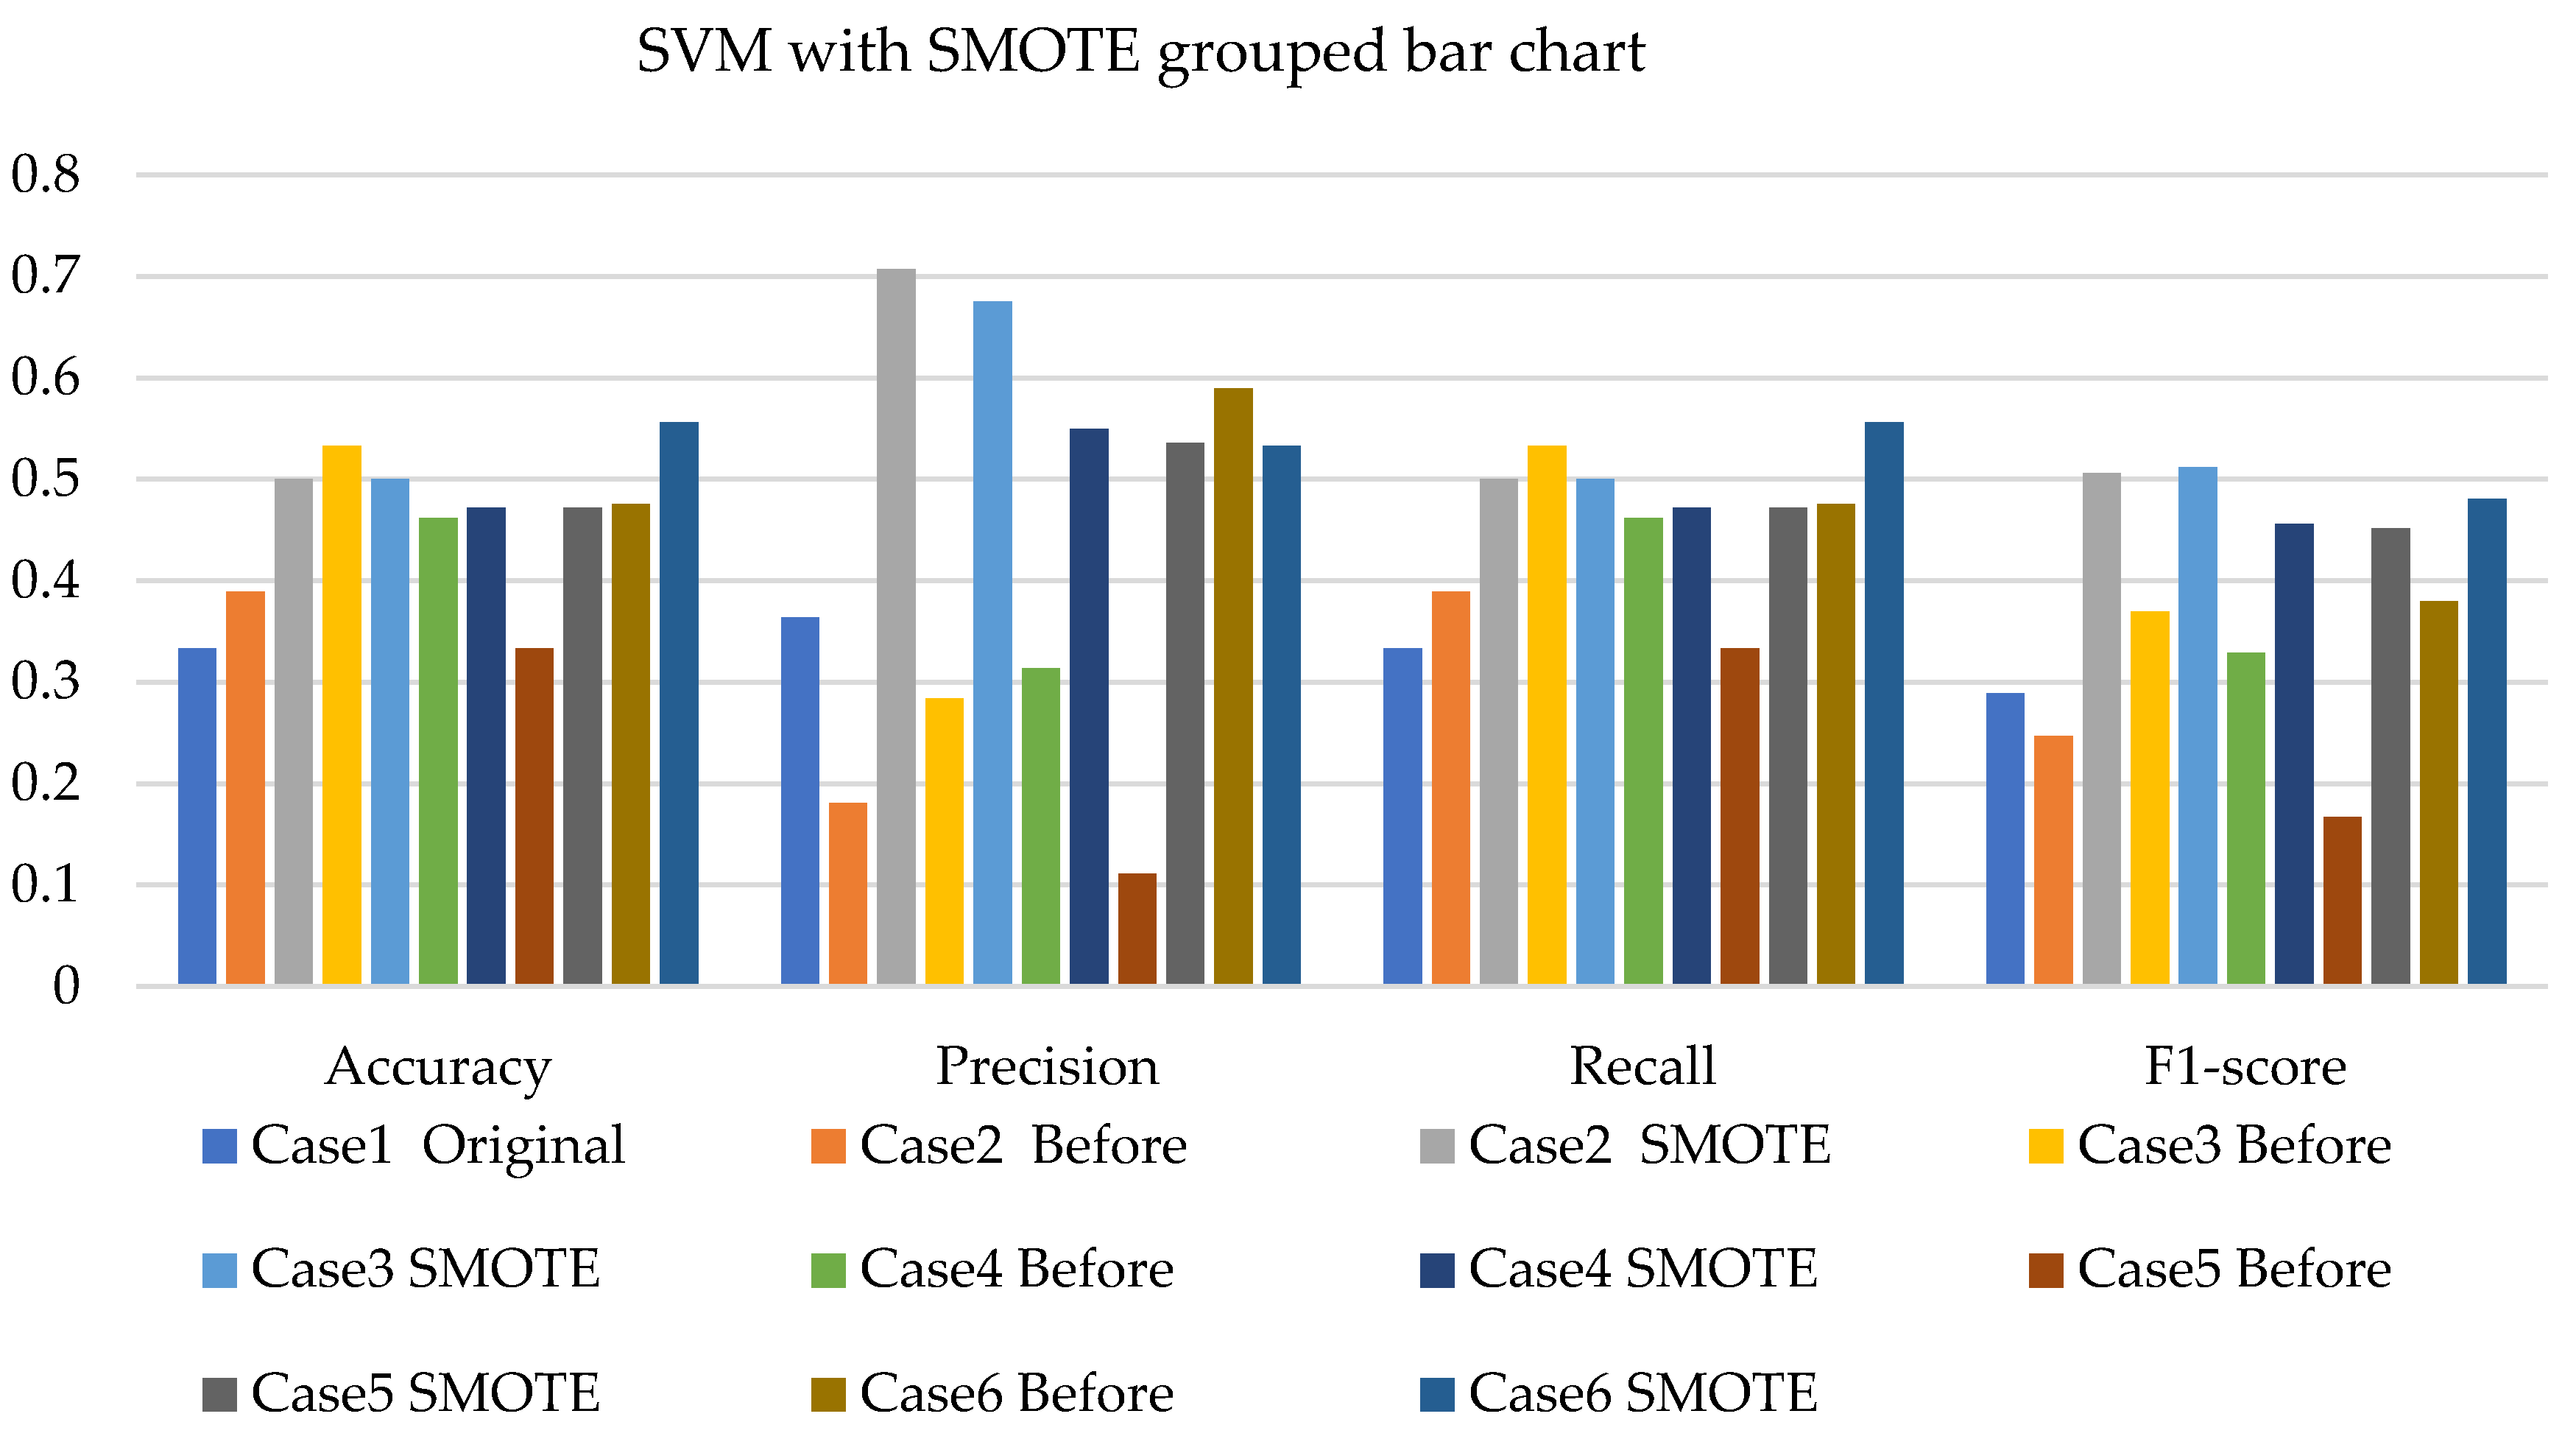
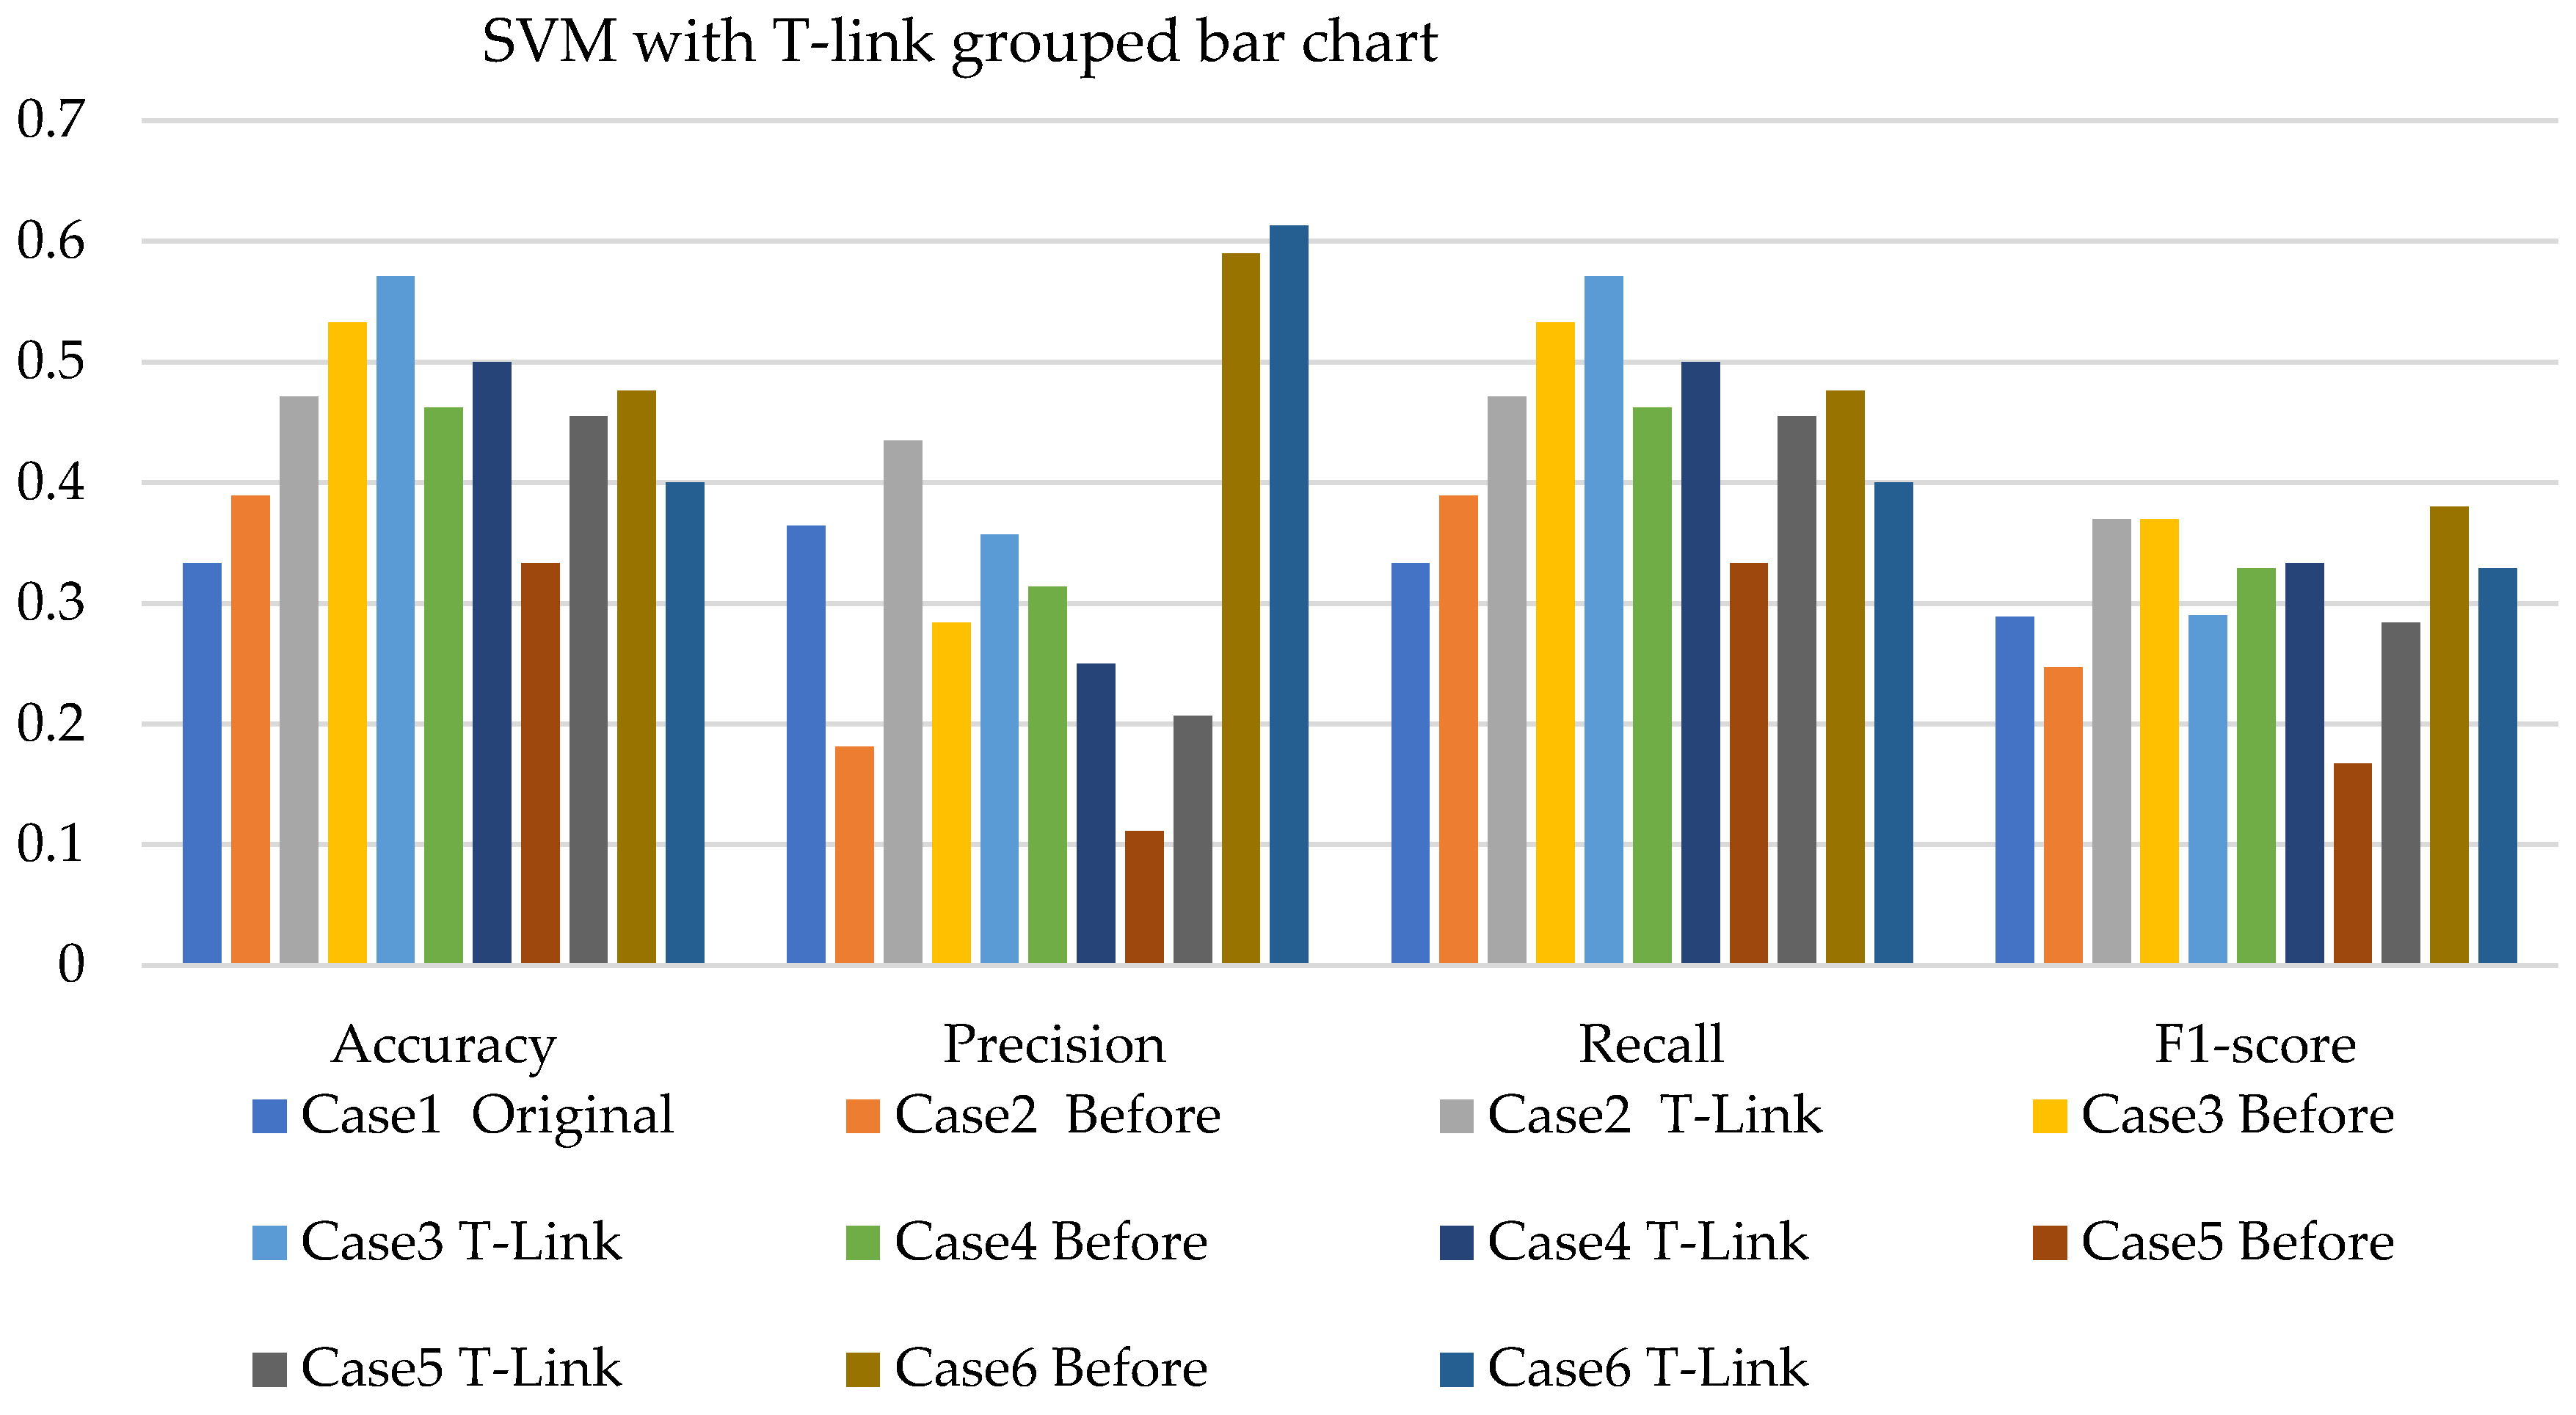
- The SVM with resampling methods for simulated and experimental data has a minimum accuracy of 36% and 39% and a maximum of 78% and 65%, respectively.
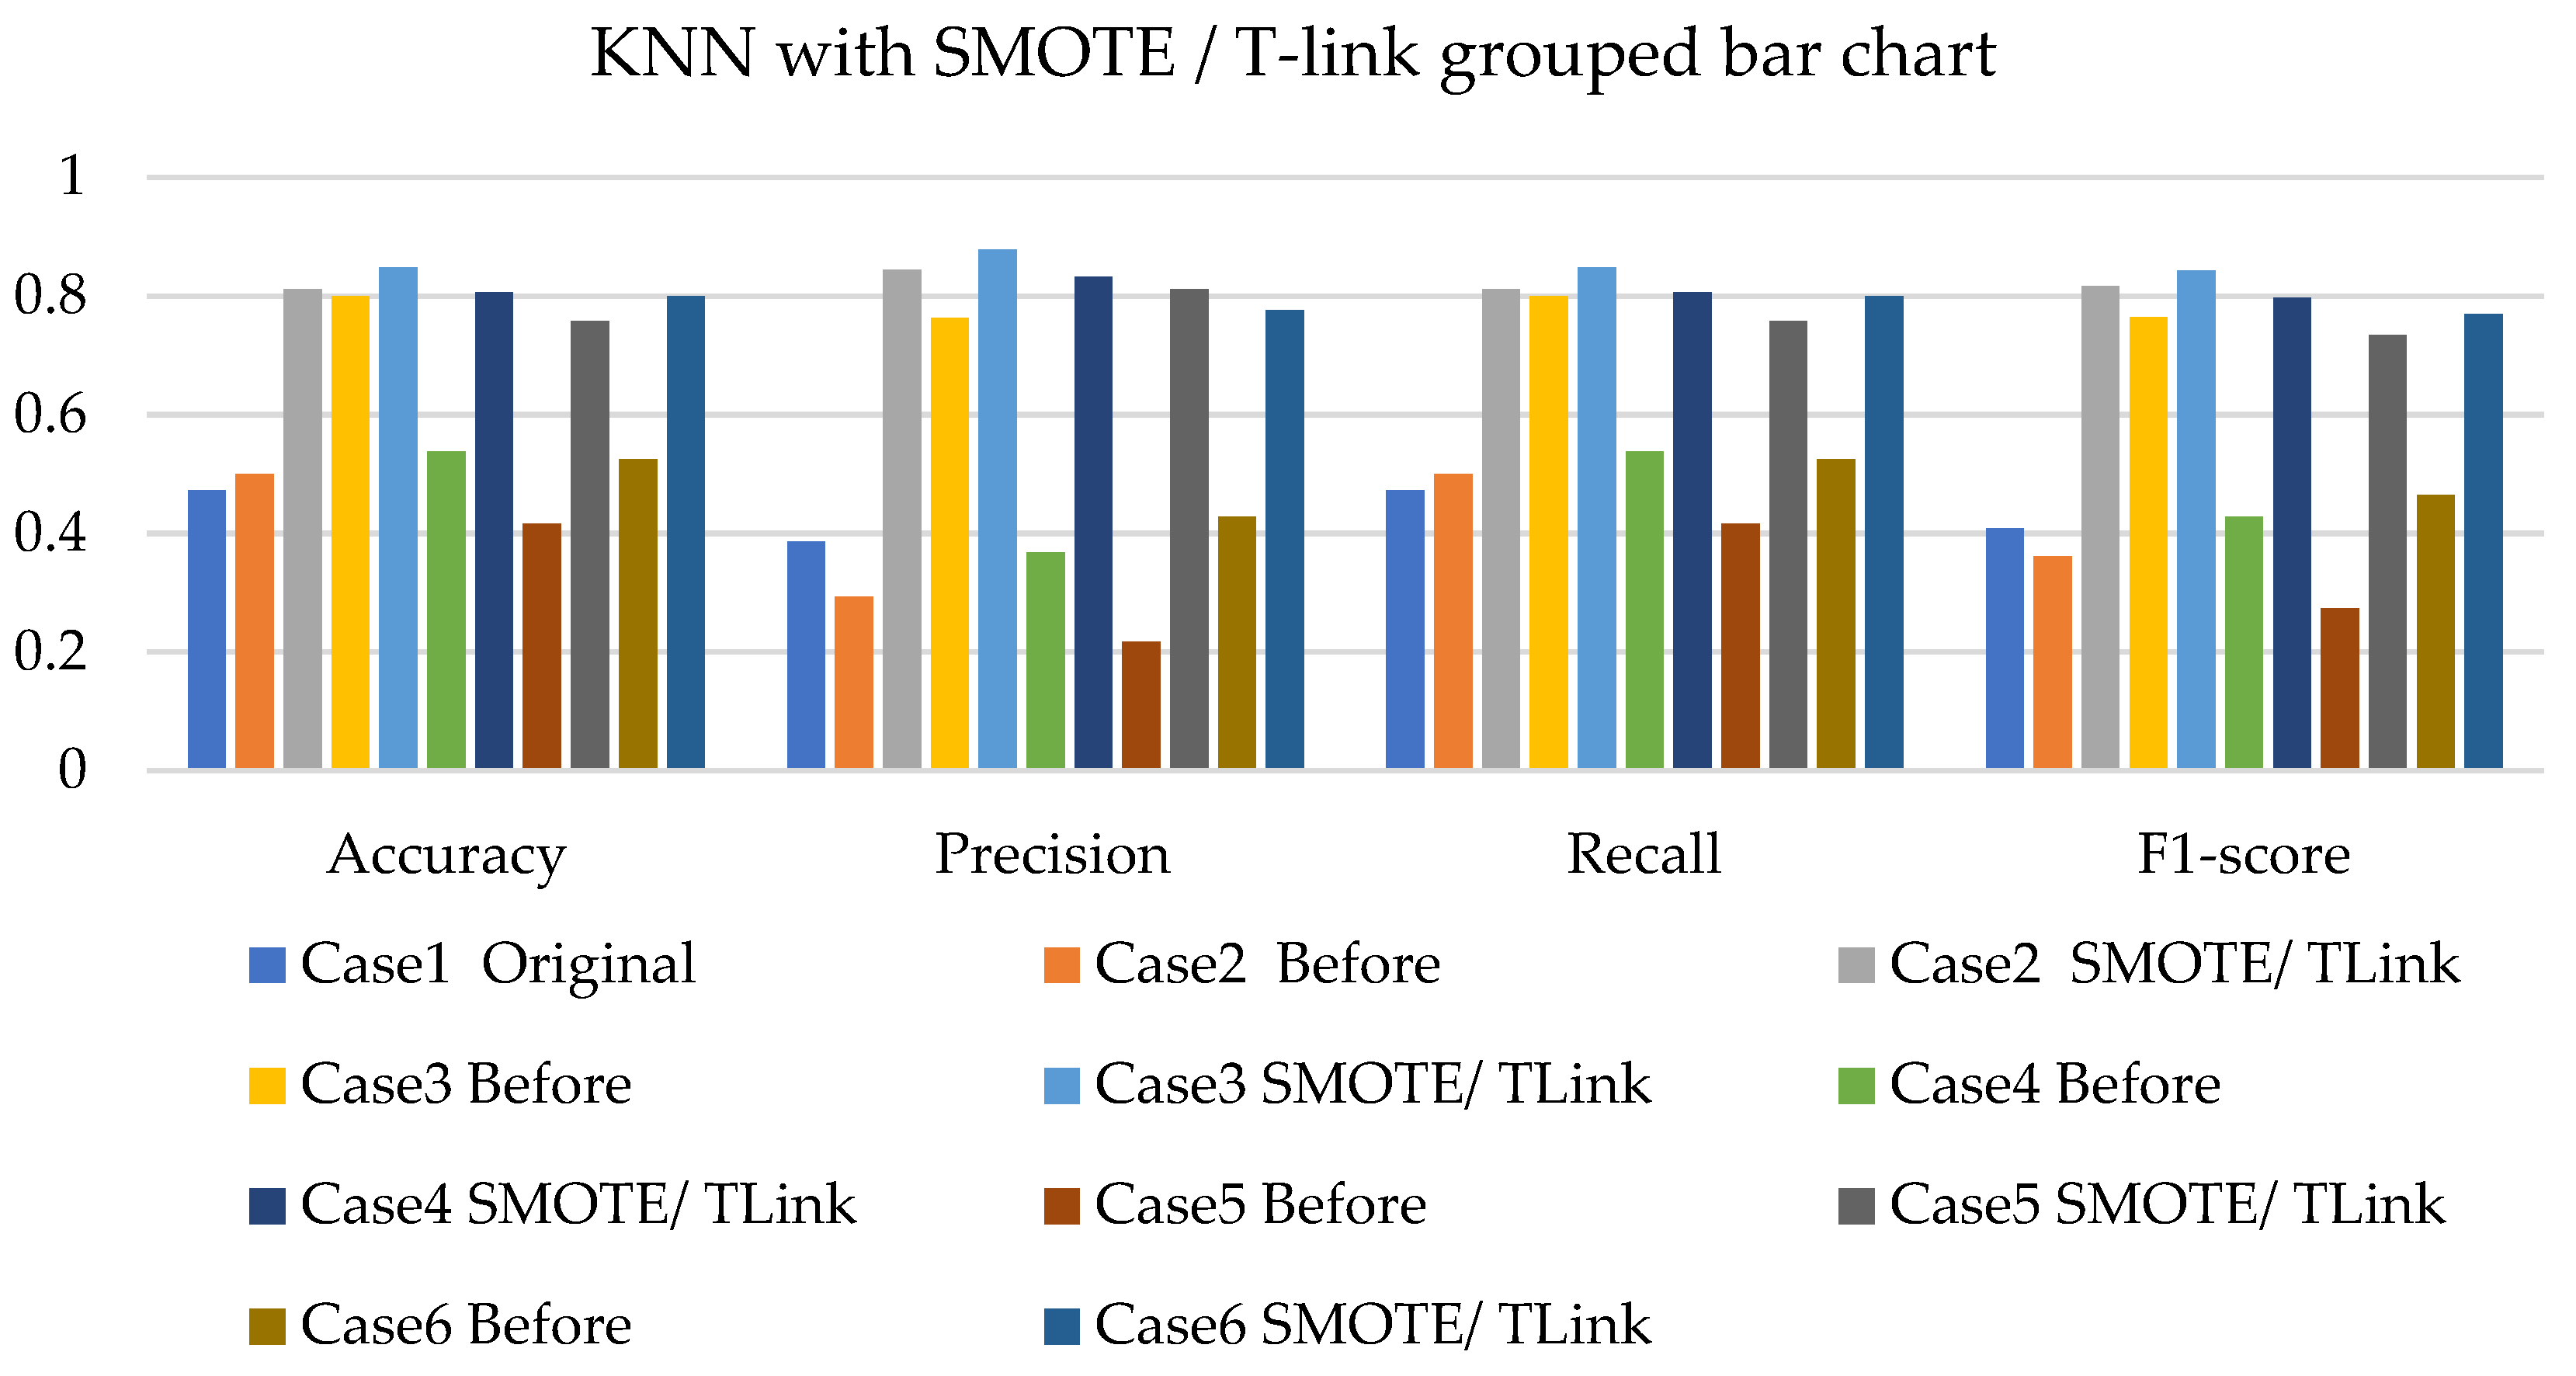
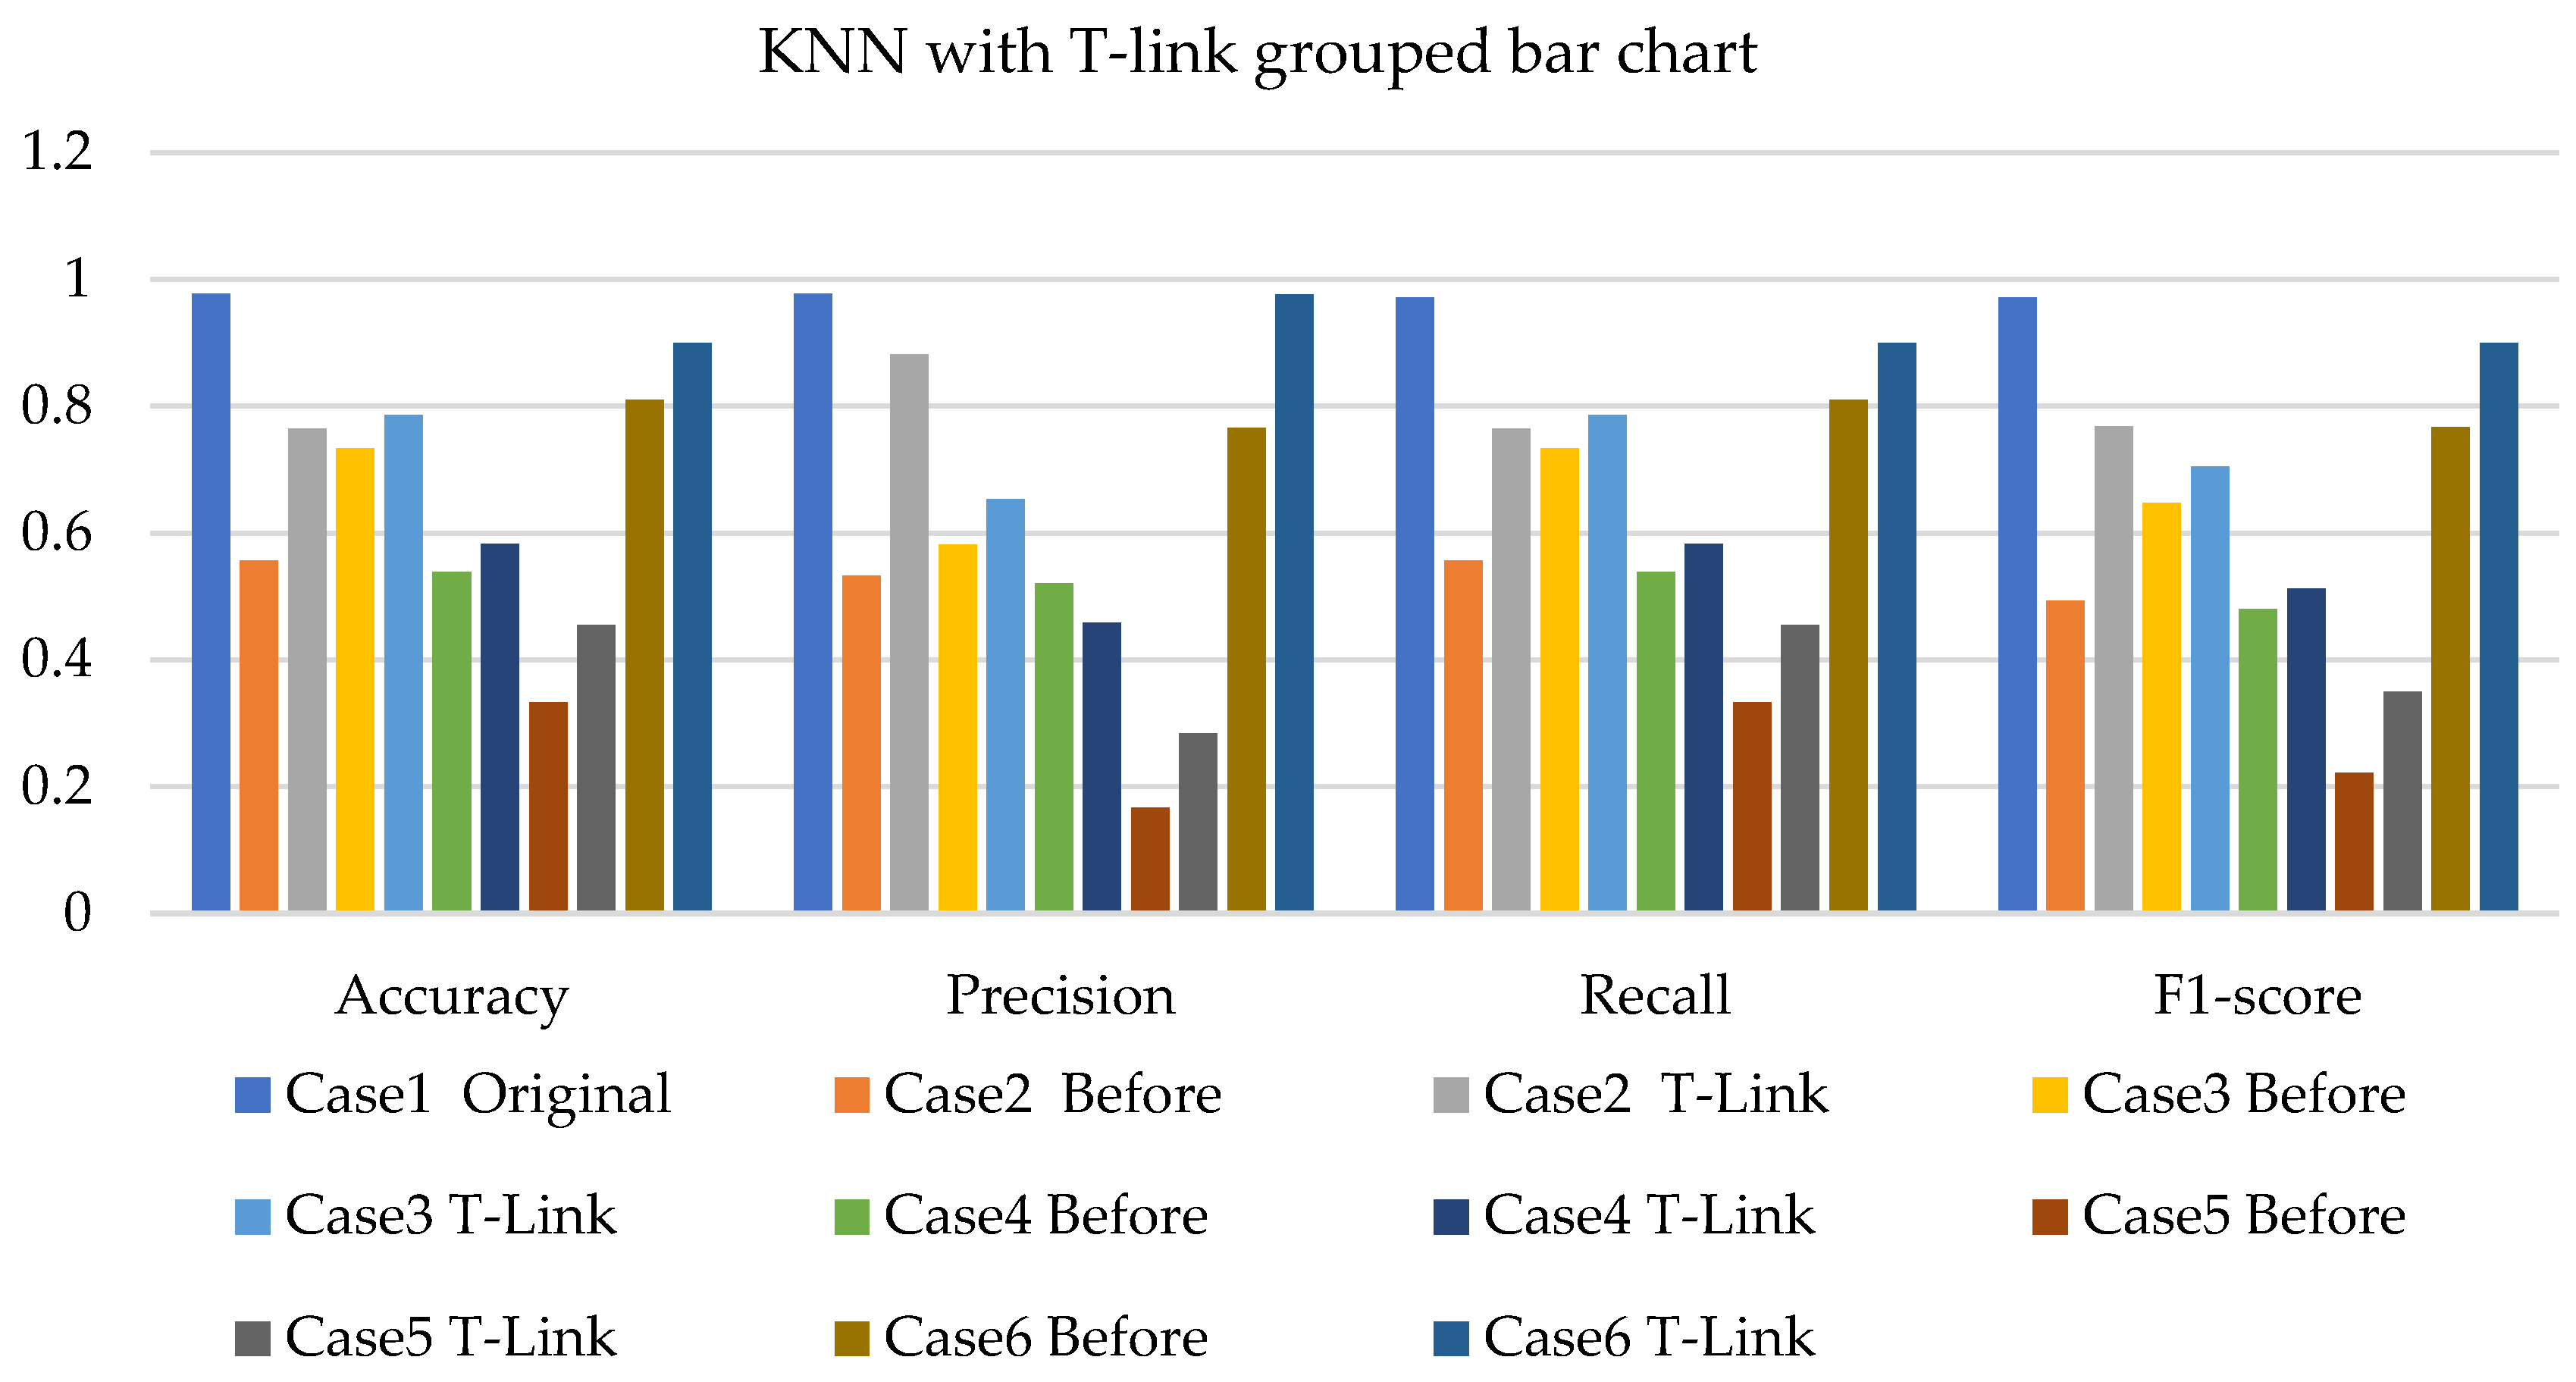
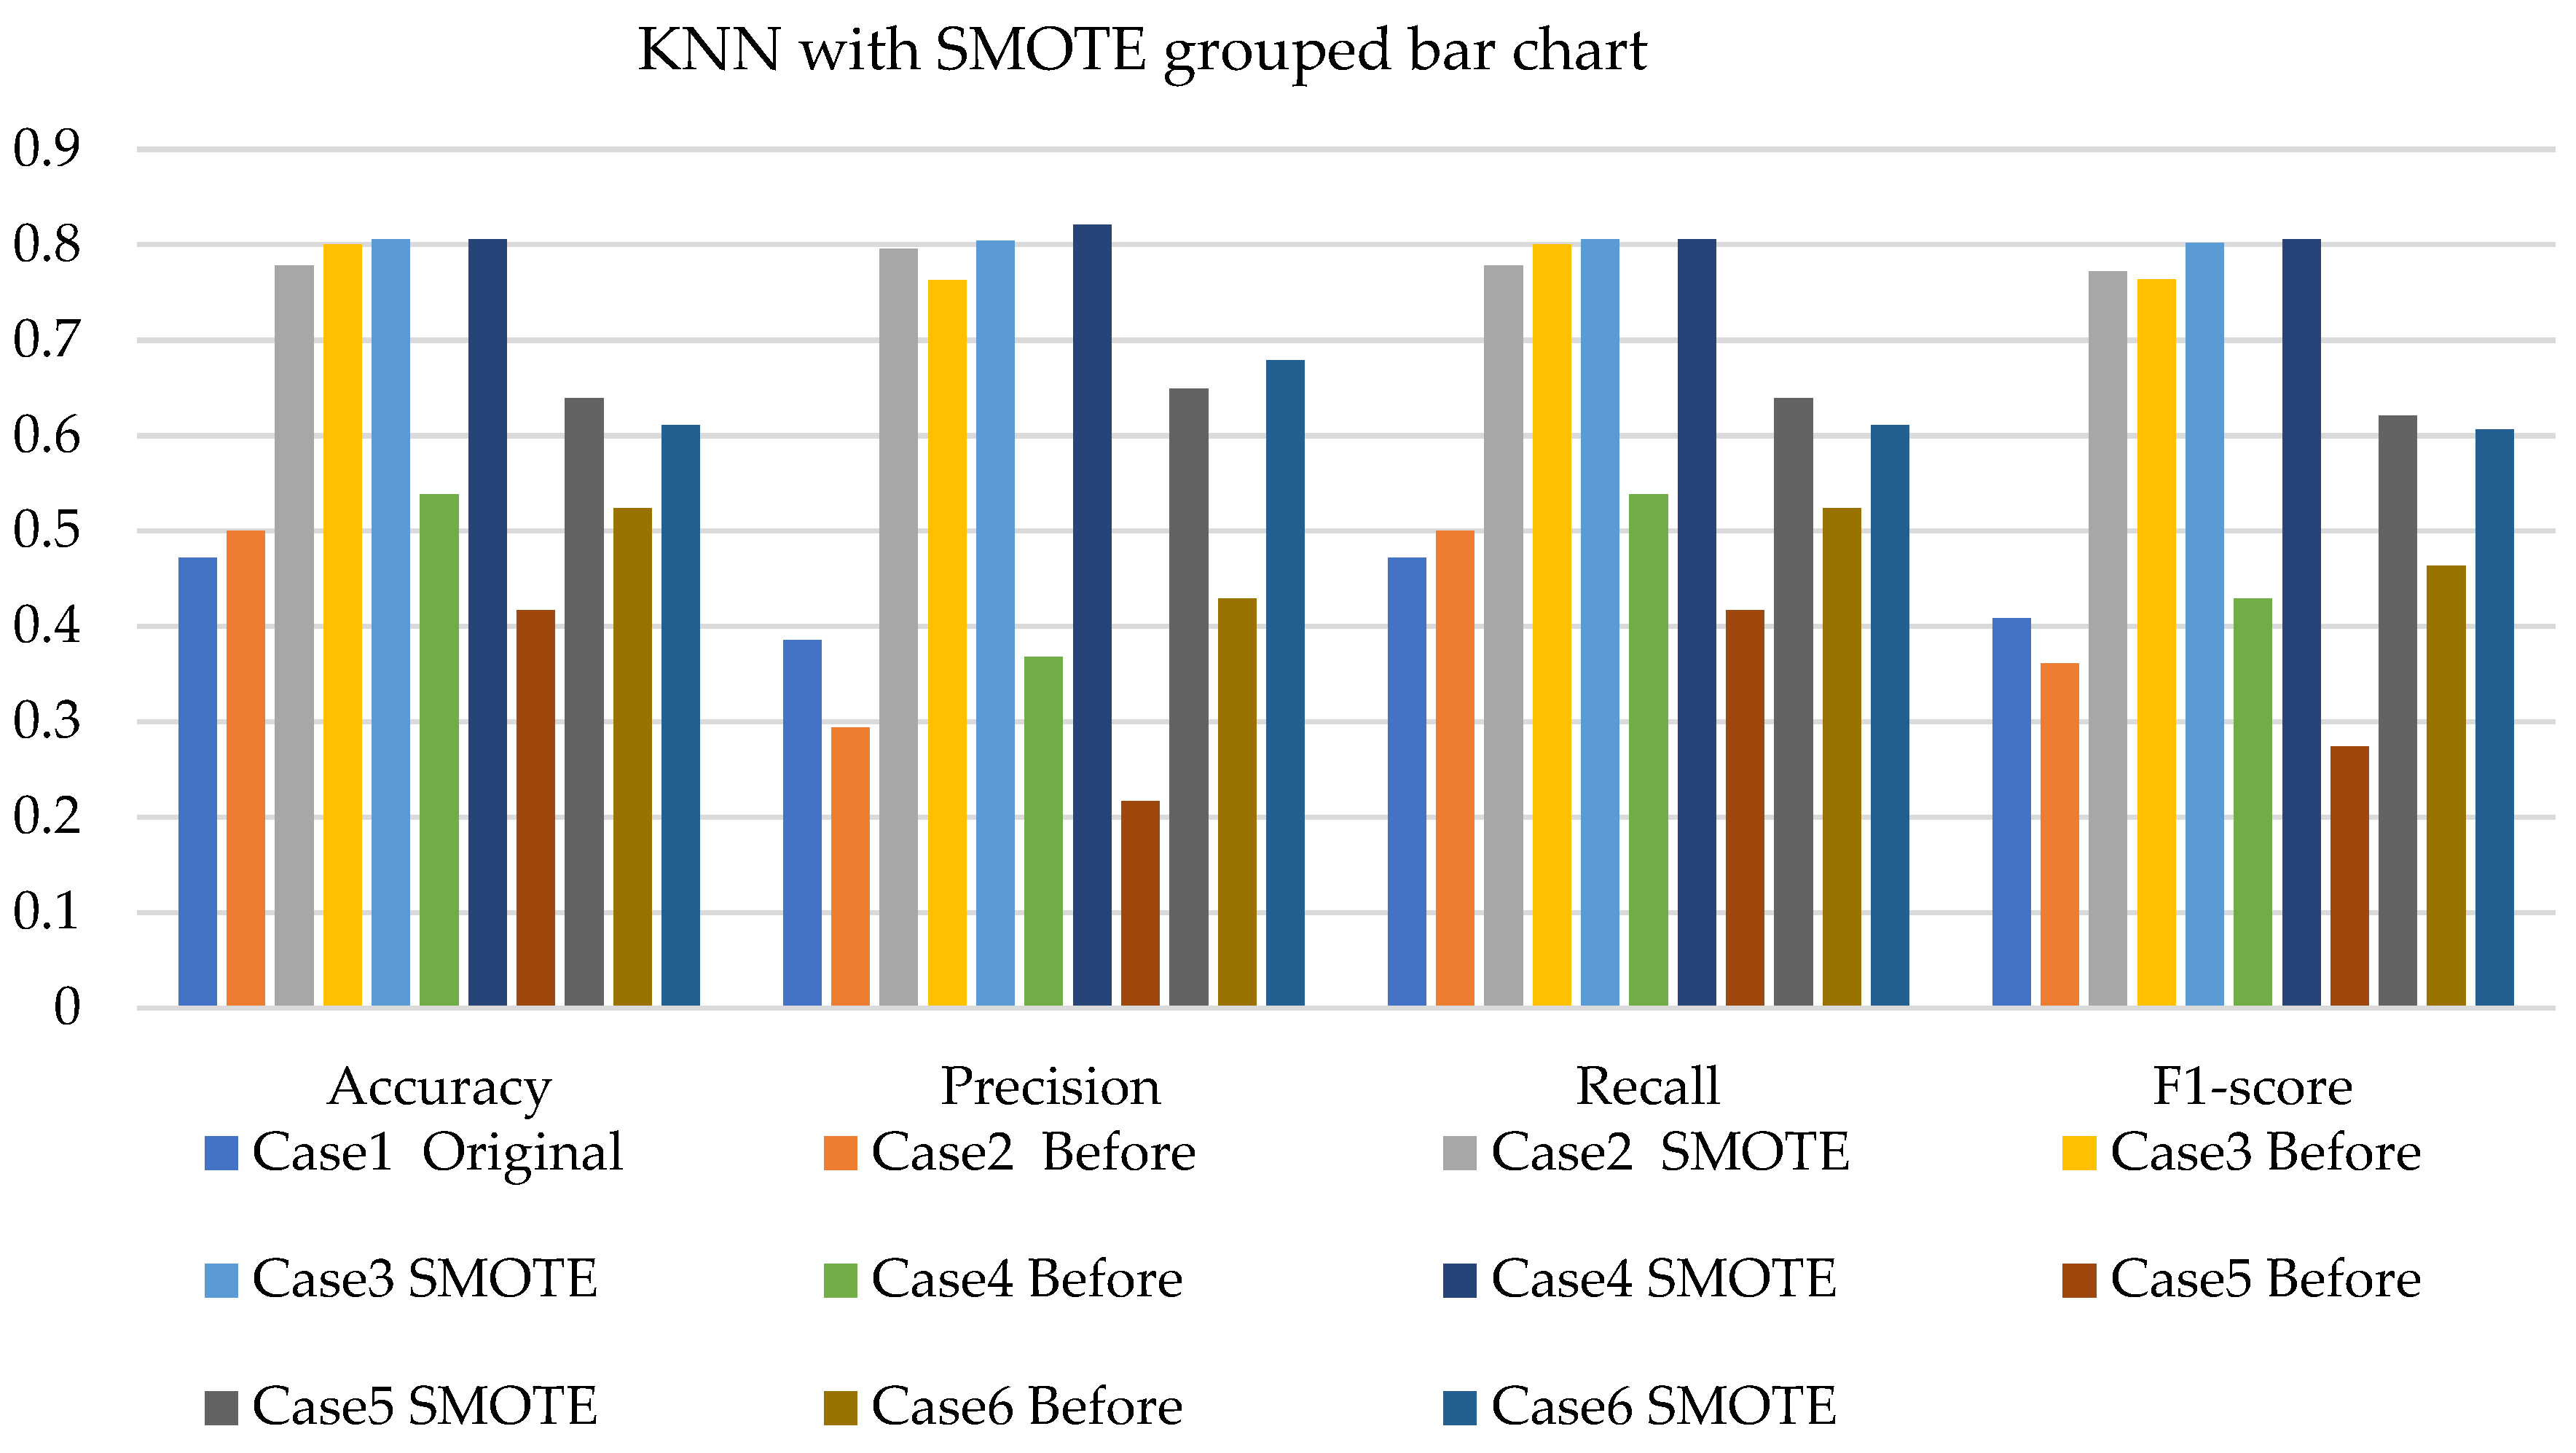
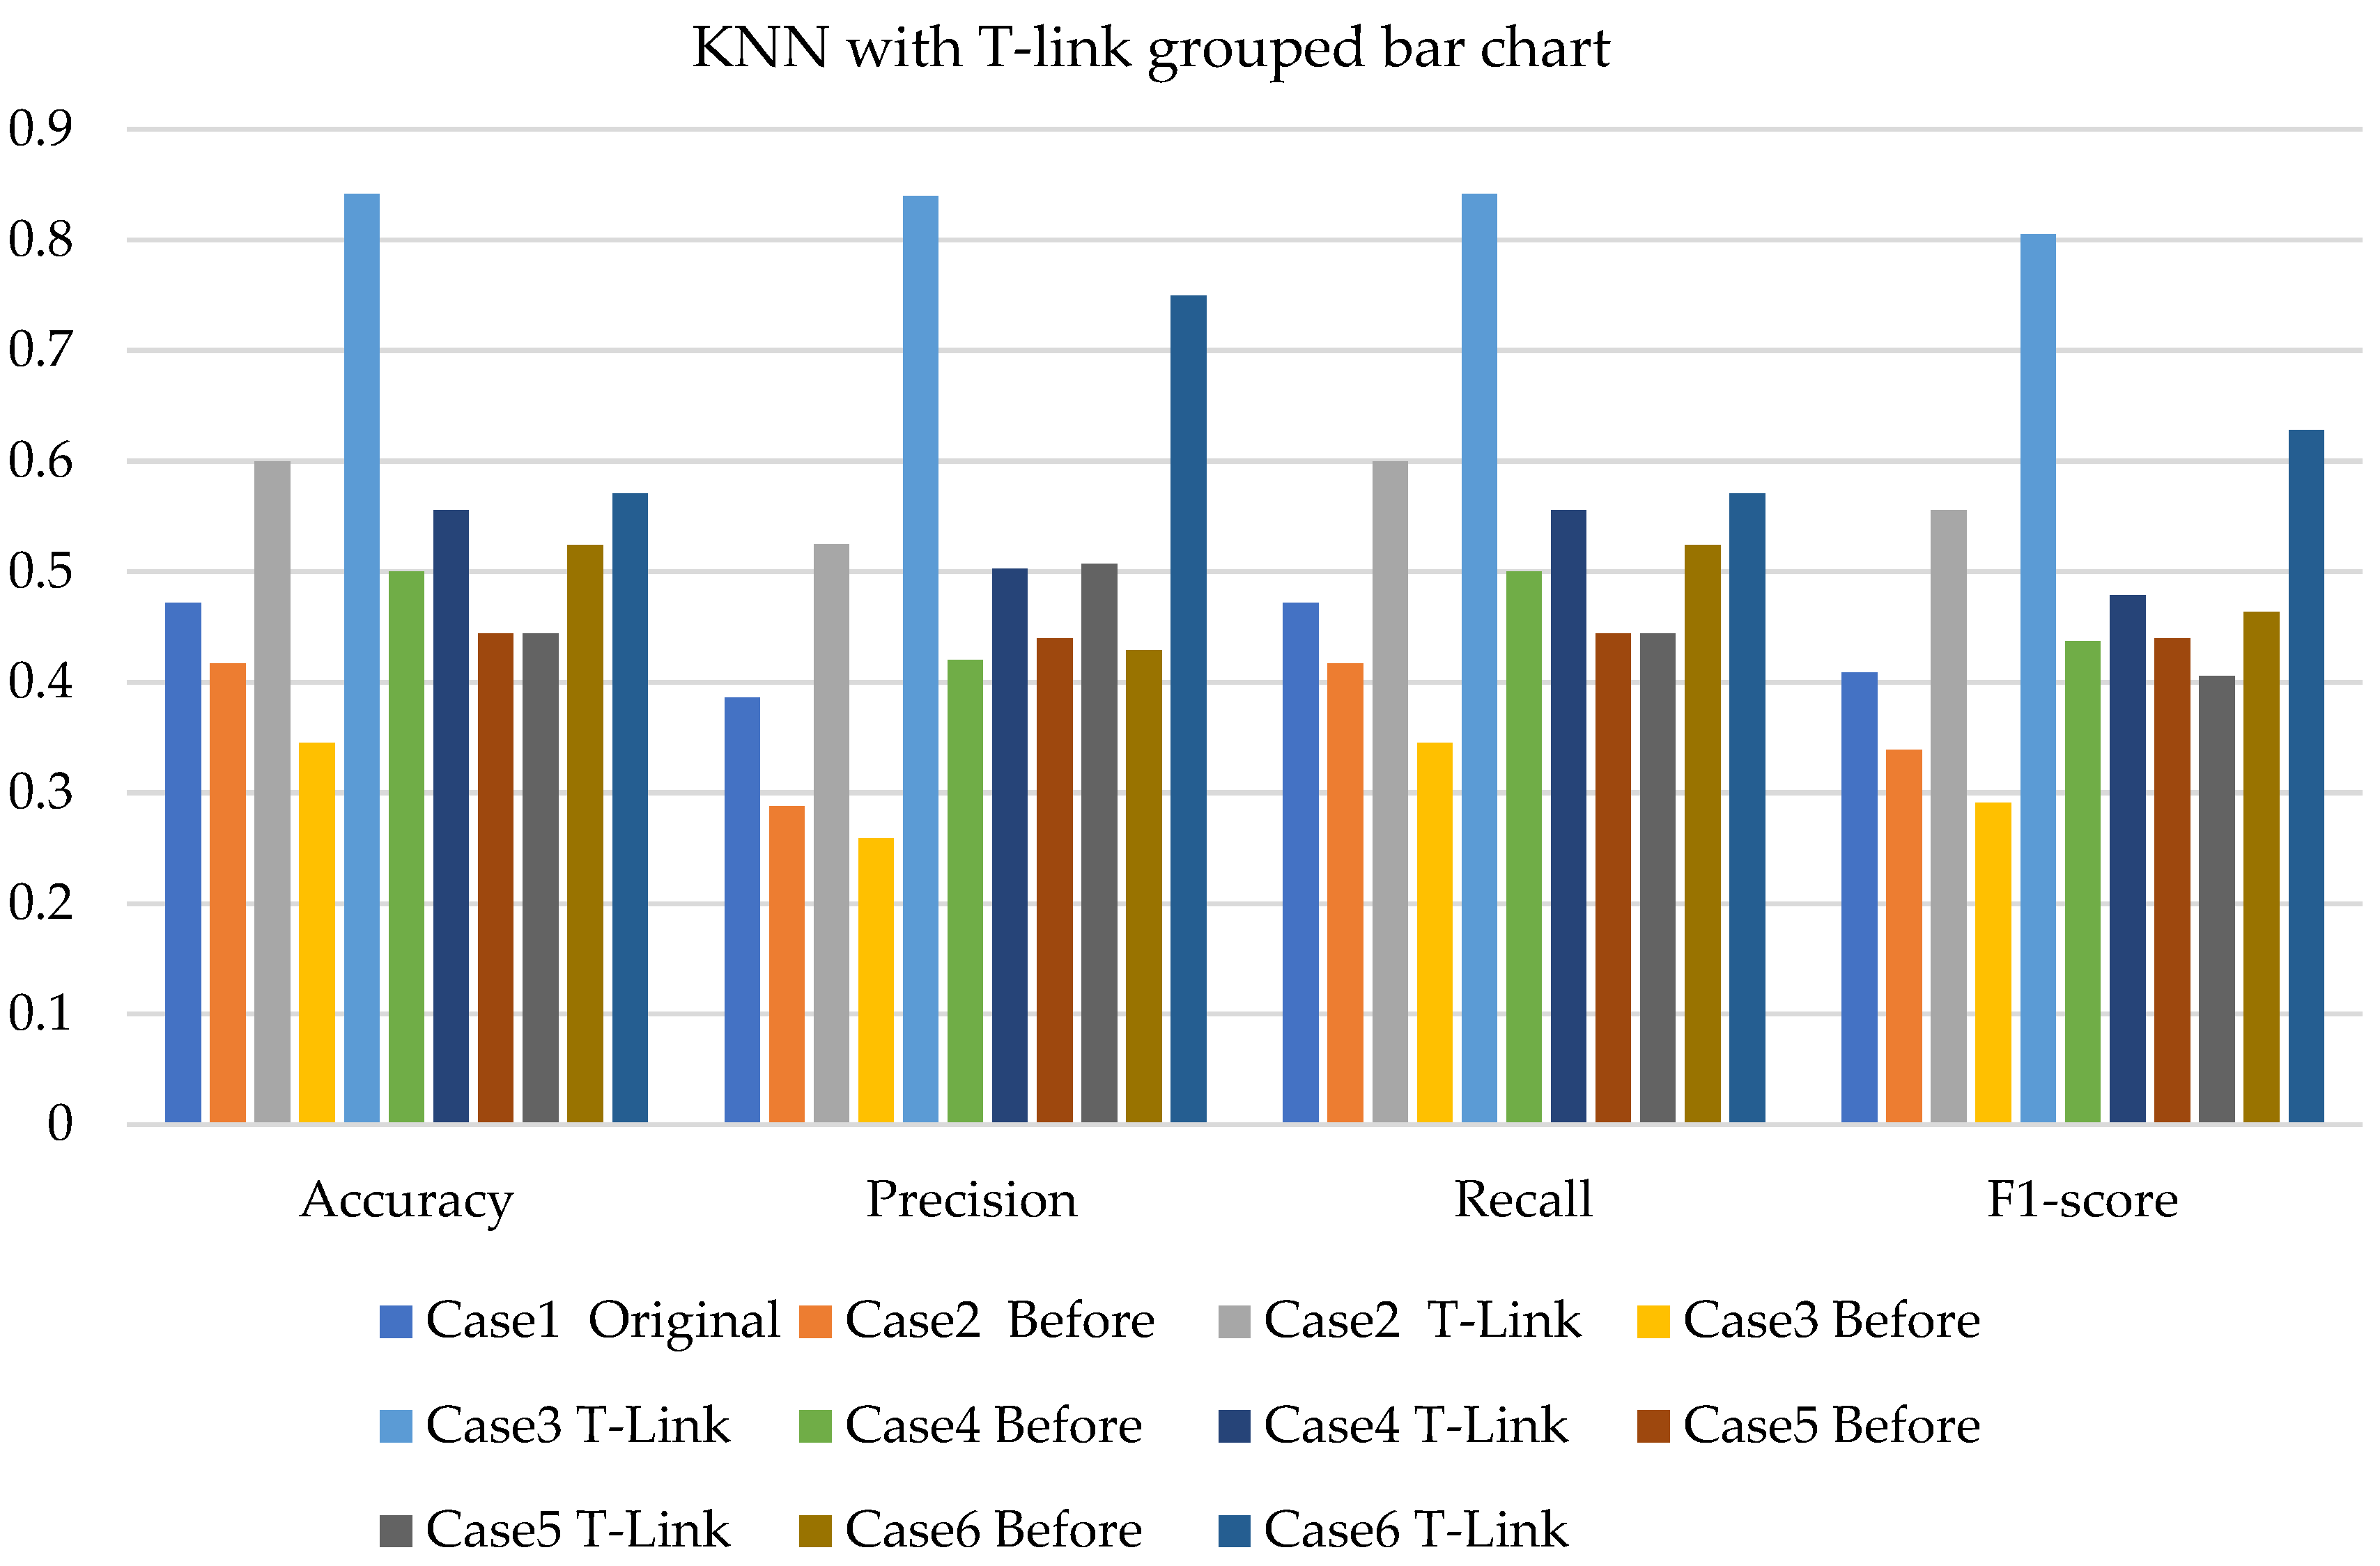
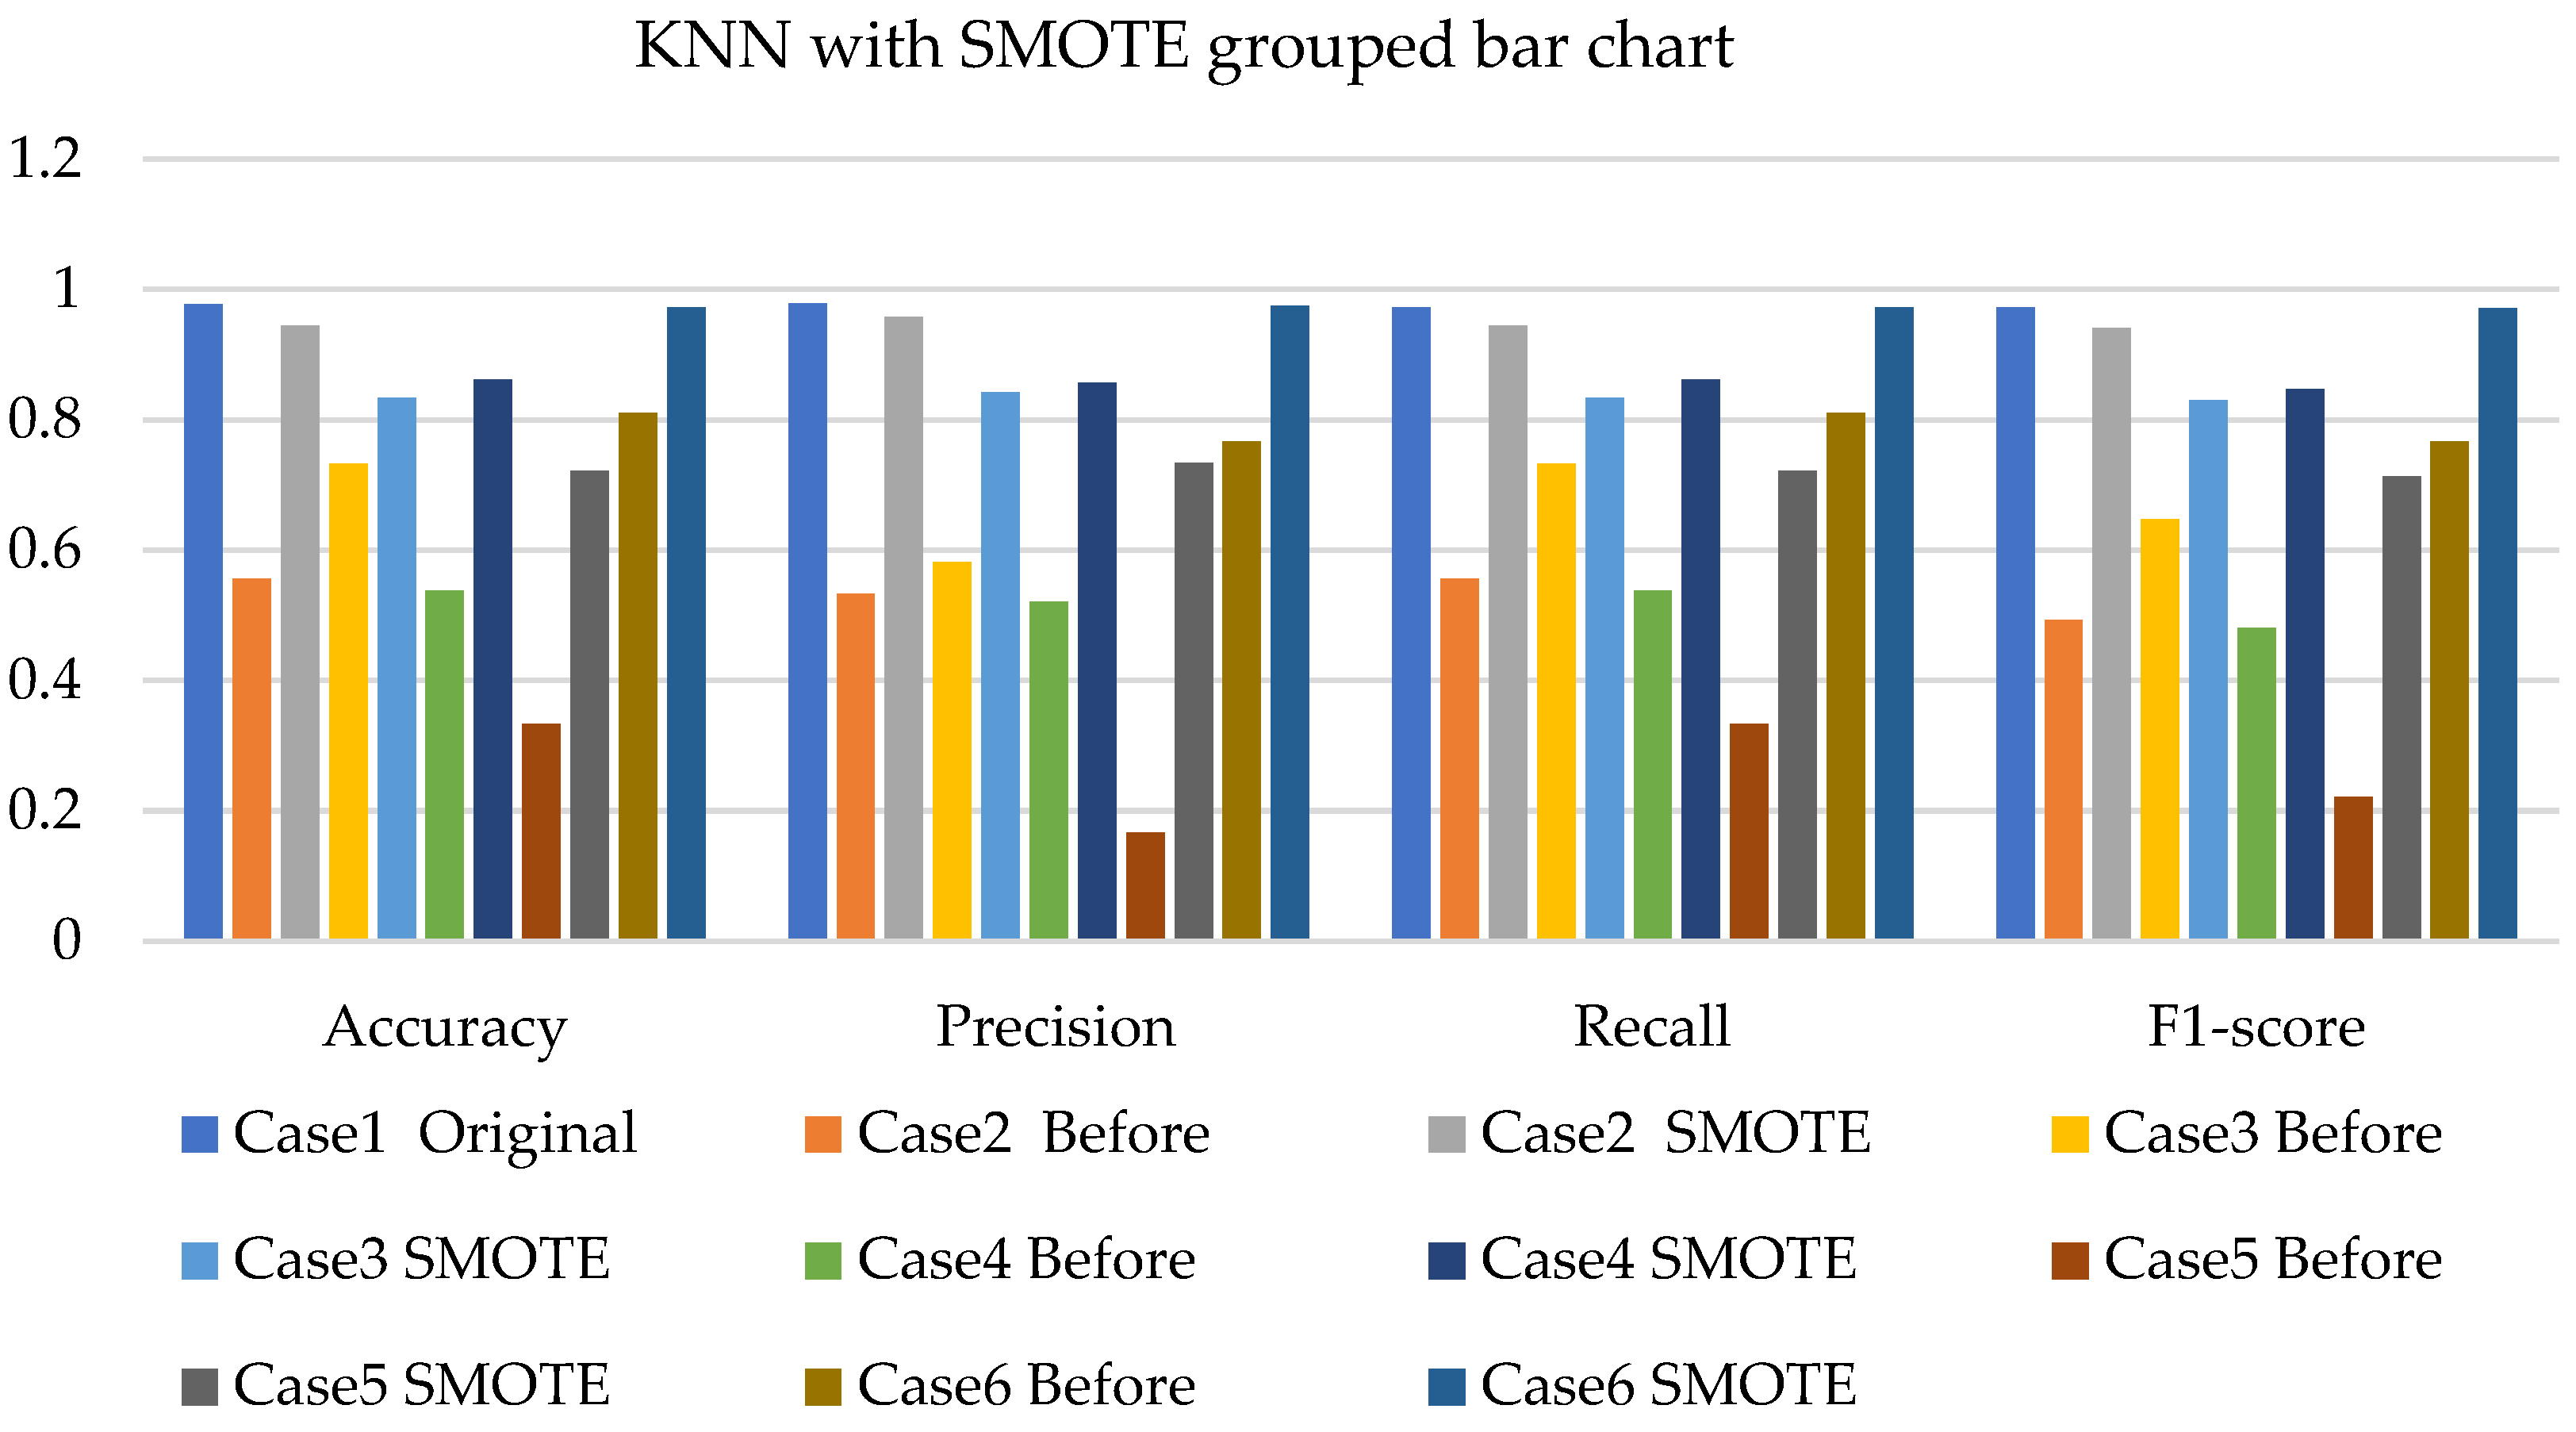
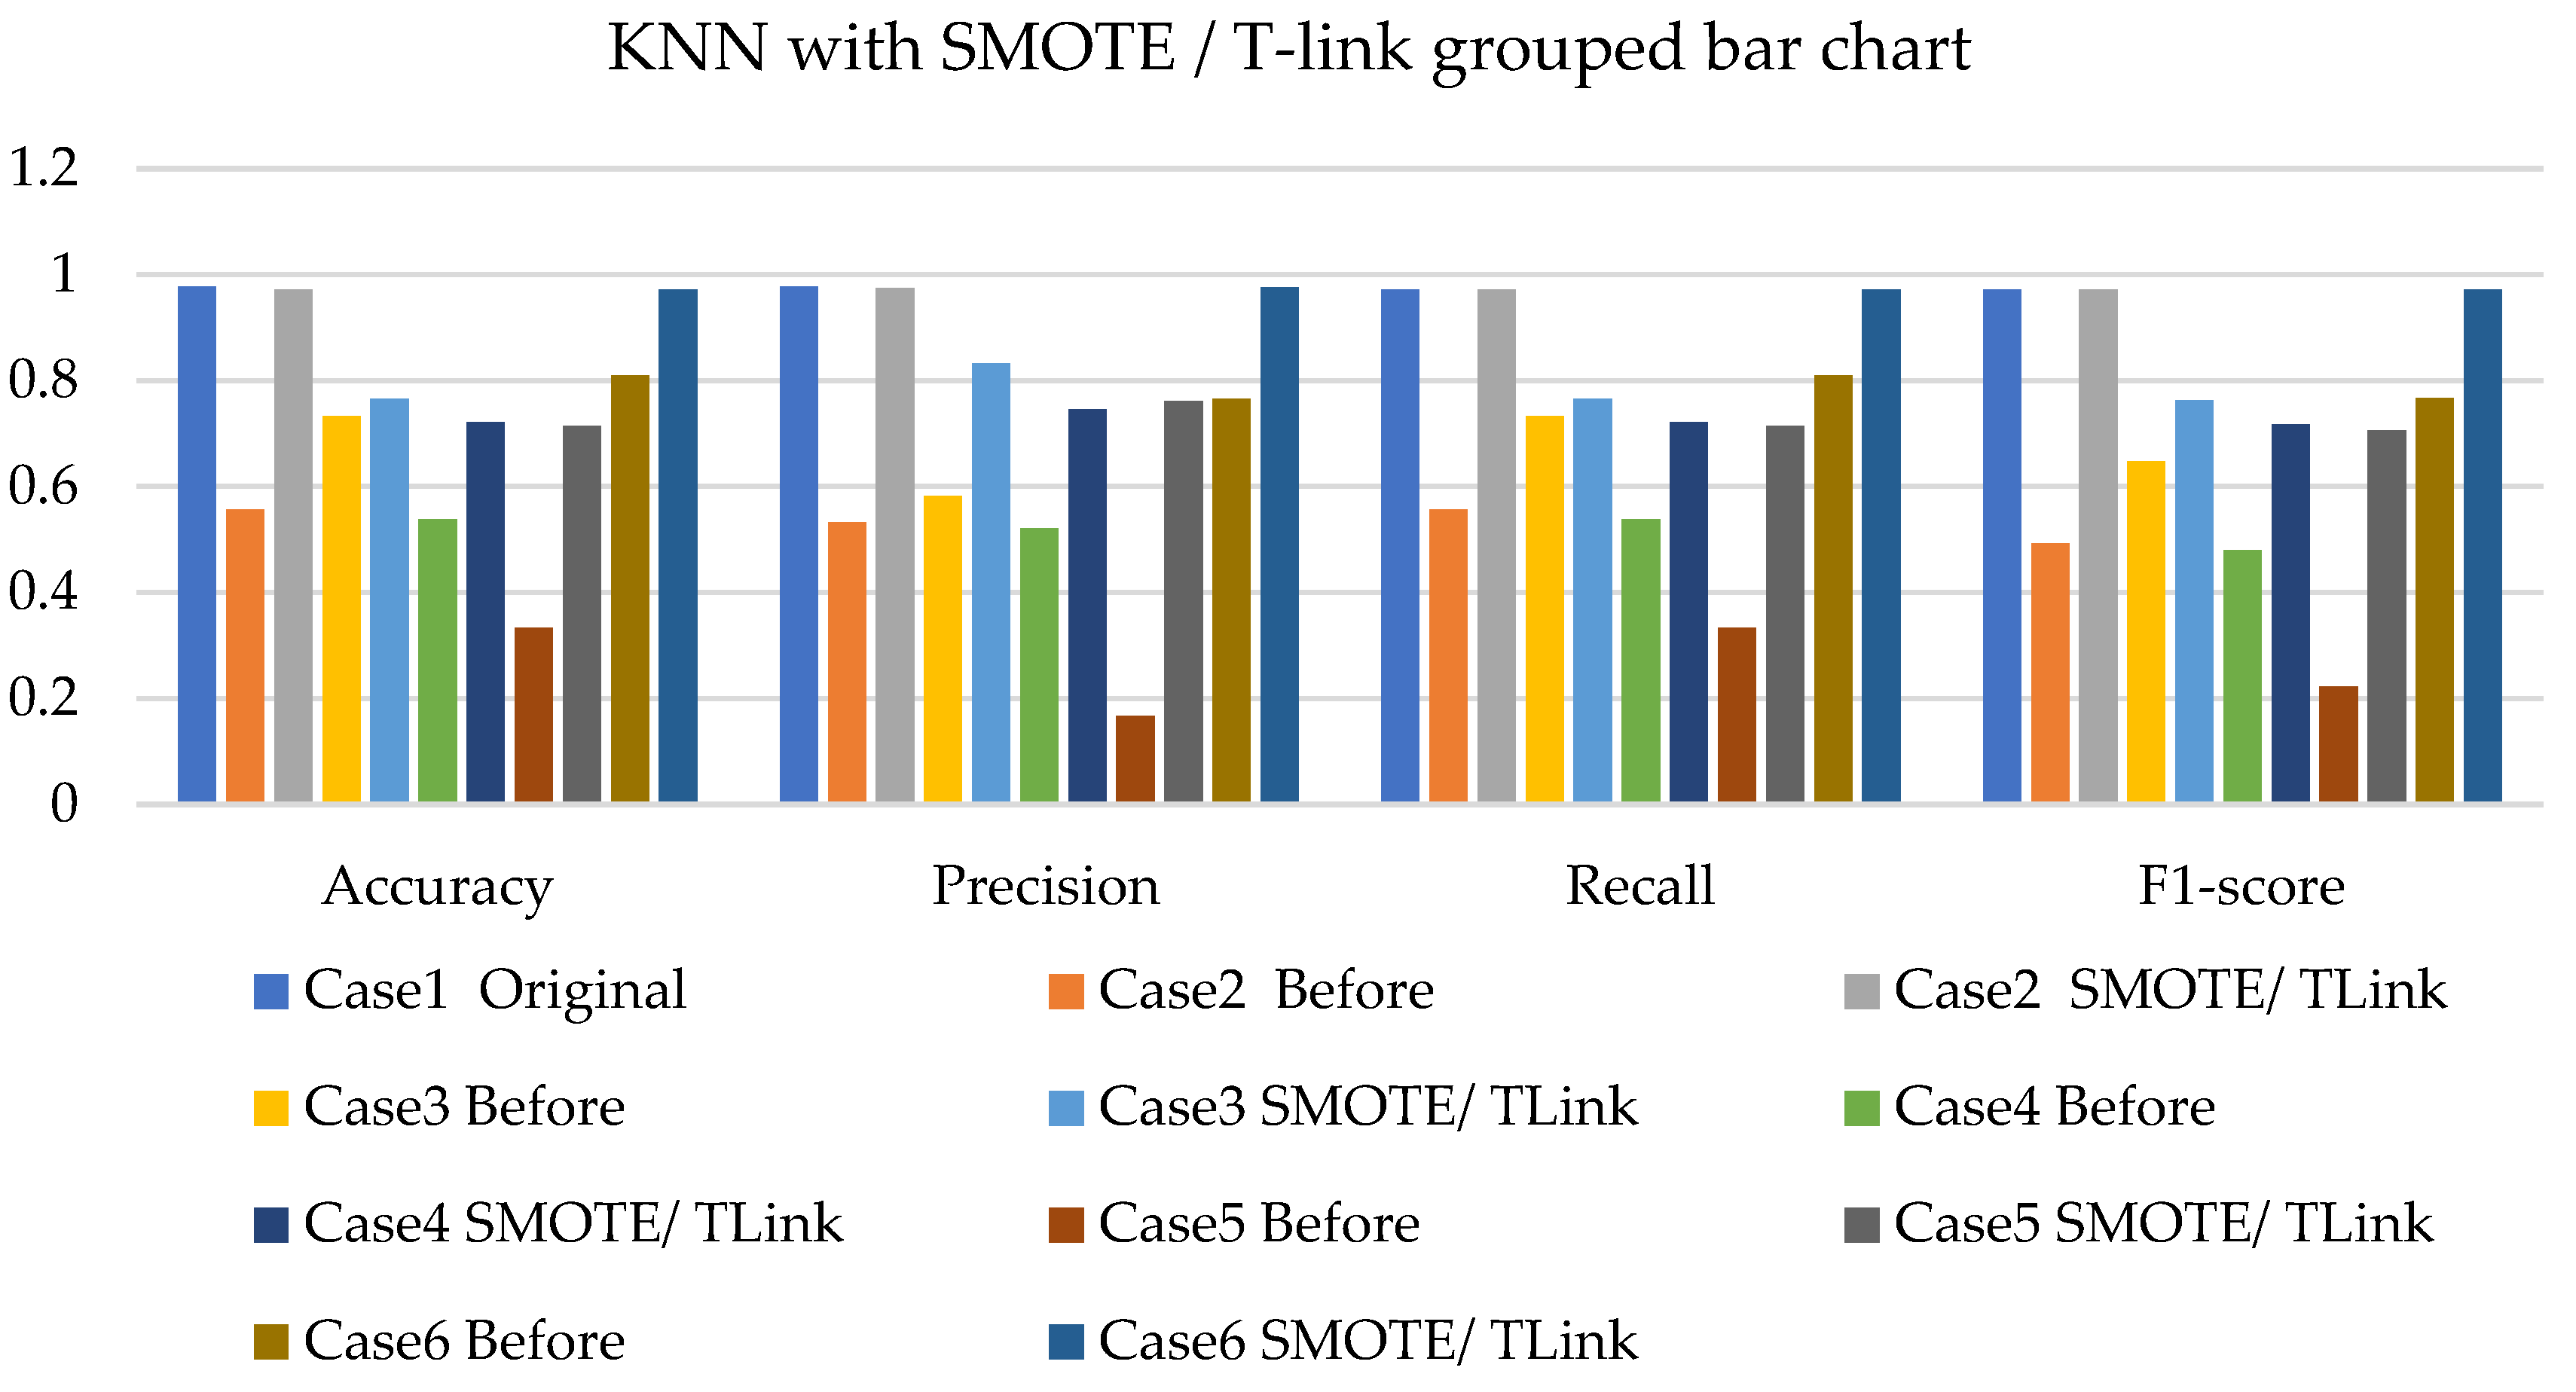
- The k-NN with resampling methods for simulated and experimental data has a minimum accuracy of 57% and 71% and a maximum of 84% and 97%, respectively.
Author Contributions
Funding
Institutional Review Board Statement
Informed Consent Statement
Data Availability Statement
Conflicts of Interest
References
- Khan, M.U.; Imtiaz, M.A.; Aziz, S.; Kareem, Z.; Waseem, A.; Akram, M.A. System design for early fault diagnosis of machines using vibration features. In Proceedings of the IEEE 5th International Conference on Power Generation Systems and Renewable Energy Technologies, Istanbul, Turkey, 26–27 August 2019. [Google Scholar]
- Spyropoulos, D.V.; Mitronikas, E.D. A review on the faults of electric machines used in electric ships. Adv. Power Electron. 2013, 2013, 216870. [Google Scholar] [CrossRef]
- Salomon, C.P.; Ferreira, C.; Sant’Ana, W.; Lambert-Torres, G.; Borges da Silva, L.E.; Bonaldi, E.L.; Oliveira, L.; Torres, B. A study of fault diagnosis based on electrical signature analysis for synchronous generators predictive maintenance in bulk electric systems. Energies 2019, 12, 1506. [Google Scholar] [CrossRef] [Green Version]
- Rehman, A.U.; Chen, Y.; Wang, L.; Zhao, Y.; Yonghong, Y.; Yonghong, C.; Tanaka, T. Experimental research and analysis on rotor winding inter-turn circuit fault in DFIG. In Proceedings of the IEEE International Conference on Condition Monitoring and Diagnosis, Xi’an, China, 25–28 September 2016. [Google Scholar]
- Sun, W.; Zhao, R.; Yan, R.; Shao, S.; Chen, X. Convolutional discriminative feature learning for induction motor fault diagnosis. IEEE Trans. Ind. Inform. 2017, 13, 1350–1359. [Google Scholar] [CrossRef]
- Jung, D.; Sundström, C. A combined data-driven and model-based residual selection algorithm for fault detection and isolation. IEEE Trans. Control. Syst. Technol. 2017, 27, 616–630. [Google Scholar] [CrossRef] [Green Version]
- Dai, X.; Gao, Z. From model, signal to knowledge: A data-driven perspective of fault detection and diagnosis. IEEE Trans. Ind. Inform. 2013, 9, 2226–2238. [Google Scholar] [CrossRef] [Green Version]
- Wang, L.; Zhang, Z.; Long, H.; Xu, J.; Liu, R. Wind turbine gearbox failure identification with deep neural networks. IEEE Trans. Ind. Inform. 2017, 13, 1360–1368. [Google Scholar] [CrossRef]
- Zhao, X.; Jia, M.; Liu, Z. Semi-supervised graph convolution deep belief network for fault diagnosis of electromechanical system with limited labeled data. IEEE Trans. Ind. Inform. 2020, 17, 5450–5460. [Google Scholar] [CrossRef]
- Wang, Z.; Chen, C.; Li, H.X.; Dong, D.; Tarn, T.J. Incremental reinforcement learning with prioritized sweeping for dynamic environments. IEEE/ASME Trans. Mechatron. 2019, 24, 621–632. [Google Scholar] [CrossRef]
- Zhang, T.; Chen, J.; Li, F.; Zhang, K.; Lv, H.; He, S.; Xu, E. Intelligent fault diagnosis of machines with small & imbalanced data: A state-of-the-art review and possible extensions. ISA Trans. 2021, 119, 152–171. [Google Scholar]
- Mathew, R.M.; Gunasundari, R. A review on handling multiclass imbalanced data classification in education domain. In Proceedings of the International Conference on Advance Computing and Innovative Technologies in Engineering, Greater Noida, India, 4–5 March 2021. [Google Scholar]
- Chawla, N.V.; Bowyer, K.W.; Hall, L.O.; Kegelmeyer, W.P. SMOTE: Synthetic Minority Over-sampling Technique. J. Artif. Intell. Res. 2002, 16, 321–357. [Google Scholar] [CrossRef]
- Sun, J.; Li, H.; Fujita, H.; Fu, B.; Ai, W. Class-imbalanced dynamic financial distress prediction based on Adaboost-SVM ensemble combined with SMOTE and time weighting. Inf. Fusion 2020, 54, 128–144. [Google Scholar] [CrossRef]
- Wah, Y.B.; Rahman, H.A.A.; He, H.; Bulgiba, A. Handling imbalanced dataset using SVM and. AIP Conf. Proc. 2016, 1750, 020023. [Google Scholar]
- Babar, V.S.; Ade, R. A review on imbalanced learning methods. Int. J. Comput. Appl. 2015, 975, 23–27. [Google Scholar]
- Jianan, W.; Haisong, H.; Liguo, Y.; Yao, H.; Qingsong, F.; Dong, H. New imbalanced fault diagnosis framework based on Cluster-MWMOTE and MFO-optimized LS-SVM using limited and complex bearing data. Eng. Appl. Artif. Intell. 2020, 96, 103966. [Google Scholar]
- Wei, J.; Huang, H.; Yao, L.; Hua, Y.; Fan, Q.; Huang, D. New imbalanced bearing fault diagnosis method based on. Appl. Soft Comput. J. 2021, 101, 107043. [Google Scholar] [CrossRef]
- Martin-Diaz, I.; Morinigo-Sotelo, D.; Duque-Perez, O.; Romero-Troncoso, R.J. Early fault detection in induction motors using AdaBoost with imbalanced small data and optimized sampling. IEEE Trans. Ind. Appl. 2017, 53, 3066–3075. [Google Scholar] [CrossRef]
- Fergus, P.; Huang, D.; Hamdan, H. Prediction of intrapartum hypoxia from cardiotocography data using machine learning. In Applied Computing in Medicine and Health—Emerging Topics in Computer Science and Applied Computing; Al-Jumeily, D., Hussain, A., Mallucci, C., Oliver, C., Eds.; Elsevier: Amsterdam, The Netherlands, 2016; Volume 1, pp. 125–146. [Google Scholar]
- Napierala, K.; Stefanowski, J. Types of minority class examples and their influence on learning classifiers from imbalanced data. J. Intell. Inf. Syst. 2016, 46, 563–597. [Google Scholar] [CrossRef]
- Doorsamy, W.; Cronje, W.A. Optimisation of shaft voltages based condition monitoring in generators using a Bayesian approach. In Proceedings of the 7th IET International Conference on Power Electronics (PEMD), Machines and Drives, Manchester, UK, 8–10 April 2014. [Google Scholar]
- Taroni, F.; Biedermann, A.; Bozza, S.; Garbolino, P.; Aitken, C. Bayesian Networks for Inference and Decision Analysis in Forensic Science, 2nd ed.; John Wiley & Sons: Hoboken, NJ, USA, 2014; pp. 1–43. [Google Scholar]
- Hasib, A.K.; Iqbal, M.; Shah, F.; Mahmud, J.; Popel, M.; Showrov, M.I.H.; Ahmed, S.; Rahman, O. A Survey of methods for managing the classification and solution of data imbalance Problem. J. Comput. Sci. 2020, 16, 1546–1557. [Google Scholar] [CrossRef]
- Pereira, R.M.; Costa, Y.M.G.; Silla, C.N., Jr. MLTL: A multi-label approach for the Tomek Link undersampling algorithm. Neurocomputing 2020, 383, 95–105. [Google Scholar] [CrossRef]
- Sawangarreerak, S.; Thanathamathee, P. Random Forest with sampling techniques for handling imbalanced prediction of university student depression. Informations 2020, 11, 519. [Google Scholar] [CrossRef]
- Tusneem, E.; Aljourf, M.; Al-Mohanna, F.; Mohamed, S. Classification of imbalance data using Tomek link (T-link) combined with random under-sampling (RUS) as a data reduction method. Glob. J. Technol. Optim. 2021, 1, 1–12. [Google Scholar]
- Bekkar, M.; Djemaa, H.K.; Alitouche, T.A. Evaluation measures for models assessment over imbalanced data sets. J. Inf. Eng. Appl. 2013, 3, 27–38. [Google Scholar]
- Swana, E.F.; Doorsamy, W. Investigation of combined electrical modalities for fault diagnosis on a wound-rotor induction generator. IEEE Access 2019, 7, 32333–32342. [Google Scholar] [CrossRef]


| Description | Class | Case 1 | Case 2 | Case 3 | Case 4 | Case 5 | Case 6 |
|---|---|---|---|---|---|---|---|
| Healthy | 0 | 30 | 30 | 30 | 30 | 30 | 30 |
| Brush | 1 | 30 | 18 | 12 | 9 | 6 | 24 |
| Inter-turn short stator—3 | 2 | 30 | 15 | 9 | 7 | 6 | 18 |
| Inter-turn short stator—6 | 3 | 30 | 9 | 6 | 6 | 6 | 9 |
| Inter-turn short rotor—3 | 4 | 30 | 9 | 8 | 7 | 6 | 18 |
| Inter-turn short rotor—6 | 5 | 30 | 7 | 6 | 6 | 6 | 6 |
Publisher’s Note: MDPI stays neutral with regard to jurisdictional claims in published maps and institutional affiliations. |
© 2022 by the authors. Licensee MDPI, Basel, Switzerland. This article is an open access article distributed under the terms and conditions of the Creative Commons Attribution (CC BY) license (https://creativecommons.org/licenses/by/4.0/).
Share and Cite
Swana, E.F.; Doorsamy, W.; Bokoro, P. Tomek Link and SMOTE Approaches for Machine Fault Classification with an Imbalanced Dataset. Sensors 2022, 22, 3246. https://doi.org/10.3390/s22093246
Swana EF, Doorsamy W, Bokoro P. Tomek Link and SMOTE Approaches for Machine Fault Classification with an Imbalanced Dataset. Sensors. 2022; 22(9):3246. https://doi.org/10.3390/s22093246
Chicago/Turabian StyleSwana, Elsie Fezeka, Wesley Doorsamy, and Pitshou Bokoro. 2022. "Tomek Link and SMOTE Approaches for Machine Fault Classification with an Imbalanced Dataset" Sensors 22, no. 9: 3246. https://doi.org/10.3390/s22093246
APA StyleSwana, E. F., Doorsamy, W., & Bokoro, P. (2022). Tomek Link and SMOTE Approaches for Machine Fault Classification with an Imbalanced Dataset. Sensors, 22(9), 3246. https://doi.org/10.3390/s22093246