
A Snapshot Imaging Spectrometer Based on Uniformly Distributed-Slit Array (UDA)

 ,
,
Abstract
:1. Introduction
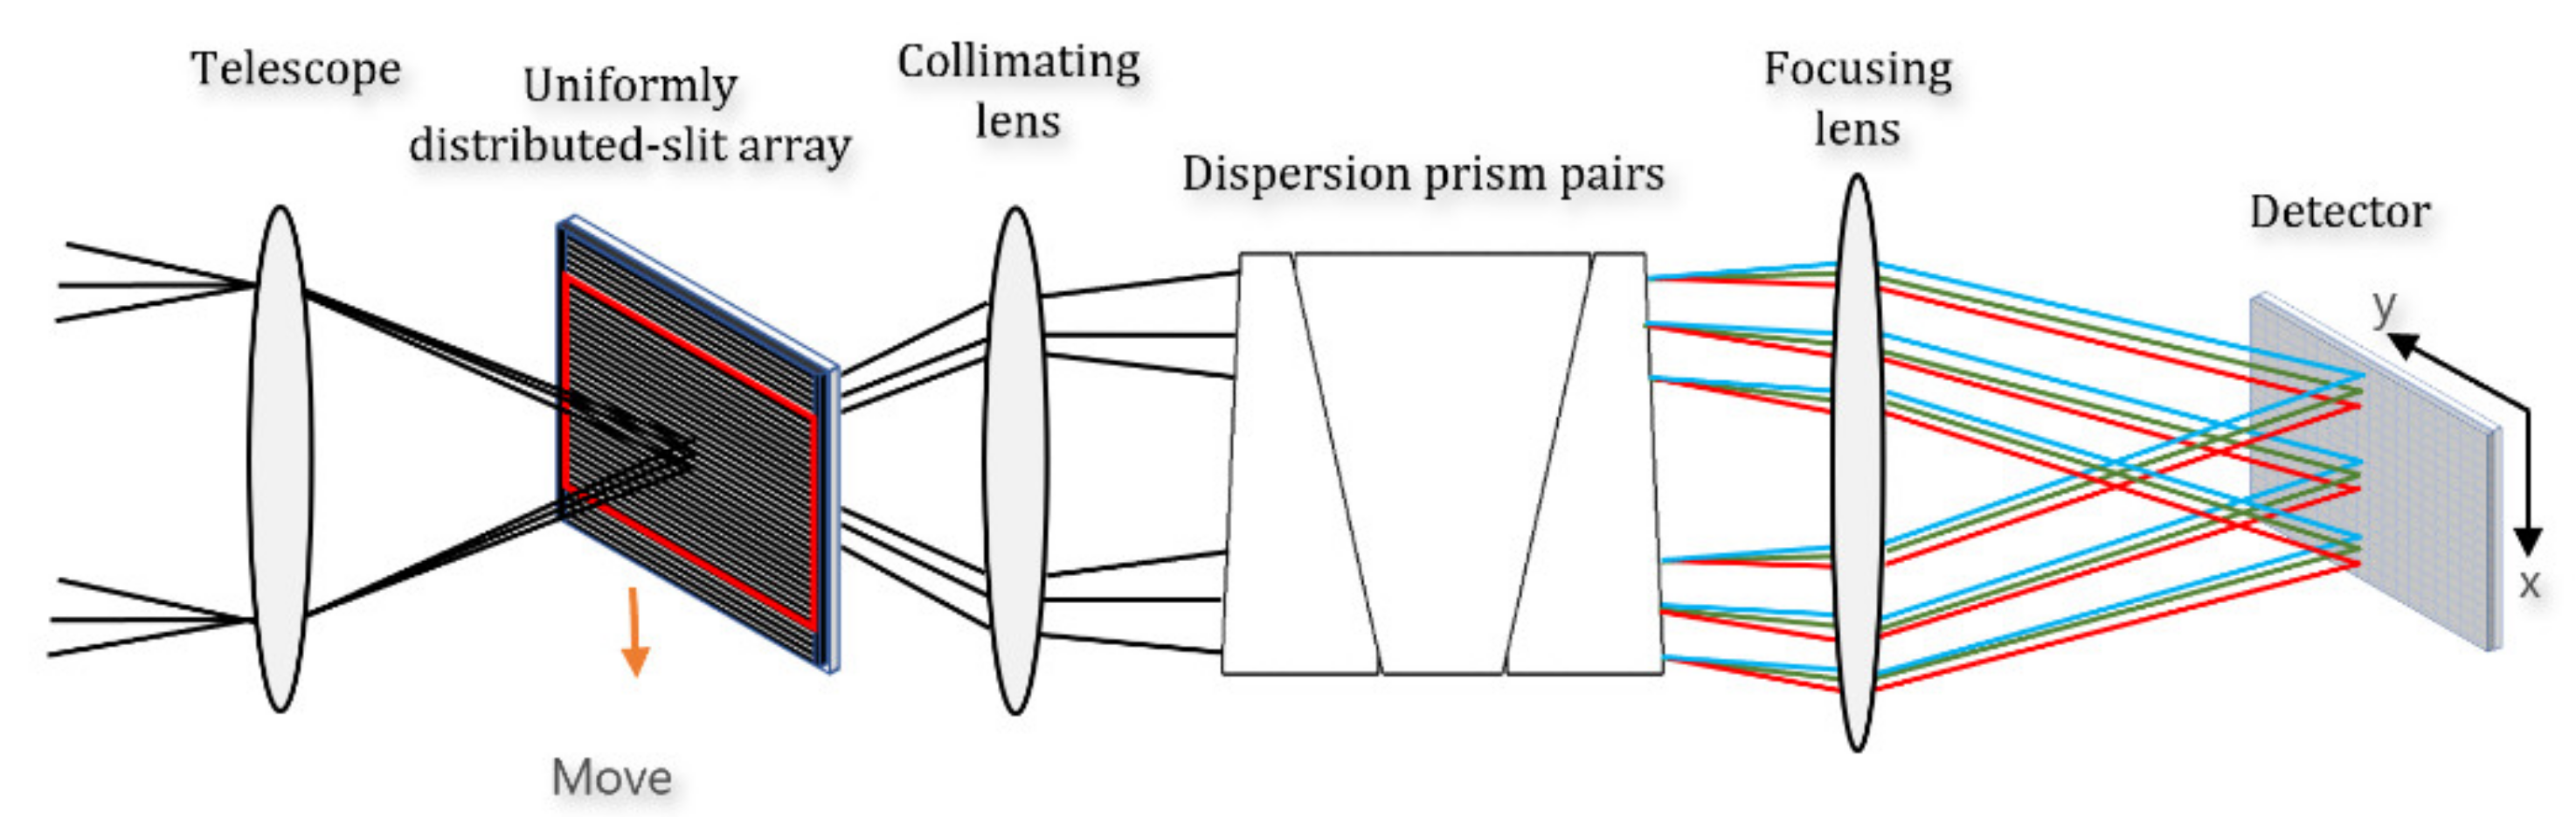
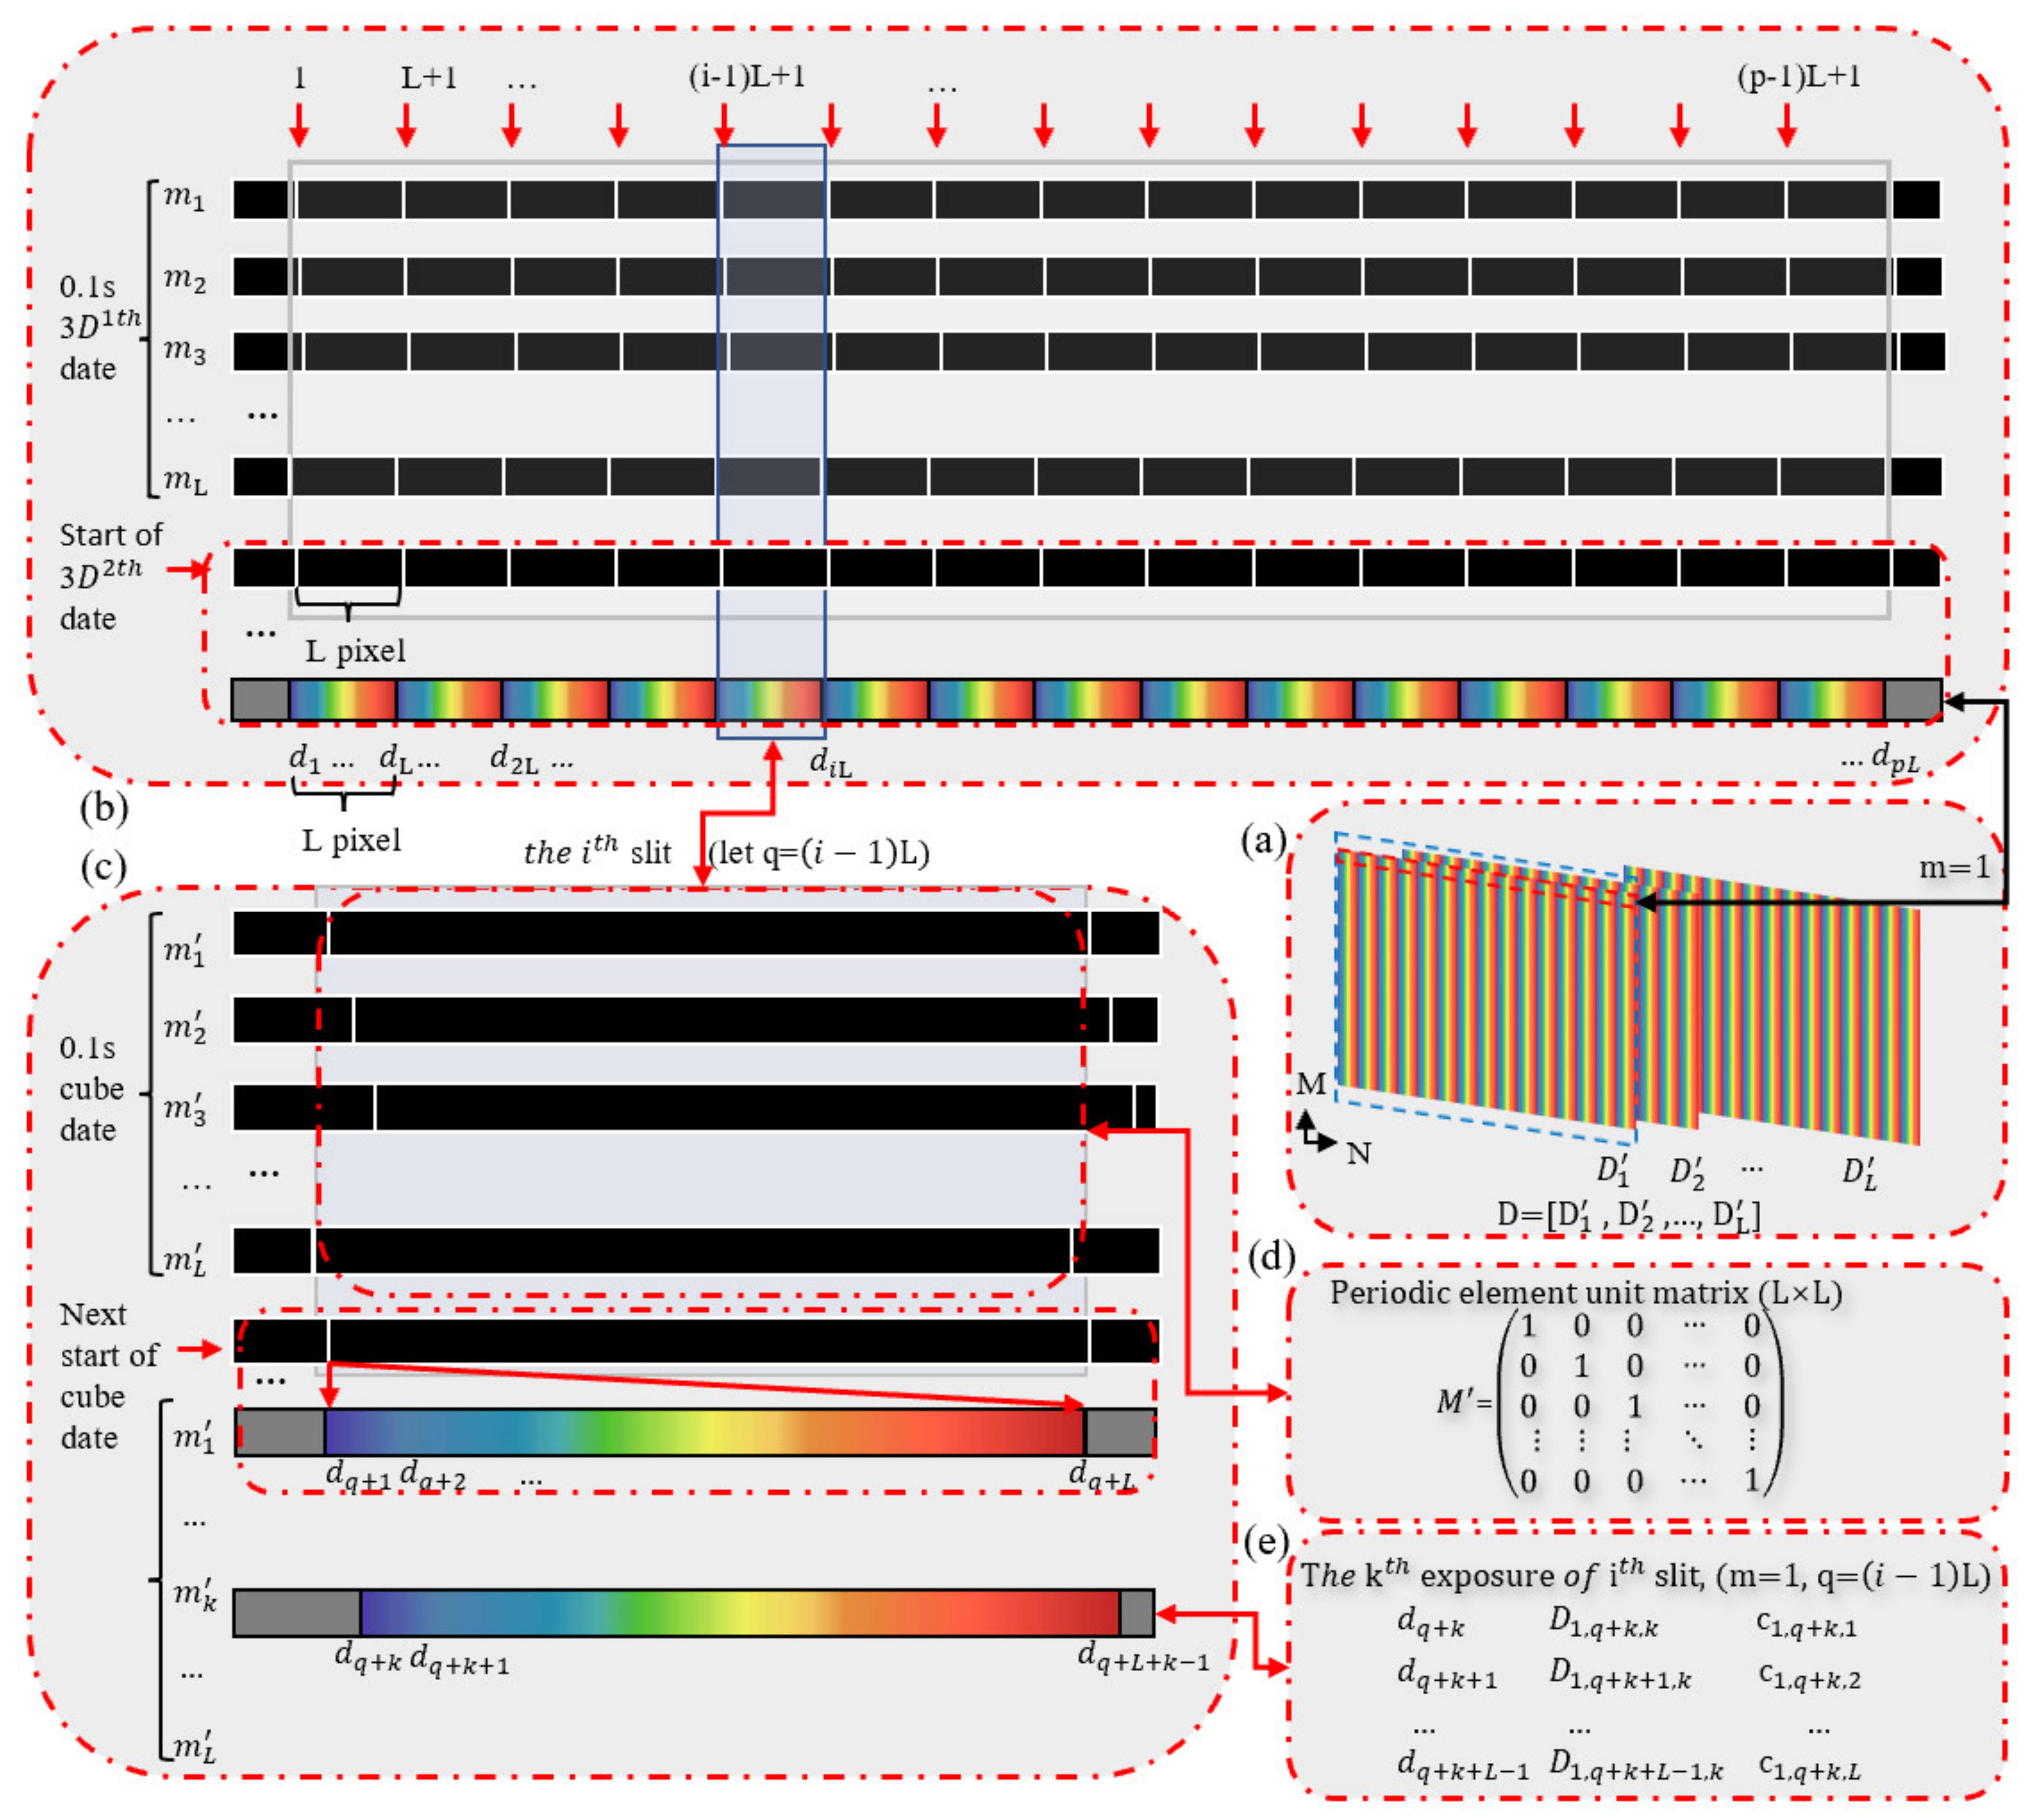
2. Principles
System Model
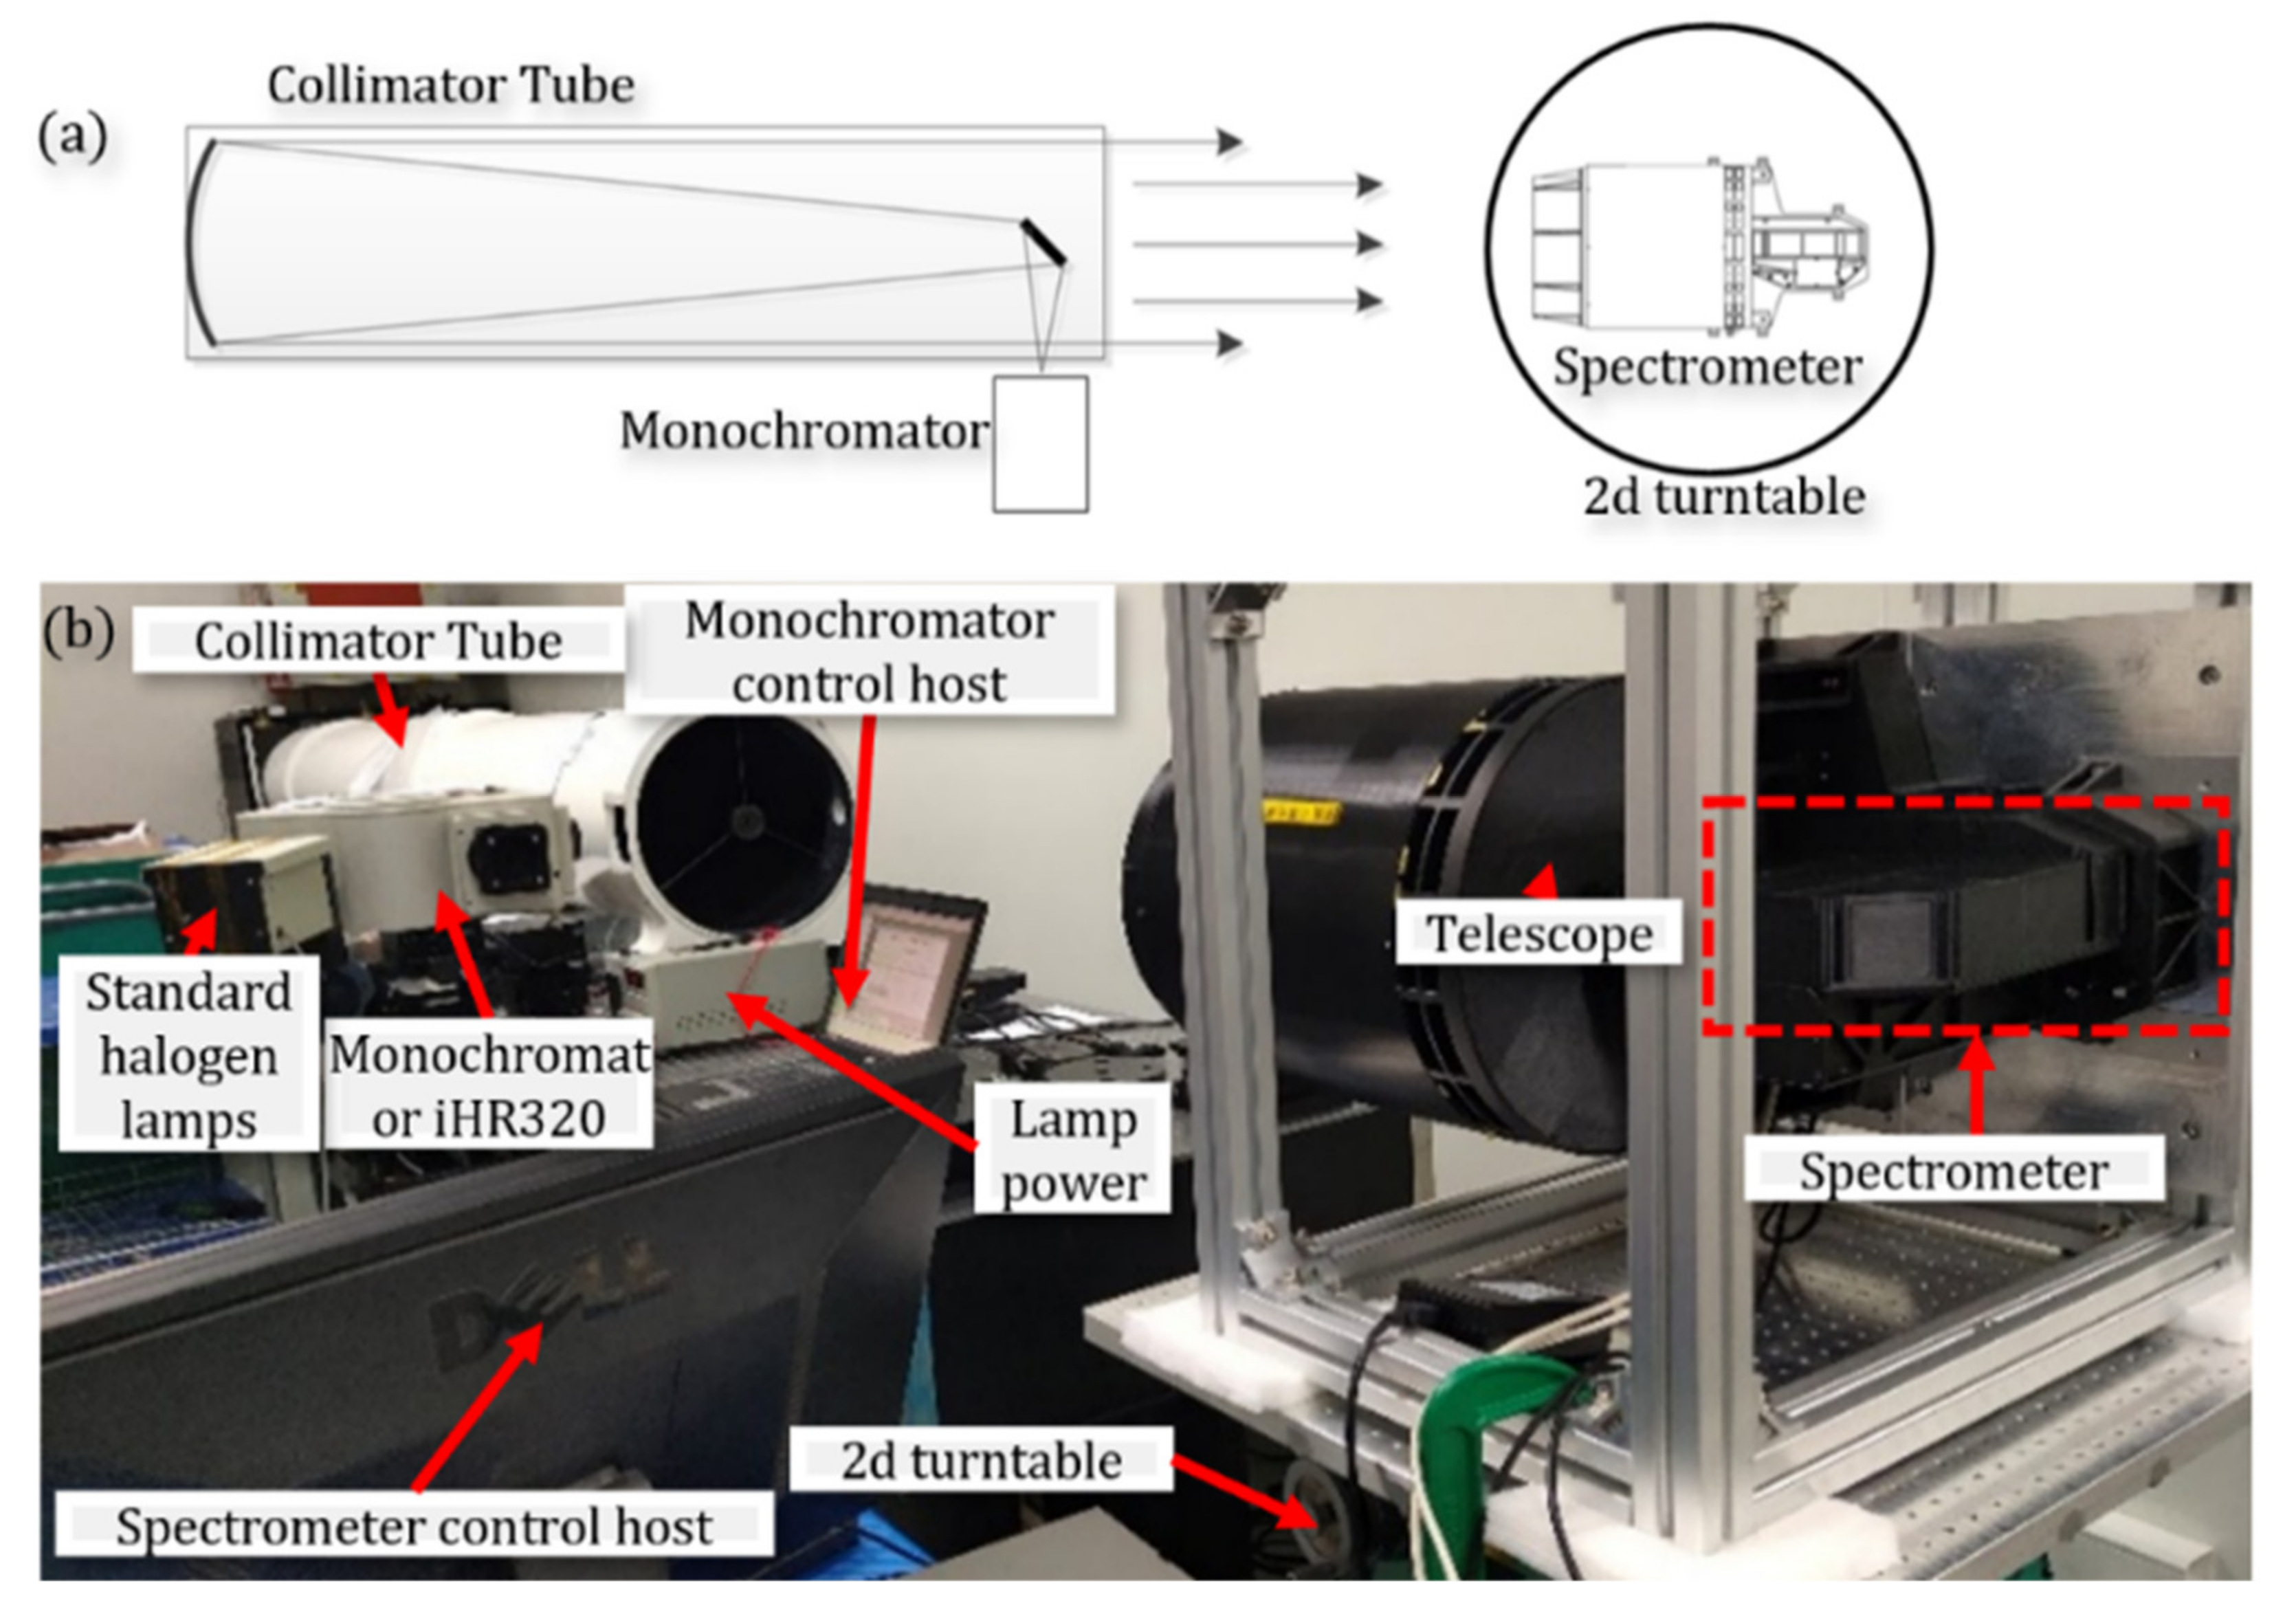
3. System Design and Calibration
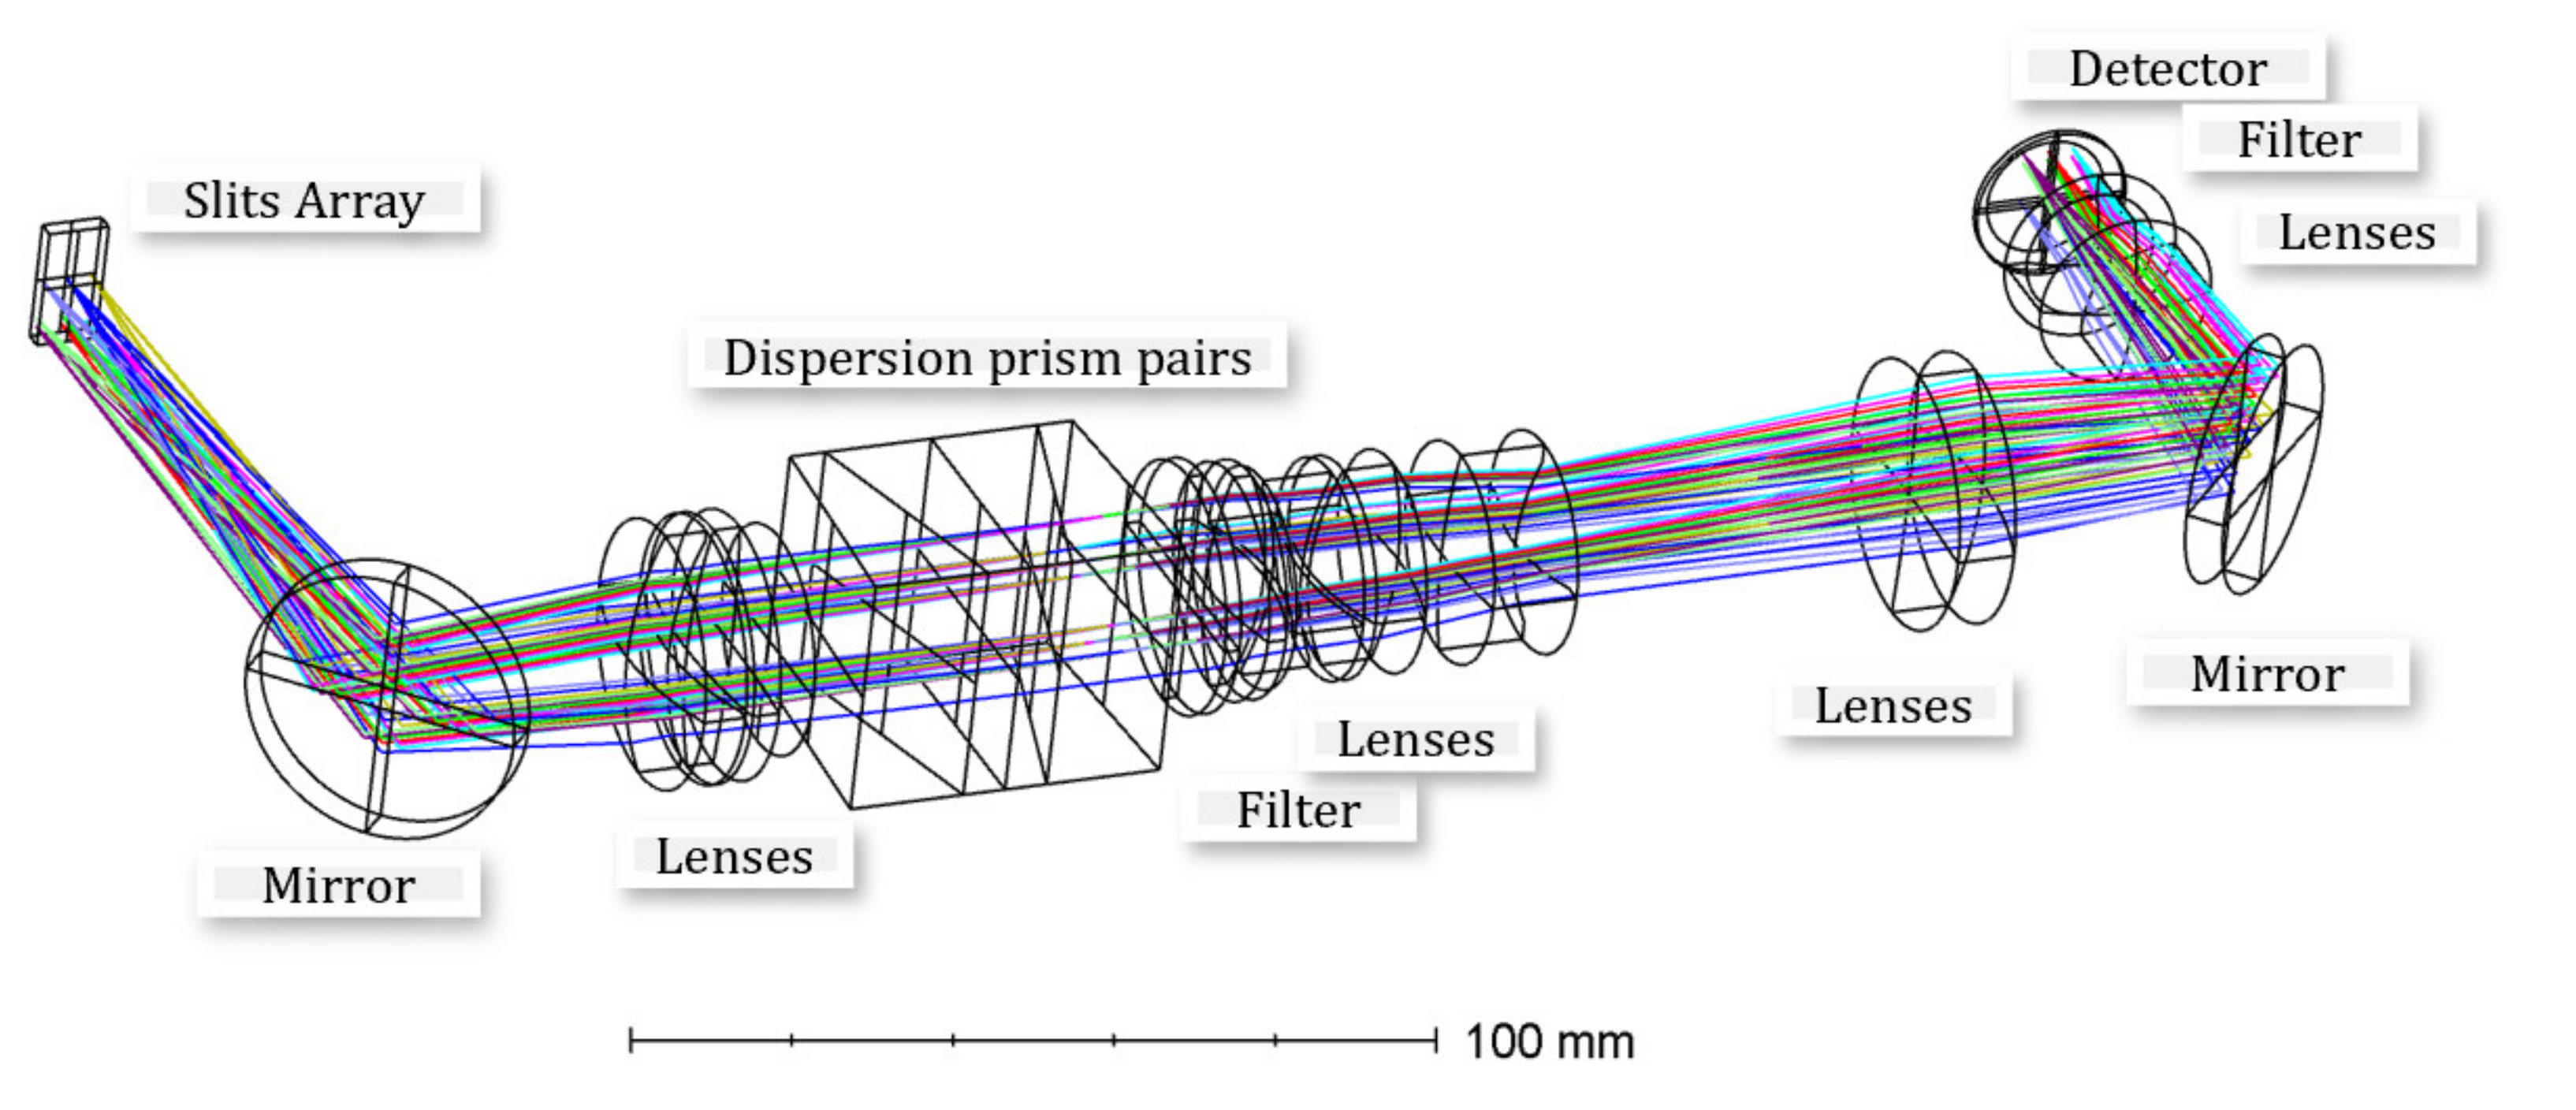
3.1. Optical System Design
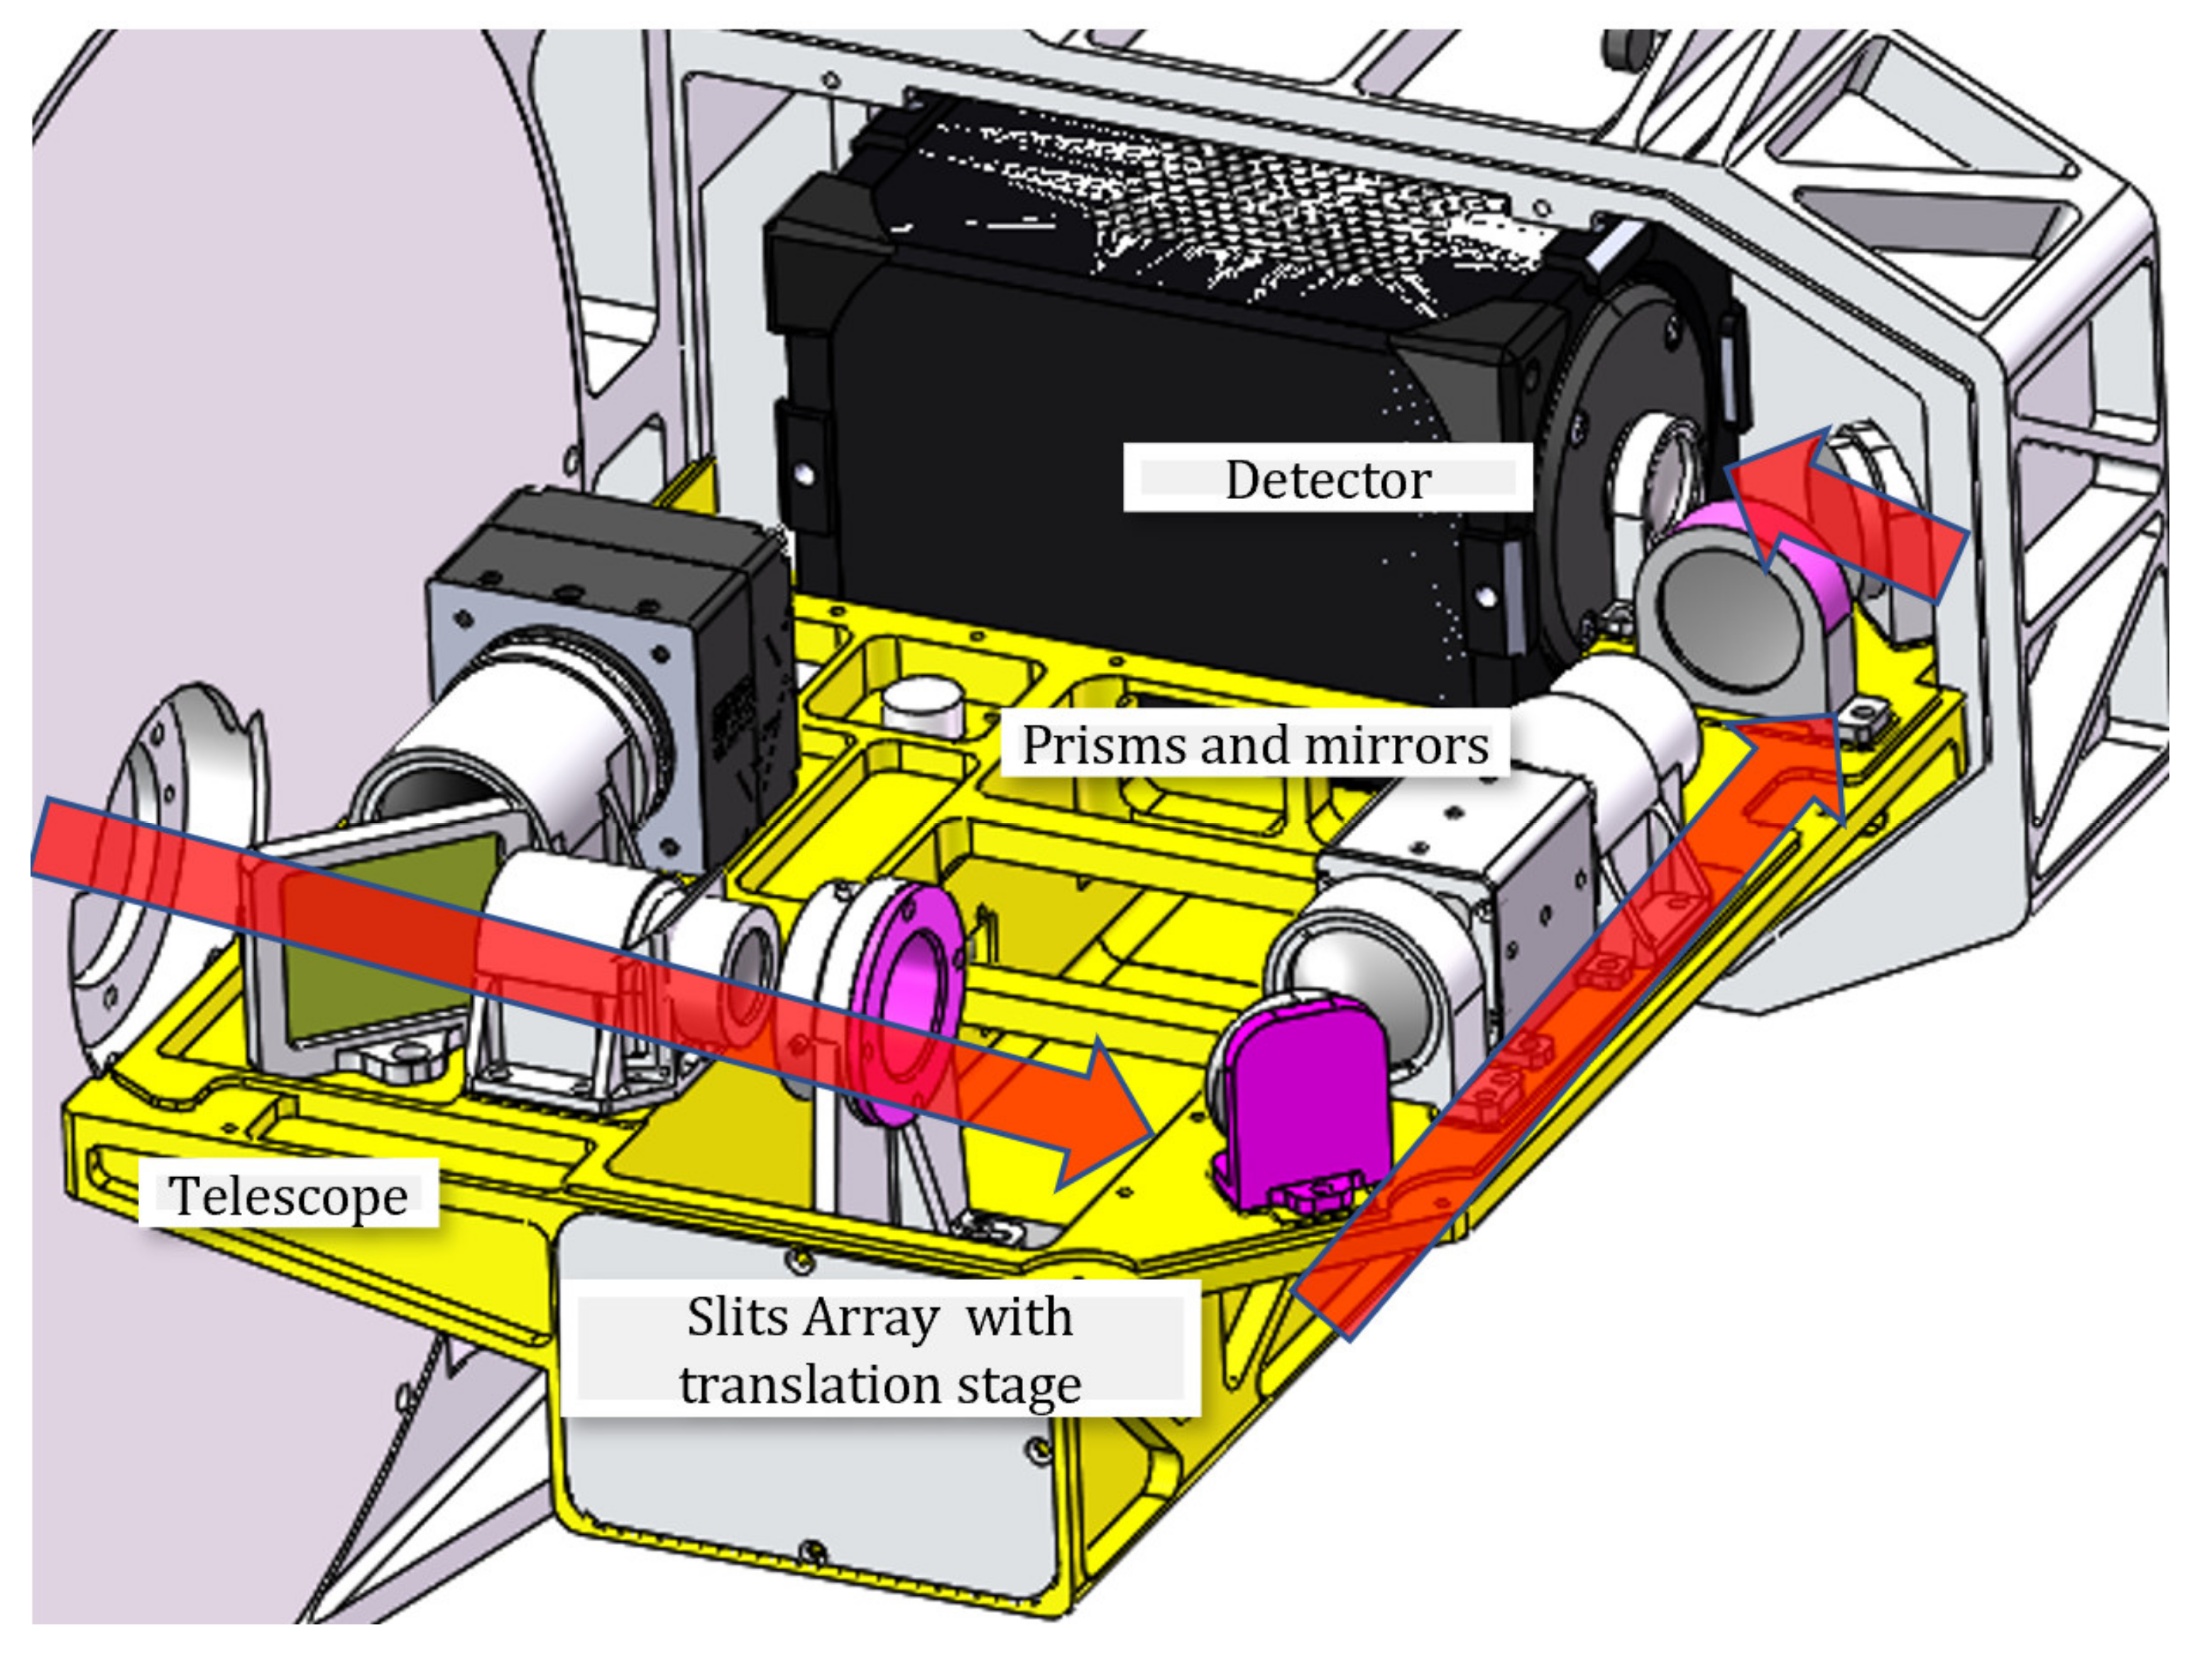
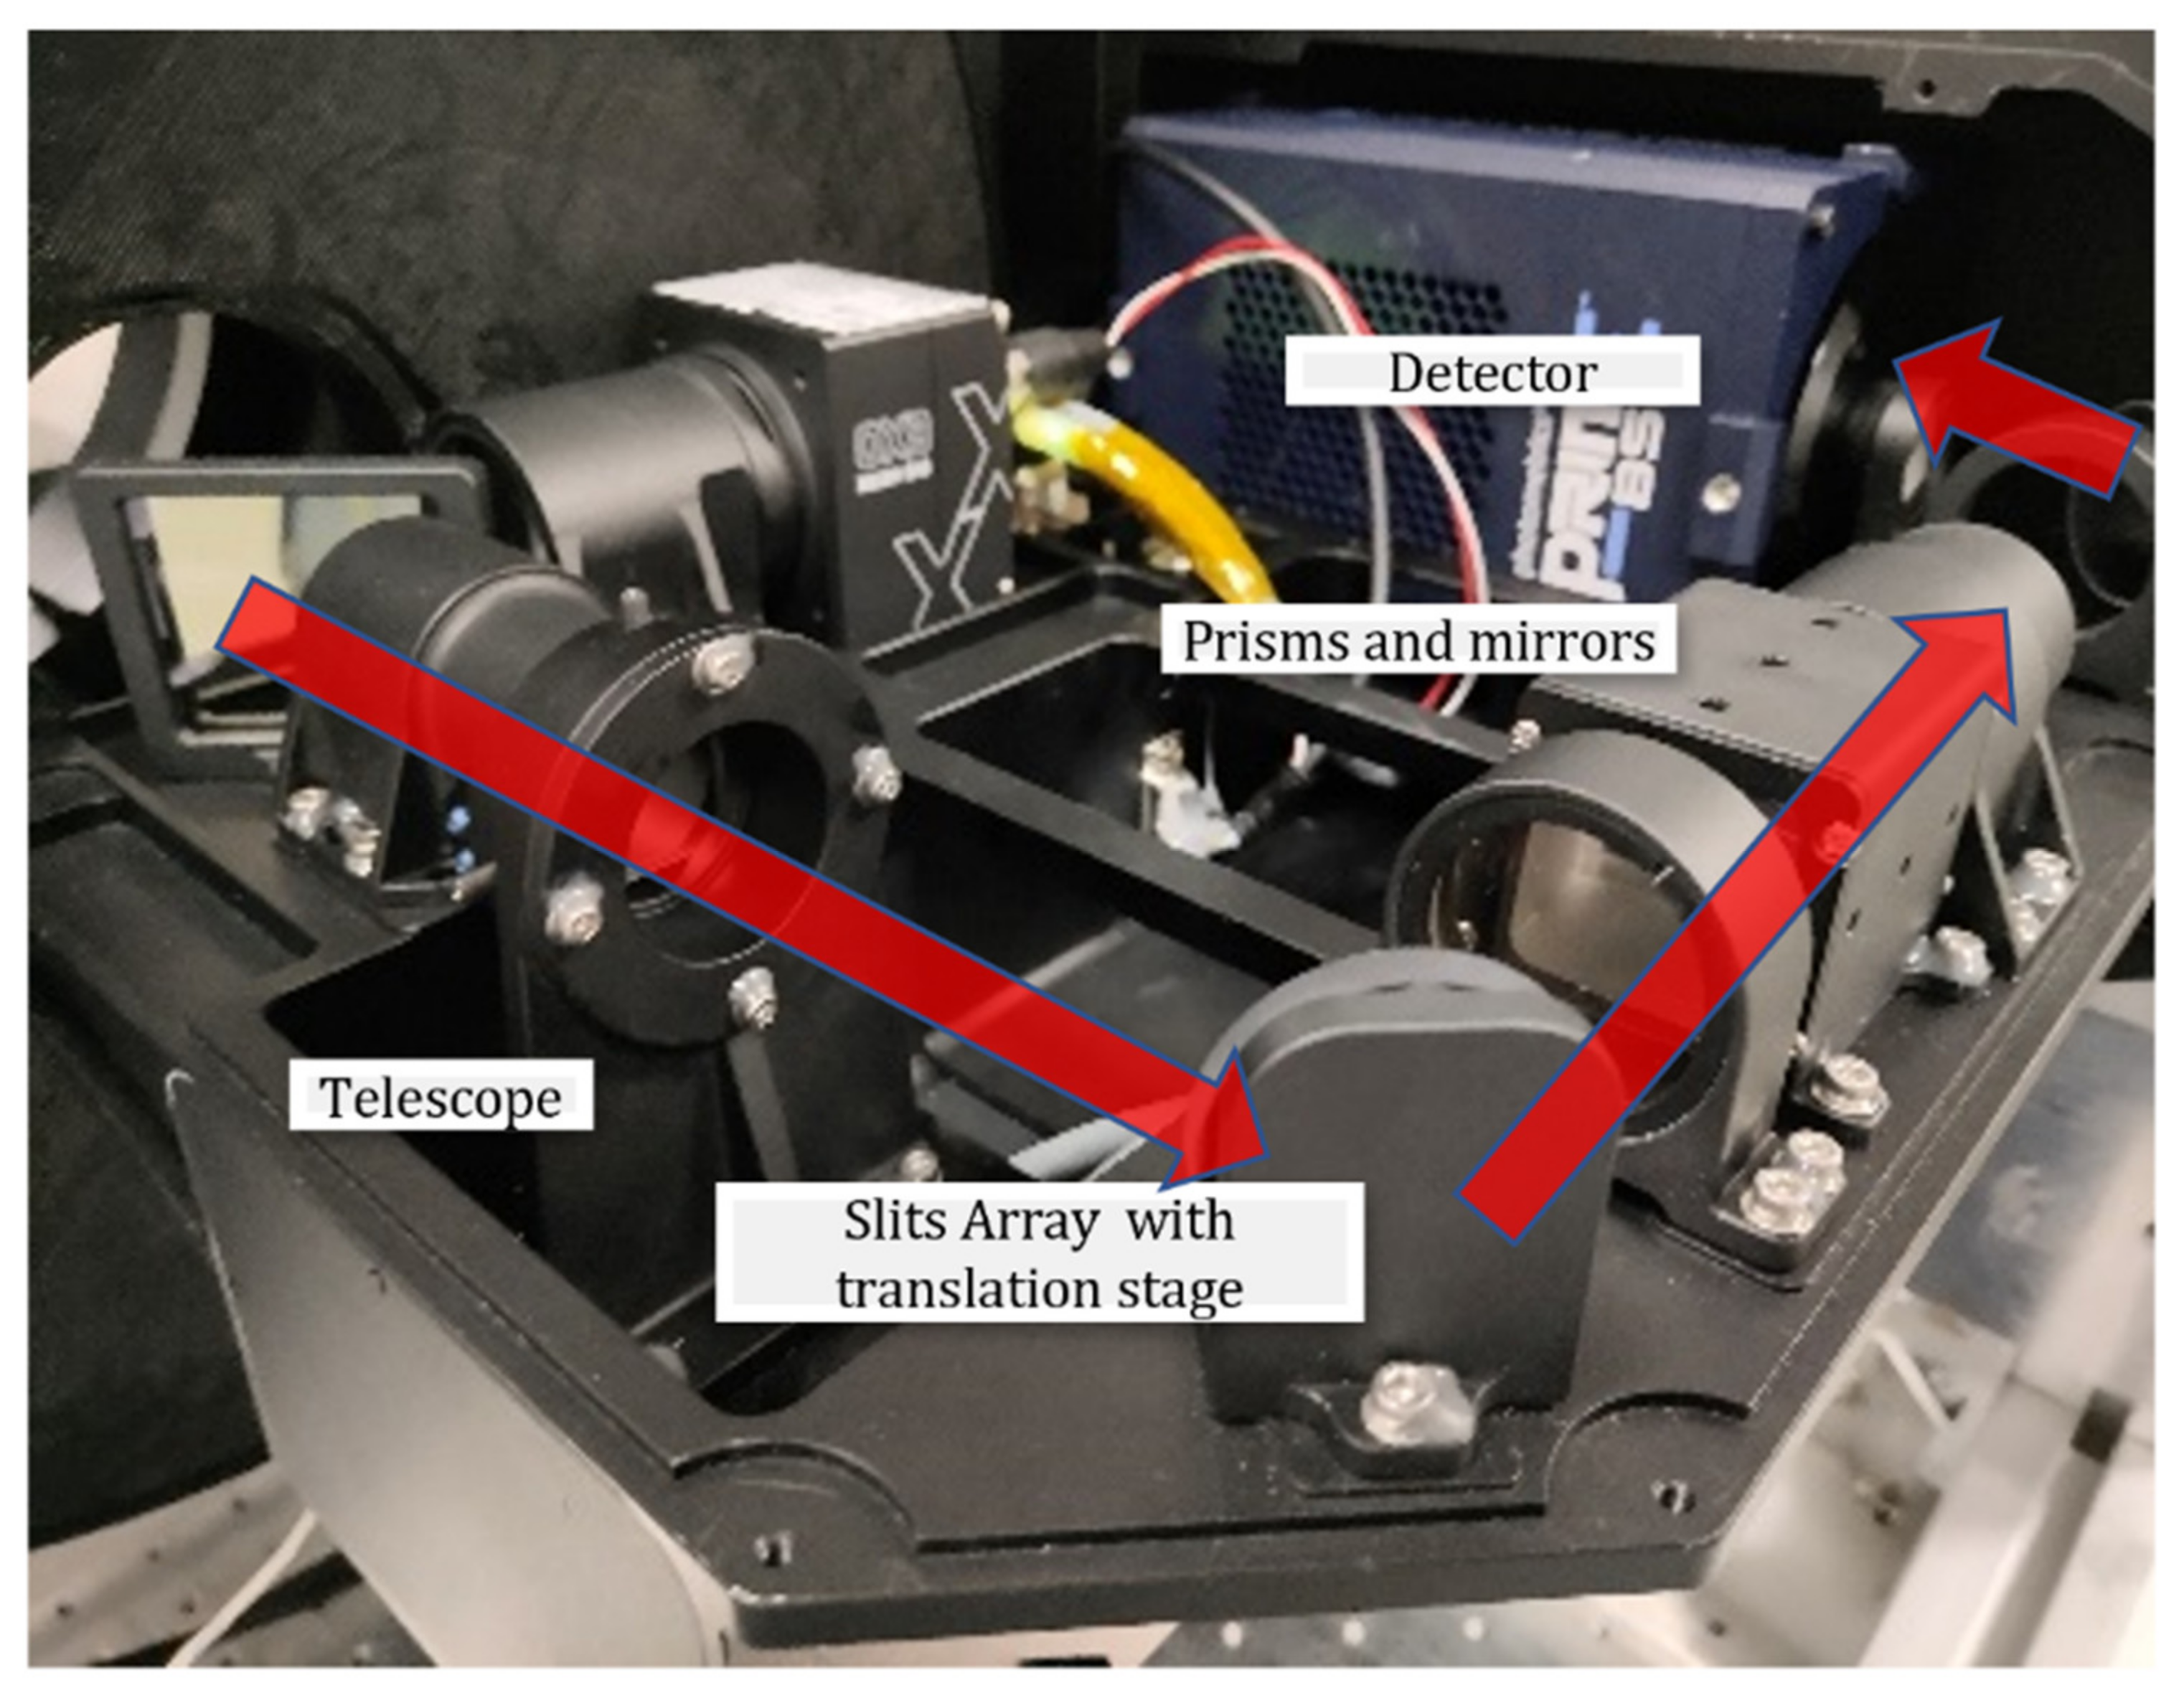
3.2. System Structure Design
3.3. System Design
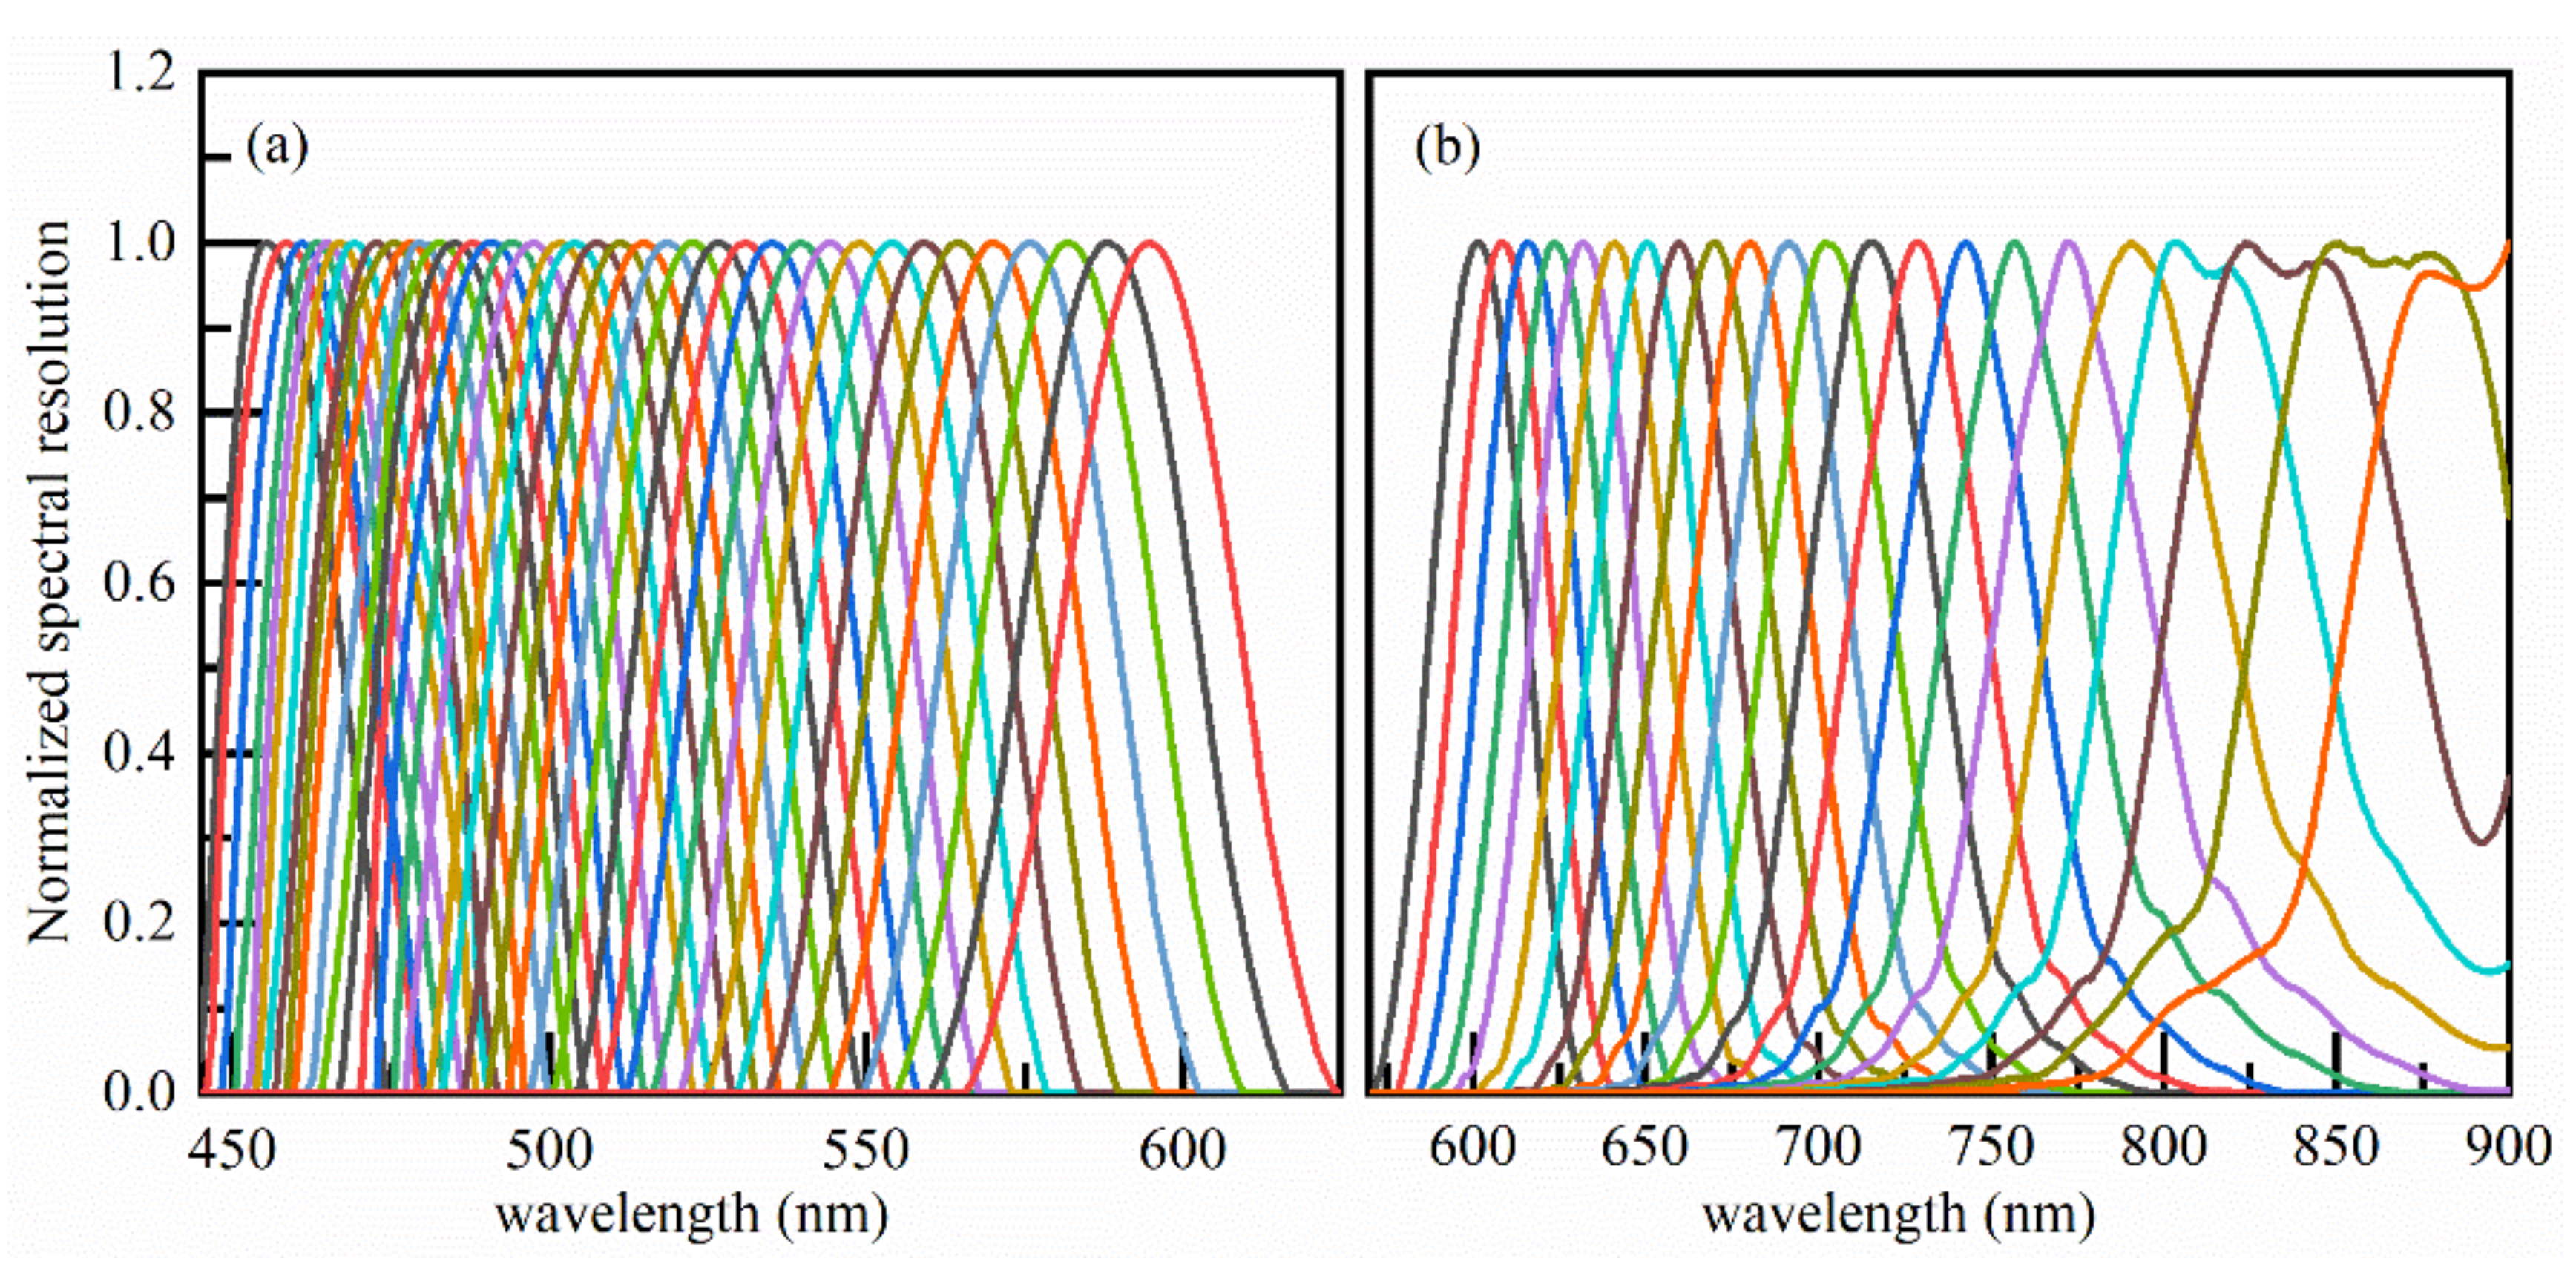
3.4. Spectral Resolution
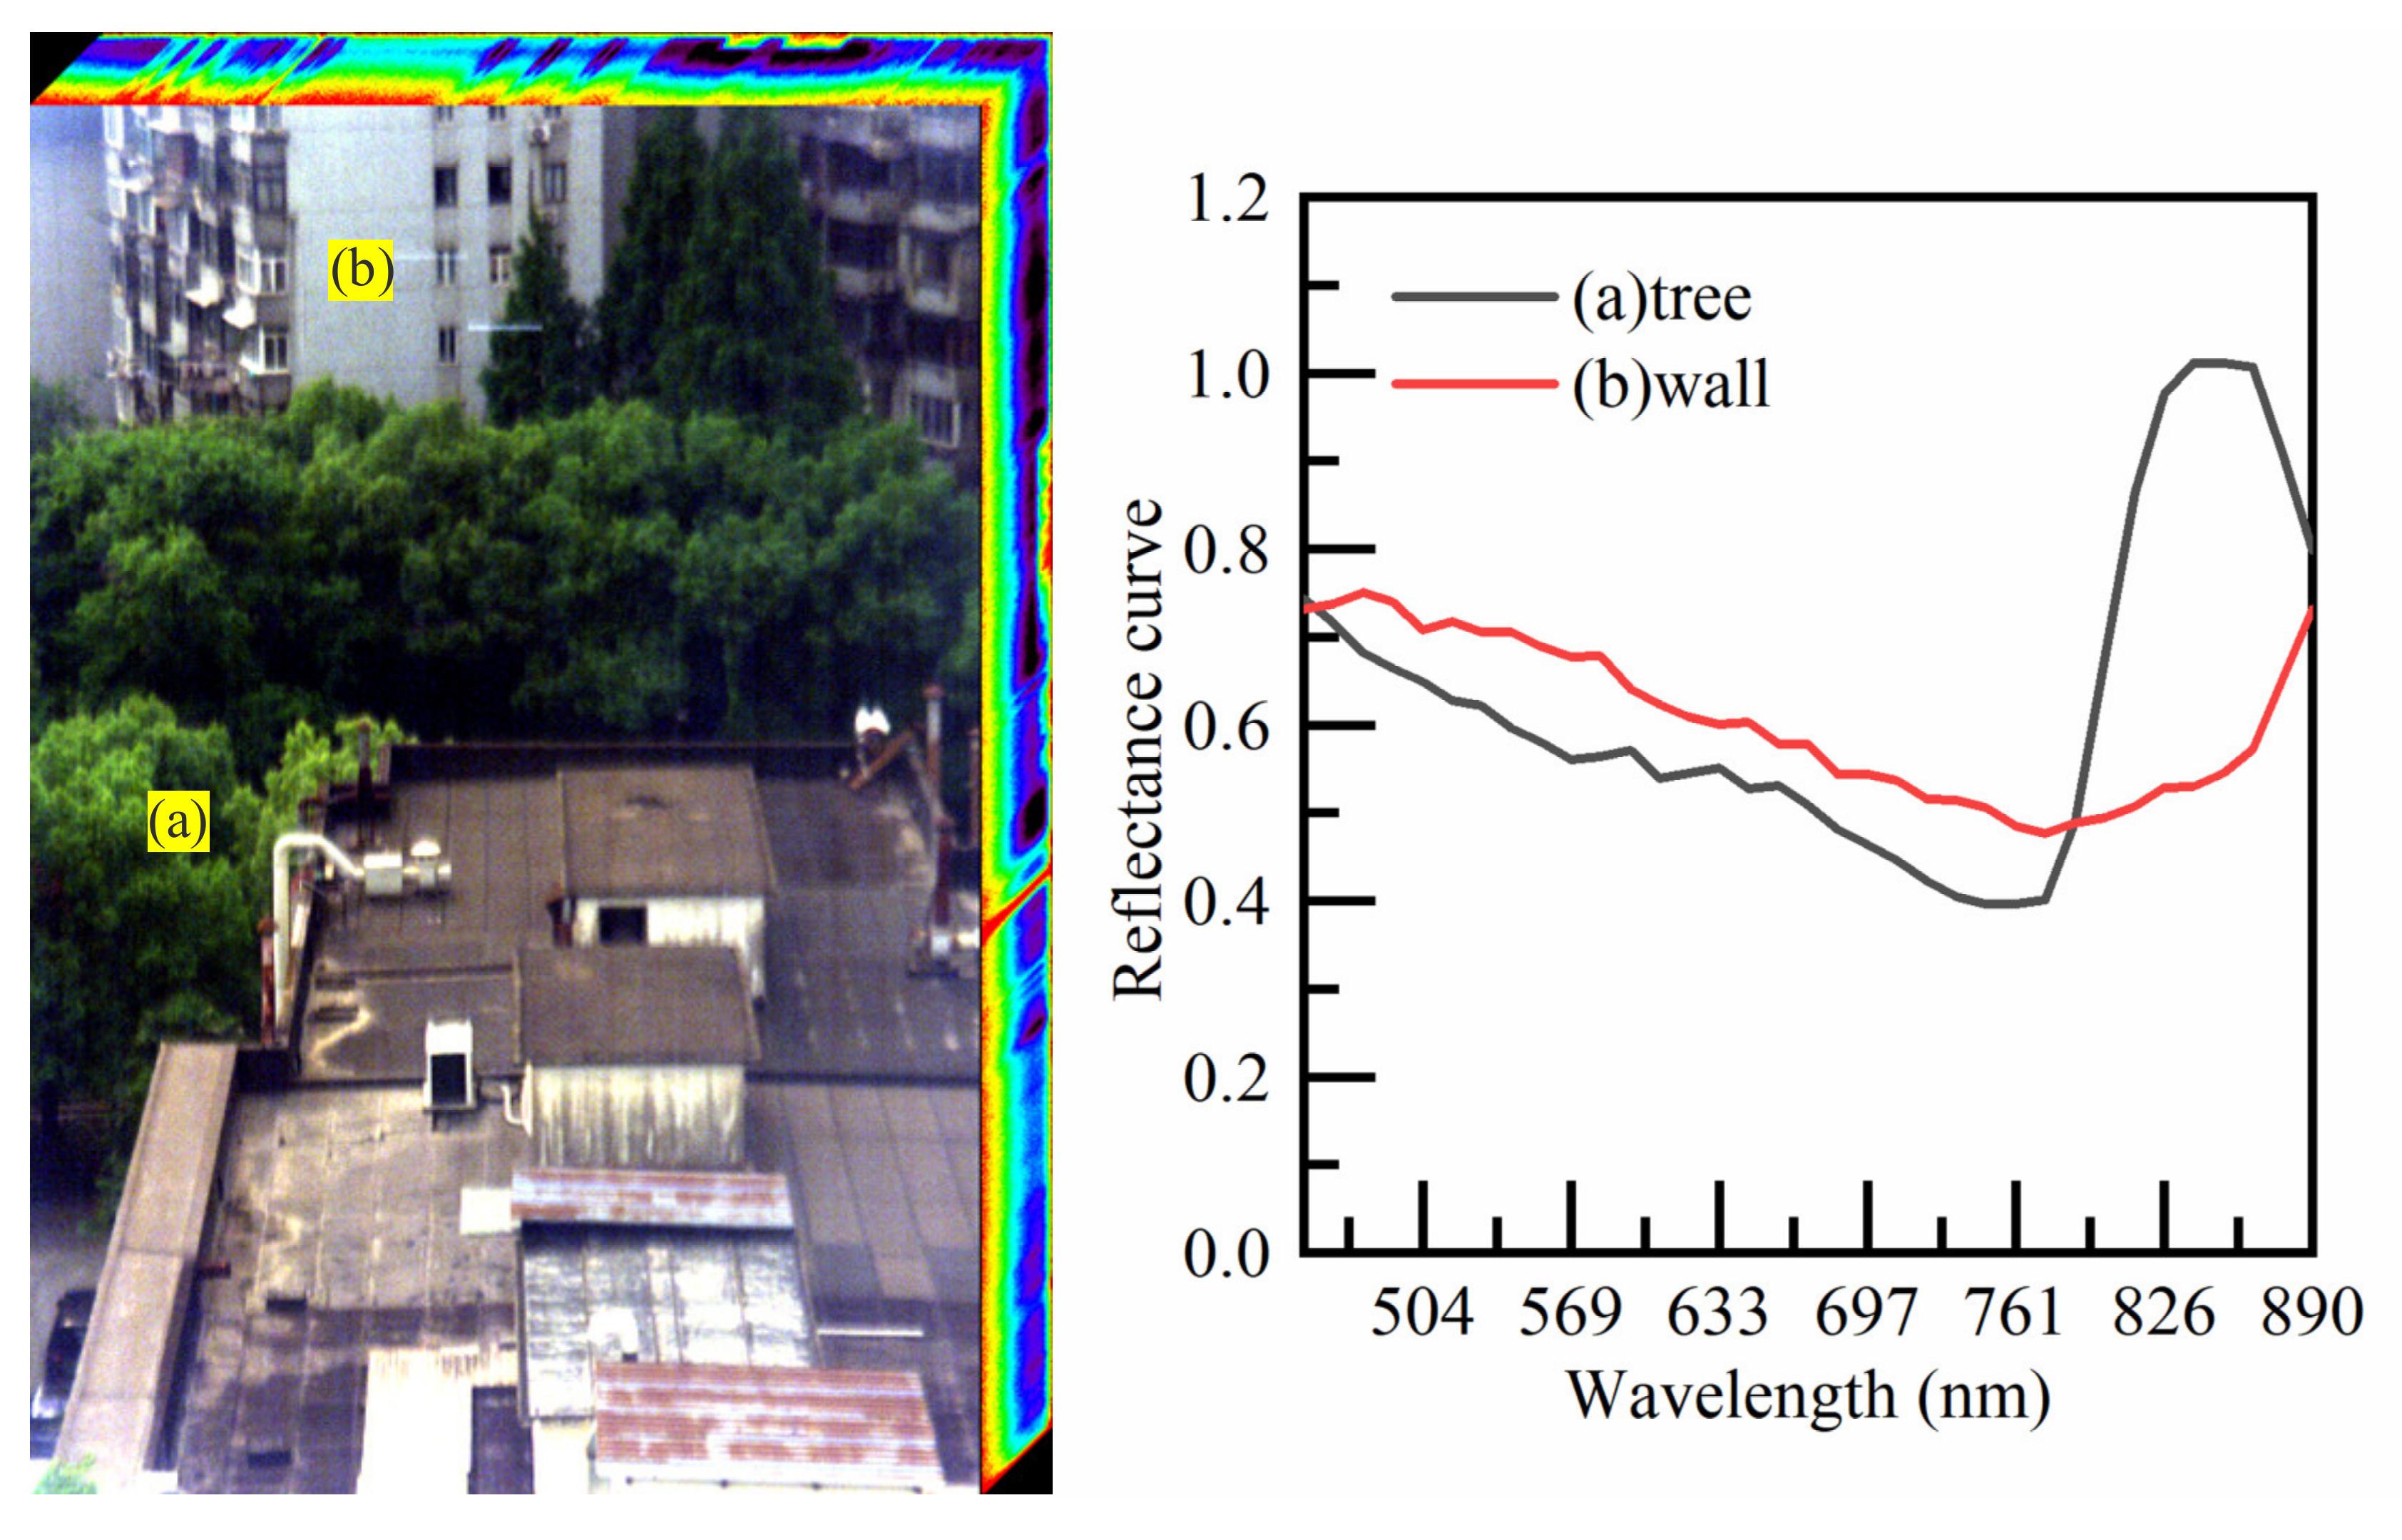
4. Results
5. Conclusions
Author Contributions
Funding
Institutional Review Board Statement
Informed Consent Statement
Data Availability Statement
Conflicts of Interest
References
- Thenkabail, P.S.; Smith, R.B.; Pauw, E.D. Hyperspectral vegetation indices and their relationships with agricultural crop characteristics. Remote Sens. Environ. 2000, 71, 158–182. [Google Scholar] [CrossRef]
- Song, S.; Gibson, D.; Ahmadzadeh, S.; Chu, H.O.; Warden, B.; Overend, R.; Macfarlane, F.; Murray, P.; Marshall, S.; Aitkenhead, M.; et al. Low-cost hyper-spectral imaging system using a linear variable bandpass filter for agritech applications. Appl. Opt. 2020, 59, A167–A175. [Google Scholar] [CrossRef] [PubMed]
- Sabins, F.F. Remote sensing for mineral exploration. Ore Geol. Rev. 1999, 14, 157–183. [Google Scholar] [CrossRef]
- Fossum, E.R.; Hondongwa, D.B. A Review of the Pinned Photodiode for CCD and CMOS Image Sensors. IEEE J. Electron Devices Soc. 2014, 2, 33–43. [Google Scholar] [CrossRef]
- Tiwari, A.; Talwekar, R.H. Journey of Visual Prosthesis with Progressive Development of Electrode Design Techniques and Experience with CMOS Image Sensors: A Review. IETE J. Res. 2019, 65, 172–200. [Google Scholar] [CrossRef]
- Gao, L.; Kester, R.T.; Hagen, N.; Tkaczyk, T.S. Snapshot Image Mapping Spectrometer (IMS) with high sampling density for hyperspectral microscopy. Opt. Express 2010, 18, 14330–14344. [Google Scholar] [CrossRef]
- Abramov, A.; Minai, L.; Yelin, D. Spectrally encoded spectral imaging. Opt. Express 2011, 19, 6913–6922. [Google Scholar] [CrossRef]
- Hagen, N.; Kudenov, M.W. Review of snapshot spectral imaging technologies. Opt. Eng. 2013, 52, 090901. [Google Scholar] [CrossRef] [Green Version]
- Maione, B.D.; Luo, D.; Miskiewicz, M.; Escuti, M.; Kudenov, M.W. Spatially heterodyned snapshot imaging spectrometer. Appl. Opt. 2016, 55, 8667–8675. [Google Scholar] [CrossRef]
- Monakhova, K.; Yanny, K.; Aggarwal, N.; Waller, L. Spectral DiffuserCam: Lensless snapshot hyperspectral imaging with a spectral filter array. Optica 2020, 7, 1298–1307. [Google Scholar] [CrossRef]
- Xie, Y.; Liu, C.; Liu, S.; Song, W.; Fan, X. Snapshot Imaging Spectrometer Based on Pixel-Level Filter Array (PFA). Sensors 2021, 21, 2289. [Google Scholar] [CrossRef] [PubMed]
- Descour, M.; Dereniak, E. Computed-tomography imaging spectrometer: Experimental calibration and reconstruction results. Appl. Opt. 1995, 34, 4817–4826. [Google Scholar] [CrossRef] [PubMed]
- Hagen, N.; Dereniak, E.L. Analysis of computed tomographic imaging spectrometers. I. Spatial and spectral resolution. Appl. Opt. 2008, 47, F85–F95. [Google Scholar] [CrossRef]
- Zhou, P.; Jin, S.; Dong, C.; Li, N. Development of a blurred spectral images restoration technology for CTIS imaging spectrometer. Opt. Express 2016, 24, 4881–4889. [Google Scholar] [CrossRef] [PubMed] [Green Version]
- Kudenov, M.W.; Dereniak, E.L. Compact snapshot birefringent imaging Fourier transform spectrometer. Proc. SPIE 2010, 7812, 781206. [Google Scholar]
- Kudenov, M.W.; Dereniak, E.L. Compact real-time birefringent imaging spectrometer. Opt. Express 2012, 20, 17973–17986. [Google Scholar] [CrossRef]
- Zhang, Y.; Zhu, S.; Lin, J.; Jin, P. High-quality panchromatic image acquisition method for snapshot hyperspectral imaging Fourier transform spectrometer. Opt. Express 2019, 27, 28915–28928. [Google Scholar] [CrossRef]
- Wagadarikar, A.; John, R.; Willett, R.; Brady, D. Single disperser design for coded aperture snapshot spectral imaging. Appl. Opt. 2008, 47, B44–B51. [Google Scholar] [CrossRef] [Green Version]
- Kittle, D.; Choi, K.; Wagadarikar, A.; Brady, D.J. Multiframe image estimation for coded aperture snapshot spectral imagers. Appl. Opt. 2010, 49, 6824–6833. [Google Scholar] [CrossRef]
- Wang, L.; Zhang, T.; Fu, Y.; Huang, H. HyperReconNet: Joint Coded Aperture Optimization and Image Reconstruction for Compressive Hyperspectral Imaging. IEEE Trans. Image Process 2018, 29, 2257–2270. [Google Scholar] [CrossRef]
- Xu, Y.; Li, C.; Liu, S.; Tang, G.; Xie, J.; Wang, J. Simulation and Verification of Uniformly Distributed-slit Array Coded Spectral Imaging System. Semicond. Optoelectron. 2021, 42, 562–567. [Google Scholar]
- Tang, G.; Wang, Z.; Liu, S.; Li, C.; Wang, J. Real-Time Hyperspectral Video Acquisition with Coded Slits. Sensors 2022, 22, 822. [Google Scholar] [CrossRef] [PubMed]
- Horn, B.K.P.; Schunck, B.G. Determining optical flow. Artif. Intell. 1981, 17, 185–203. [Google Scholar] [CrossRef] [Green Version]


| Slit Position | Wavelength | Normalized Spatial Dimensional Field of View (mm) | Smile (mm) | ||
|---|---|---|---|---|---|
| 0 Field | 0.5 Field | 1 Field | |||
| Top edge | 450 nm | −3.05374 | −3.05260 | −3.05018 | 0.00356 |
| 550 nm | −2.86561 | −2.86467 | −2.86270 | 0.00291 | |
| 650 nm | −2.77142 | −2.77047 | −2.76858 | 0.00284 | |
| 750 nm | −2.71687 | −2.71593 | −2.71409 | 0.00278 | |
| 850 nm | −2.68176 | −2.68085 | −2.67909 | 0.00267 | |
| Center | 450 nm | 0.35344 | 0.35482 | 0.35694 | 0.00350 |
| 550 nm | 0.54427 | 0.54546 | 0.54776 | 0.00349 | |
| 650 nm | 0.64050 | 0.64160 | 0.64400 | 0.00350 | |
| 750 nm | 0.69618 | 0.69723 | 0.69968 | 0.00350 | |
| 850 nm | 0.73177 | 0.73278 | 0.73527 | 0.00350 | |
| Bottom edge | 450 nm | 3.76257 | 3.76304 | 3.76552 | 0.00295 |
| 550 nm | 3.95619 | 3.95695 | 3.96028 | 0.00409 | |
| 650 nm | 4.05450 | 4.05531 | 4.05894 | 0.00444 | |
| 750 nm | 4.11136 | 4.11220 | 4.11600 | 0.00464 | |
| 850 nm | 4.14745 | 4.14834 | 4.15231 | 0.00486 | |
| Parameters | Spectrometer Components | Notes |
|---|---|---|
| Spectral range | 450~900 nm | |
| Spectrometer magnification | ×1 | |
| Detector cells | 1024 × 1024 (13 μm × 13 μm) | 2048 × 2048 (6.5 μm × 6.5 μm) |
| Spectral sampling | ≥20 nm | |
| RMS radius of spot | ≤6 μm | |
| Smile | <5 μm | |
| Modulation Transfer Function | >0.1 | |
| SNR | 46.9 dB | Spectral channel mean |
| Spectral Channels | Central Wavelength (nm) | Spectral Average Resolution (nm) |
|---|---|---|
| 1~19 | 456.5~505.3 | 7.06 |
| 20~38 | 508.7~597.2 | 9.76 |
| 39~60 | 604.3~890.7 | 35.91 |
Publisher’s Note: MDPI stays neutral with regard to jurisdictional claims in published maps and institutional affiliations. |
© 2022 by the authors. Licensee MDPI, Basel, Switzerland. This article is an open access article distributed under the terms and conditions of the Creative Commons Attribution (CC BY) license (https://creativecommons.org/licenses/by/4.0/).
Share and Cite
Xu, Y.; Li, C.; Liu, S.; Tang, G.; Xie, J.; Wang, J. A Snapshot Imaging Spectrometer Based on Uniformly Distributed-Slit Array (UDA). Sensors 2022, 22, 3206. https://doi.org/10.3390/s22093206
Xu Y, Li C, Liu S, Tang G, Xie J, Wang J. A Snapshot Imaging Spectrometer Based on Uniformly Distributed-Slit Array (UDA). Sensors. 2022; 22(9):3206. https://doi.org/10.3390/s22093206
Chicago/Turabian StyleXu, Yan, Chunlai Li, Shijie Liu, Guoliang Tang, Jianan Xie, and Jianyu Wang. 2022. "A Snapshot Imaging Spectrometer Based on Uniformly Distributed-Slit Array (UDA)" Sensors 22, no. 9: 3206. https://doi.org/10.3390/s22093206
APA StyleXu, Y., Li, C., Liu, S., Tang, G., Xie, J., & Wang, J. (2022). A Snapshot Imaging Spectrometer Based on Uniformly Distributed-Slit Array (UDA). Sensors, 22(9), 3206. https://doi.org/10.3390/s22093206