
How IoT-Driven Citizen Science Coupled with Data Satisficing Can Promote Deep Citizen Science

 ,
,  ,
,  ,
, 
Abstract
:1. Introduction
- Aid scientists through citizens by providing wider, more temporal-spatial measurements of the physical and natural world than scientists’ conventional approaches, e.g., using mobile air quality monitoring rather than that based upon networks of static, sparse measurement stations [7];
- Environment monitoring equipment may be prohibitively expensive to be used to capture temporal-spatial heterogeneity and identify environment hotspots leading to the development of robust real-time strategies for exposure control [8]—hence the need for low-cost sensors (LCS) such as IoT-based approaches;
- The lack of scientists and specialised resources to monitor the physical and natural world, especially in developing countries [6];
- Serve the education and outreach goals to widen, make more inclusive citizens’ participation in science [9].
- 1.
- Analysis and classification of surveyed CS projects, especially with respect to the CS equipment used.
- 2.
- Analysis of IoT-enabled CS issues, in part based upon a field study to determine AQ across four different cities in Pakistan.
- 3.
- Recommendations for IoT-enabled CS, data satisficing and deep CS.
- RQ1—Which factors affect CS IoT-CS data quality in the context of AQ?
- RQ2—How can we make science more inclusive by dealing with the lack of scientists, training and high-quality equipment through deploying IoT-CS?
- RQ3—Can a lack of calibrated data readings yield otherwise useful results for IoT-CS AQ data analysis?
2. Related Work
- Sensor calibration and reliability: Some cheap sensors have no defined calibration to relate their given voltage outputs to measurement units. Measurements may need to be evaluated under a range of ambient environmental conditions, e.g., temperature and humidity, as these affect the AQ measurements. Hence, cross-checks of LCS with calibrated instruments in the lab or under only a few field conditions need to be considered where feasible. Relevant metrics for the comparison of LCS systems against reference systems should be considered. Ref. [14] highlighted the most cost-effective LCS that could be used to monitor air quality pollutants versus reference systems with a good level of agreement represented by a coefficient of determination R2 > 0.75 and a linear slope of the regression line between these, close to 1.0. Note that R2 is overly dependent on the range of reference measurements, the duration of the test, and the season and location of the tests, meaning that changes in R2 are not completely dependent on LCS or their calibration methods [15]. Note, also that citizens would also need a business, local authority or scientific partner that has access to a calibrated instrument, as these are expensive to buy. Periodic recalibration may also be needed as the sensitivity of sensors can change over time.
- Sensor sensitivity versus selectivity: A limitation in improving the sensitivity of the AQ sensors is that some (AQ) sensors may be marketed for one pollutant but exhibit cross-sensitivity to other pollutants or contaminants. This is especially an issue for gases at low concentrations, in the parts per billion (ppb) range. Such contaminants can contribute to a biased response of the sensors, thereby deteriorating their selectivity.
- Sensor stability and response time: Sensing (AQ) mechanisms can involve quite complex chemical reactions, e.g., oxidation and reduction of the sensing materials and adsorption of oxygen and other chemical species on their surface, and catalytic reactions between the adsorbents. As a result, the performance of these sensors is sensitive to their operating conditions. A waiting time may be needed for sensors to stabilise, and if the conditions change, i.e., sensors are moved, further stabilisation times are needed before reliable measurements can be undertaken.
- Slow changes in environment state: The physical world often changes slowly, from minutes to hours to days or even longer, in part because of its mass, leading to biological, chemical and physical phenomena that also change slowly, including human health effects. Short periods of measurement do not capture such changes. Measurement equipment may not be able to be safely left and maintained (powered up) to attain such measurements. Note also that some standardised measurements for the USA AQ Index (AQI) require taking long periods of measurements from several hours to a day to get a standard average value [16]. It is also difficult to quantitively ascertain that isolated short exposure periods of less than a day to some potentially harmful environment states are, in turn, harmful to humans and other life forms too.
- Variable operating conditions: e.g., temperature and humidity, can affect the operation of (AQ) sensors, and these vary temporally and spatially [17]. These may also be affected by artificial hot spots, e.g., machines generating outbursts of hot or humid air leading to noisy data. Hence such operating conditions should also be recorded too. These conditions include location coordinates, location context as the type of location, indoors versus outdoors, proximity to any suspected pollution sensors, the height of sensors above ground level, if and how the human holding the sensor is moving or not when sensing, time and weather conditions.
- Resilience: IoT sensor systems need to be designed to operate reliably under a range of diverse environmental conditions and to be moved.
- Equipment costs: the higher the IoT-CS equipment cost, the more exclusive the group of citizens that can afford to procure it to use, perhaps excluding low-income neighbourhoods that may be more at risk of the effects of poor physical environment quality.
- Maintenance or operational costs: These may be considerable, e.g., for calibration, battery recharging or replacement, data management, analysis, and visualisation. The maintenance costs may easily exceed the cost of the actual IoT CS equipment itself.
- Longevity of components before replacement. Note, AQ sensors could have a working time of the order of six months to a couple of years at most.
- Trust by the scientific community and decision-makers as they may not be prepared to embrace such technology.
- Data quality of the monitored phenomena needs to be addressed effectively and transparently to maximise the benefit to scientists, the public and authorities to help make more informed decisions. However, it may not be simple to just automatically collect and publish the data. This is because of the issues concerning:
- o
- Differences in conditions of context, such as location [15], time, temperature and humidity, between different instruments’ measurements.
- o
- Labelling the data with the measurement operating conditions (measurement context) to help understand the meaning of the data;
- o
- Pre-processing or filtering the data before publishing;
- o
- Standardising the data in terms of common measurement units, data format, etc.
- Data dissemination issues of the monitored phenomena need to be addressed effectively and transparently:
- o
- Anonymising any personal context for the data;
- o
- Visualising and providing understandable commentaries or interpretations of the data to citizens.
3. LCS IoT-CS AQ Study in 4 Cities
- Raising awareness of temporal-spatial variations in the environment state in the habitat close to where someone lives or works that has meaning to them, e.g., that they could observe high versus low temporal-spatial variations in AQ using an AQ LCS IoT kit;
- Determining if increasing proximity to artificial sources of pollution decreases the environmental quality;
- Providing some preliminary field evidence that there may be some citizen-driven issues and concerns about their local environmental state warranting the need for additional, more rigorous standardised measurements to confirm or refute the IoT-CS LCS measurements.
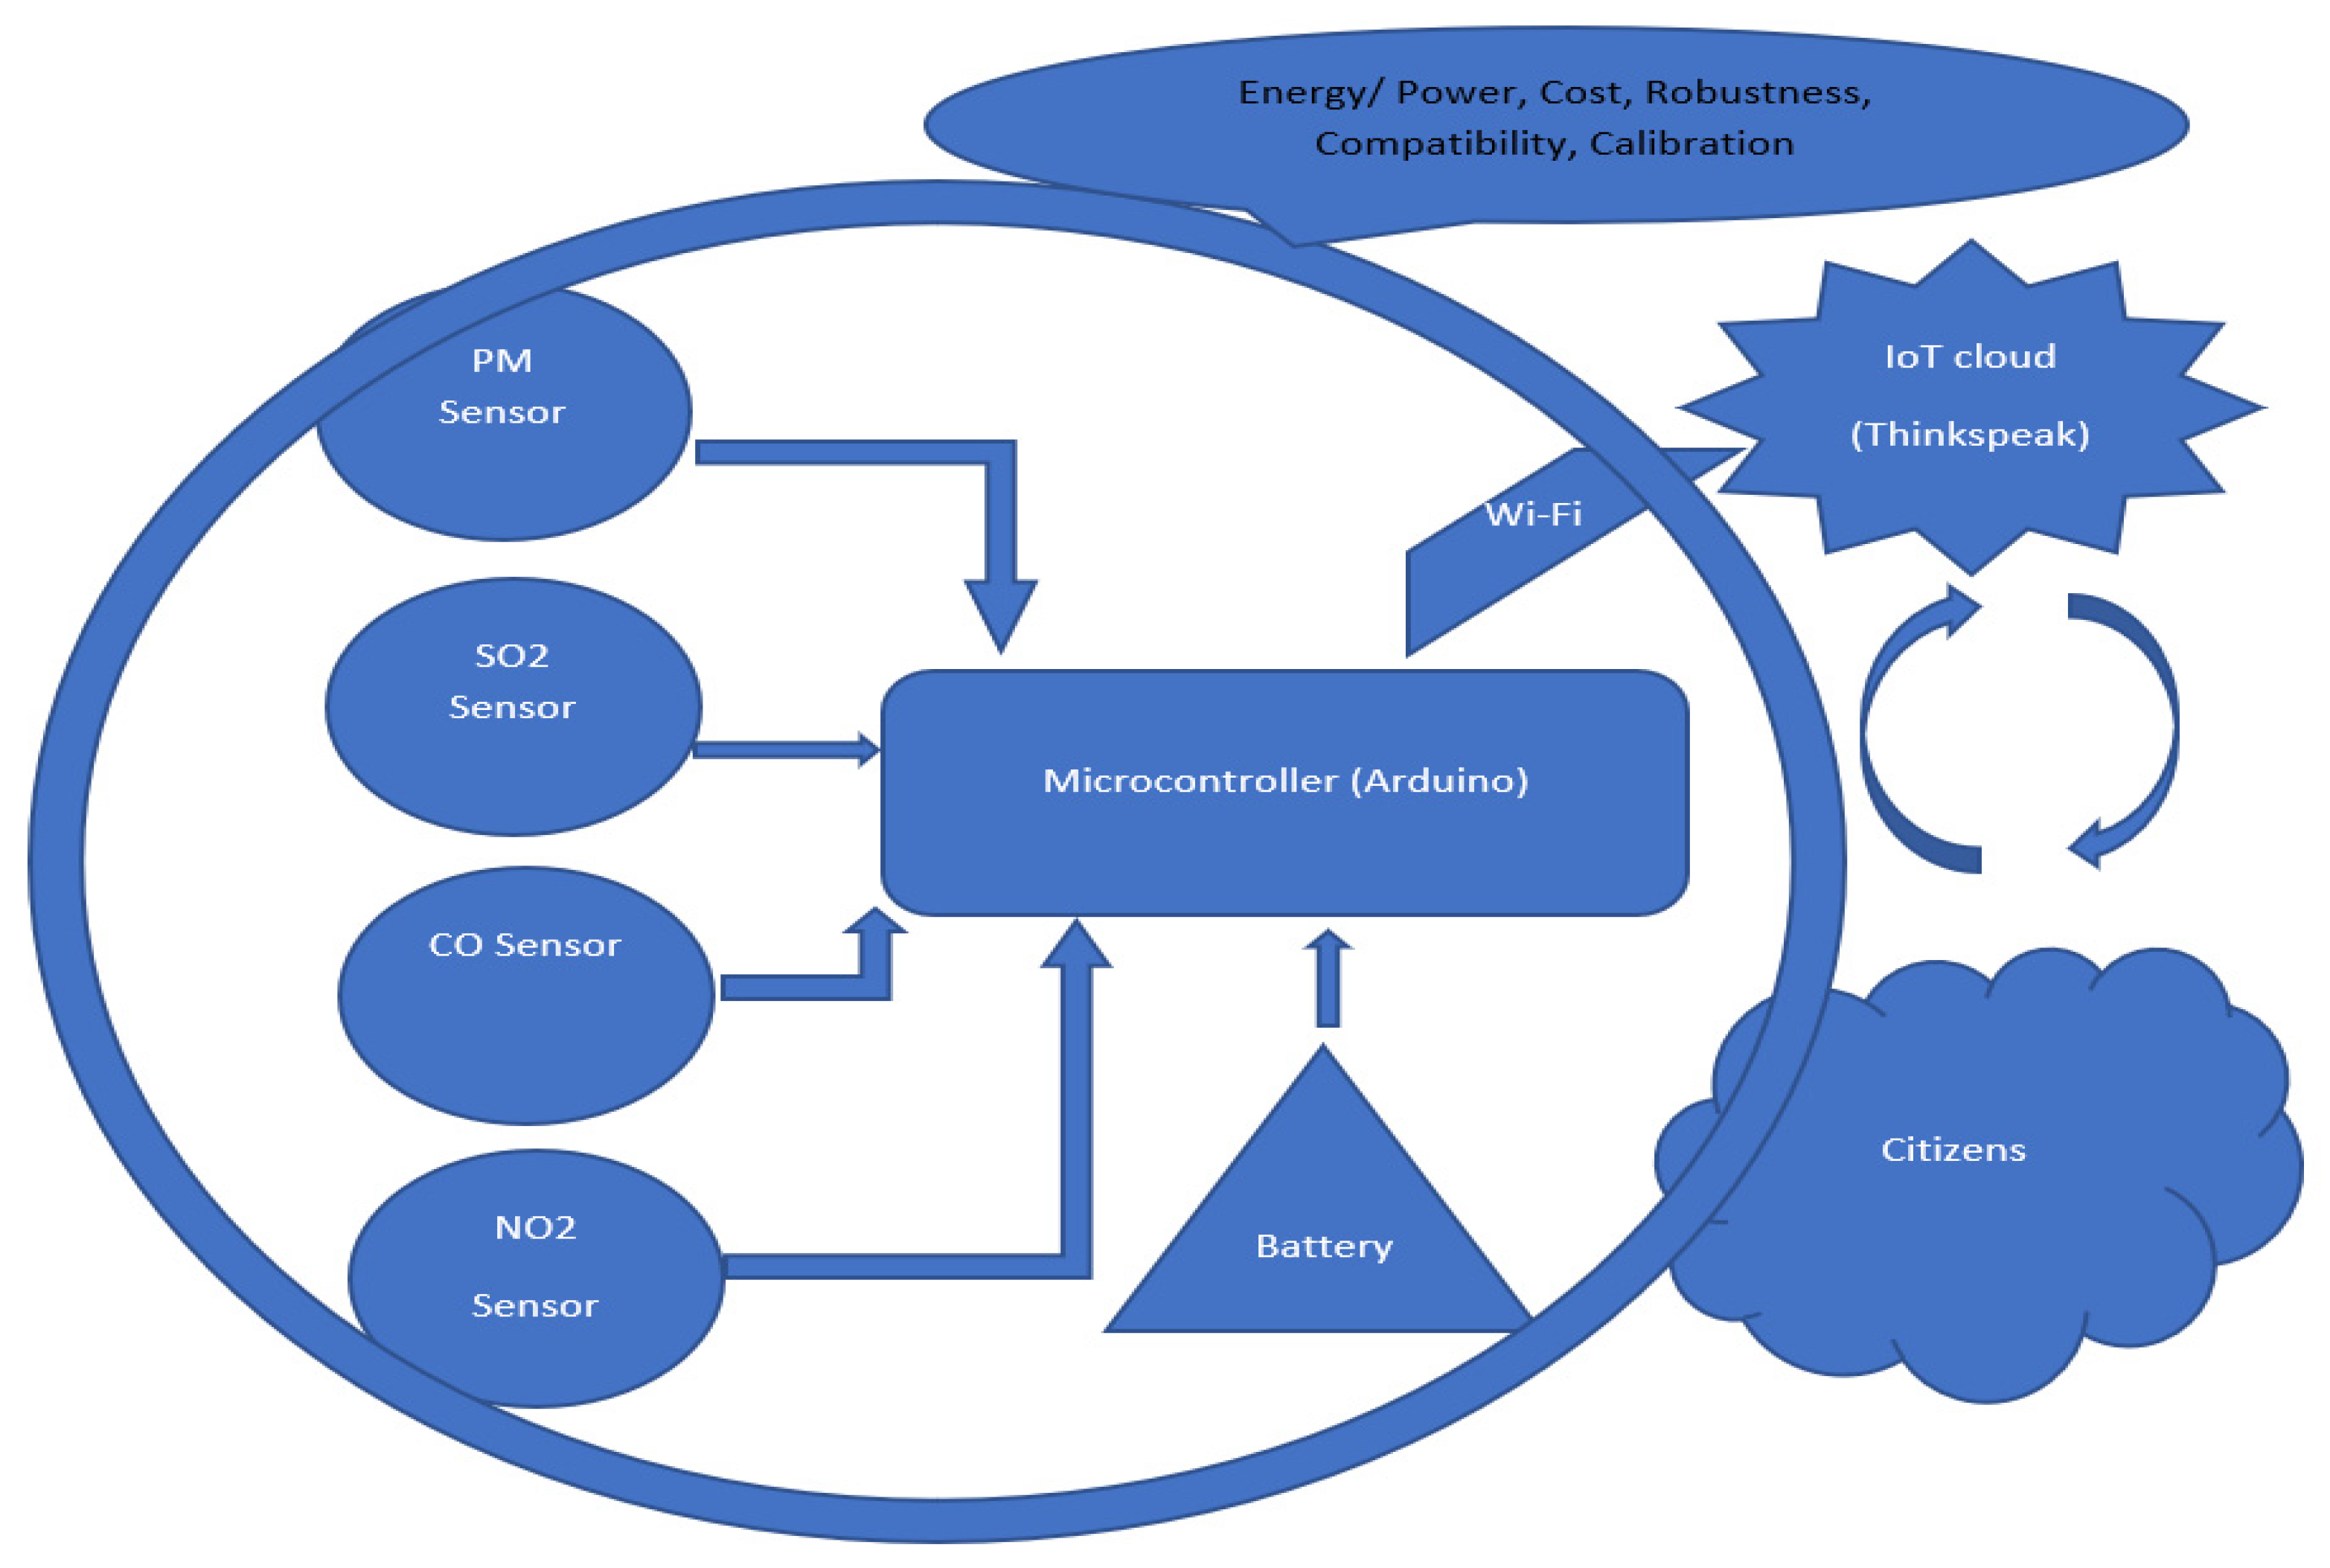
3.1. Apparatus
3.2. The Workshop
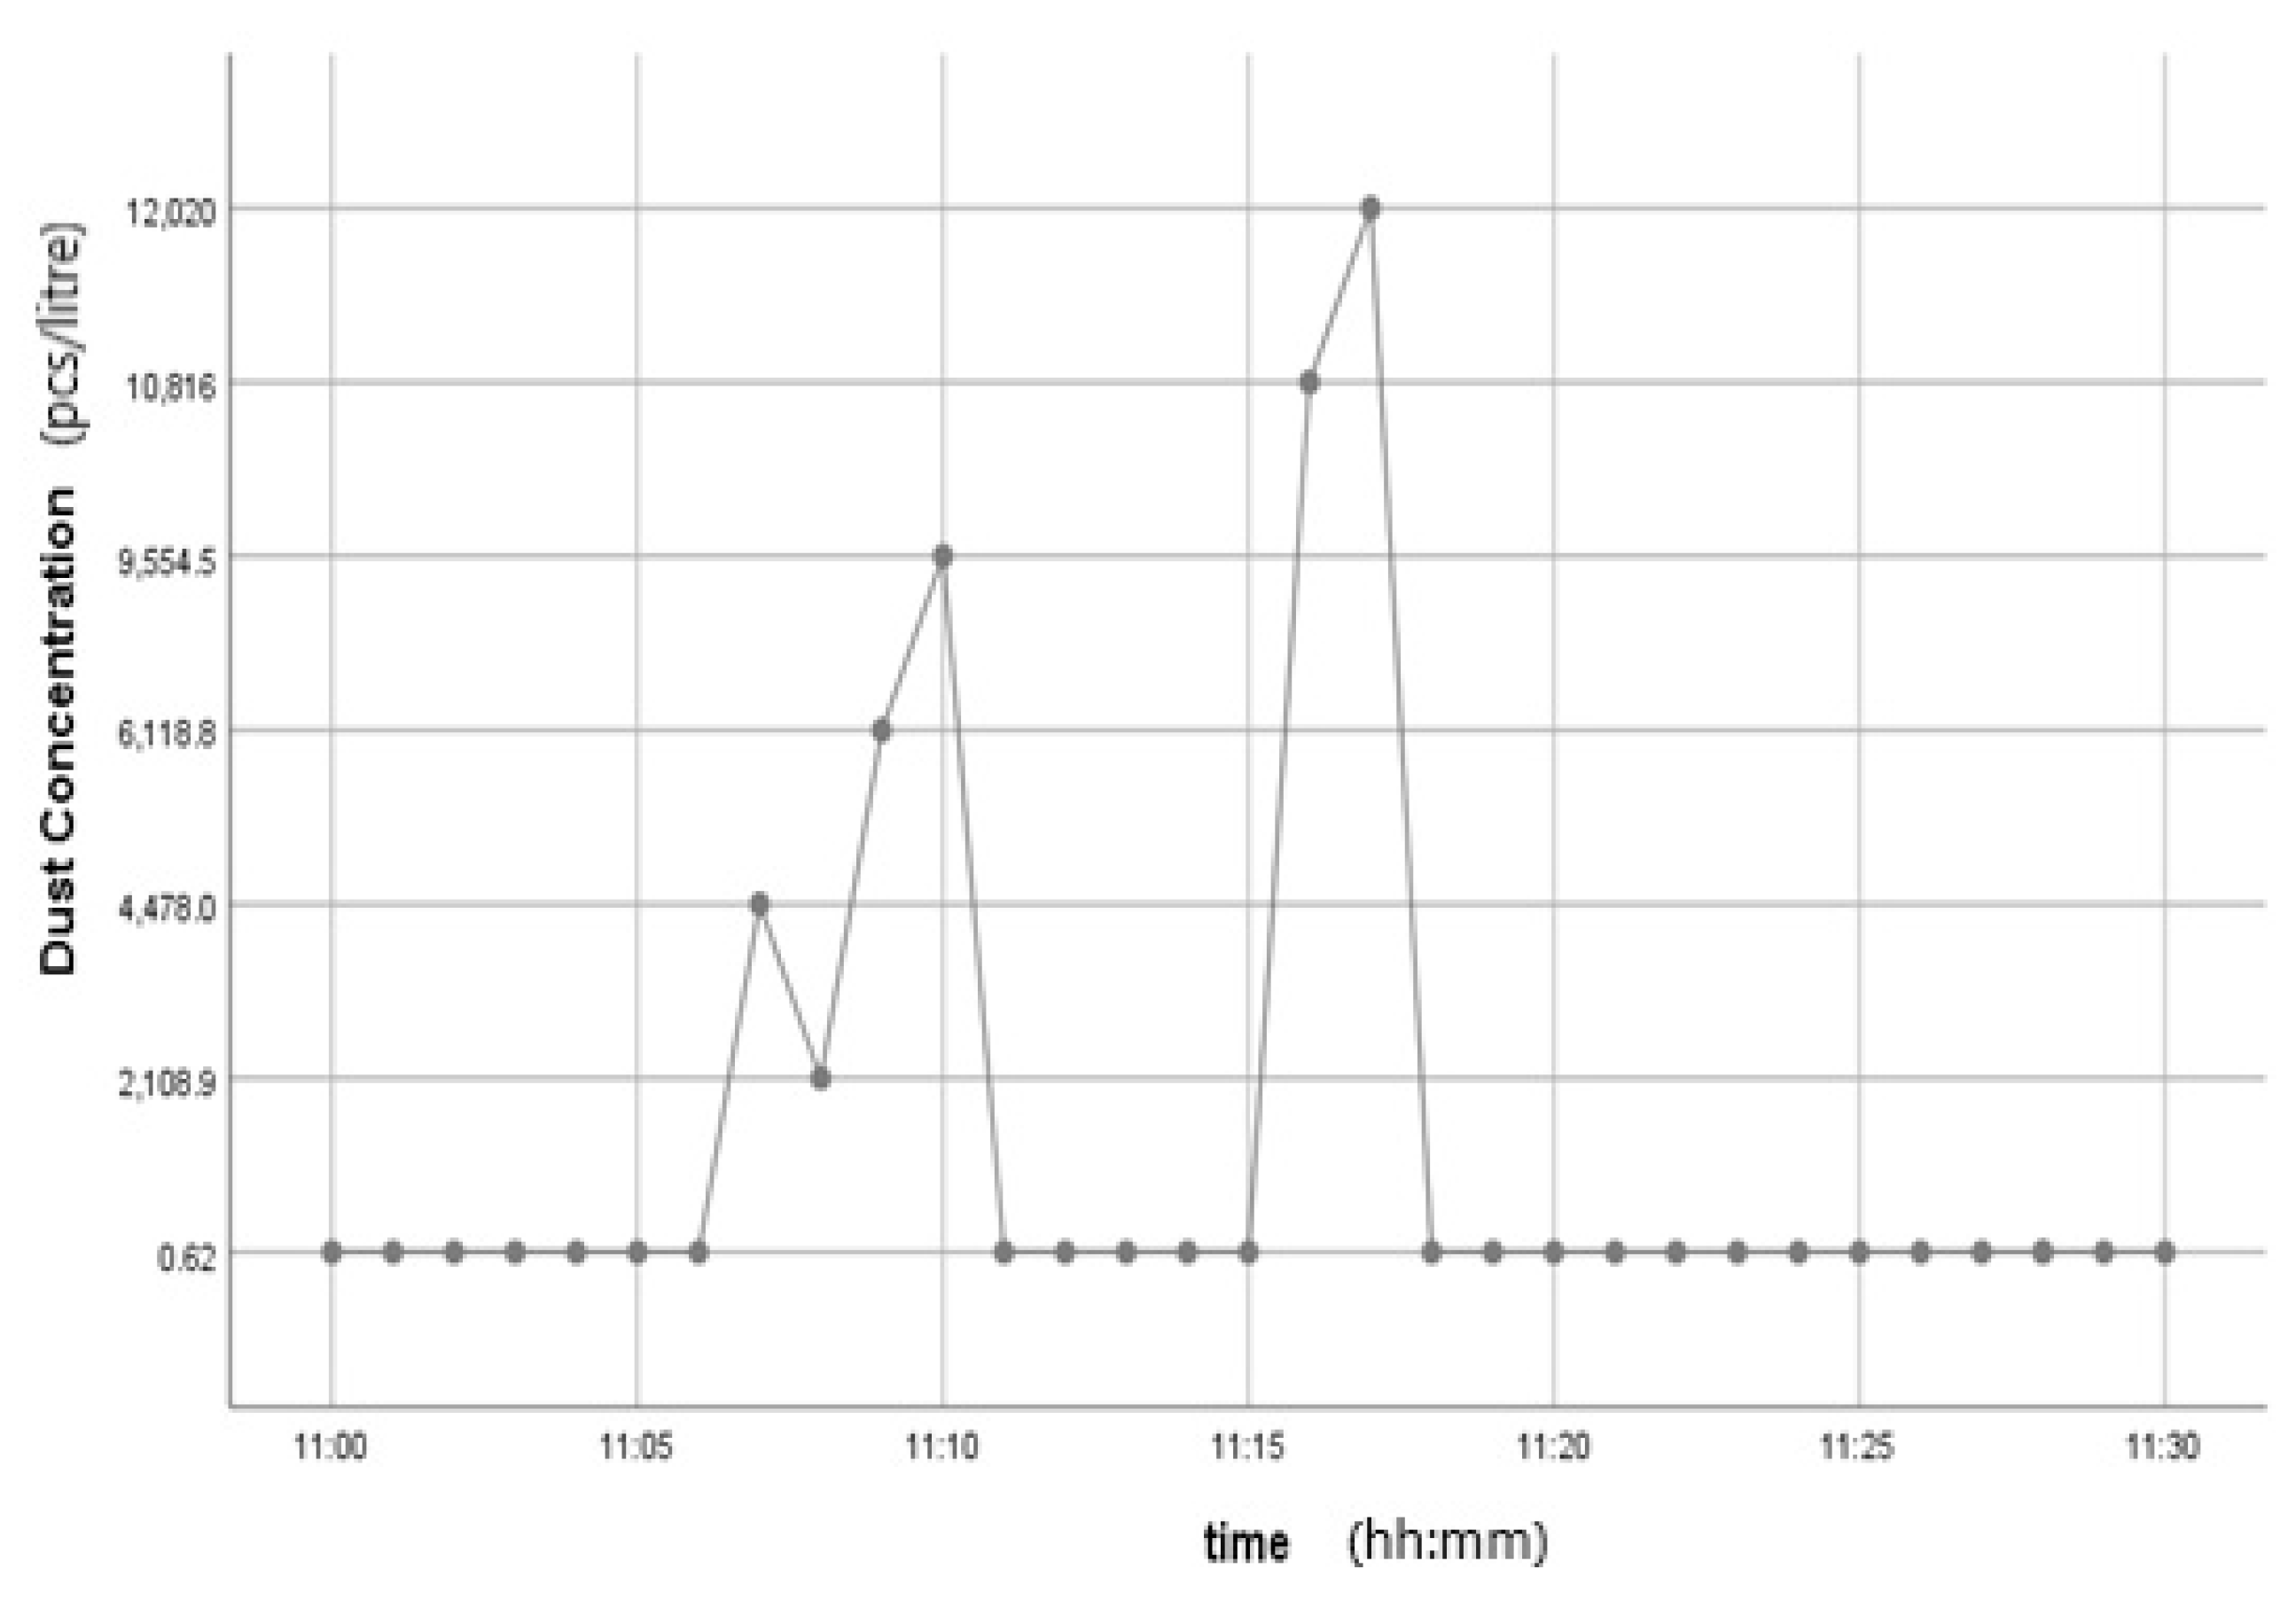
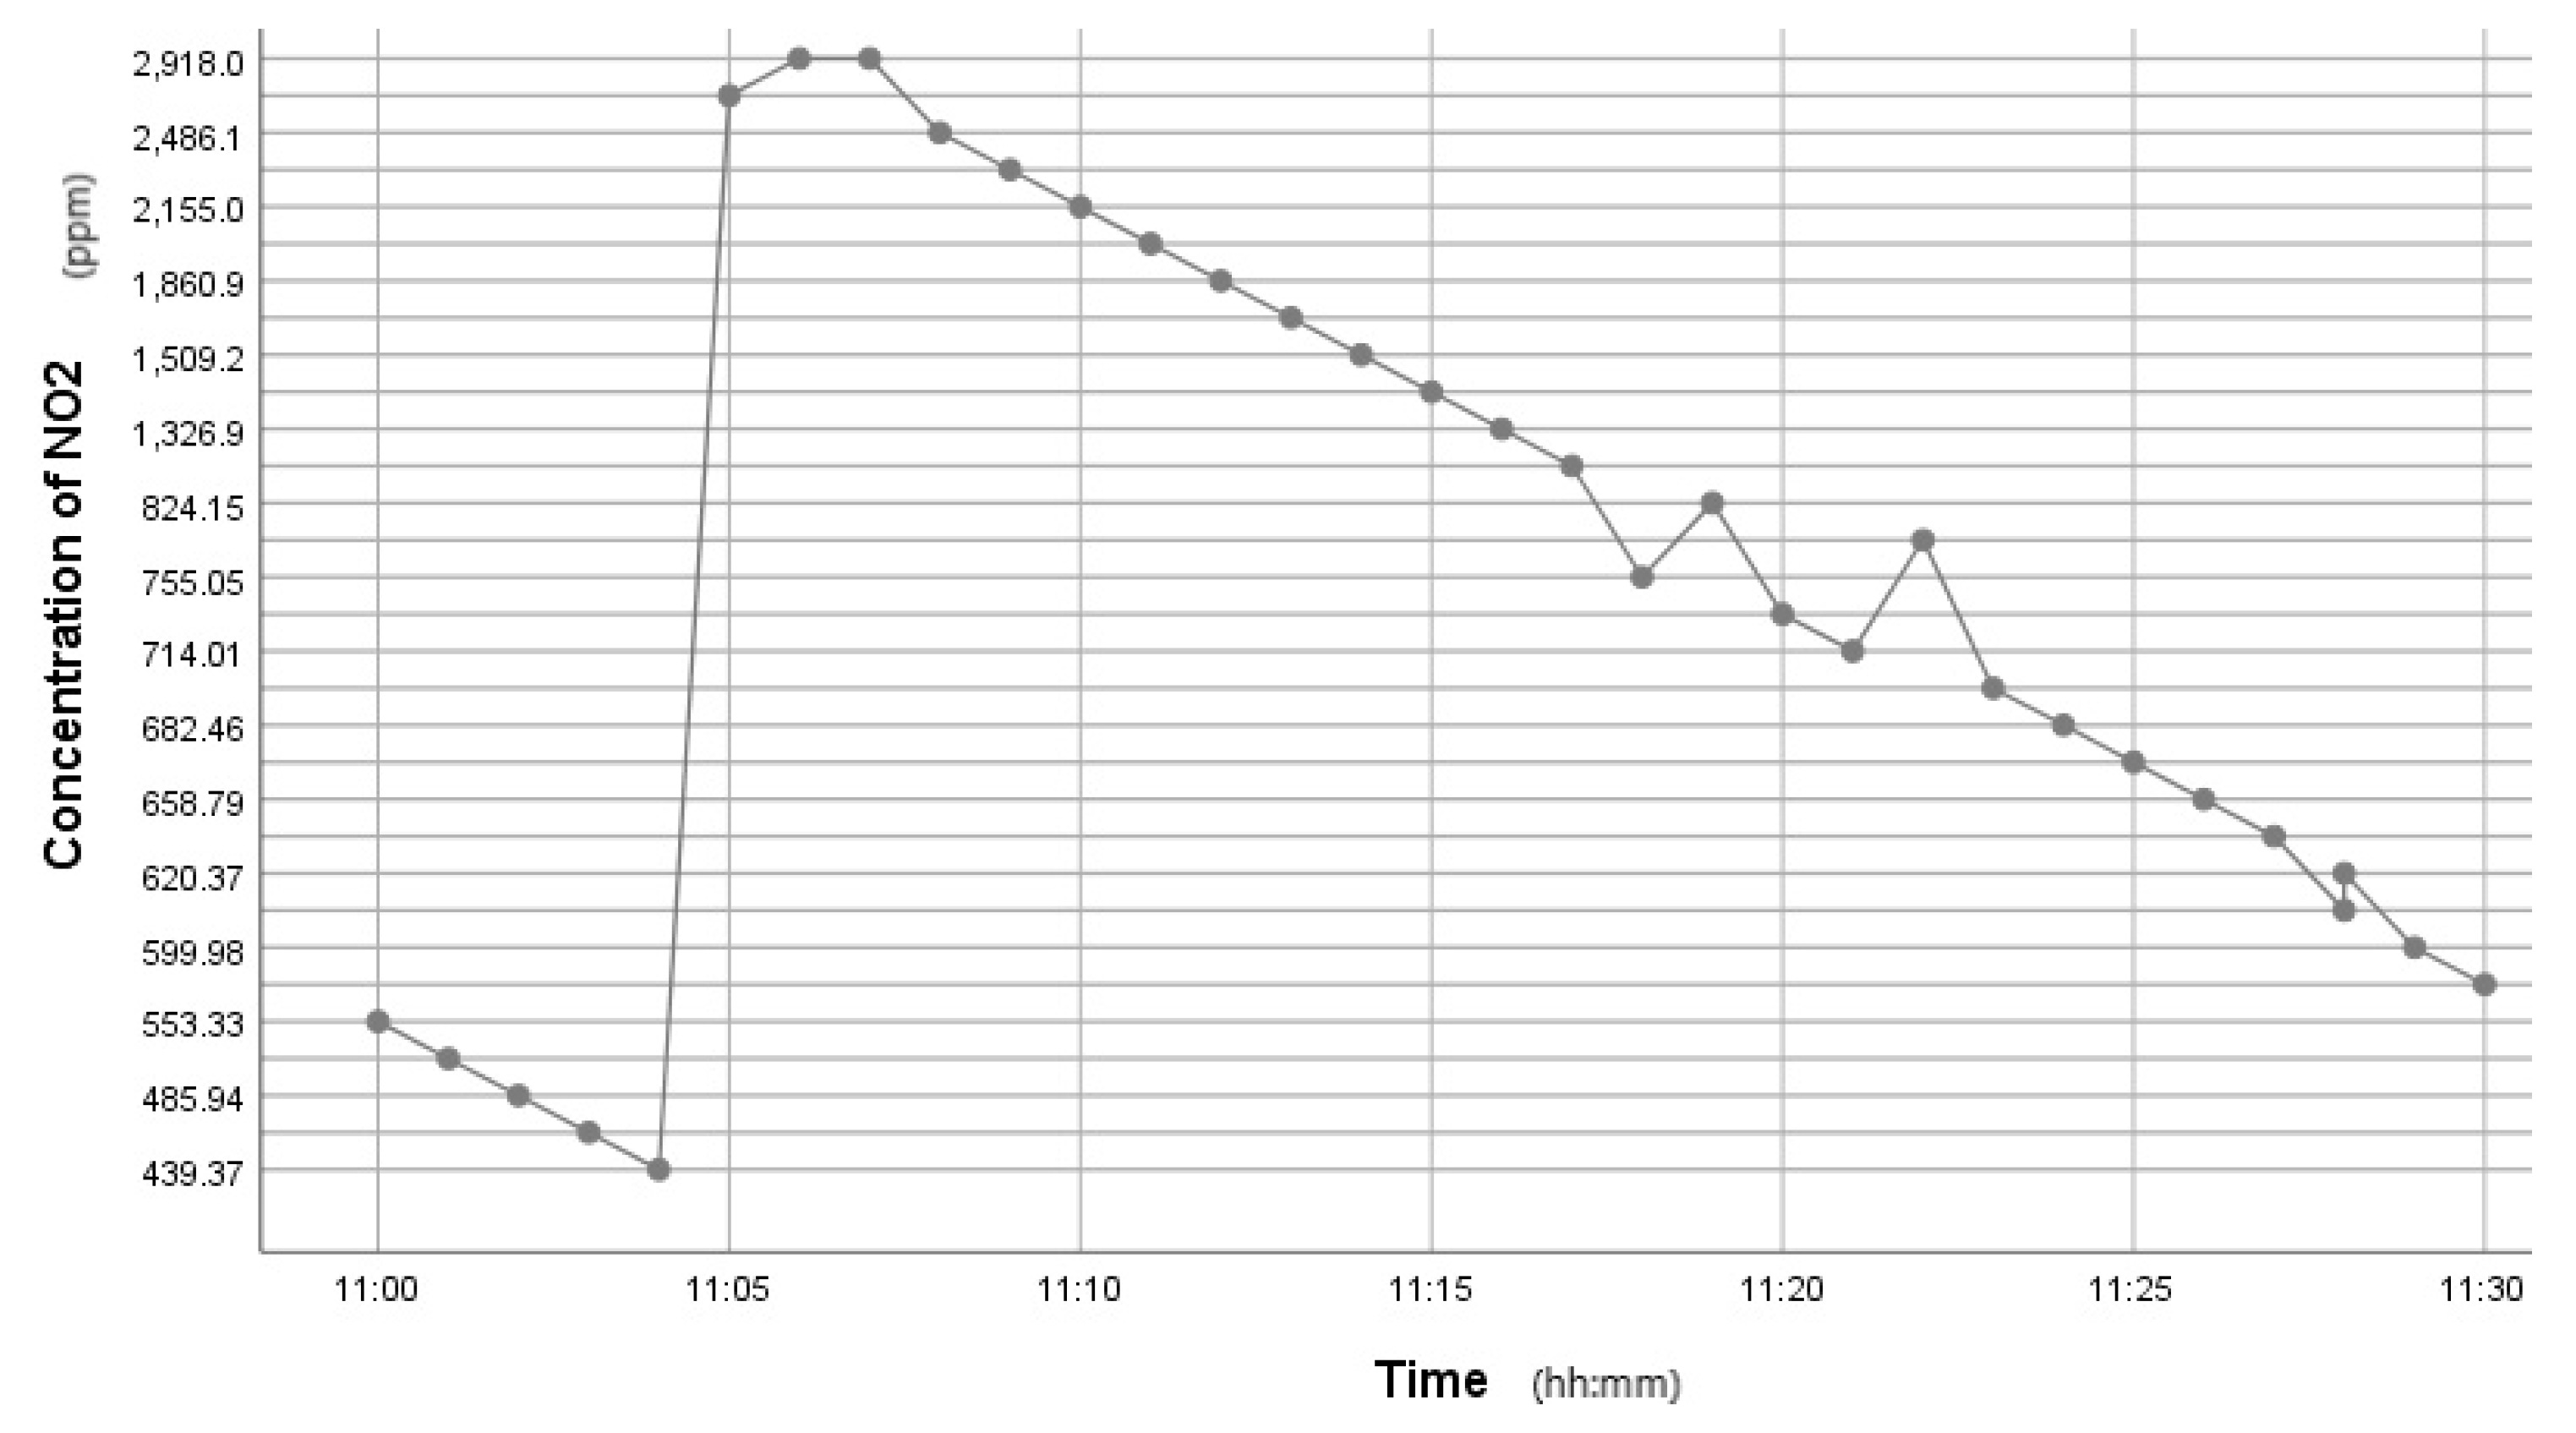
3.3. Results
3.4. Discussion: The Need for Deep Citizen Science
4. Conclusions
4.1. Main Findings
- 1.
- IoT-CS can provide a versatile platform to experiment with multiple factors offering new types of CS that would not otherwise be feasible. A moveable IoT-CS device means that experimentation can be situated local to citizens, fostering strong ownership. Incremental experimentation can then be used to provide a more relevant context to the citizens involved, e.g., to find an individual’s norm, to detect (normal or abnormal) variations about this, and to investigate local AQ change sources that affect the normal environmental state.
- 2.
- IoT-CS can raise awareness and broaden participation in science through the utility of more cost-effective and affordable IoT.
- 3.
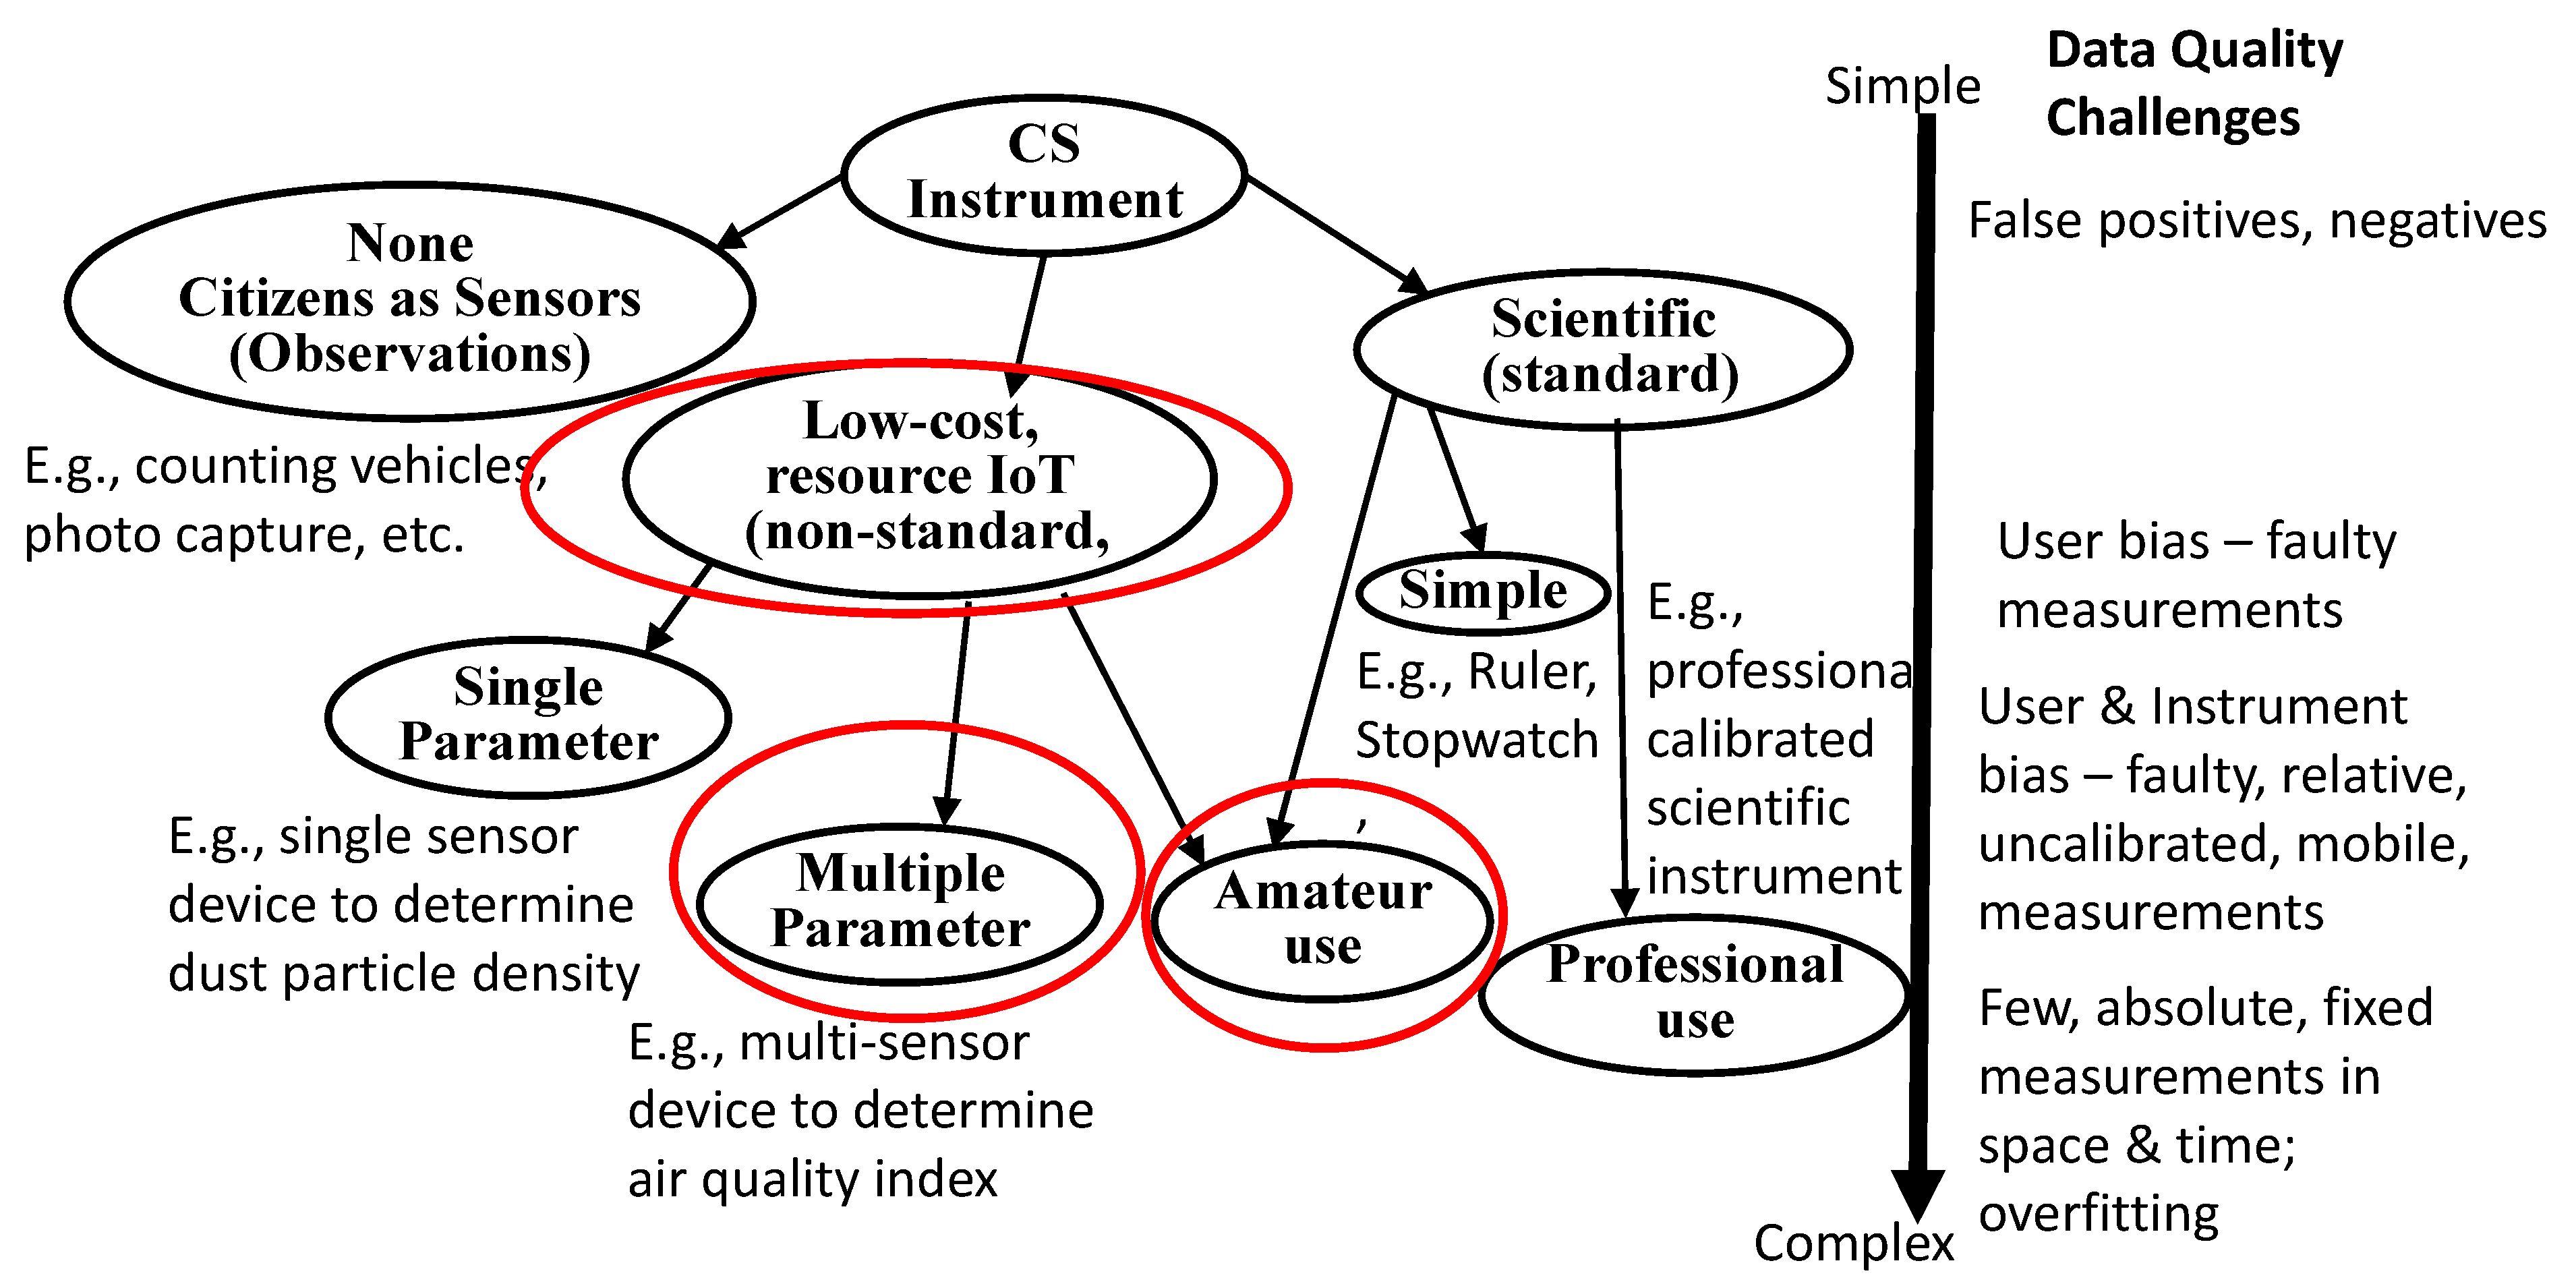
- A classification of CS instruments can help us to better understand the data quality challenges when using different types of CS scientific instruments.
- 4.
- An analysis of the data shows that it has been possible to detect AQ differences and to make an initial comparison. Hence, the analysis provides some insight into the indoor and outdoor AQ within a city and between cities. However, from a CS point of view, this knowledge could also help to highlight mitigating solutions, e.g., keeping windows closed and less use of extractor fans may significantly improve AQ during a high-dust season.
- 5.
- Adopting the good practice guidelines to promote higher data quality in CS studies proposed by [28]: (a) We gave equipment operational instructions in an accessible language at workshops; (b) we did not provide technical details about different devices and their accuracy as it is far more complex to ascertain this for AQ data than temperature data, and in our study, we only used one type of device; (c) we asked citizens to report contextual information such as location, time but we needed to add more context info, such as temperature, humidity and a more fine-grained spatial context such as the spatial topology. However, for the latter, this could be very challenging for citizens to define in such a way that could be automated, fused and correlated; (d) we considered that removing outliers is not all that necessary since our goal is to ‘satisfice’, which was done. The AQIs calculated were all within the normal range, and though we have no reference, they were also in line with the state of each city whose data was available. Note also, given the size of the data, many outliers would have cancelled each other out; (e) we did not compare data points reported from multiple citizens’ instruments in the same geographic location (postcode) to identify the degree of agreement amongst them because in our pilot study we had insufficient citizens and instruments; (f) we did not compare citizens’ recordings to official AQ data for the reasons given in recommendation 2, see below.
- 6.
- For IoT AQ use, the majority of studies focus on PM sized 1,2.5,10 microns and far less on the other AQ indices of CO, NO2, O3, SO2 determined in many regional AQ standards and regarded as hazardous to humans and other living things.
- 7.
- For IoT AQ use, very few studies consider the cross-correlation of changes in individual AQ gases [14] as an additional cross-check of AQ changes to satisfy local AQ change hypotheses.
4.2. Recommendations
- 1.
- A deep citizen science approach (Section 3.4) should be fostered to help address the shortfall of a very small proportion of trained professional scientists in the general population to support a more inclusive knowledge and application of science en masse for the greater good.
- 2.
- It may not be useful or even feasible to cross-check measurements from cheaper versus more expensive calibrated instrument sensors in situ in some regions/locations for some CS studies. Hence, data satisficing could be more of a focus if this occurs. This is because, in some regions, calibrated instruments may not be deployed. For example, during our study period, there were no available calibrated instruments operating in Rawalpindi, Taxila and Wah. Even where calibrated instrument readings may be available, significant variations in measurements due to distance may occur for physical phenomena such as air quality, along with canyon effects. These may cause readings to be different between two instruments that are not exactly collocated at the same time. Additionally, note that for some physical phenomena, e.g., temperature, it can be far easier to check than for others, such as air quality.
- 3.
- Additional cross-checks that go beyond checking if co-located LCS and calibrated AQ measurements correlate under equivalent conditions should be leveraged to consider if IoT CS AQ studies support local satisficing of expected AQ changes, such as: considering correlations: when measuring multiple AQ indices, how well these correlate to each other [14], temporal correlations, e.g., carbon-based transport use should cause outdoor peaks in the morning and early evening; checking the normal responsiveness of AQ sensors to well-known physical environment stimuli such as burning candles, using air freshener sprays or perfumes (indoors) [33], as these can help to identify potential faulty or very inaccurate sensors, etc.
- 4.
- Clearly state how similar the conditions and context are between LCS and calibrated instrument measurements and consider how to model any differences between these, e.g., spatial differences [17].
- 5.
- There is a need for multi-disciplinary input of scientists, technologists, designers and participants through participatory design and thinking approaches to be able to address the challenges of engagement and agency of empowerment to meet the opportunity of sustainability of CS for informed change.
- 6.
- Citizens often require re-orientation, a mindset change, to improve their scientific undertakings, i.e., to switch from the plug and play expectation when interacting with the digital world to a longer setup and operation time, constrained operation and to realise the slower changes of the physical world.
- 7.
- With engagement, a more local approach is needed to mitigate the influence of hazardous findings that are found in more technical research articles so that they may be converted to everyday activities.
- 8.
- To make the meaning of CS findings more accessible and understandable to the more general public, both enhanced data and knowledge rendering techniques are needed.
- 9.
- For measurements to benefit local citizens, there is a need to develop techniques that map to local satisficing CS criteria, highlighting local change factors.
Author Contributions
Funding
Institutional Review Board Statement
Informed Consent Statement
Data Availability Statement
Conflicts of Interest
References
- Silvertown, J. A new dawn for citizen science. Trends Ecol. Evol. 2009, 24, 467–471. [Google Scholar] [CrossRef] [PubMed]
- Irwin, A. Citizen Science: A Study of People Expertise and Sustainable Development; Routledge: London, UK, 1995. [Google Scholar]
- Cooper, C.B.; Lewenstein, B.V. Two meanings of Citizen Science. In The Rightful Place of Science: Citizen Science; Cavalier, D., Tempe, A.Z., Eds.; Arizona State University Press: Tucson, AZ, USA, 2016; pp. 51–62. [Google Scholar]
- Eitzel, M.V.; Cappadonna, J.L.; Santos-Lang, C.; Duerr, R.E.; Virapongse, A.; West, S.E.; Kyba, C.; Bowser, A.; Cooper, C.B.; Sforzi, A.; et al. Citizen science terminology matters: Exploring key terms. Citiz. Sci. Theory Pract. 2017, 2, 1–20. [Google Scholar] [CrossRef] [Green Version]
- Haklay, M.M.; Dörler, D.; Heigl, F.; Manzoni, M.; Hecker, S.; Vohland, K. What is citizen science? The challenges of definition. In The Science of Citizen Science, 1st ed.; Vohland, K., Land-Zandstra, A., Ceccaroni, L., Lemmens, R., Perelló, J., Ponti, M., Samson, R., Wagenknecht, K., Eds.; Springer: Cham, Switzerland, 2021; pp. 13–34. [Google Scholar]
- Pelacho, M.; Rodríguez, H.; Broncano, F.; Kubus, R.; García, F.S.; Gavete, B.; Lafuente, A. Science as a Commons: Improving the Governance of Knowledge through Citizen Science. In The Science of Citizen Science, 1st ed.; Vohland, K., Land-Zandstra, A., Ceccaroni, L., Lemmens, R., Perelló, J., Ponti, M., Samson, R., Wagenknecht, K., Eds.; Springer: Cham, Switzerland, 2021; pp. 57–78. [Google Scholar]
- Cohn, J.P. Citizen science: Can volunteers do real research? BioScience 2008, 58, 192–197. [Google Scholar] [CrossRef] [Green Version]
- Kumar, P.; Morawska, L.; Martani, C.; Biskos, G.; Neophytou, M.; Di Sabatino, S.; Bell, M.; Norford, L.; Britter, R. The rise of low-cost sensing for managing air pollution in cities. Environ. Int. 2015, 75, 199–205. [Google Scholar] [CrossRef] [Green Version]
- Bonney, R.; Cooper, C.B.; Dickinson, J.; Kelling, S.; Phillips, T.; Rosenberg, K.V.; Shirk, J. Citizen science: A developing tool for expanding science knowledge and scientific literacy. BioScience 2009, 59, 977–984. [Google Scholar] [CrossRef]
- Gabrys, J.; Pritchard, H.; Barratt, B. Just good enough data: Figuring data citizenships through air pollution sensing and data stories. Big Data Soc. 2016, 3, 1–14. [Google Scholar] [CrossRef]
- Simon, H.A. Rational choice and the structure of the environment. Psychol. Rev. 1956, 63, 129–138. [Google Scholar] [CrossRef] [Green Version]
- Riaz, R.; Hamid, K. Existing smog in Lahore, Pakistan: An alarming public health concern. Cureus 2018, 10, e2111. [Google Scholar] [CrossRef] [Green Version]
- Wiggins, A.; Newman, G.; Stevenson, R.D.; Crowston, K. Mechanisms for data quality and validation in citizen science. In Proceedings of the 2011 IEEE Seventh International Conference on e-Science Workshops (eScienceW), Stockholm, Sweden, 5–8 December 2011; pp. 14–19. [Google Scholar]
- Tian, D.; Fan, J.; Jin, H.; Mao, H.; Geng, D.; Hou, S.; Zhang, P.; Zhang, Y. Characteristic and spatiotemporal variation of air pollution in northern China based on correlation analysis and clustering analysis of five air pollutants. J. Geophys. Res. Atmos. 2020, 125, e2019JD031931. [Google Scholar] [CrossRef]
- Karagulian, F.; Barbiere, M.; Kotsev, A.; Spinelle, L.; Gerboles, M.; Lagler, F.; Redon, N.; Crunaire, S.; Borowiak, A. Review of the performance of low-cost sensors for air quality monitoring. Atmosphere 2019, 10, 506. [Google Scholar] [CrossRef] [Green Version]
- Environment Protection Agency (EPA, USA). Technical Assistance Document for the Reporting of Daily Air Quality—The Air Quality Index (AQI). 2016. Available online: https://www3.epa.gov/airnow/aqi-technical-assistance-document-may2016.pdf (accessed on 23 June 2017).
- Chu, H.J.; Ali, M.Z.; He, Y.C. Spatial calibration and PM2.5 mapping of low-cost air quality sensors. Sci. Rep. 2020, 10, 22079. [Google Scholar] [CrossRef] [PubMed]
- Nikzad, N.; Verma, N.; Ziftci, C.; Bales, E.; Quick, N.; Zappi, P.; Patrick, K.; Dasgupta, S.; Krueger, I.; Rosing, T.Š.; et al. Citisense: Improving geospatial environmental assessment of air quality using a wireless personal exposure monitoring system. In Proceedings of the Conference on Wireless Health (WH’12), New York, NY, USA, 23–25 October 2012; pp. 1–8. [Google Scholar]
- Kontokosta, C.; Johnson, N.; Schloss, A. The quantified community at Red Hook: Urban sensing and Citizen Science in low-income neighborhoods. arXiv 2016, arXiv:1609.08780. [Google Scholar]
- Elen, B.; Theunis, J.; Ingarra, S.; Molino, A.; Van den Bossche, J.; Reggente, M.; Loreto, V. The EveryAware SensorBox: A tool for community-based air quality monitoring. Sens. Chang. World 2012, 156, 1–7. [Google Scholar]
- Williams, R.; Watkins, T.; Lon, R. Low-cost sensor calibration options. Environ. Manag. 2014, 10–15. Available online: https://cfpub.epa.gov/si/si_public_file_download.cfm?p_download_id=517654 (accessed on 1 November 2021).
- Castell, N.; Dauge, F.R.; Schneider, P.; Vogt, M.; Lerner, U.; Fishbain, B.; Broday, D.; Bartonova, A. Can commercial low-cost sensor platforms contribute to air quality monitoring and exposure estimates? Environ. Int. 2017, 99, 293–302. [Google Scholar] [CrossRef]
- Austin, E.; Novosselov, I.; Seto, E.; Yost, M.G. Laboratory evaluation of the Shinyei PPD42NS low-cost particulate matter sensor. PLoS ONE 2015, 10, e0137789. [Google Scholar]
- Aberer, K.; Sathe, S.; Chakraborty, D.; Martinoli, A.; Barrenetxea, G.; Faltings, B.; Thiele, L. OpenSense: Open community driven sensing of environment. In Proceedings of the 18th SIGSPATIAL International Conference on Advances in Geographic Information Systems (GIS’10), San Jose, CA, USA, 2 November 2010; pp. 39–42. [Google Scholar]
- Predić, B.; Yan, Z.; Eberle, J.; Stojanovic, D.; Aberer, K. ExposureSense: Integrating daily activities with air quality using mobile participatory sensing. In Proceedings of the 2013 IEEE International Conference on Pervasive Computing and Communications Workshops (PERCOM Workshops), San Diego, CA, USA, 18–22 March 2013; pp. 303–305. [Google Scholar]
- Devarakonda, S.; Sevusu, P.; Liu, H.; Liu, R.; Iftode, L.; Nath, B. Real-time air quality monitoring through mobile sensing in metropolitan areas. In Proceedings of the 2nd ACM SIGKDD International Workshop on Urban Computing (UrbComp’13), Chicago, IL, USA, 11 August 2013; p. 15. [Google Scholar]
- Skarlatidou, A.; Hamilton, A.; Vitos, M.; Haklay, M. What do volunteers want from citizen science technologies? A systematic literature review and best practice guidelines. JCOM J. Sci. Commun. 2019, 18, A02. [Google Scholar] [CrossRef]
- Herodotou, C.; Scanlon, E.; Sharples, M. Methods of promoting learning and data quality in citizen and Community Science. Front. Clim. 2021, 3, 53. [Google Scholar] [CrossRef]
- Clements, A.L.; Griswold, W.G.; Abhijit, R.S.; Johnston, J.E.; Herting, M.M.; Thorson, J.; Collier-Oxandale, A.; Hannigan, M. Low-cost air quality monitoring tools: From research to practice (a workshop summary). Sensors 2017, 17, 2478. [Google Scholar] [CrossRef] [Green Version]
- United Nations (UN). Sustainable Development Goals Report. 2018. Available online: https://unstats.un.org/sdgs/files/report/2018/TheSustainableDevelopmentGoalsReport2018-EN.pdf (accessed on 23 June 2018).
- Skarlatidou, A.; Haklay, M. Citizen science impact pathways for a positive contribution to public participation in science. JCOM J. Sci. Commun. 2021, 20, A02. [Google Scholar] [CrossRef]
- Wolkoff, P.; Nielsen, G.D. Effects by inhalation of abundant fragrances in indoor air—An overview. Environ. Int. 2017, 101, 96–107. [Google Scholar] [CrossRef] [PubMed]
- Uhde, E.; Schulz, N. Impact of room fragrance products on indoor air quality. Atmos. Environ. 2015, 106, 492–502. [Google Scholar] [CrossRef]

Publisher’s Note: MDPI stays neutral with regard to jurisdictional claims in published maps and institutional affiliations. |
© 2022 by the authors. Licensee MDPI, Basel, Switzerland. This article is an open access article distributed under the terms and conditions of the Creative Commons Attribution (CC BY) license (https://creativecommons.org/licenses/by/4.0/).
Share and Cite
Poslad, S.; Irum, T.; Charlton, P.; Mumtaz, R.; Azam, M.; Zaidi, H.; Herodotou, C.; Yu, G.; Toosy, F. How IoT-Driven Citizen Science Coupled with Data Satisficing Can Promote Deep Citizen Science. Sensors 2022, 22, 3196. https://doi.org/10.3390/s22093196
Poslad S, Irum T, Charlton P, Mumtaz R, Azam M, Zaidi H, Herodotou C, Yu G, Toosy F. How IoT-Driven Citizen Science Coupled with Data Satisficing Can Promote Deep Citizen Science. Sensors. 2022; 22(9):3196. https://doi.org/10.3390/s22093196
Chicago/Turabian StylePoslad, Stefan, Tayyaba Irum, Patricia Charlton, Rafia Mumtaz, Muhammad Azam, Hassan Zaidi, Christothea Herodotou, Guangxia Yu, and Fesal Toosy. 2022. "How IoT-Driven Citizen Science Coupled with Data Satisficing Can Promote Deep Citizen Science" Sensors 22, no. 9: 3196. https://doi.org/10.3390/s22093196
APA StylePoslad, S., Irum, T., Charlton, P., Mumtaz, R., Azam, M., Zaidi, H., Herodotou, C., Yu, G., & Toosy, F. (2022). How IoT-Driven Citizen Science Coupled with Data Satisficing Can Promote Deep Citizen Science. Sensors, 22(9), 3196. https://doi.org/10.3390/s22093196