1. Introduction
Optical three-dimensional (3D) measurement based on the grating projection has the advantages of high speed, no contact with the object to be tested, high resolution and so on, so it is suitable for the 3D detection of wheel-rail shape [
1,
2,
3,
4,
5,
6,
7,
8,
9,
10]. Phase measurement profilometry (PMP) is one of the commonly used forms of optical projection 3D profilometry, but it is not suitable for real-time or dynamic measurement because it needs to collect multiple grating images, and the movement of the object affects the measurement results. In addition, motion blur of the deformed fringe patterns collected will occur when the object is in a state of high-speed rotation. While the wheels are in a rotating state in many cases, and if a detection method suitable for rolling wheels can be found, the efficiency of detection can be greatly improved. The general method used in real-time measurement is Fourier transform profilometry (FTP), because it only needs to collect one frame of image, the amount of operation is small and the processing speed is high, it is easy to realize the measurement of motion scene. However, it is necessary to ensure that there is no aliasing between all levels of spectrum, so it is difficult to improve the accuracy [
11,
12].
MP is a non-contact 3D surface measurement method, which superimposes the reference grating and the deformed grating of the object to form moire fringe patterns, and restores the surface profile of the object by calculating the distribution of moire fringe patterns. It can be divided into shadow method, projection method, digital synthesis method and so on [
13]. Li et al. proposed a 3D measurement method based on computer-generated moire fringe. It has great potential in real-time and dynamic 3D measurement because of the characteristics of its single launch deformation pattern. This method could avoid color or texture interference and has higher measurement accuracy than FTP [
14]. He also proposed a high-precision computer generated MP, based on accurate elimination of background light components [
15]. Tang et al. proposed a phase compensation method to solve the problem of 2π ambiguity in moire projection method [
16]. Mohammadi Fatemeh et al. calculated multiple moire wavelengths in the full working depth and applied them to the heterodyne multi-wavelength phase unwrapping in digital moire phase unwrapping [
17]. Lu Wang et al. proposed a method of computer generated moire profilometry with orthogonal modulation, which reduced the influence of spectrum aliasing and further improved the measurement accuracy of MP [
18]. He also proposed a computer-generated moire profilometry based on flat image demodulation, which greatly reduces the influence of frequency aliasing by projecting composite gratings and demodulating [
19]. At present, the research of MP is mainly focused on theory and simulation experiments, which is not as widely used as PMP and FTP in engineering. MP has higher precision than FTP and simpler operation than PMP, which greatly improves its practical application value. The requirements for the load and speed of trains are increasing due to the rapid development of railway construction, and the loads on wheels and rails are also increasing, which make people pay more and more attention to the detection of wheels and rails [
20]. Wheels are one of the key components of trains, whose safety state is directly determined by their running state. Wheel 3D profile detection is an important means to detect wheel defects and ensure the safety of train operation. The application of MP in wheel profile detection can effectively improve production efficiency.
Manual detection is the most commonly used method of traditional wheel detection, but it has some disadvantages, such as being prone to fatigue, unable to observe directly and so on. The acceleration detection method is often used for detecting the damage under the surface of wheel tread. Zhang et al. put forward an online non-contact method for measuring the wheel tread geometric parameters based on the opto-electronic measurement technique, but it can only measure the size and not restore the shape of the wheel [
21]. Zhang applied FTP and wavelet transform profilometry (WTP) to the measurement of 3D topography of wheels, and realized 360°, fast and accurate measurement [
22]. Qin et al. applied a new phase-height mapping algorithm when using PMP to detect wheel tread, which is more convenient than the traditional algorithm but cannot realize dynamic measurement [
23]. Liu et al. proposed a wheel condition monitoring system based on fiber Bragg grating (FBG), which can detect wheel tread defects online when the train is passing. However, whether the abnormal signal is caused by wheel defects or not needs further analysis [
24].
A 3D profile detection method of wheel tread based on MP is presented in this paper. First of all, the sinusoidal grating fringe patterns are generated by computer and projected onto the wheel tread surface. In the experiment, only one frame of deformed grating fringe pattern of the tread is collected, and the reference fringe pattern and deformed fringe pattern are processed by computer, such as frequency domain filtering, to generate the moire fringe pattern of the wheel tread. Then the 3D reconstruction of wheel tread is obtained by phase unwrapping and phase-height mapping. This method can meet the needs of real-time or online measurement for train wheel tread. Experimental results show that the reconstruction errors of MP and PMP are similar, and the 3D shape of the wheel can be reconstructed well. In addition, it has a good performance in defect recognition without changing the projection grating frequency.
2. Principle
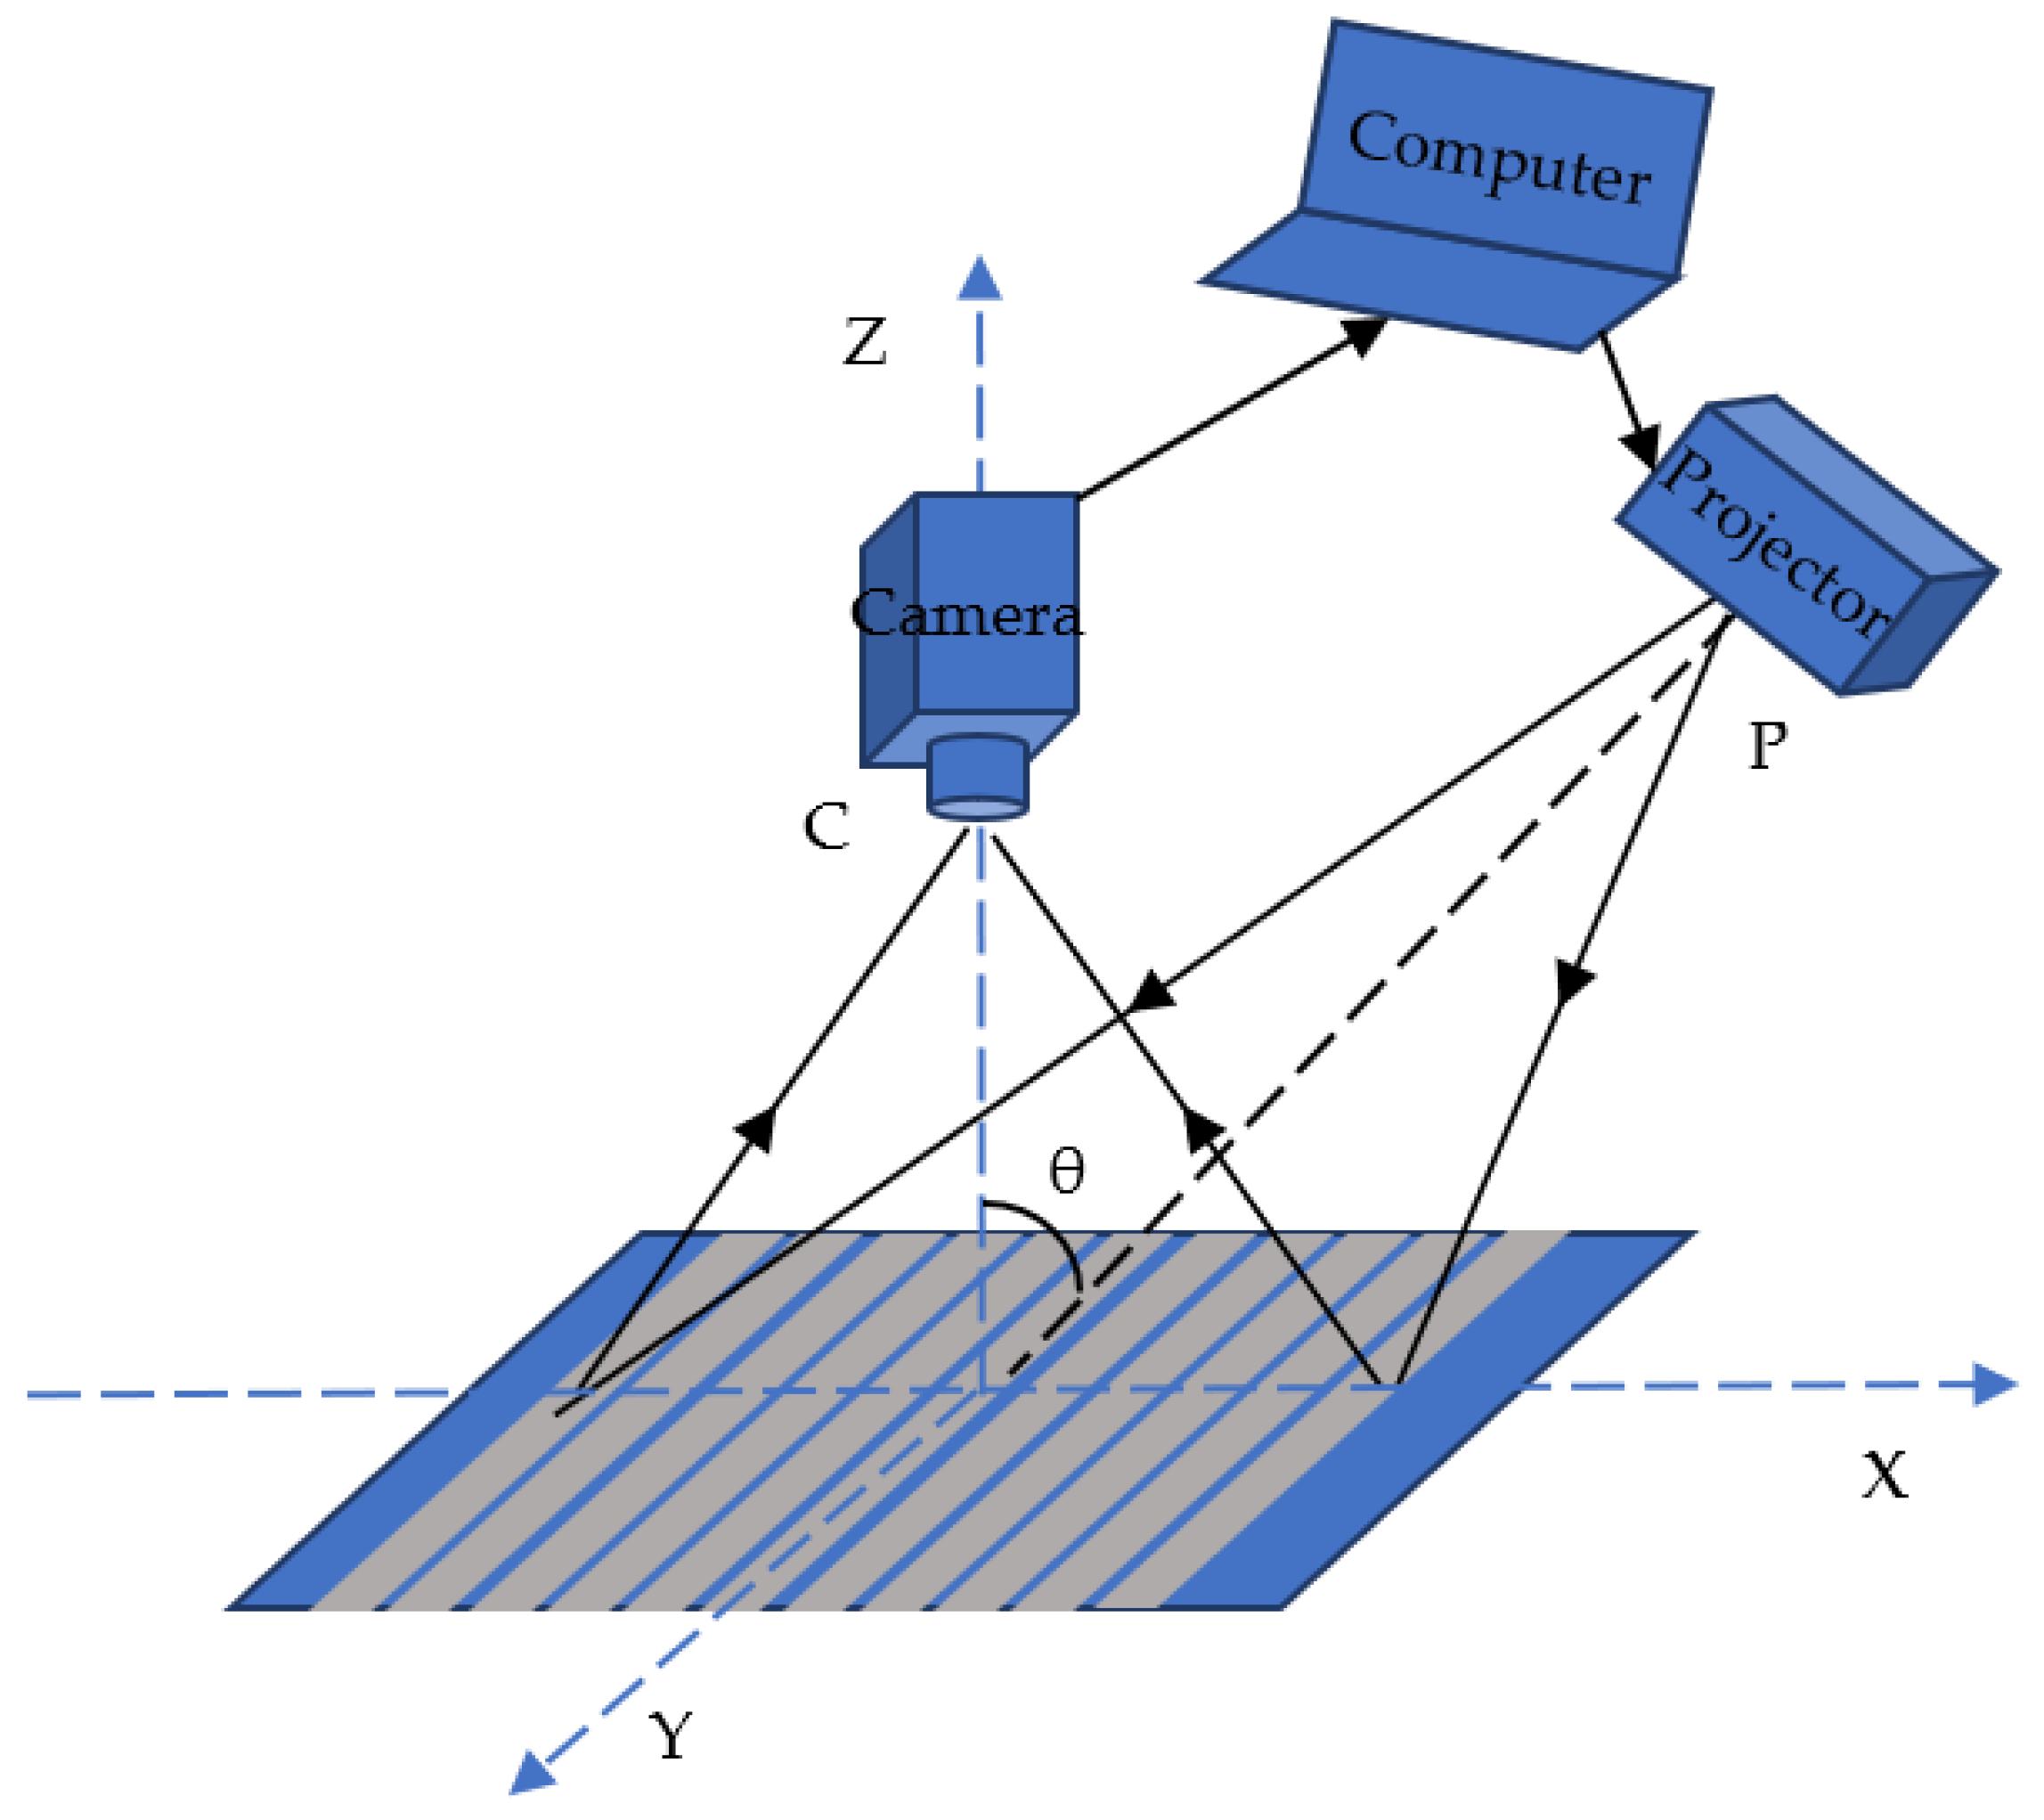
The optical system for 3D reconstruction of object surface based on MP is shown in
Figure 1. The optical axis PO of the projector intersects with the optical axis CO of camera at the O point, the angle is θ in the XOZ plane. The computer is used for controlling the projector to project a sinusoidal grating fringe pattern on the surface of the object, taking the surface of the load table as the reference plane. The height of the object will cause the stripe to deform in the X direction and produce the deformed fringe modulated by the height of the object.
The transmittance of one digital sinusoidal fringe pattern can be expressed as:
where,
represents the image coordinate system,
a and
b are constant, and
is the fringe frequency.
Four sinusoidal grating fringe patterns with a phase difference of
are generated by computer, and the digital fringe pattern is projected to the reference plane by the projector, that is, the height of the object
. The deformed fringe pattern modulated by the reference plane collected by camera can be expressed in the following equations:
In these equations,
represents the camera system coordinate system,
represents the reflectivity distribution of the reference plane,
represents the intensity of the background light,
represents the contrast of the fringe,
is the phase distribution of the deformed fringe pattern on the reference plane,
is the fundamental frequency of the collected fringe pattern, and
is the phase modulation on the reference plane. The DC component
can be eliminated with the help of two fringe patterns with
phase difference. The DC component of
is eliminated by 180° phase shift sinusoidal grating fringe pattern, and the DC component of
is eliminated by 270° phase shift sinusoidal grating fringe pattern. The AC components of
and
can be expressed by Equations (6) and (7):
A digital sinusoidal grating fringe pattern is projected on the surface of the measured object, the deformed fringe pattern modulated by the height of the object obtained by camera can be expressed by Equation (8):
where,
represents the reflectivity distribution of the object surface,
represents the phase distribution of the deformed fringe on the object surface, and
is the phase modulation produced by the measured object and the reference plane. Transform the deformed fringe to frequency domain, and the AC component of the deformed fringe pattern is obtained after the DC component passing the filter.
where,
represents the function of the filter. By multiplying the obtained AC component
with the 0° and 90° phase shift sinusoidal grating fringe pattern AC components
and
, respectively, which can be expressed by Equations (10) and (11):
The second term in Equations (10) and (11) eliminate the phase information of the reference plane and contain the phase information of the object. In order to acquire moire fringe patterns, it is necessary to use frequency domain filtering to extract the second term in Equations (10) and (11). Transform them to the frequency domain and extract them by the filter. The results obtained are recorded as moire fringe pattern 1 and moire fringe pattern 2, respectively, which are expressed as Equations (12) and (13):
where,
represents the function of the low-pass filter used for extracting moire fringe patterns. The phase distribution modulated by the height of the object can be expressed as Equation (14):
The phase calculated by Equation (14) is within the interval
range of the inverse trigonometric function, rather than a continuous value, while the phase distribution corresponding to the height distribution of the object is continuous. The phase unwrapping method can restore the wrapped phase to the continuous one, and realize the 3D reconstruction of the object through the phase-height mapping relation.
where,
represents the height of the object and
represents the continuous value of the phase change caused by the height of the object. The values of
,
and
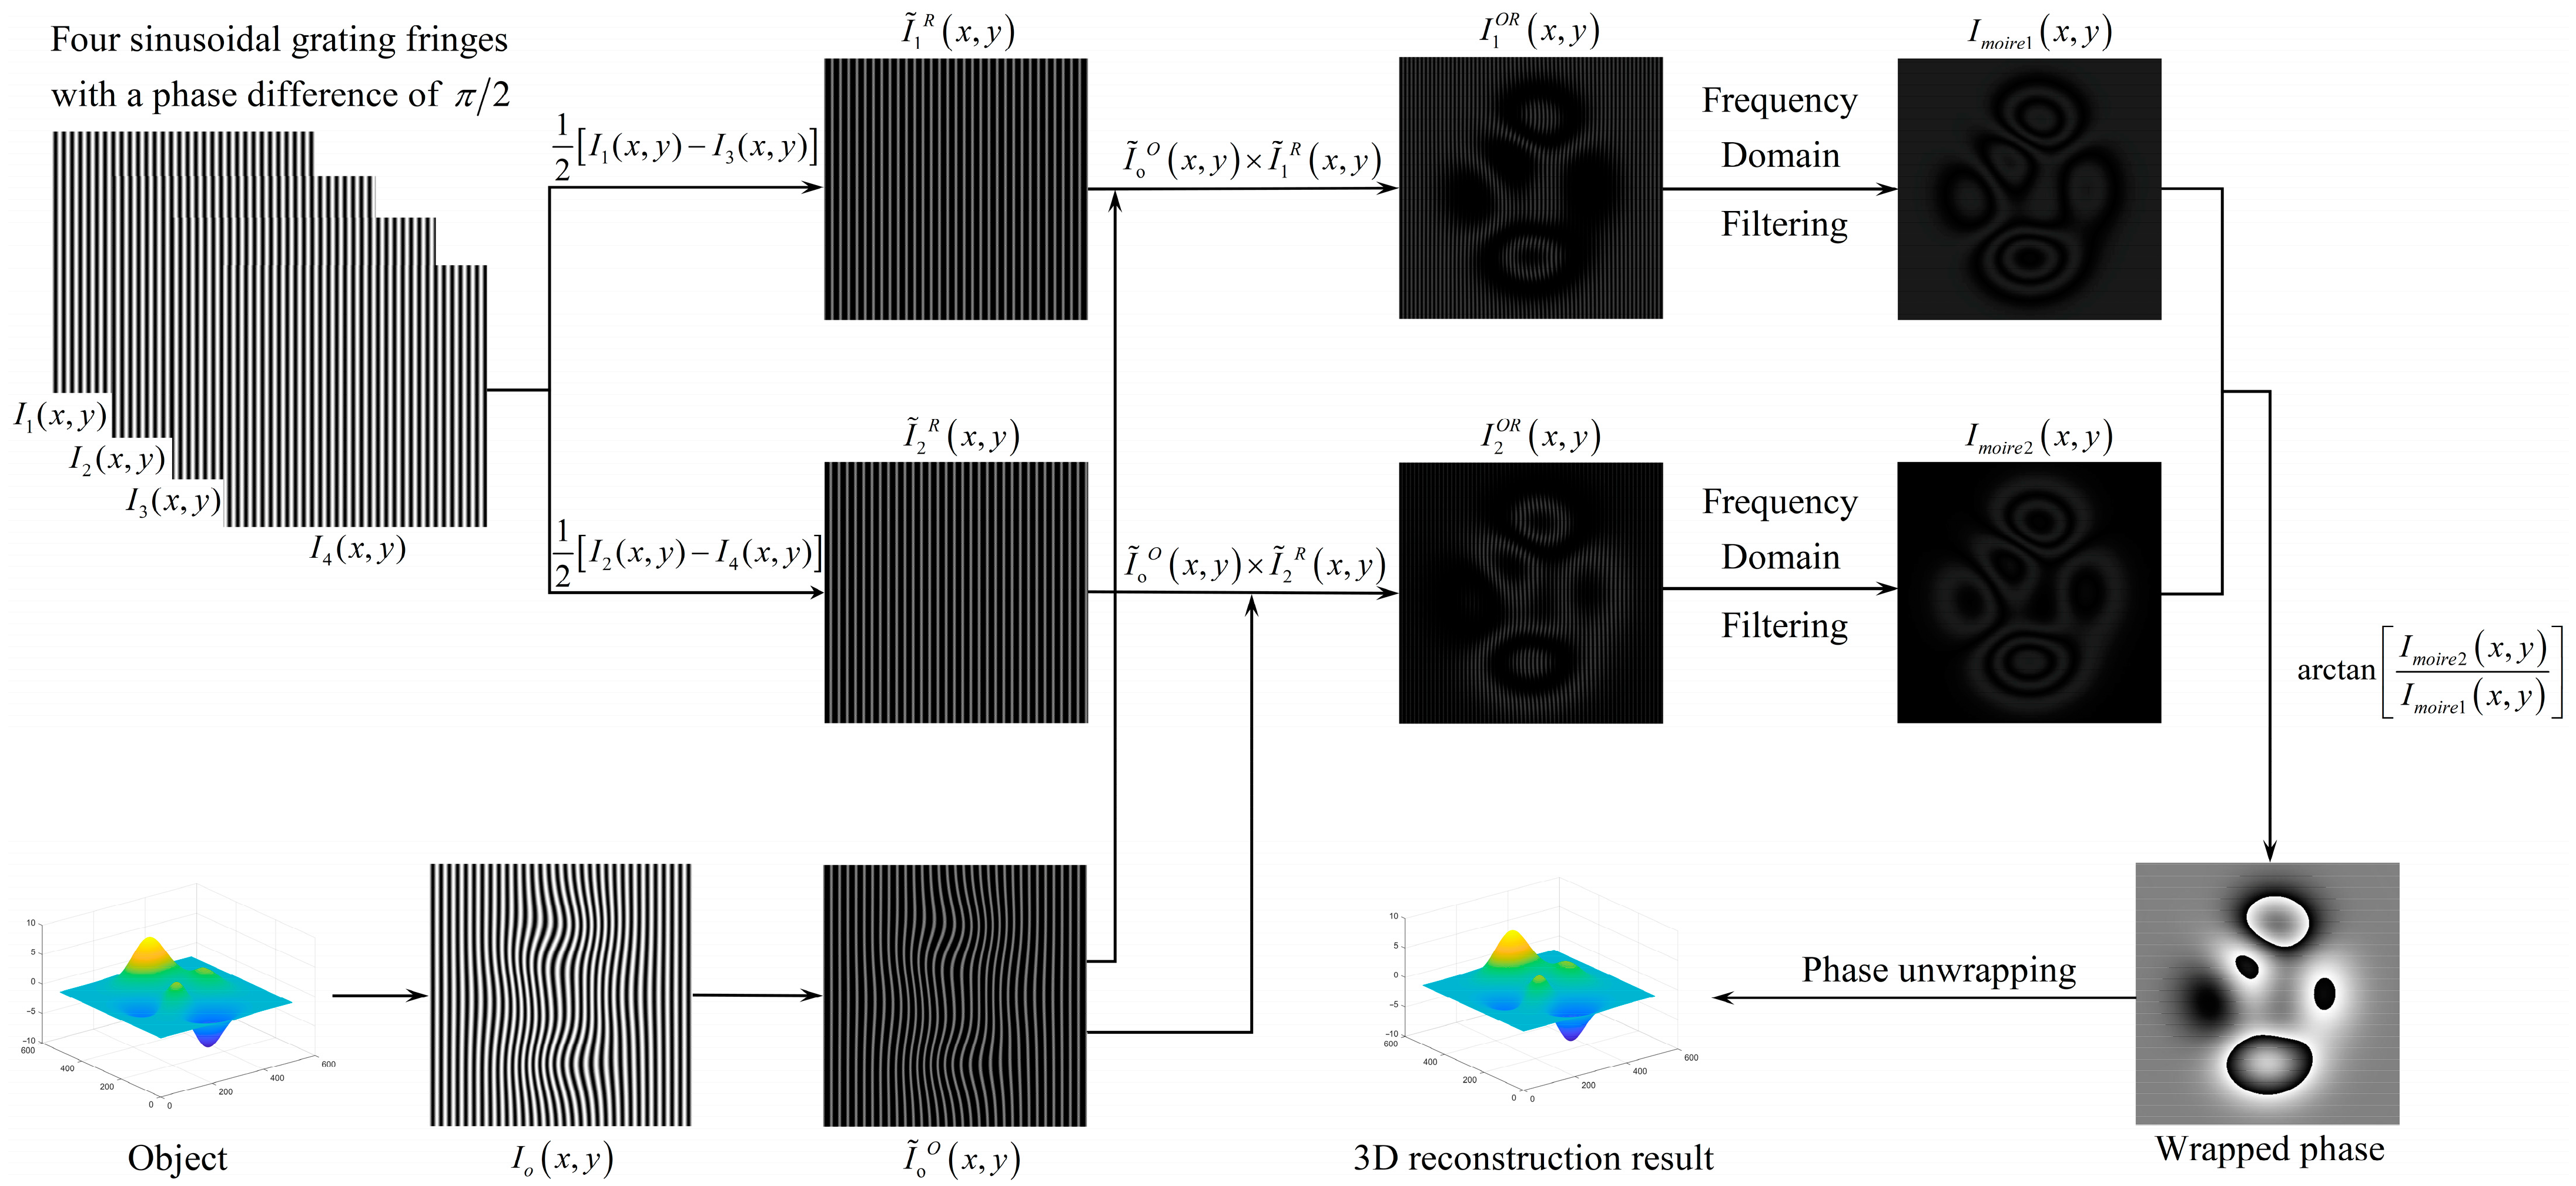
can be obtained by measuring three planes of known height and then solving the system of equations or by reconstructing more known planes then using the least square method to solve. The flow chart of the specific steps is shown in
Figure 2.
3. Simulation Experiment and Analysis
3.1. Simulation
Use the simulation software to build the peaks function as the object to be tested. The simulation software used in this paper is MATLAB, and the peaks function used can be expressed as Equation (16):
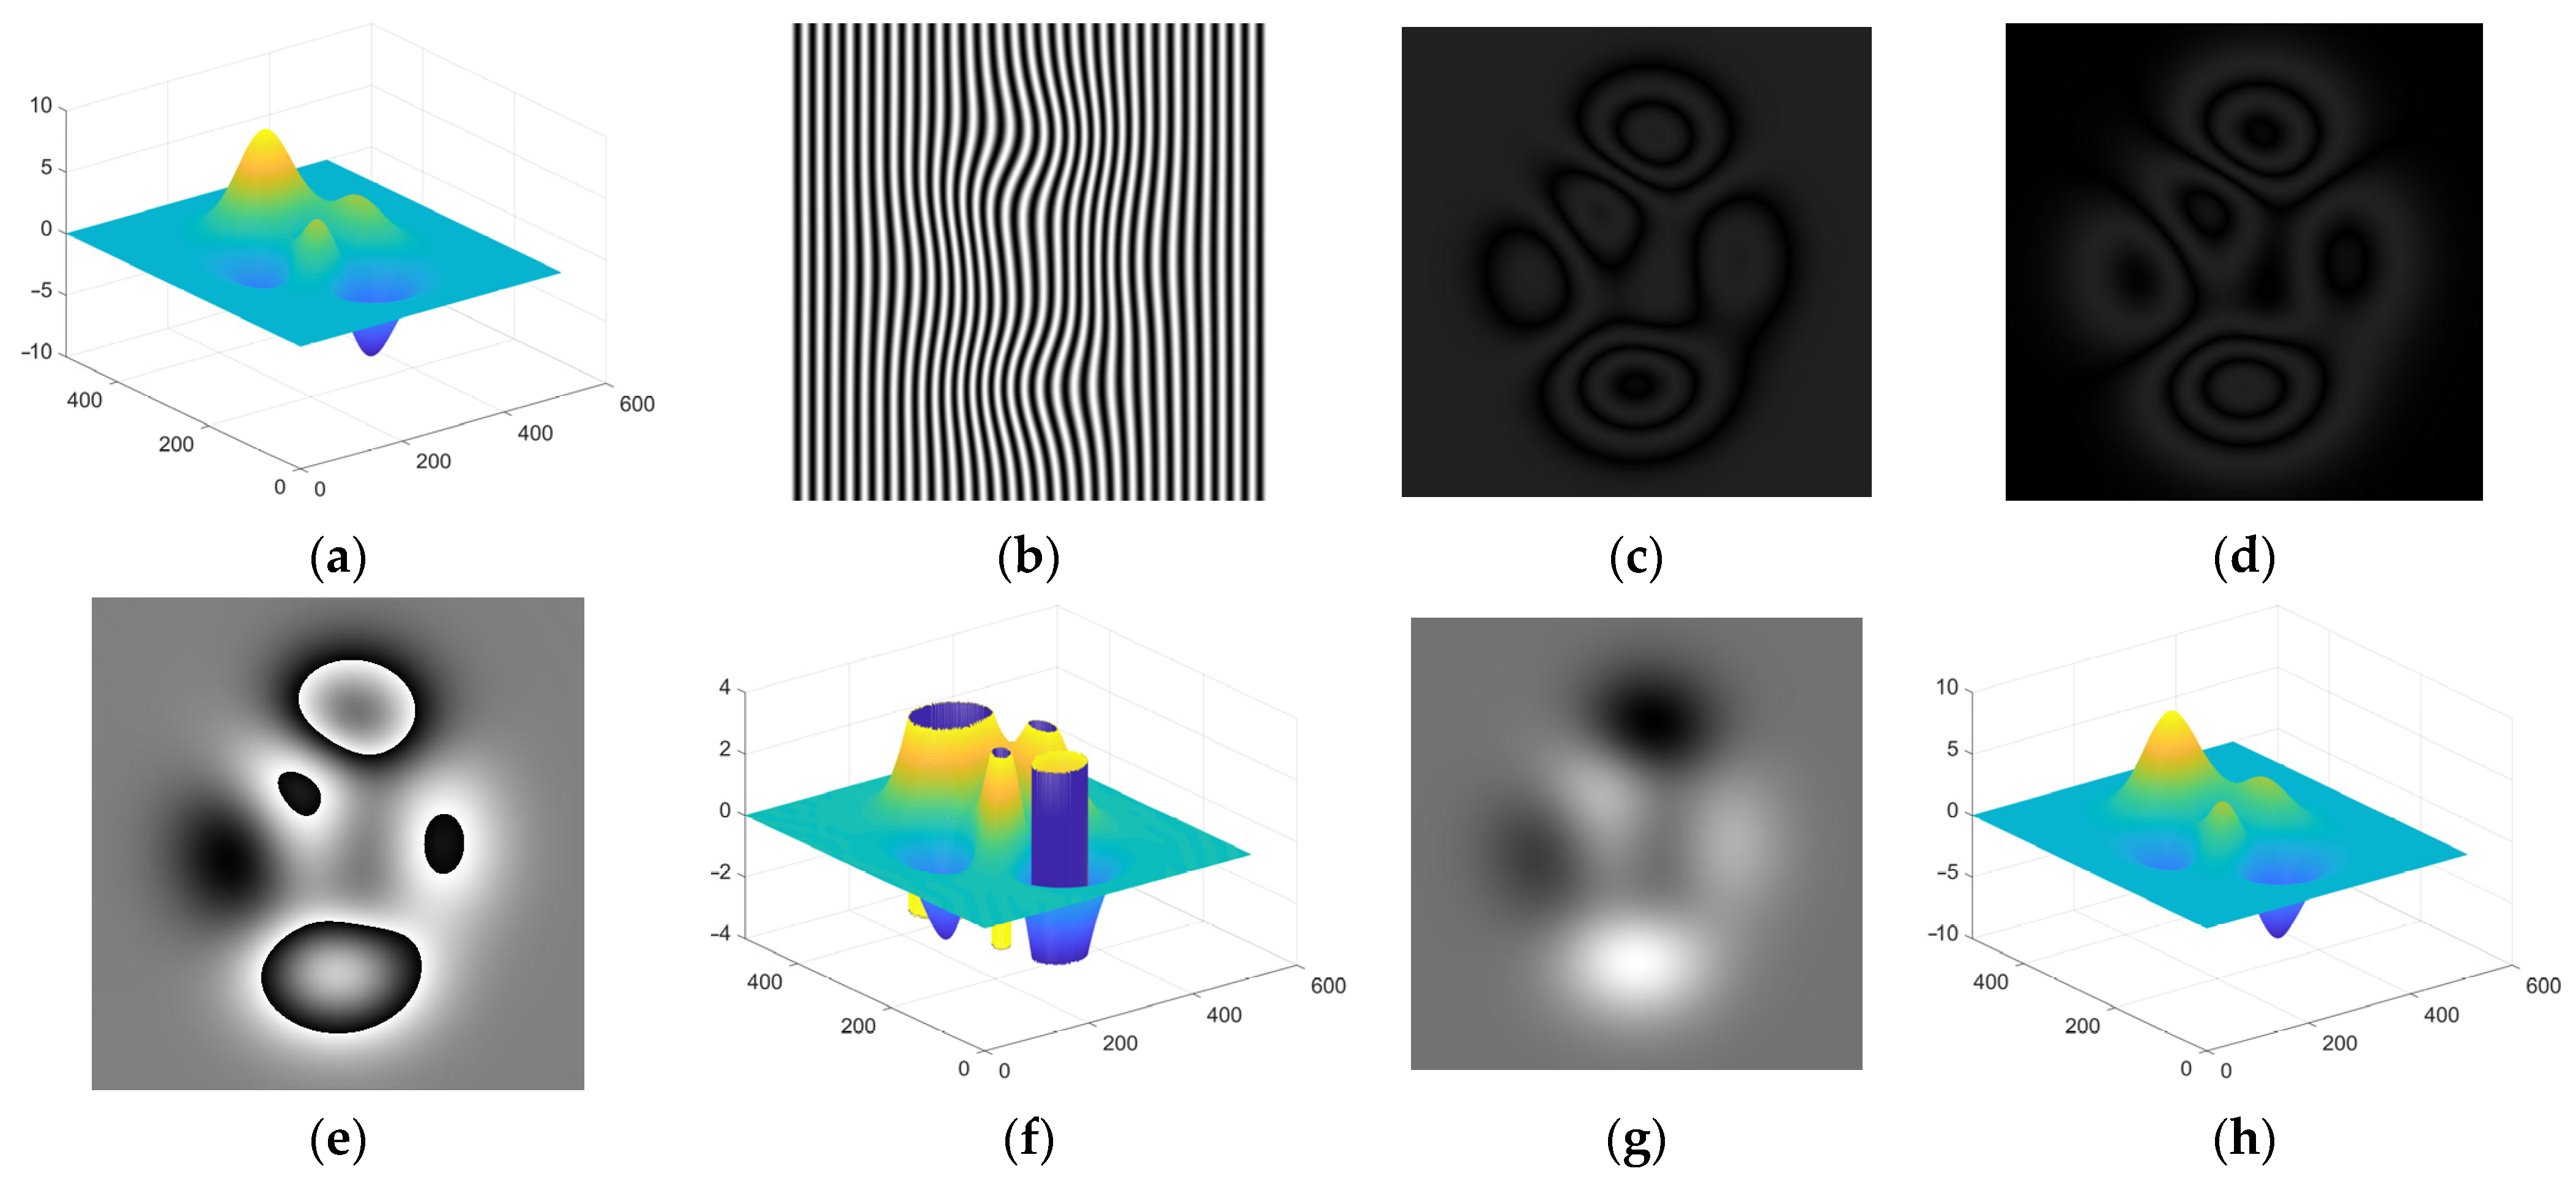
Gaussian matrix can be generated by using peaks function, as shown in
Figure 3a. In the simulation experiment, the grating is projected onto the surface of the object to get a deformed fringe pattern, as shown in
Figure 3b. The size of the projection grating is 512 × 512 pixels, and the period p
0 is 16 pixels. The moire fringe pattern 1 and 2 shown in
Figure 3c,d can be obtained according to the flow chart of
Figure 2. Then the wrapped phase modulated by the height of the object and its reconstruction results are acquired, as shown in
Figure 3e,f. Finally, after phase unwrapping, the continuous phase is obtained as shown in
Figure 3g, and the 3D reconstruction of the original object is realized, as shown in
Figure 3h.
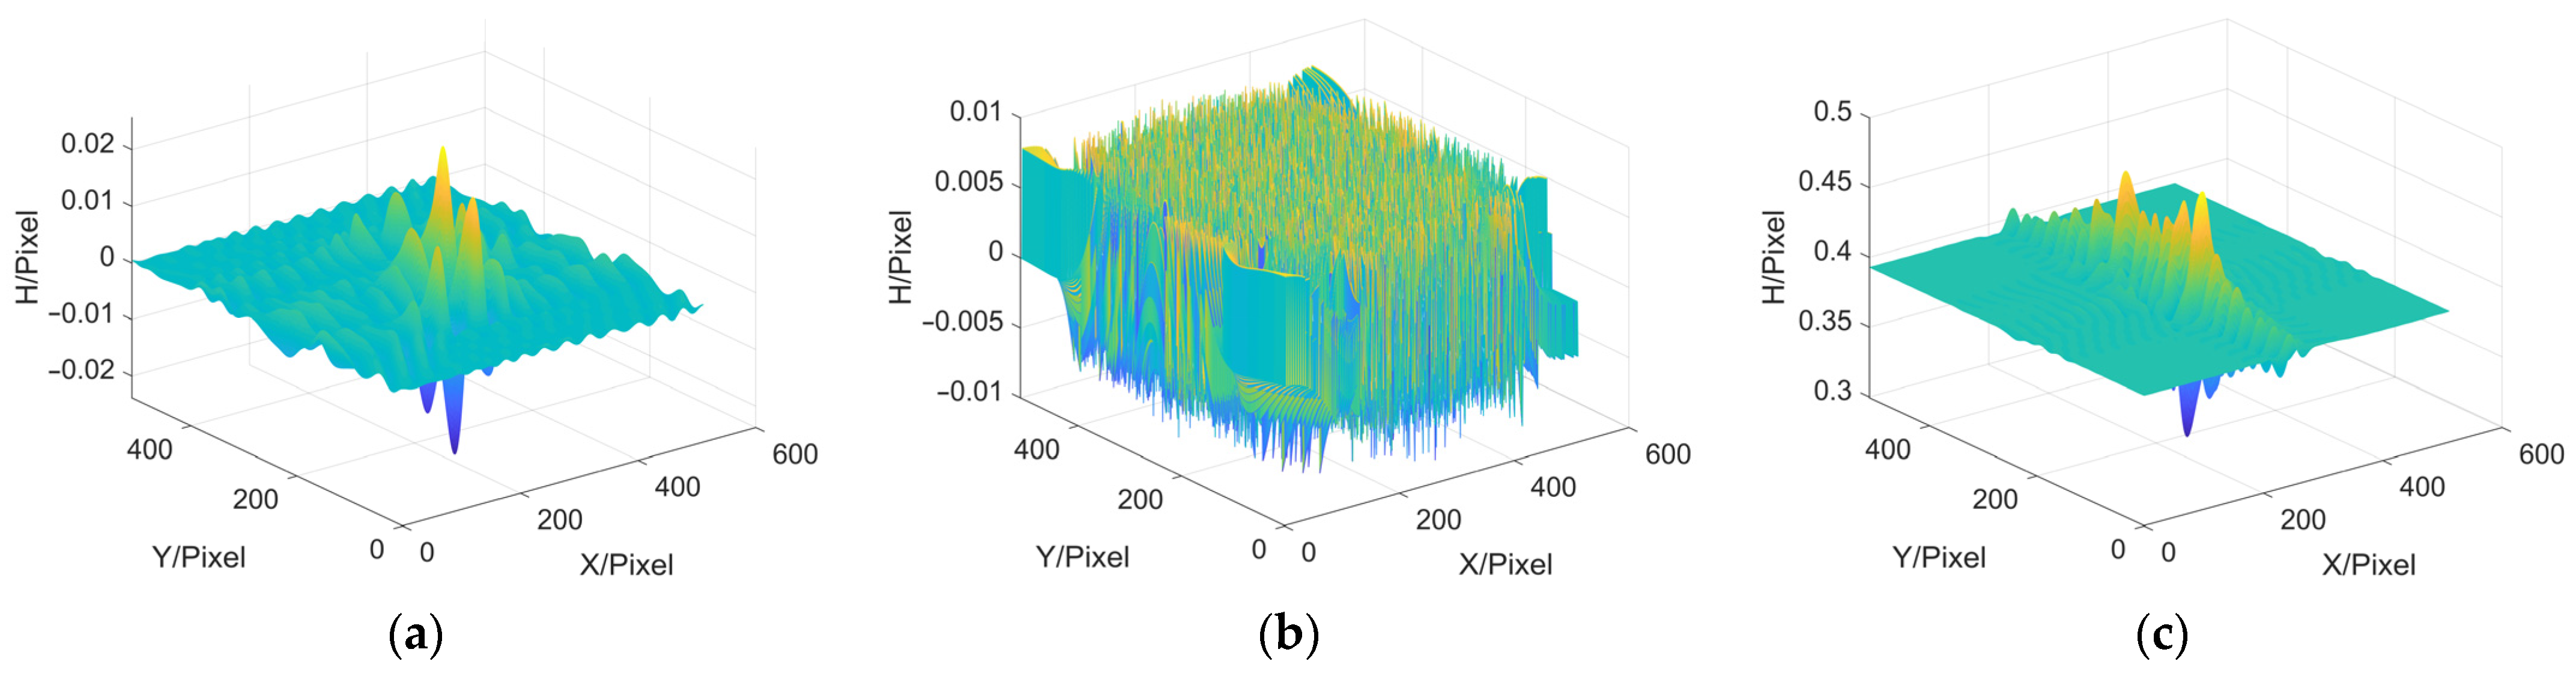
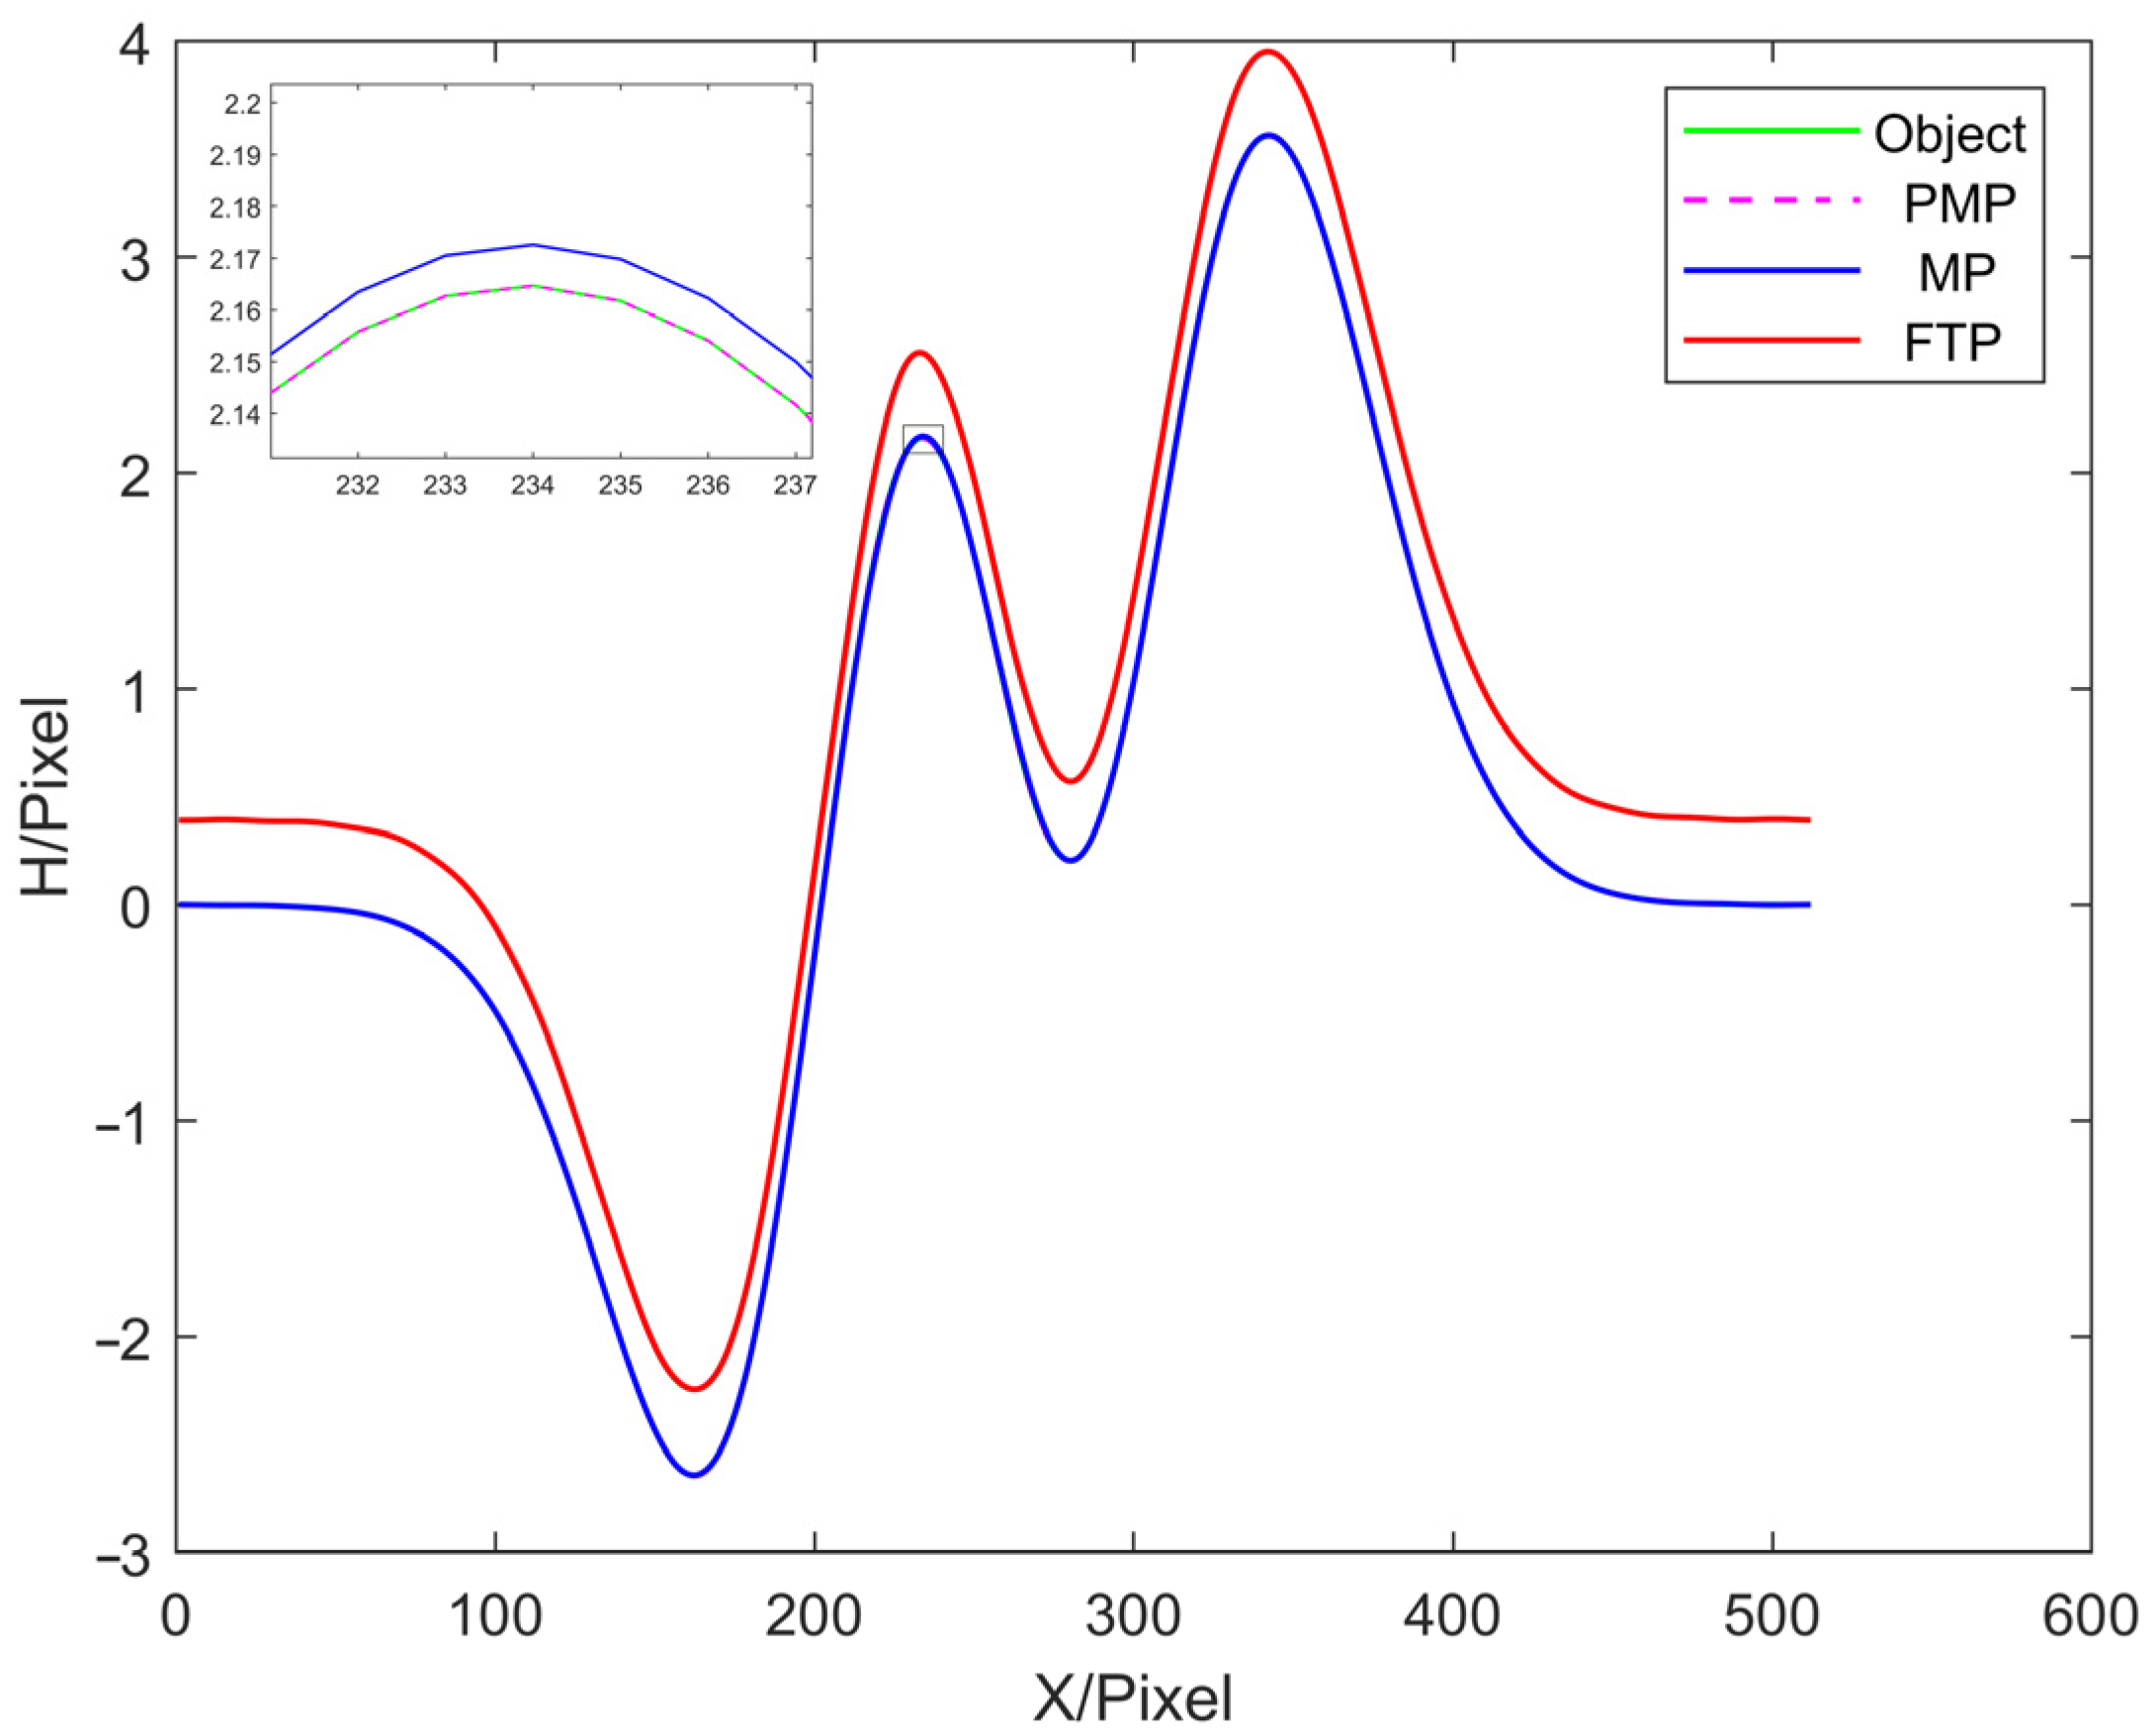
In this paper, three commonly used 3D reconstruction methods are selected for simulation experiment comparison, which are the MP, PMP and FTP methods. The error distributions between the reconstruction results and the object to be tested are shown in
Figure 4. Then, the height of the 250th column of the object to be tested and the reconstruction results are compared, as shown the cutaway views in
Figure 5. The experimental results are shown in
Table 1.
In terms of reconstruction results, the accuracy of PMP is the highest, and the accuracy of MP and FTP is lower than that of PMP due to the need for frequency domain filtering. However, unlike FTP, the accuracy of MP is only slightly lower than that of PMP. It can also reconstruct the 3D shape of the object accurately, indicating that it still has good detection ability even with the characteristics of single-frame reconstruction.
3.2. Frequency Domain Filtering
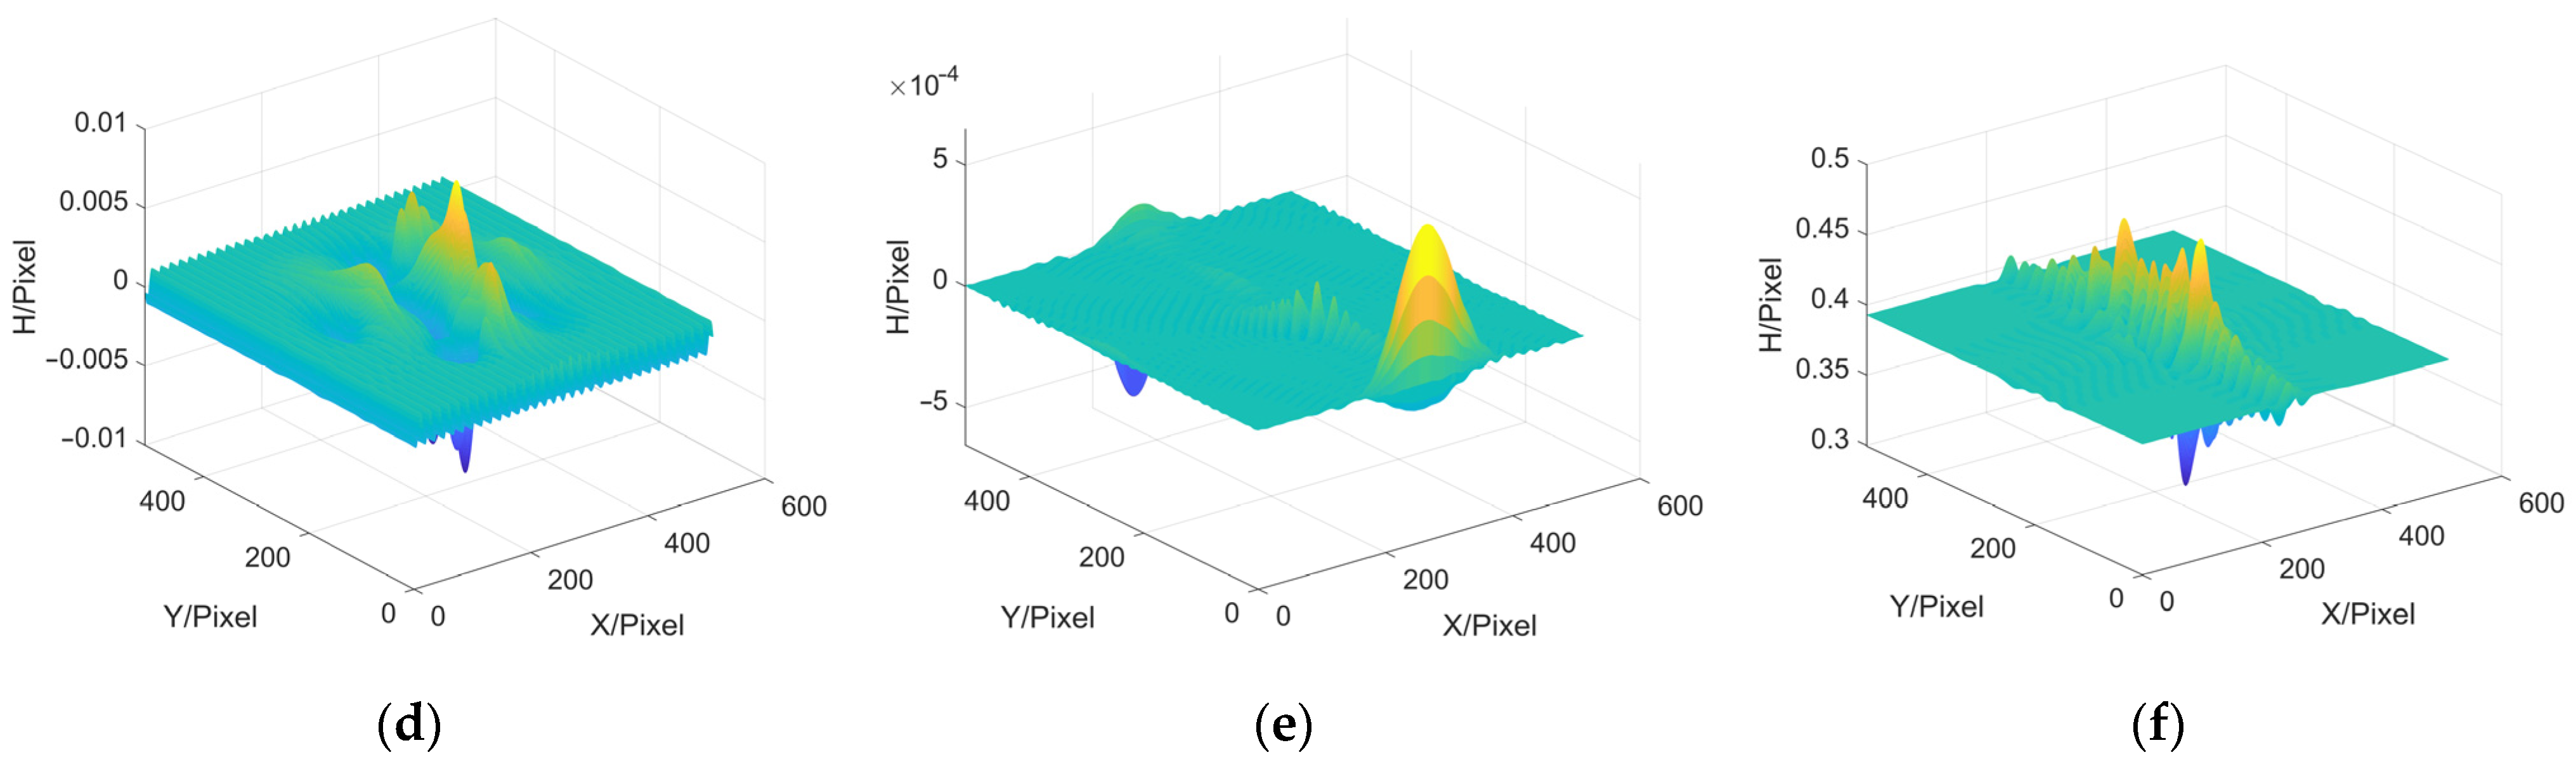
Next, we discuss the influence of filter window on the accuracy of MP. In this paper, ideal low-pass filter, Hanning window, Blackman window, Kaiser window and Hilbert transform are selected and applied to the step of extracting moire fringe in MP, and the MP reconstruction error results of each filtering method are acquired. In addition, the reconstruction error results obtained by the FTP method, which also belongs to single-frame measurement, are displayed and used to compare the reconstruction accuracy of the FTP method and the MP method as a whole. The error results are shown in
Figure 6 and
Table 2.
In
Table 2,
represents the average height, while MAX, MAE and RMSE represent the maximum error, the average absolute error and the root mean square error, respectively. In addition, the average height of the peaks model generated by the simulation software is 0.22192. From the above results, it can be seen that in the step of extracting moire fringe by MP method, the error of using the Blackman window is the largest and that of using the Hilbert transform is the smallest. And no matter which filtering method is used, the reconstruction result of the MP method is better than that of the FTP method.
Under this noise-free simulation condition, the MP method has higher accuracy than the same single-frame method FTP. Furthermore, in the MP method, if we perform one Hilbert transform to a signal, taking the opposite number of the result, and perform another Hilbert transform to the new result, the DC component of the original signal could be well filtered, so as to get satisfied results.
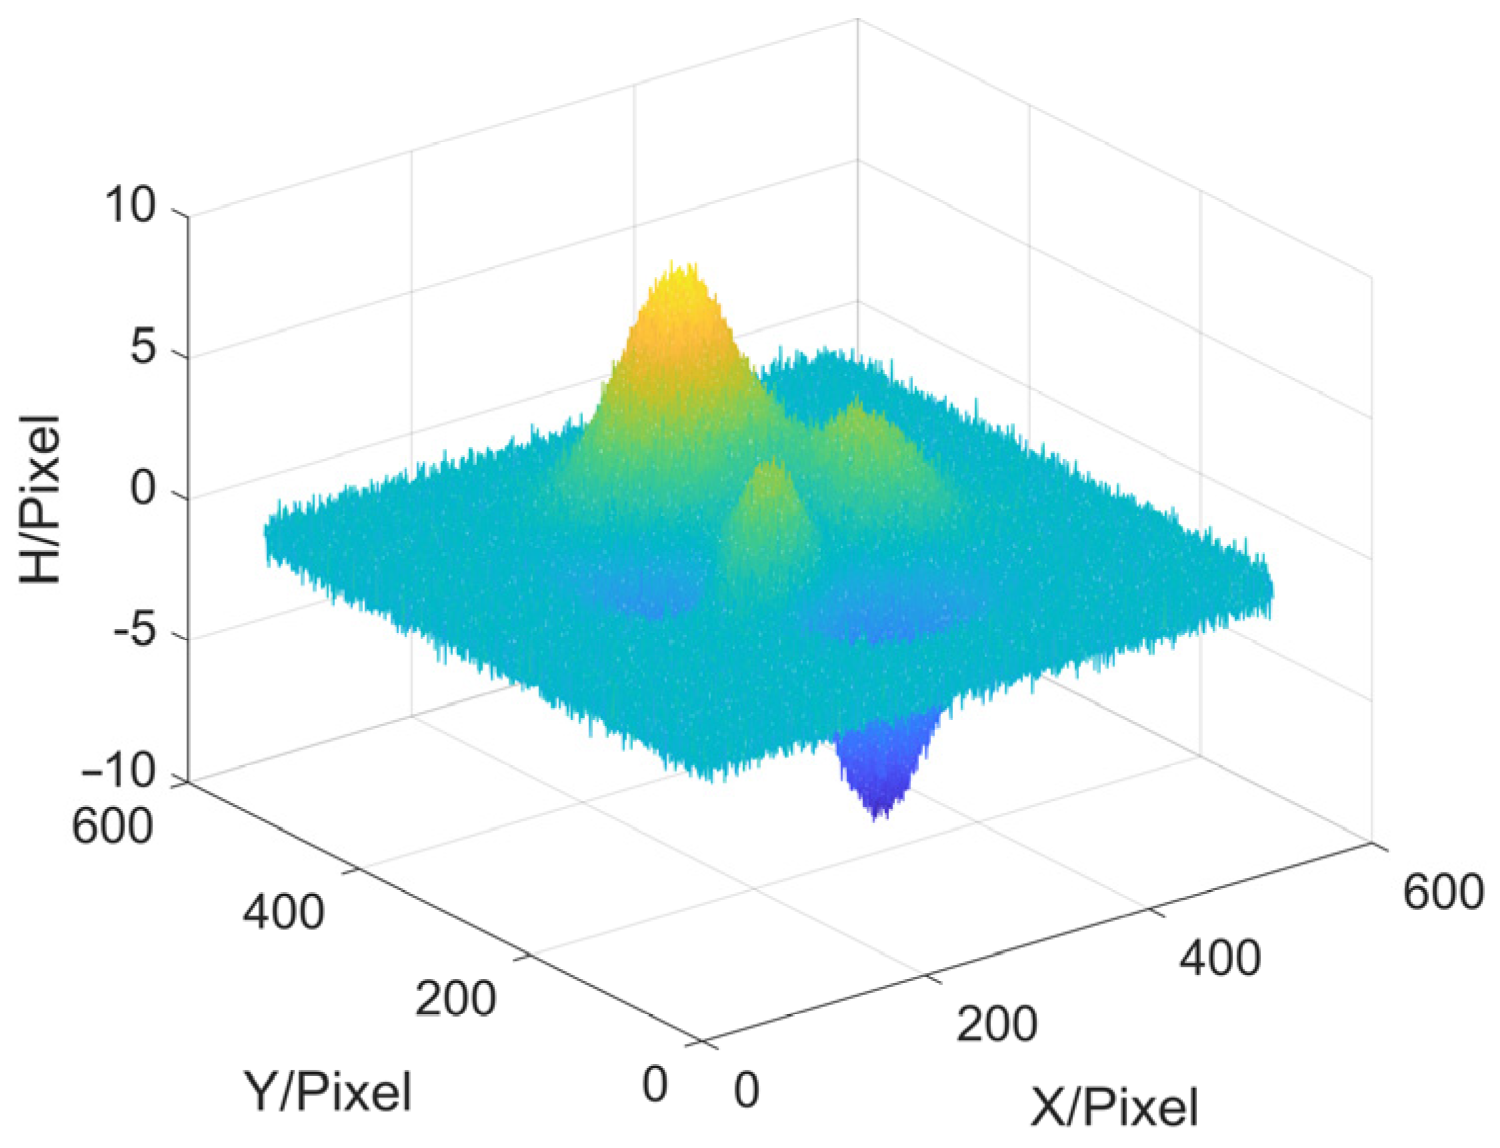
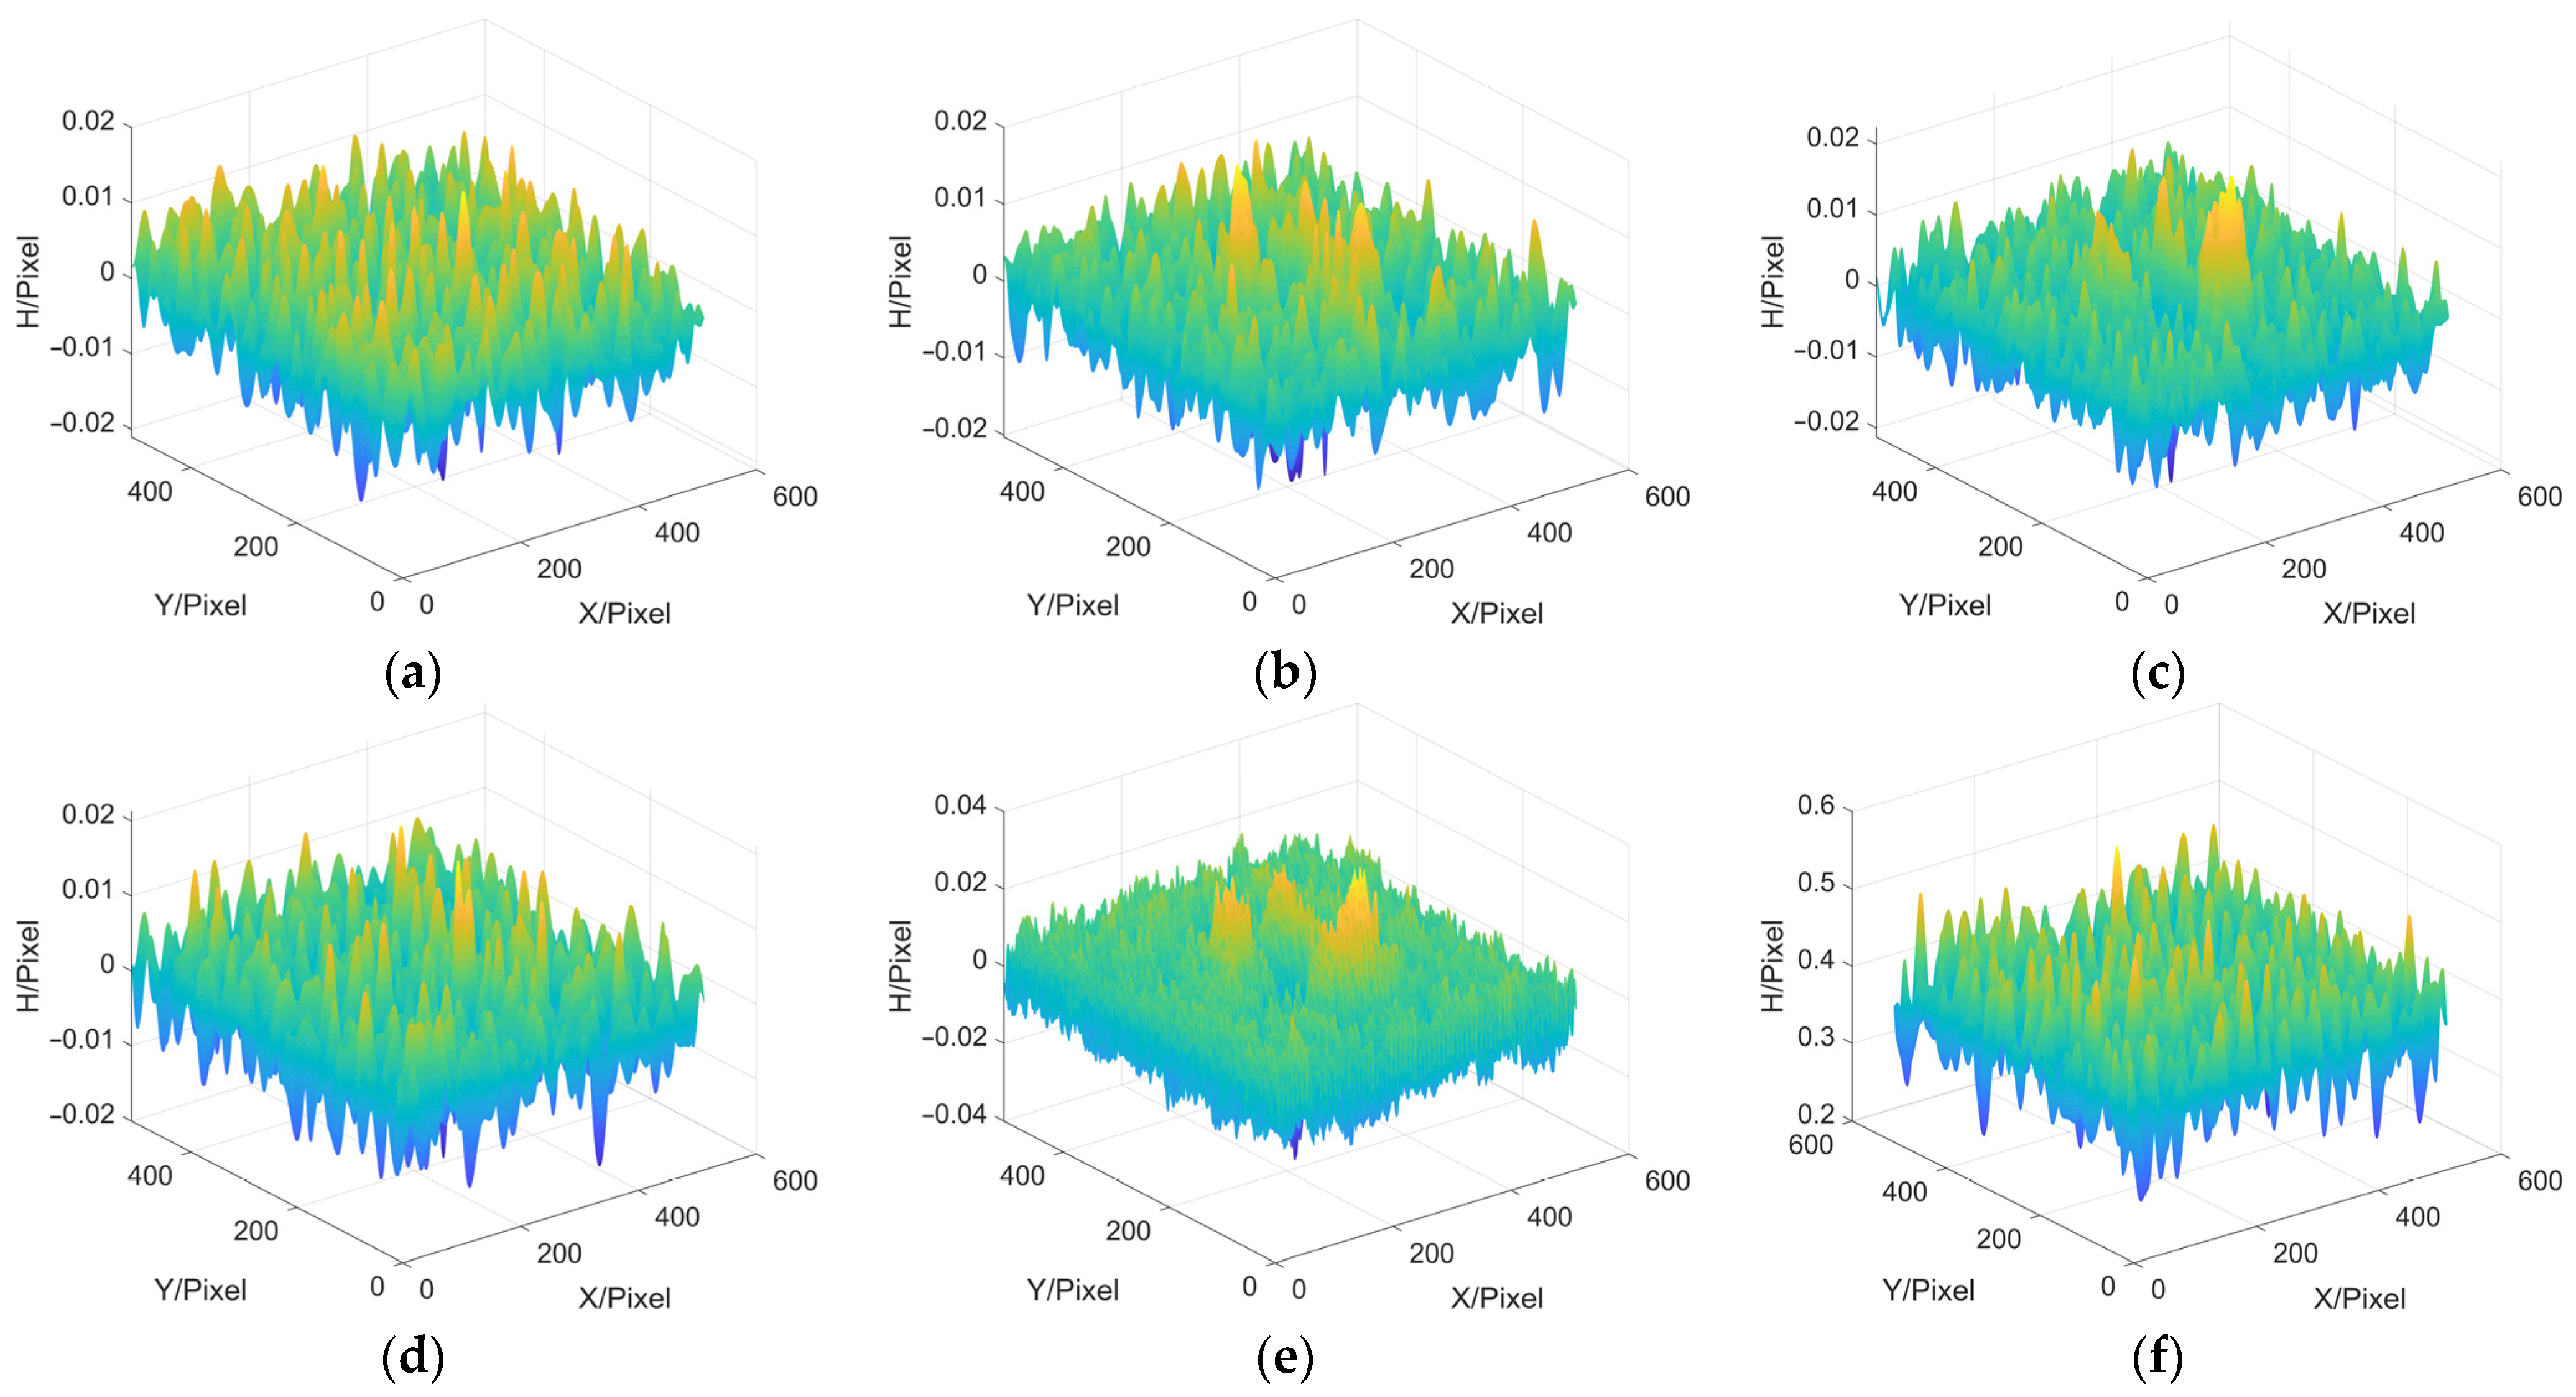
Next, we try to add noise to the object to prove the anti-noise performance of MP method. The noise added is a 512 × 512 normal distribution random number matrix with a standard deviation of 0.4, and the object with noise to be tested is shown in
Figure 7. The error results and data of the simulation are shown in
Figure 8 and
Table 3.
The average height of the object with noise to be tested is 0.22192, too. It can be seen that, different from the previous conclusion, when the captured images contain a lot of noise, the results obtained by the MP method with different filters are similar, but the results are still better than that of the FTP.
In order to verify whether MP is also suitable for railway wheel measurement, a wheel tread is then created as an object to be tested, and one sinusoidal grating fringe pattern is projected onto its surface, as shown in
Figure 9.
Following the steps of MP, deformed fringe pattern, moire fringe pattern 1, moire fringe pattern 2, wrapped phase and continuous phase are obtained, as shown in (a), (b), (c), (d) and (e) in
Figure 10, respectively.
The final reconstruction result of the wheel tread is shown in
Figure 11, and the 3D shape of the original wheel tread can be seen clearly. This simulation shows that MP can not only reconstruct peaks function, but can also be suitable for the measurement of railway wheels.
3.3. Experiment
In order to further prove the effectiveness and application of digital MP, it is applied to wheel tread detection.
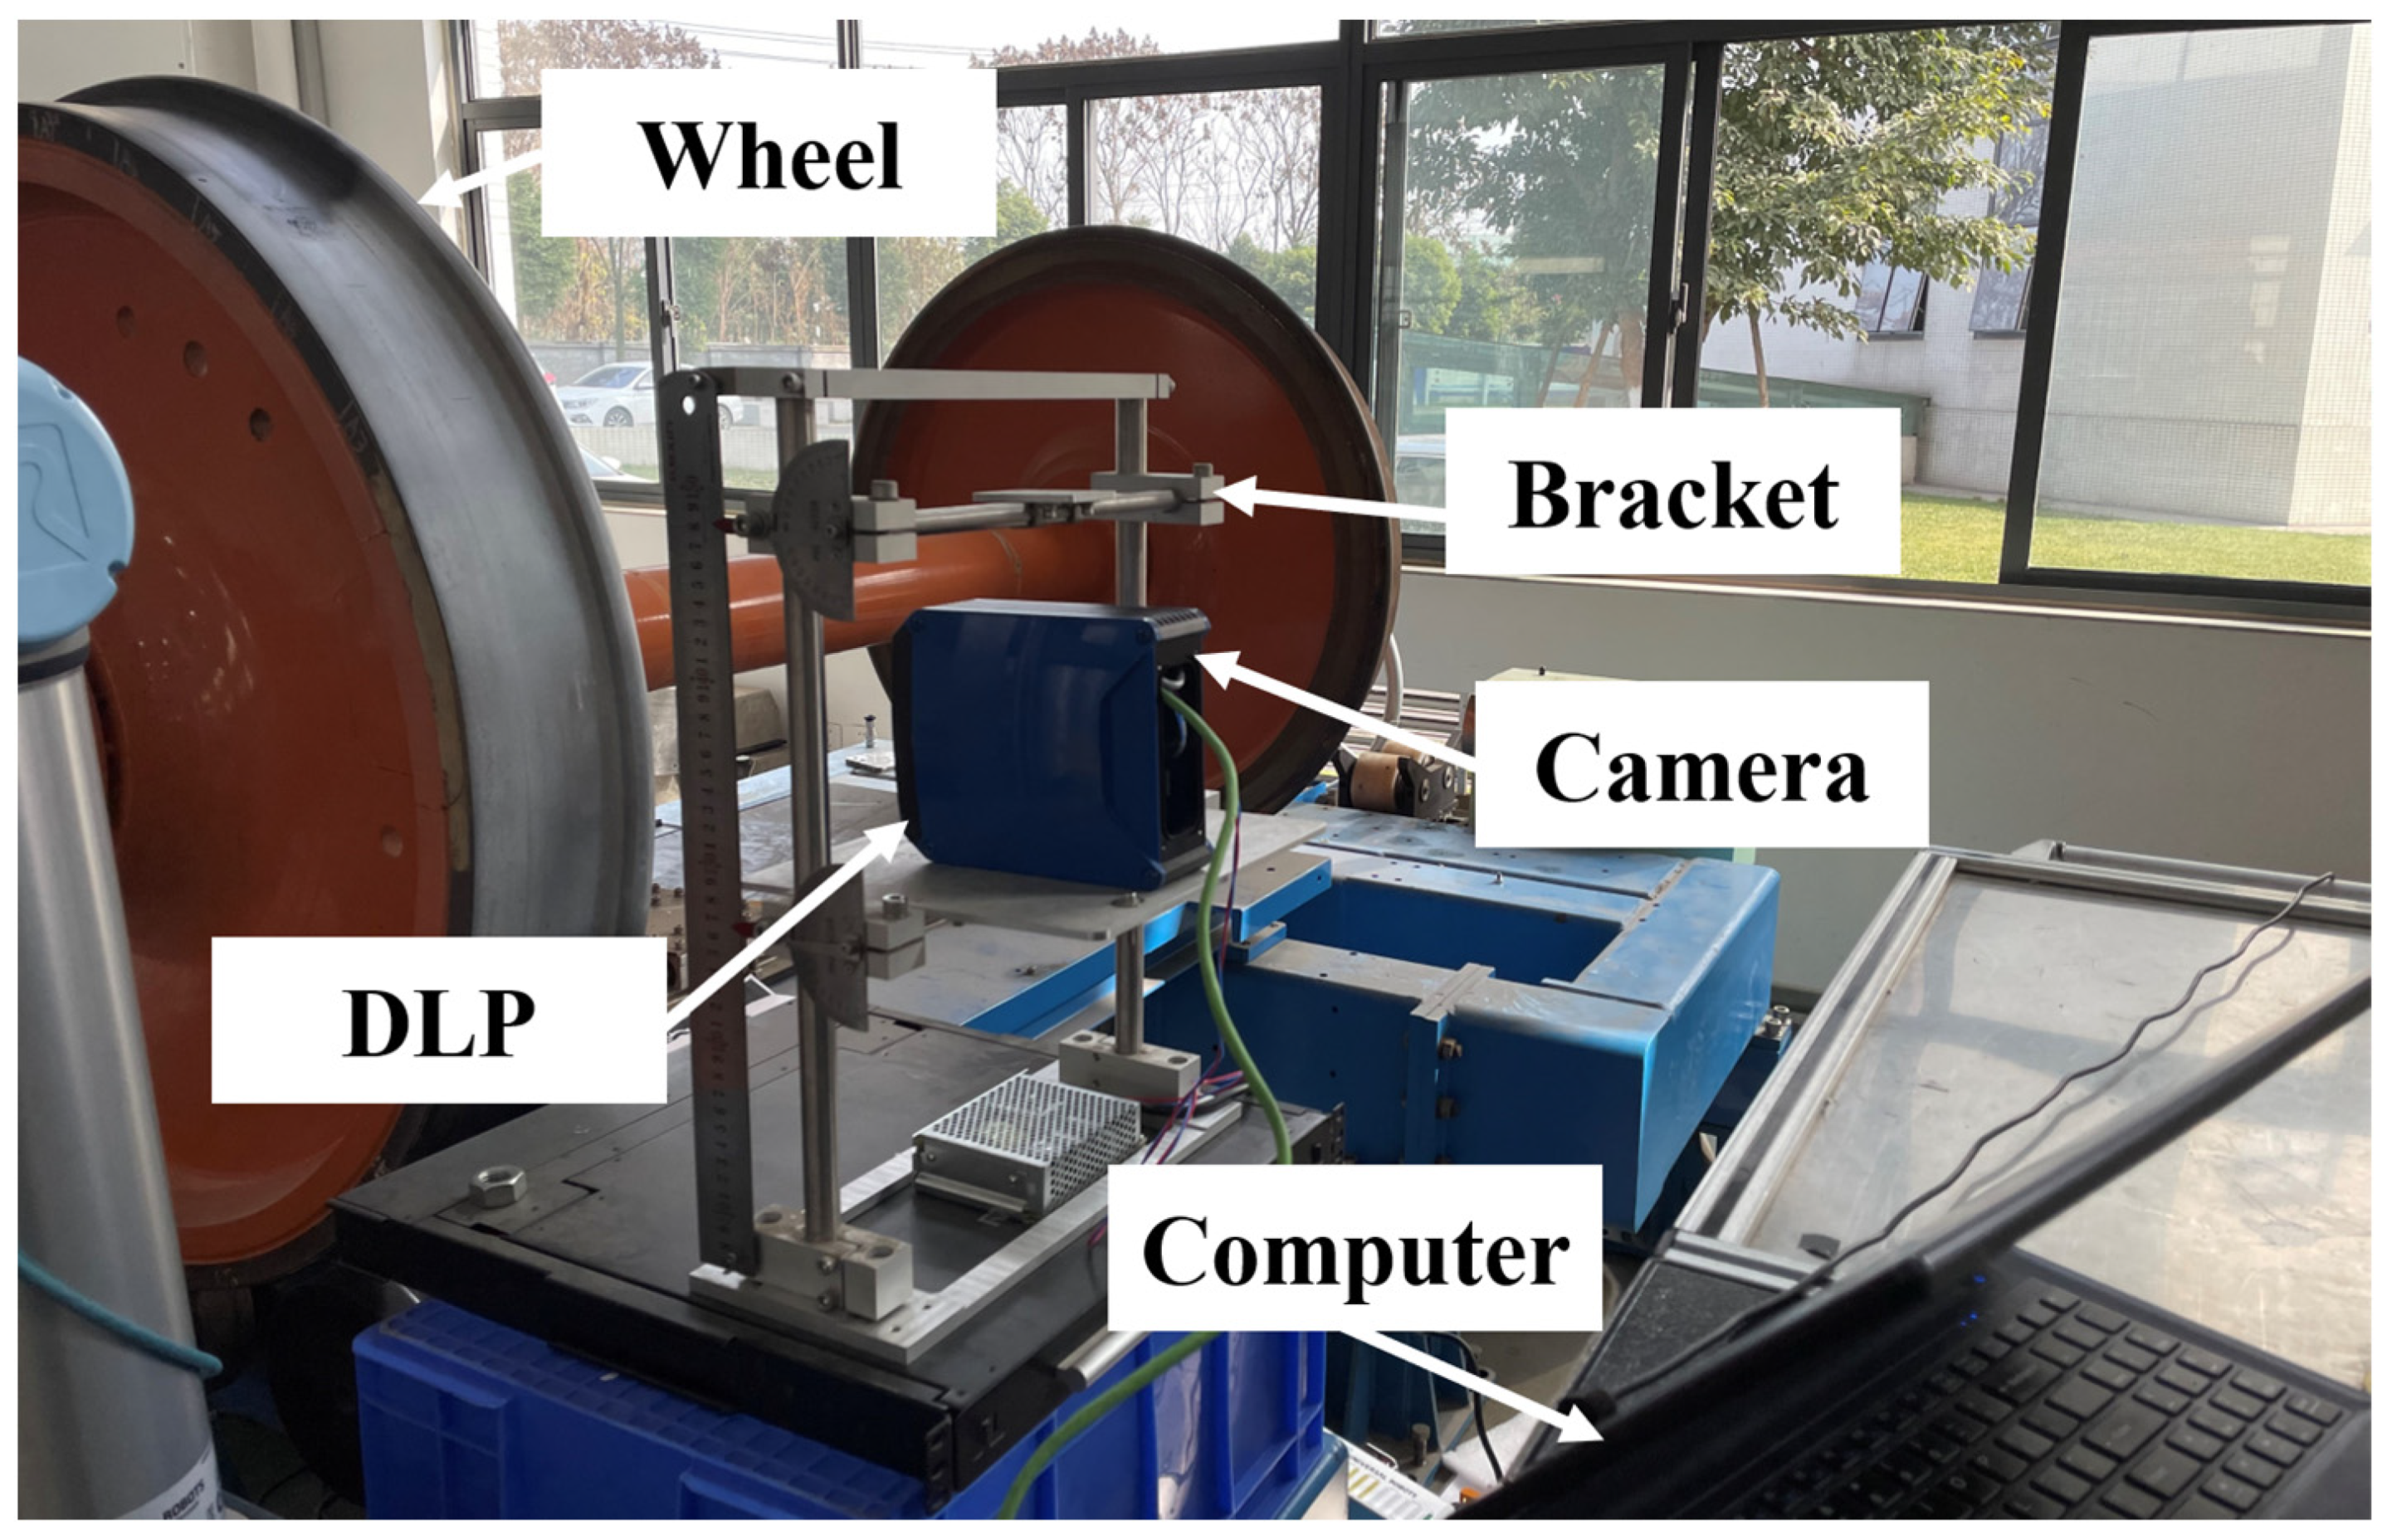
First of all, the wheel tread experiment platform needs to be built, as shown in
Figure 12. The experimental platform is composed of CMOS camera, digital light processing (DLP) projector, computer, bracket, railway wheel and so on. The railway wheel is the object to be tested in this experiment, and the MP will be used to reconstruct the 3D profile of the wheel tread. The model of the CMOS camera used in this experiment is Basler acA1920-40gm with the resolution of 1200 × 1920 pixels and the model of the DLP is LightCrafter4500. Before the wheel tread detection experiment, the experimental system needs to be calibrated in order to obtain the phase-height mapping relationship, and the calibration platform is shown in
Figure 13.
Next, four sinusoidal grating fringe patterns with a phase difference of
are generated. The fringe spatial period p
0 is 16 pixels, which is projected to the reference plane and collected by CMOS camera. The AC component is obtained by calculating and processing the patterns, so as to eliminate the influence of background light. Then a sinusoidal fringe pattern is selected and projected to the wheel tread, and the deformation pattern modulated by the wheel tread is collected by the CMOS camera. The result is shown in
Figure 14a. According to the flow of
Figure 2, the moire fringe patterns 1 and 2 are obtained respectively as shown in
Figure 14b,c. After calculating the wrapped phase and phase unwrapping, the 3D reconstruction results of the wheel tread are obtained.
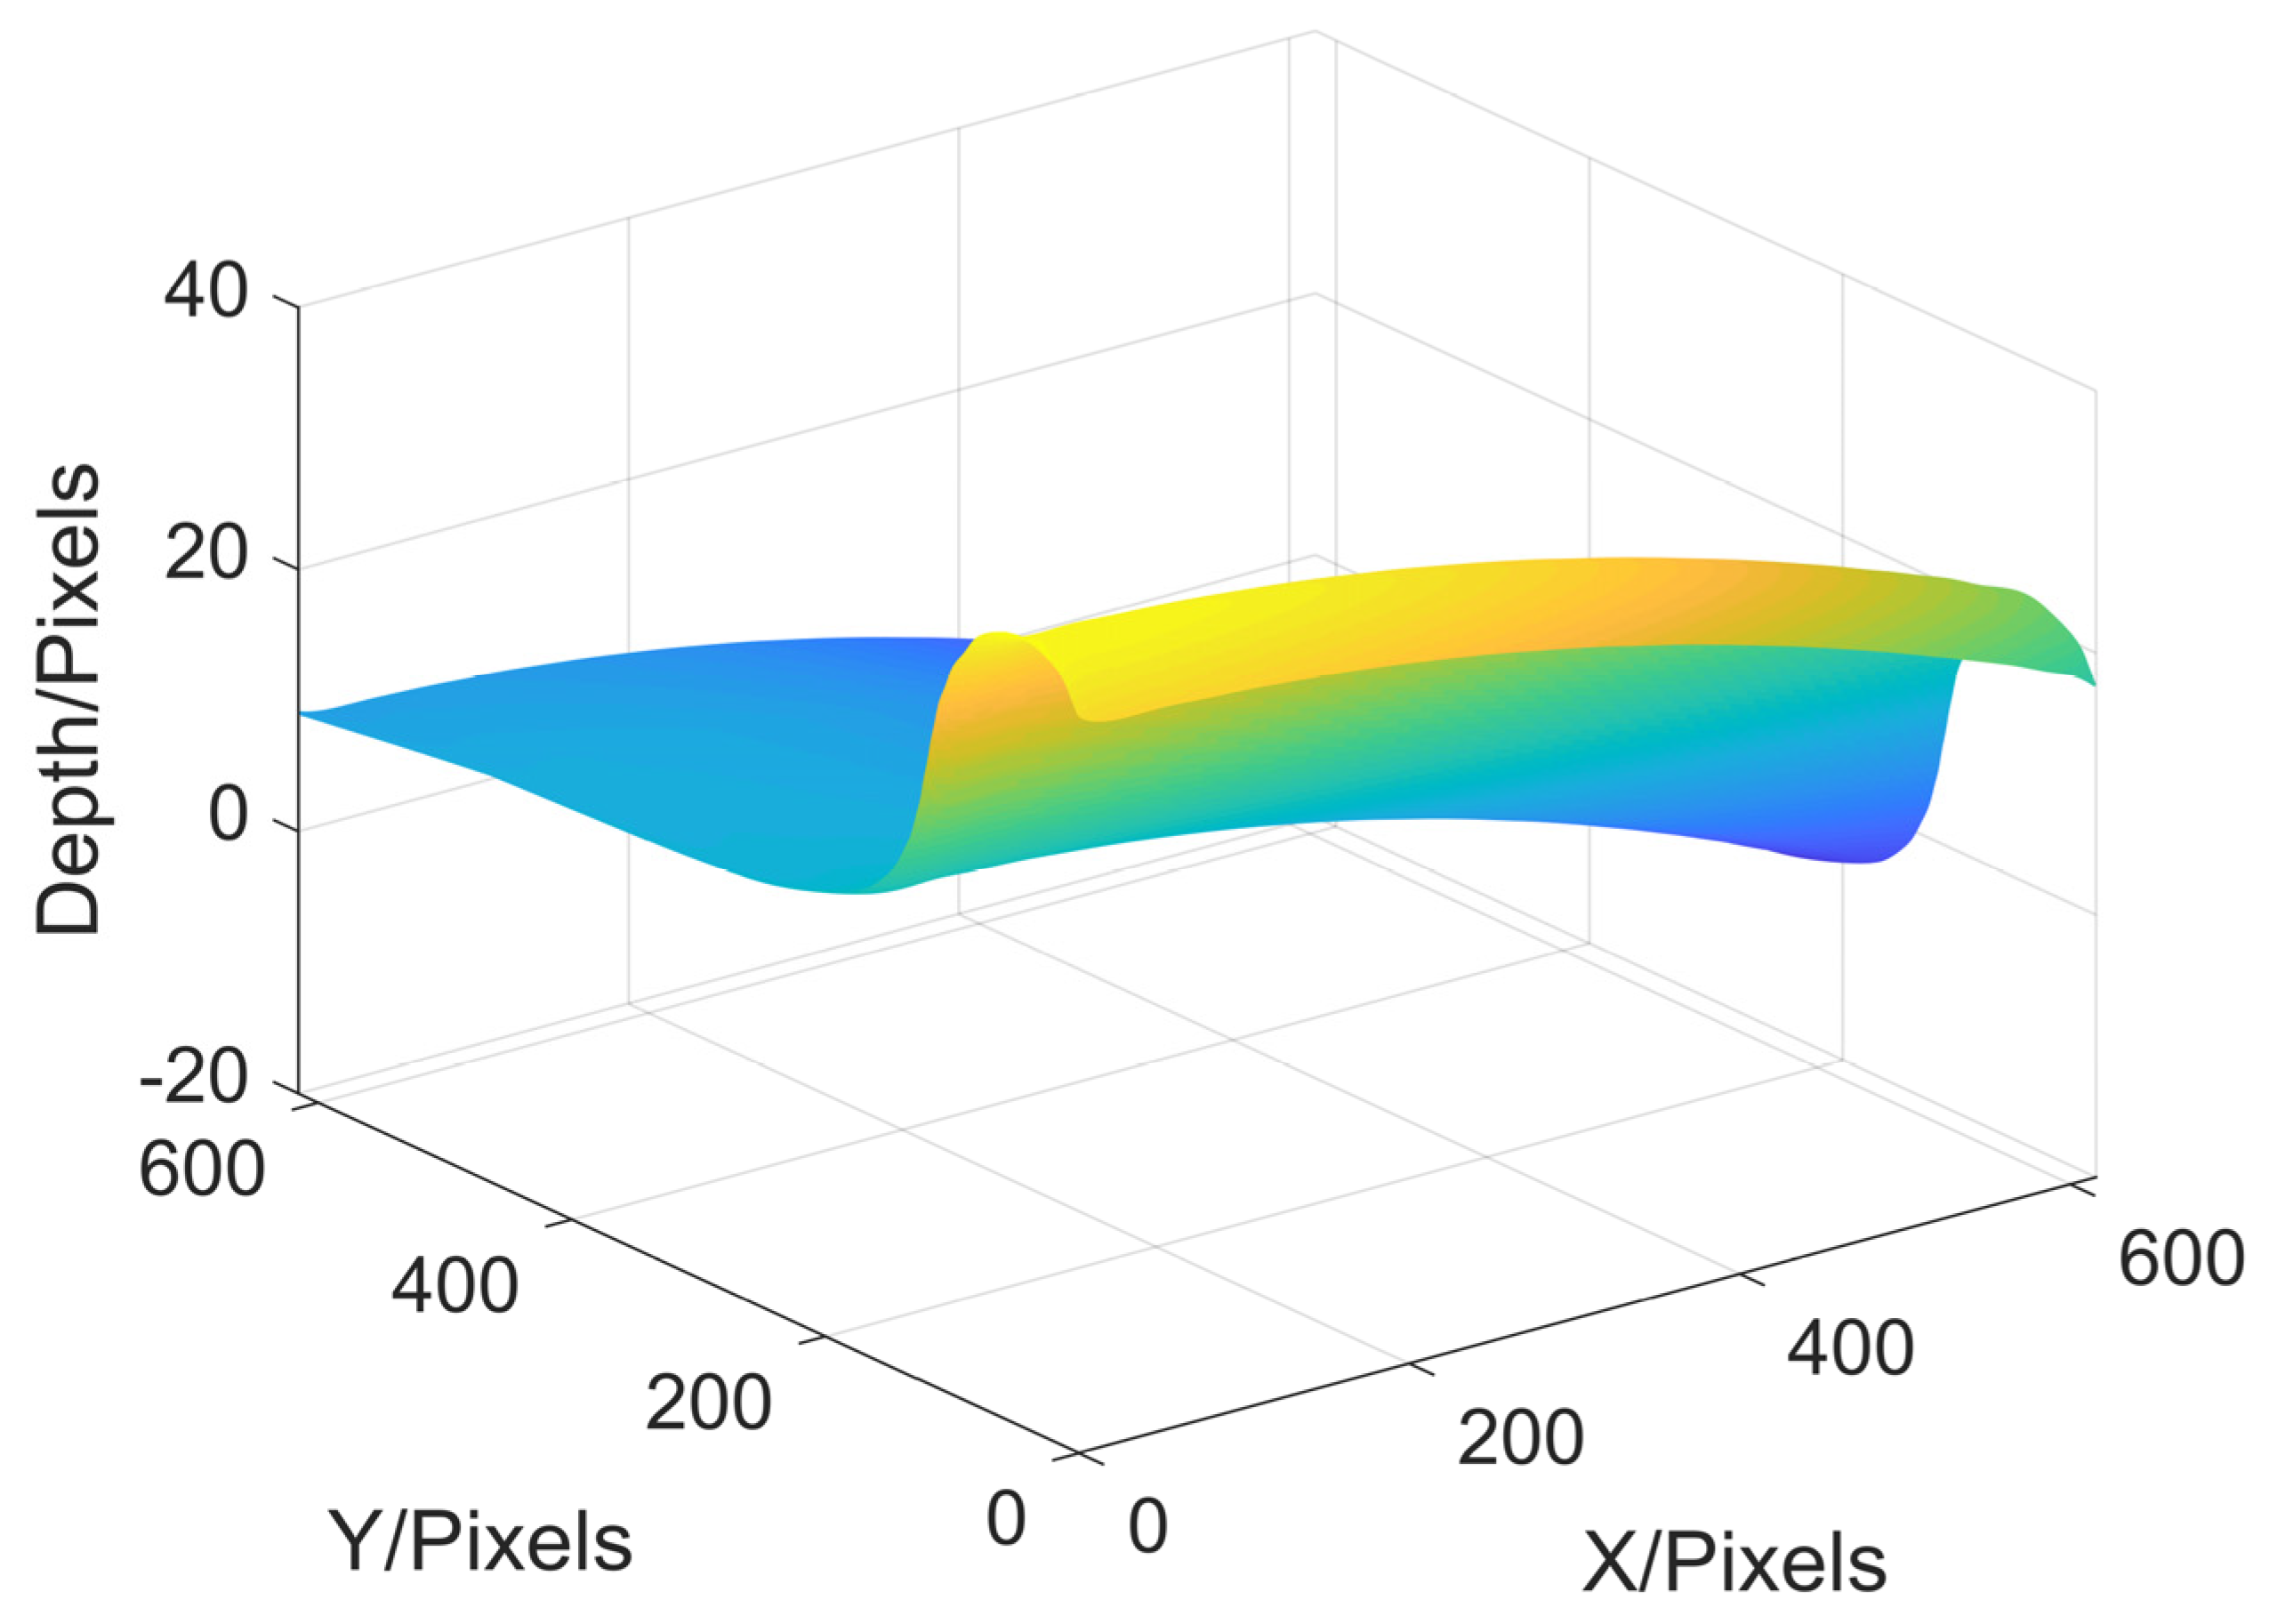
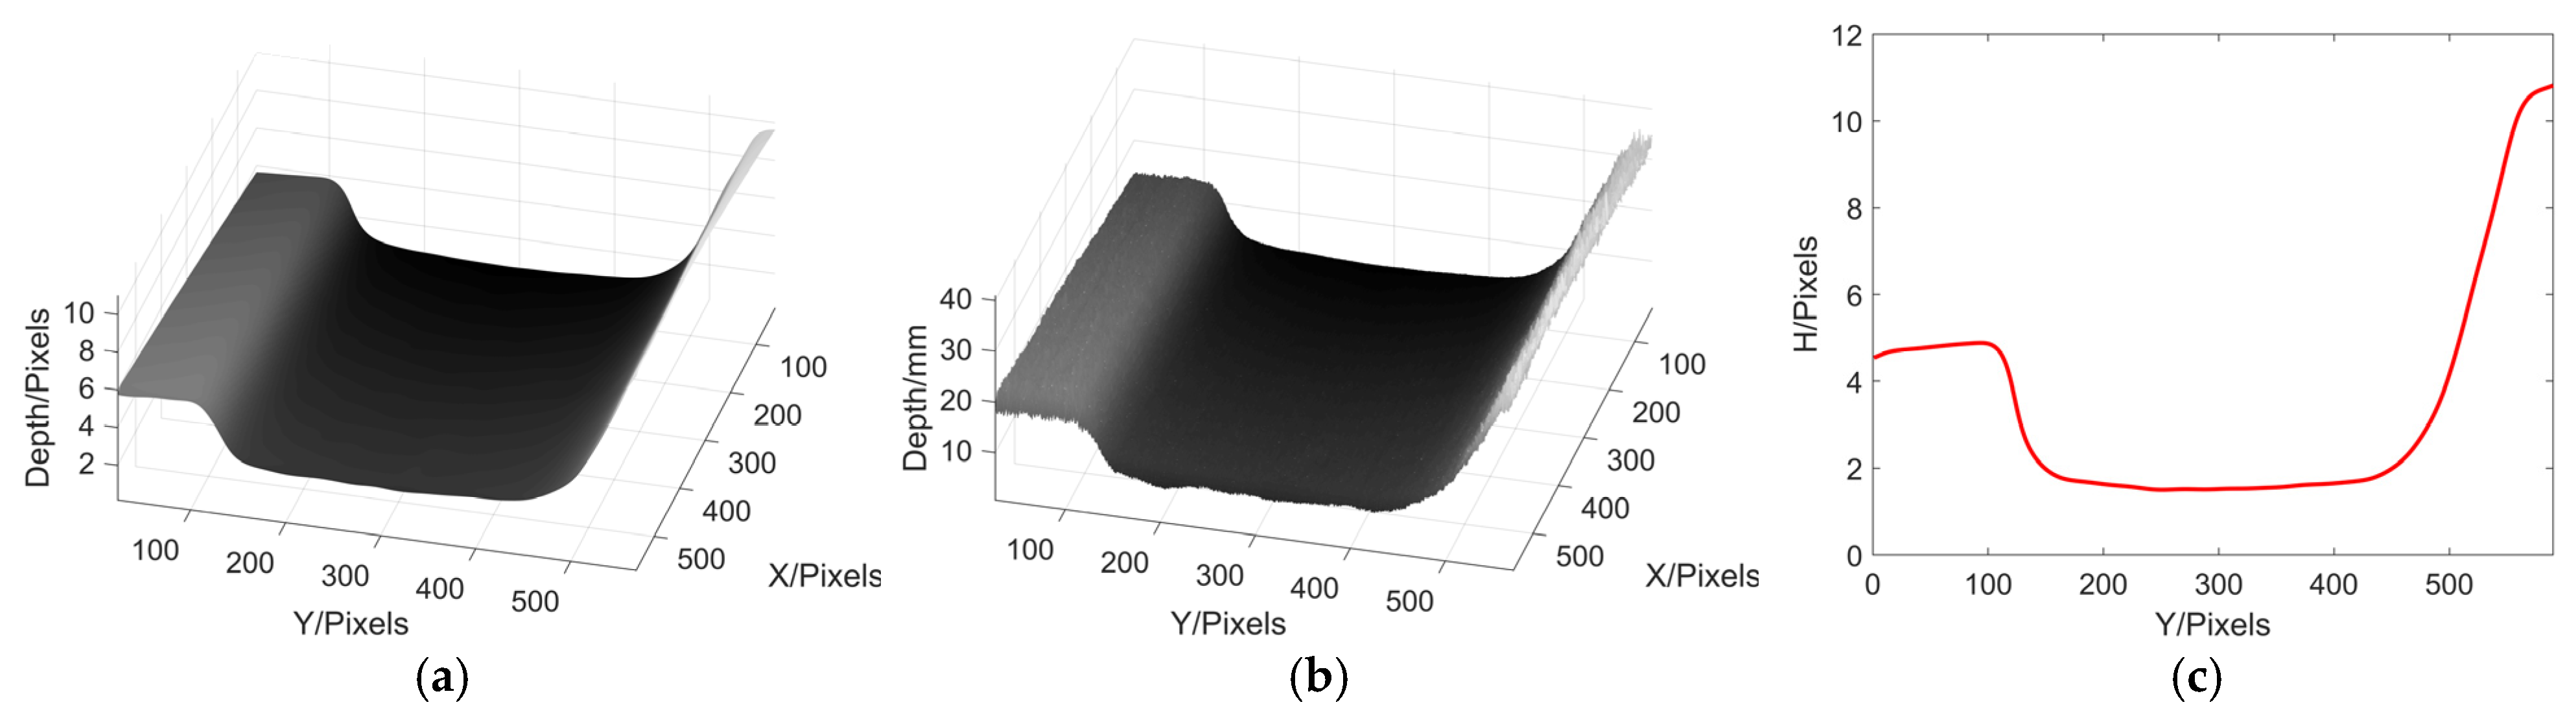
It can be seen from
Figure 14d, the 3D shape of the wheel tread has been basically restored by using MP, while
Figure 14e is the result of wheel tread height reconstruction based on phase-height mapping relationship after the calibration.
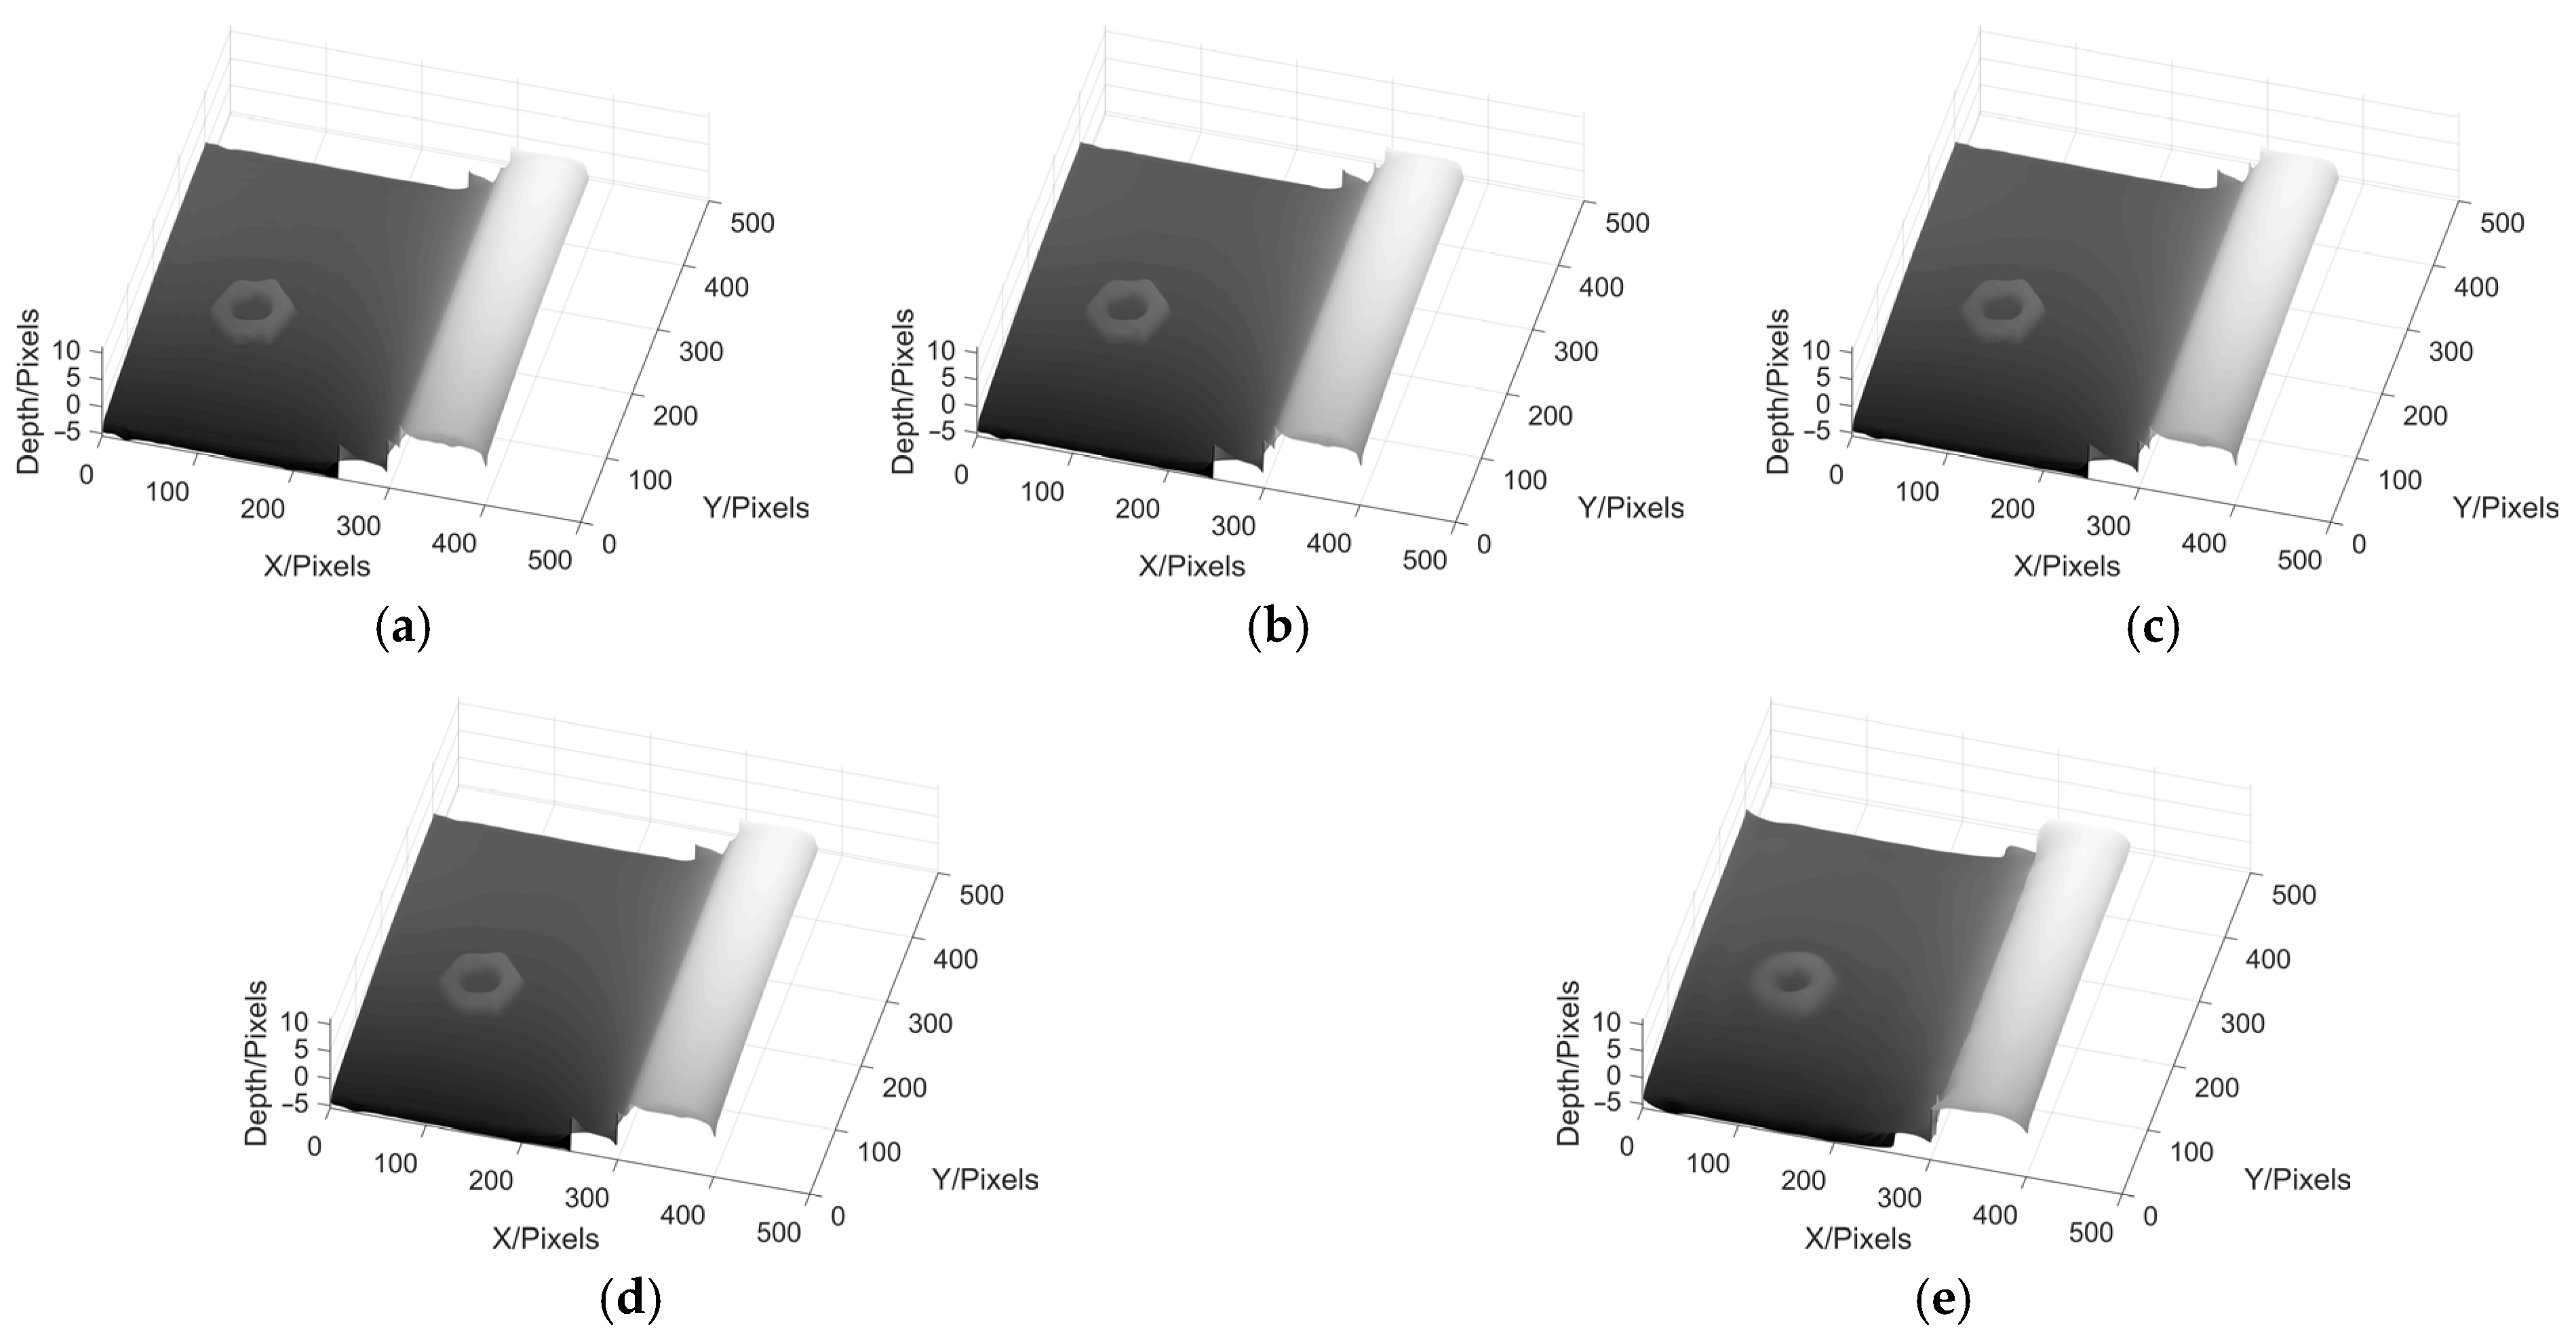
Lastly, we paste a nut on the surface of the wheel and measure it by MP again. This is used to test the ability of MP to measure discontinuous height. The experimental results are shown in
Figure 15.
From the above results, it can be seen that MP has a good ability to reconstruct the 3D profile of wheel tread. It not only has a good effect in measuring the wheel tread, but also can clearly restore the morphology of the nut on the tread without changing the grating frequency.
Except for reconstructing the 3D profile of the wheel tread, we also used the MP to reconstruct the rail. The shape of the rail and the projected grating fringe pattern are shown in
Figure 16, and the 3D profile reconstruction result of the rail is shown in
Figure 17.
From the above result, it can be seen that the 3D profile of the rail can be well reconstruction by using MP. It is proved that the application of MP in industry is feasible.
Next, we take the wheel tread reconstruction experiment as an example to compare the effects of different filtering methods on phase reconstruction in MP.
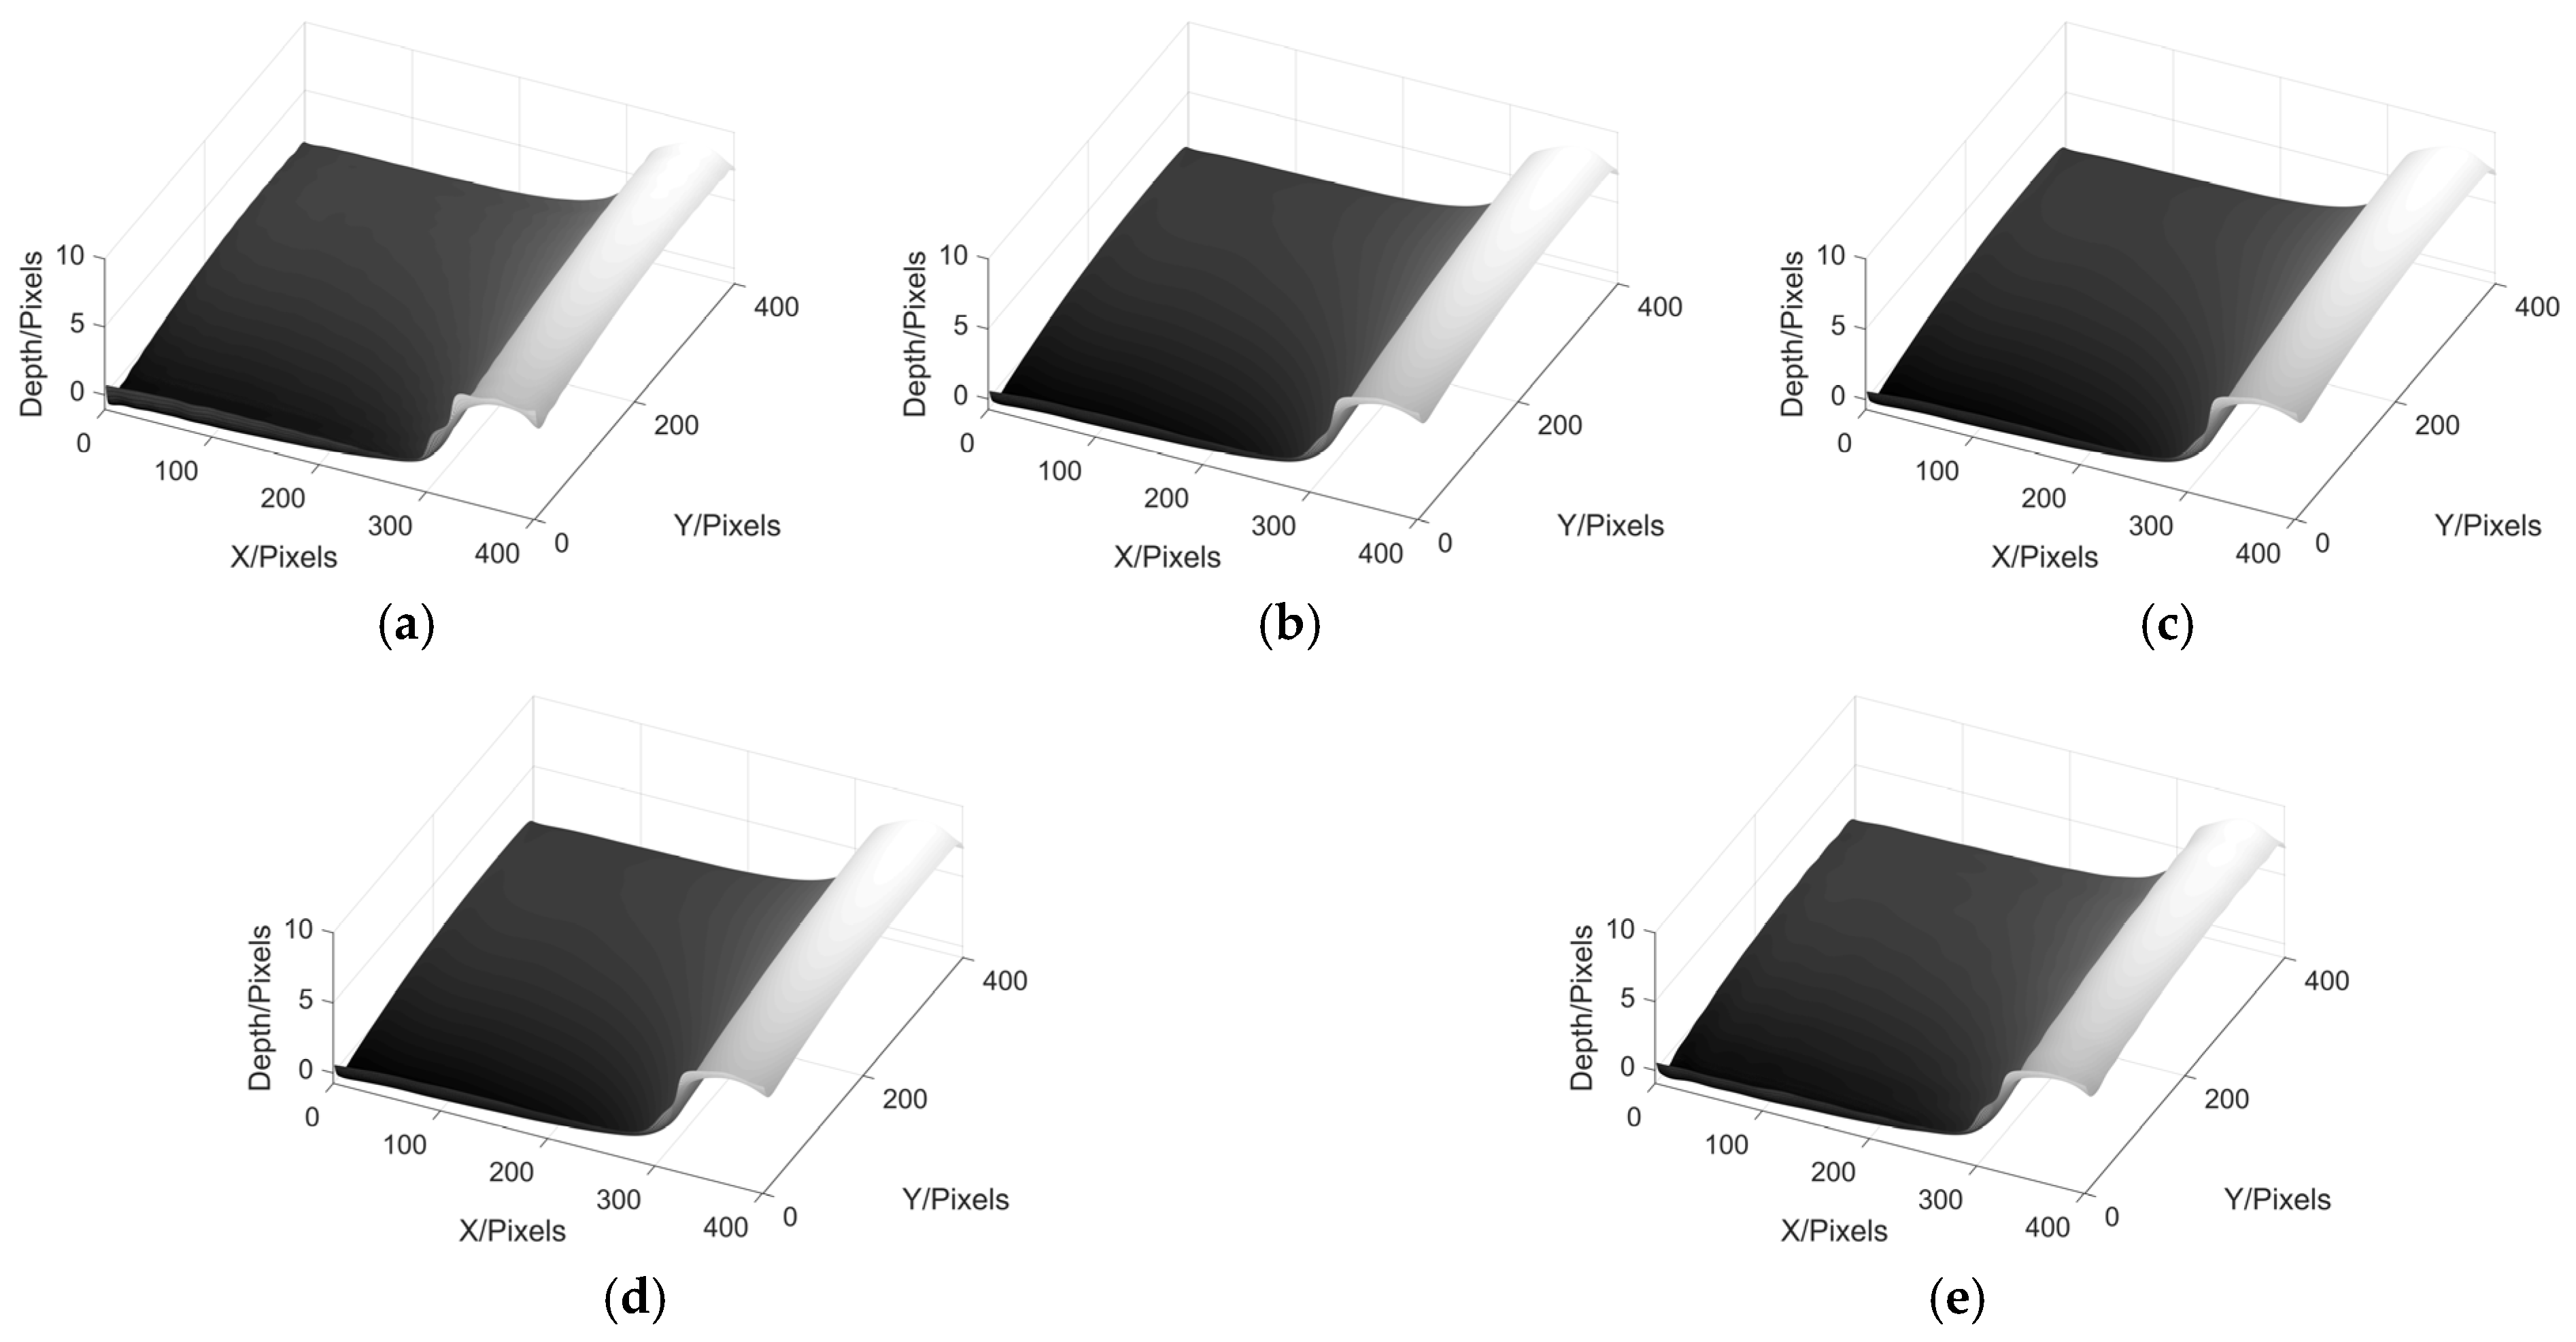
Figure 18 shows the results of wheel tread phase reconstruction using ideal low-pass filter, Hanning window, Blackman window, Kaiser window and Hilbert converter, while
Figure 19 shows the phase reconstruction results of wheel tread with a nut.
From the above results, it can be seen that in the experiment of wheel tread phase reconstruction, the 3D profile of the wheel tread can be well reconstructed by using these five filtering methods. In the experiment of phase reconstruction of wheel tread with a nut, the six corners of the nut can be seen clearly by the first four methods, but the edge of the nut cannot be seen in the result obtained by Hilbert transform. When there are many components in the spectrum of image, it becomes more difficult to use Hilbert transform to remove the DC component from the image. When conducting the MP experiment, it is necessary to choose the most suitable filter according to different conditions in order to obtain satisfactory results.
4. Discussion
In this paper, we build a wheel tread detection experimental platform based on railway background. We can capture the wheel tread deformed fringe pattern in real time and the 3D shape of wheel can be reconstructed by MP method. Compared with other 3D measurement methods, MP method is easy to operate and efficient in measurement.
In the above wheel tread measurement experiment, we find that when the spatial period of the projected sinusoidal grating fringe is too high or too low, the reconstruction effect is not satisfactory. When the spatial period of sinusoidal grating fringe is 16 pixels, the best reconstruction result could be obtained. At the same time, in the process of reconstruction, the selection of filter parameters is also crucial. Thus, the conditions including the spatial period of projection fringes and filter parameters need to be optimized according to different measurement environments. In addition, we know that MP depends on the method of grating fringe patterns projection, so conditions such as extremely strong background light or specular reflection will reduce the fringe contrast, make the collected pictures blurry, and then affect the measurement. Therefore, when using MP for measurement, it is necessary to be in a dark or low-light experimental environment, and the object to be measured should not have specular reflection. If the collected pictures have weak specular reflection, the relevant algorithms can be used to process the pictures and eliminate the impact.
For industrial measurement, safety, efficiency and convenience are often valued, and digital MP can be used in non-destructive testing of wheel tread because of its single frame and non-contact measurement. When the wheel is rolling, the MP method could restore the 360° shape of the wheel tread by stitching, but the processing of the reference background also needs to be further considered. Therefore, the image stitching technology and the processing of the reference background will be the next step.
5. Conclusions
In this paper, based on digital MP, three commonly used structured light projection methods are firstly compared through simulation experiments. It can be seen that, compared with the PMP method, the characteristics of the single capture image of MP makes it easier to operate, so it has more advantages in dynamic on-line measurement. While, compared with the single frame reconstruction method FTP, which can also be used for on-line measurement, MP has higher accuracy. In addition, by comparing the simulation experiments of noise-free condition and noise condition, it is concluded that when using MP for measurement, it is necessary to select the appropriate filter window for different measurement scenes in order to obtain the best measurement results.
At the same time, MP is also applied to the 3D profile detection of the wheel tread in this paper, and the 3D shape of the wheel tread is successfully reconstructed with a good effect. Compared with the traditional MP measurement method, this kind of digital MP is easier to operate and has higher efficiency and accuracy, which provides a new method for on-line non-contact detection of wheel tread. This technology can be used in wheel-rail 3D profile reconstruction and measurement, and can be expanded to measure and analyze rolling wheels in the future, while improving the detection efficiency and realizing automatic detection of train wheel and rail.
Author Contributions
Conceptualization, J.L. and R.M.; methodology, J.L., R.M., K.H. and T.T.; writing-original draft, R.M.; writing-review and editing, J.L., Y.Z. and X.G.; formal analysis, R.M. and K.H.; investigation, R.M. and T.T. All authors have read and agreed to the published version of the manuscript.
Funding
This work was funded by the National Natural Science Foundation of China (under Grant No. 61960206010).
Institutional Review Board Statement
Not applicable.
Informed Consent Statement
Not applicable.
Data Availability Statement
Not applicable.
Conflicts of Interest
The authors declare no conflict of interest.
References
- Zhong, K.; Li, Z.; Li, R.; Shi, Y.; Wang, C. Pre-calibration-free 3D shape measurement method based on fringe projection. Opt. Express 2016, 24, 14196–14207. [Google Scholar] [CrossRef] [PubMed]
- Zhang, S. Recent progresses on real-time 3D shape measurement using digital fringe projection techniques. Opt. Lasers Eng. 2010, 48, 149–158. [Google Scholar] [CrossRef]
- Peng, K.; Cao, Y.; Wu, Y.; Lu, M. A new method using orthogonal two-frequency grating in online 3D measurement. Opt. Laser Technol. 2016, 83, 81–88. [Google Scholar] [CrossRef]
- Mohammadi, F.; Kofman, J. Single-frame digital phase-shifting 3D shape measurement using pixel-wise moiré-wavelength refinement. Opt. Lasers Eng. 2016, 78, 196–204. [Google Scholar] [CrossRef]
- Liu, Y.; Zhang, Q.; Zhang, H.; Wu, Z.; Chen, W. Improve Temporal Fourier Transform Profilometry for Complex Dynamic Three-Dimensional Shape Measurement. Sensors 2020, 20, 1808. [Google Scholar] [CrossRef] [Green Version]
- Bian, X.; Xue, J.; Cheng, J.; Ji, B.; Yu, H.; Su, X.; Chen, W. Phase measuring profilometry based on elliptically pattern grating. Optik 2013, 124, 3924–3928. [Google Scholar] [CrossRef]
- Wang, Y.; Cao, Y.; Fu, G.; Wang, L.; Wan, Y.; Li, C. Single-shot phase measuring profilometry based on color binary grating with intervals. Opt. Commun. 2019, 451, 268–275. [Google Scholar] [CrossRef]
- Chen, F.; Su, X.; Xiang, L. Analysis and identification of phase error in phase measuring profilometry. Opt. Express 2010, 18, 11300–11307. [Google Scholar] [CrossRef]
- Wang, Z.; Zhang, Z.; Gao, N.; Xiao, Y.; Gao, F.; Jiang, X. Single-shot 3D shape measurement of discontinuous objects based on a coaxial fringe projection system. Appl. Opt. 2019, 58, A169–A178. [Google Scholar] [CrossRef]
- Ma, Q.; Cao, Y.; Chen, C.; Wan, Y.; Fu, G.; Wang, Y. Intrinsic feature revelation of phase-to-height mapping in phase measuring profilometry. Opt. Laser Technol. 2018, 108, 46–52. [Google Scholar] [CrossRef]
- Liu, X.; Kofman, J. Real-time 3D surface-shape measurement using background-modulated modified Fourier transform profilometry with geometry-constraint. Opt. Lasers Eng. 2019, 115, 217–224. [Google Scholar] [CrossRef]
- Lv, S.; Zhang, Y.; Wang, J.; Sun, Q. A method of depth extension in 3D shape measurement by geometric constraints. J. Opt. 2020, 22, 125701. [Google Scholar] [CrossRef]
- Zhao, H.; Du, H.; Li, J.; Qin, Y. Shadow moiré technology based fast method for the measurement of surface topography. Appl. Opt. 2013, 52, 7874–7881. [Google Scholar] [CrossRef]
- Li, C.; Cao, Y.; Chen, C.; Wan, Y.; Fu, G.; Wang, Y. Computer-generated Moiré profilometry. Opt. Express 2017, 25, 26815–26824. [Google Scholar] [PubMed]
- Li, C.; Cao, Y.; Wang, L.; Wan, Y.; Fu, G.; Wang, Y.; Chen, C. High precision computer-generated moiré profilometry. Sci. Rep. 2019, 9, 7804. [Google Scholar] [CrossRef]
- Tang, Y.; Liu, K.; Zhang, Y.; Chen, J. A Phase Compensation Method for Phase Extraction of Abrupt Surfaces in Projection Moiré. Exp. Tech. 2018, 43, 169–177. [Google Scholar] [CrossRef]
- Mohammadi, F.; Kofman, J. Multi-Wavelength Digital-Phase-Shifting Moiré Based on Moiré Wavelength. Appl. Sci. 2019, 9, 1917. [Google Scholar] [CrossRef] [Green Version]
- Wang, L.; Cao, Y.; Li, C.; Wang, Y.; Wan, Y.; Fu, G.; Li, H.; Xu, C. Orthogonal modulated computer-generated moiré profilometry. Opt. Commun. 2020, 455, 124565. [Google Scholar] [CrossRef]
- Wang, L.; Cao, Y.; Li, C.; Wan, Y.; Wang, Y.; Li, H.; Xu, C.; Zhang, H. Computer-generated moiré profilometry based on flat image demodulation. Opt. Rev. 2021, 28, 546–556. [Google Scholar] [CrossRef]
- Li, Y.; Liu, Z.; Miao, Y.; Yuan, W.; Liu, Z. Study of a spiral-coil EMAT for rail subsurface inspection. Ultrasonics 2020, 108, 106169. [Google Scholar] [CrossRef]
- Zhang, Z.-F.; Gao, Z.; Liu, Y.-Y.; Jiang, F.-C.; Yang, Y.-L.; Ren, Y.-F.; Yang, H.-J.; Yang, K.; Zhang, X.-D. Computer Vision Based Method and System for Online Measurement of Geometric Parameters of Train Wheel Sets. Sensors 2012, 12, 334–346. [Google Scholar] [CrossRef] [PubMed] [Green Version]
- Zhang, Y.; Hu, J.-Y.; Li, J.-L.; Wu, J.-L.; Wang, H.-Q. The application of WTP in 3-D reconstruction of train wheel surface and tread defect. Optik 2017, 131, 749–753. [Google Scholar] [CrossRef]
- Qin, C.; Wang, Z.; Zhang, Y.; Huang, Q. Applications of two phase-height mapping algorithms for PMP in 3D reconstruction of the railway wheel tread. In Proceedings of the Fourth International Conference on Optical and Photonics Engineering, Chengdu, China, 26 September 2016; Volume 10250, p. 102502C. [Google Scholar] [CrossRef]
- Liu, X.-Z.; Xu, C.; Ni, Y.-Q. Wayside Detection of Wheel Minor Defects in High-Speed Trains by a Bayesian Blind Source Separation Method. Sensors 2019, 19, 3981. [Google Scholar] [CrossRef] [Green Version]
Figure 1.
3D reconstruction measurement optical system of MP.
Figure 1.
3D reconstruction measurement optical system of MP.
Figure 2.
3D reconstruction of object surface based on MP.
Figure 2.
3D reconstruction of object surface based on MP.
Figure 3.
Simulation experiment results of peaks. (a) object; (b) deformed fringe pattern; (c) moire fringe pattern 1; (d) moire fringe pattern 2; (e) wrapped phase; (f) wrapped phase reconstruction result; (g) unwrapped phase; (h) unwrapped phase reconstruction result.
Figure 3.
Simulation experiment results of peaks. (a) object; (b) deformed fringe pattern; (c) moire fringe pattern 1; (d) moire fringe pattern 2; (e) wrapped phase; (f) wrapped phase reconstruction result; (g) unwrapped phase; (h) unwrapped phase reconstruction result.
Figure 4.
Error distributions. (a) MP; (b) PMP; (c) FTP.
Figure 4.
Error distributions. (a) MP; (b) PMP; (c) FTP.
Figure 5.
The cutaway of the 250th column.
Figure 5.
The cutaway of the 250th column.
Figure 6.
Reconstruction errors. (a) MP based on Ideal low-pass; (b) MP based on Hanning; (c) MP based on Blackman; (d) MP based on Kaiser; (e) MP based on Hilbert transform; (f) FTP.
Figure 6.
Reconstruction errors. (a) MP based on Ideal low-pass; (b) MP based on Hanning; (c) MP based on Blackman; (d) MP based on Kaiser; (e) MP based on Hilbert transform; (f) FTP.
Figure 7.
Object with noise to be tested.
Figure 7.
Object with noise to be tested.
Figure 8.
Reconstruction errors (With noise). (a) MP based on Ideal low-pass; (b) MP based on Hanning; (c) MP based on Blackman; (d) MP based on Kaiser; (e) MP based on Hilbert transform; (f) FTP.
Figure 8.
Reconstruction errors (With noise). (a) MP based on Ideal low-pass; (b) MP based on Hanning; (c) MP based on Blackman; (d) MP based on Kaiser; (e) MP based on Hilbert transform; (f) FTP.
Figure 9.
Create wheel tread and project sinusoidal grating fringe pattern. (a) wheel tread to be tested; (b) projection.
Figure 9.
Create wheel tread and project sinusoidal grating fringe pattern. (a) wheel tread to be tested; (b) projection.
Figure 10.
Simulation process of wheel tread reconstruction. (a) deformed fringe; (b) moire fringe pattern 1; (c) moire fringe pattern 2; (d) wrapped phase; (e) continuous phase.
Figure 10.
Simulation process of wheel tread reconstruction. (a) deformed fringe; (b) moire fringe pattern 1; (c) moire fringe pattern 2; (d) wrapped phase; (e) continuous phase.
Figure 11.
Reconstruction results of wheel tread simulation.
Figure 11.
Reconstruction results of wheel tread simulation.
Figure 12.
Wheel tread detection experimental platform.
Figure 12.
Wheel tread detection experimental platform.
Figure 13.
Calibration platform.
Figure 13.
Calibration platform.
Figure 14.
Experimental reconstruction results of wheel tread. (a) deformed fringe; (b) moire fringe pattern 1; (c) moire fringe pattern 2; (d) phase reconstruction; (e) height reconstruction.
Figure 14.
Experimental reconstruction results of wheel tread. (a) deformed fringe; (b) moire fringe pattern 1; (c) moire fringe pattern 2; (d) phase reconstruction; (e) height reconstruction.
Figure 15.
Experimental reconstruction results of wheel tread with a nut. (a) deformed fringe; (b) moire fringe pattern 1; (c) moire fringe pattern 2; (d) phase reconstruction; (e) height reconstruction.
Figure 15.
Experimental reconstruction results of wheel tread with a nut. (a) deformed fringe; (b) moire fringe pattern 1; (c) moire fringe pattern 2; (d) phase reconstruction; (e) height reconstruction.
Figure 16.
Rail shape and deformed fringe pattern.
Figure 16.
Rail shape and deformed fringe pattern.
Figure 17.
Experimental reconstruction results of rail. (a) phase reconstruction; (b) height reconstruction; (c) The cutaway of the 300th row.
Figure 17.
Experimental reconstruction results of rail. (a) phase reconstruction; (b) height reconstruction; (c) The cutaway of the 300th row.
Figure 18.
Phase reconstruction results of wheel tread using different filters. (a) MP based on Ideal low-pass; (b) MP based on Hanning; (c) MP based on Blackman; (d) MP based on Kaiser; (e) MP based on Hilbert transform.
Figure 18.
Phase reconstruction results of wheel tread using different filters. (a) MP based on Ideal low-pass; (b) MP based on Hanning; (c) MP based on Blackman; (d) MP based on Kaiser; (e) MP based on Hilbert transform.
Figure 19.
Phase reconstruction results of wheel tread with a nut using different filters. (a) MP based on Ideal low-pass; (b) MP based on Hanning; (c) MP based on Blackman; (d) MP based on Kaiser; (e) MP based on Hilbert transform.
Figure 19.
Phase reconstruction results of wheel tread with a nut using different filters. (a) MP based on Ideal low-pass; (b) MP based on Hanning; (c) MP based on Blackman; (d) MP based on Kaiser; (e) MP based on Hilbert transform.
Table 1.
Comparison of experimental results.
Table 1.
Comparison of experimental results.
| Methods | MP | PMP | FTP |
|---|
| MAX | 0.0275 | 0.0092 | 0.4813 |
| RMSE | 0.0031 | 0.0029 | 0.3942 |
Table 2.
Reconstruction errors.
Table 2.
Reconstruction errors.
| Methods | | MAX | MAE | RMSE |
|---|
| Ideal lowpass | 0.22192 | 0.00156 | 0.00005 | 0.00012 |
| Hanning | 0.22192 | 0.01391 | 0.00085 | 0.00164 |
| Blackman | 0.22192 | 0.01442 | 0.00119 | 0.00210 |
| Kaiser | 0.22192 | 0.00889 | 0.00094 | 0.00129 |
| Hilbert transform | 0.22192 | 0.00065 | 0.00001 | 0.00002 |
| FTP | 0.61462 | 0.47981 | 0.39270 | 0.39279 |
Table 3.
Reconstruction errors (With noise).
Table 3.
Reconstruction errors (With noise).
| Methods | | MAX | MAE | RMSE |
|---|
| Ideal lowpass | 0.22211 | 0.01742 | 0.00342 | 0.00430 |
| Hanning | 0.22144 | 0.01943 | 0.00350 | 0.00459 |
| Blackman | 0.22198 | 0.02165 | 0.00344 | 0.00460 |
| Kaiser | 0.22139 | 0.01726 | 0.00346 | 0.00435 |
| Hilbert transform | 0.22134 | 0.03879 | 0.00355 | 0.00526 |
| FTP | 0.61480 | 0.56464 | 0.39288 | 0.39468 |
| Publisher’s Note: MDPI stays neutral with regard to jurisdictional claims in published maps and institutional affiliations. |
© 2022 by the authors. Licensee MDPI, Basel, Switzerland. This article is an open access article distributed under the terms and conditions of the Creative Commons Attribution (CC BY) license (https://creativecommons.org/licenses/by/4.0/).


