
A Multimodal Approach for Real Time Recognition of Engagement towards Adaptive Serious Games for Health

 ,
,  ,
,
Abstract
1. Introduction
2. Materials and Methods
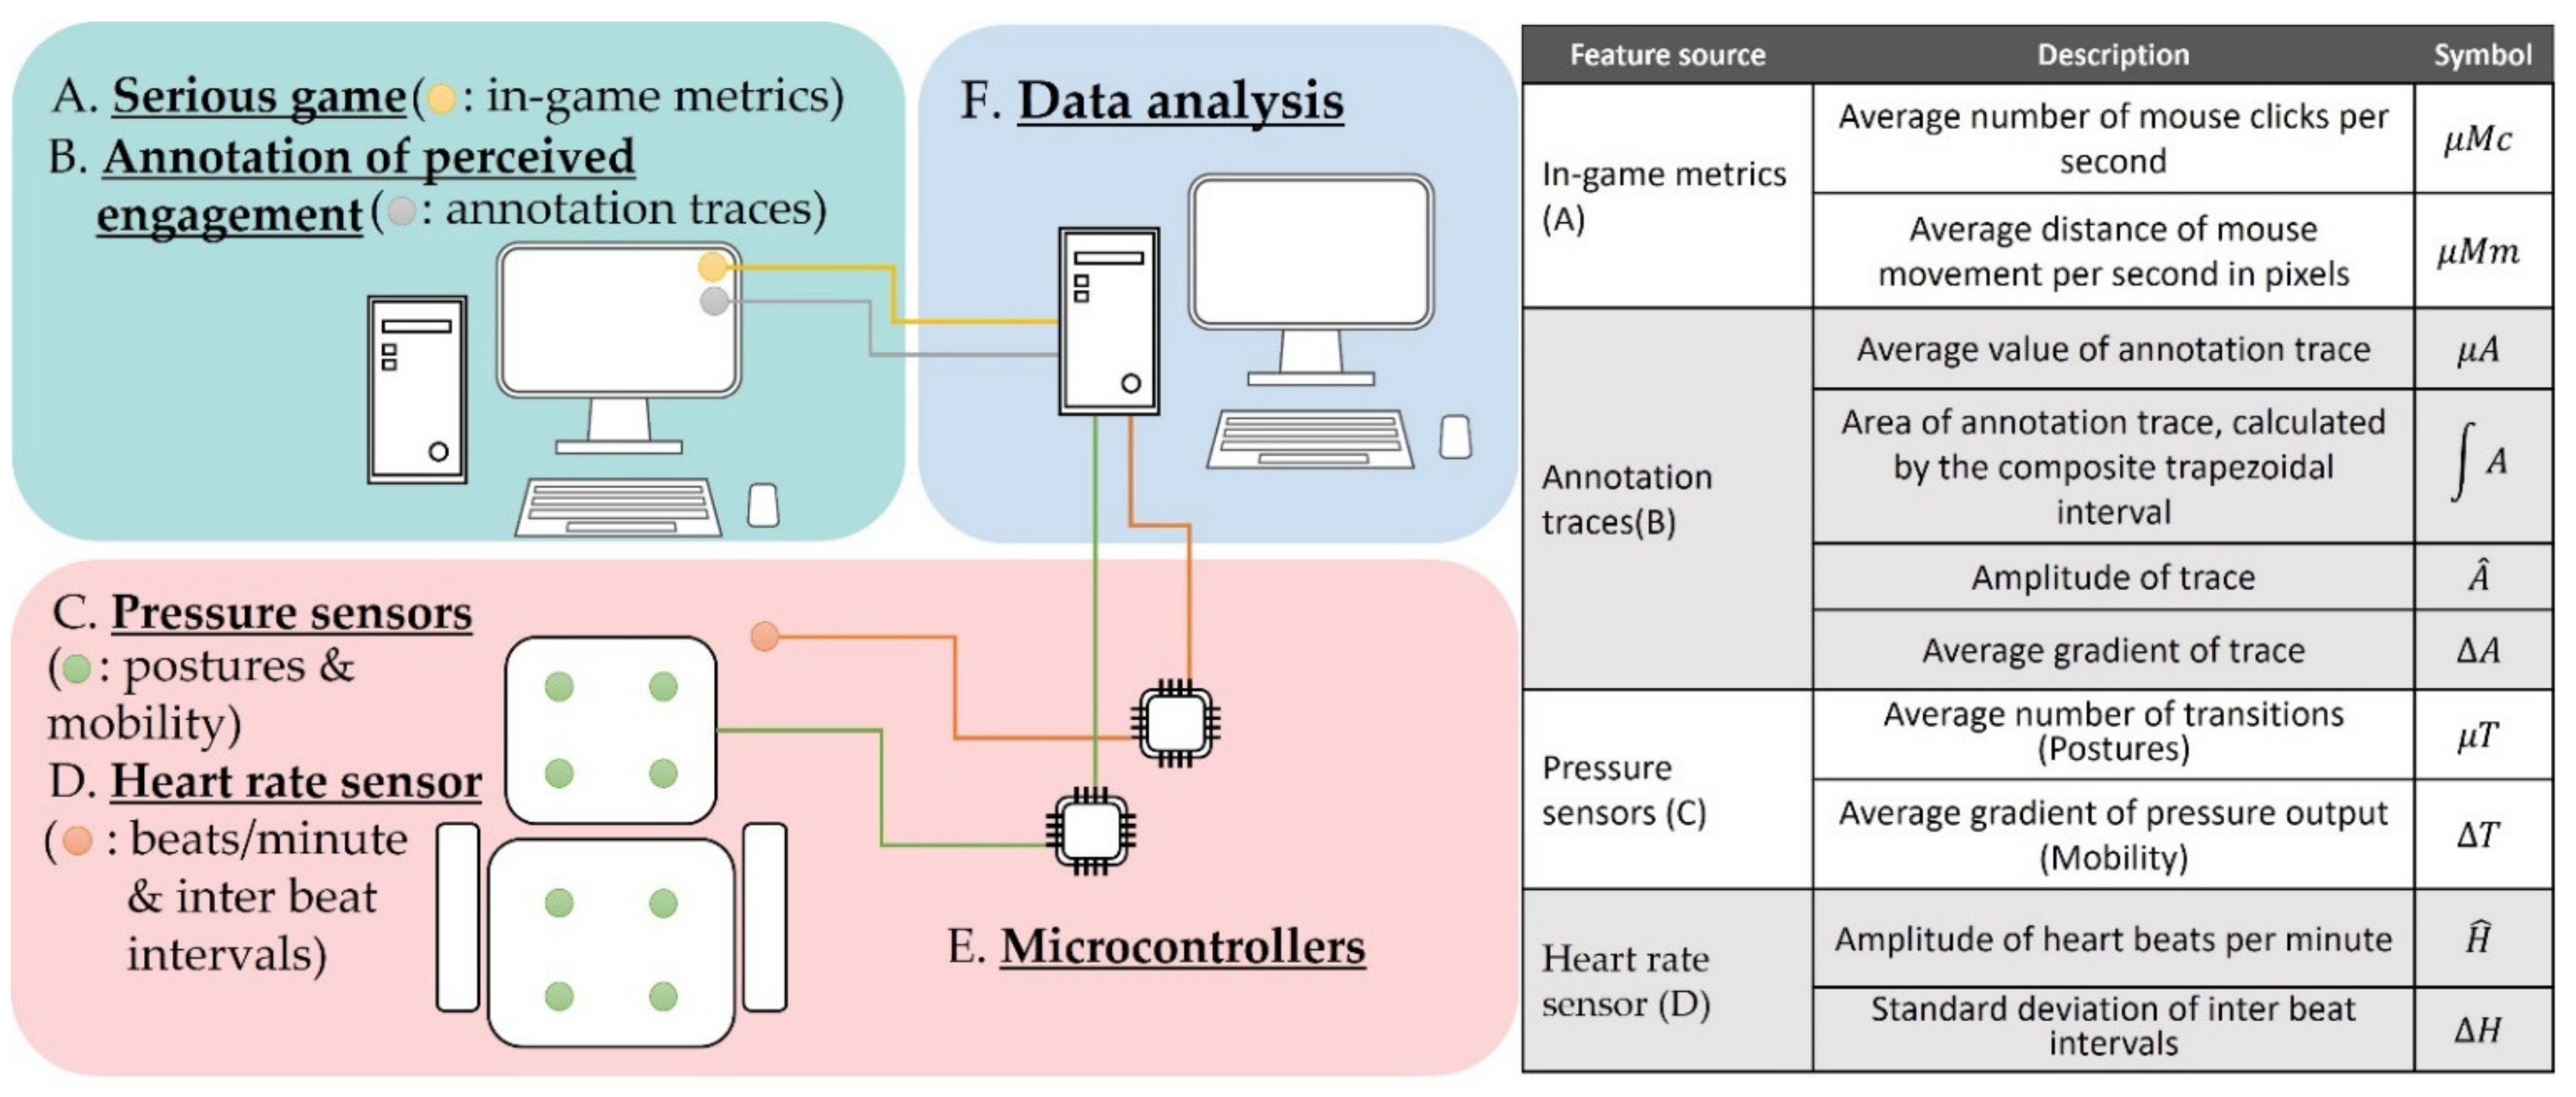
2.1. User Interaction Space
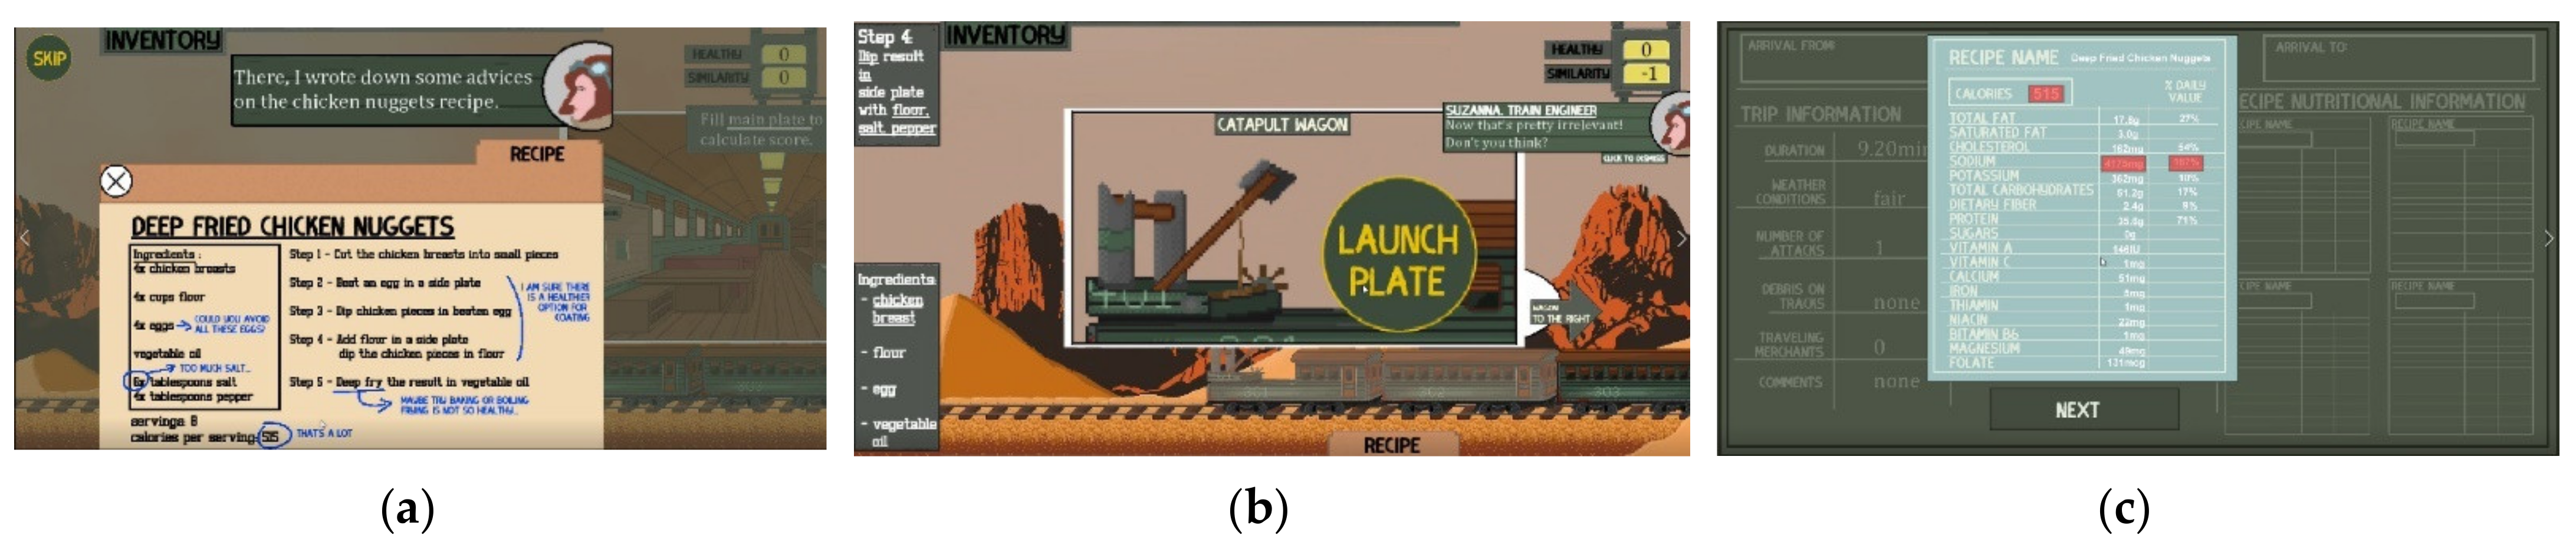
2.1.1. Serious Game
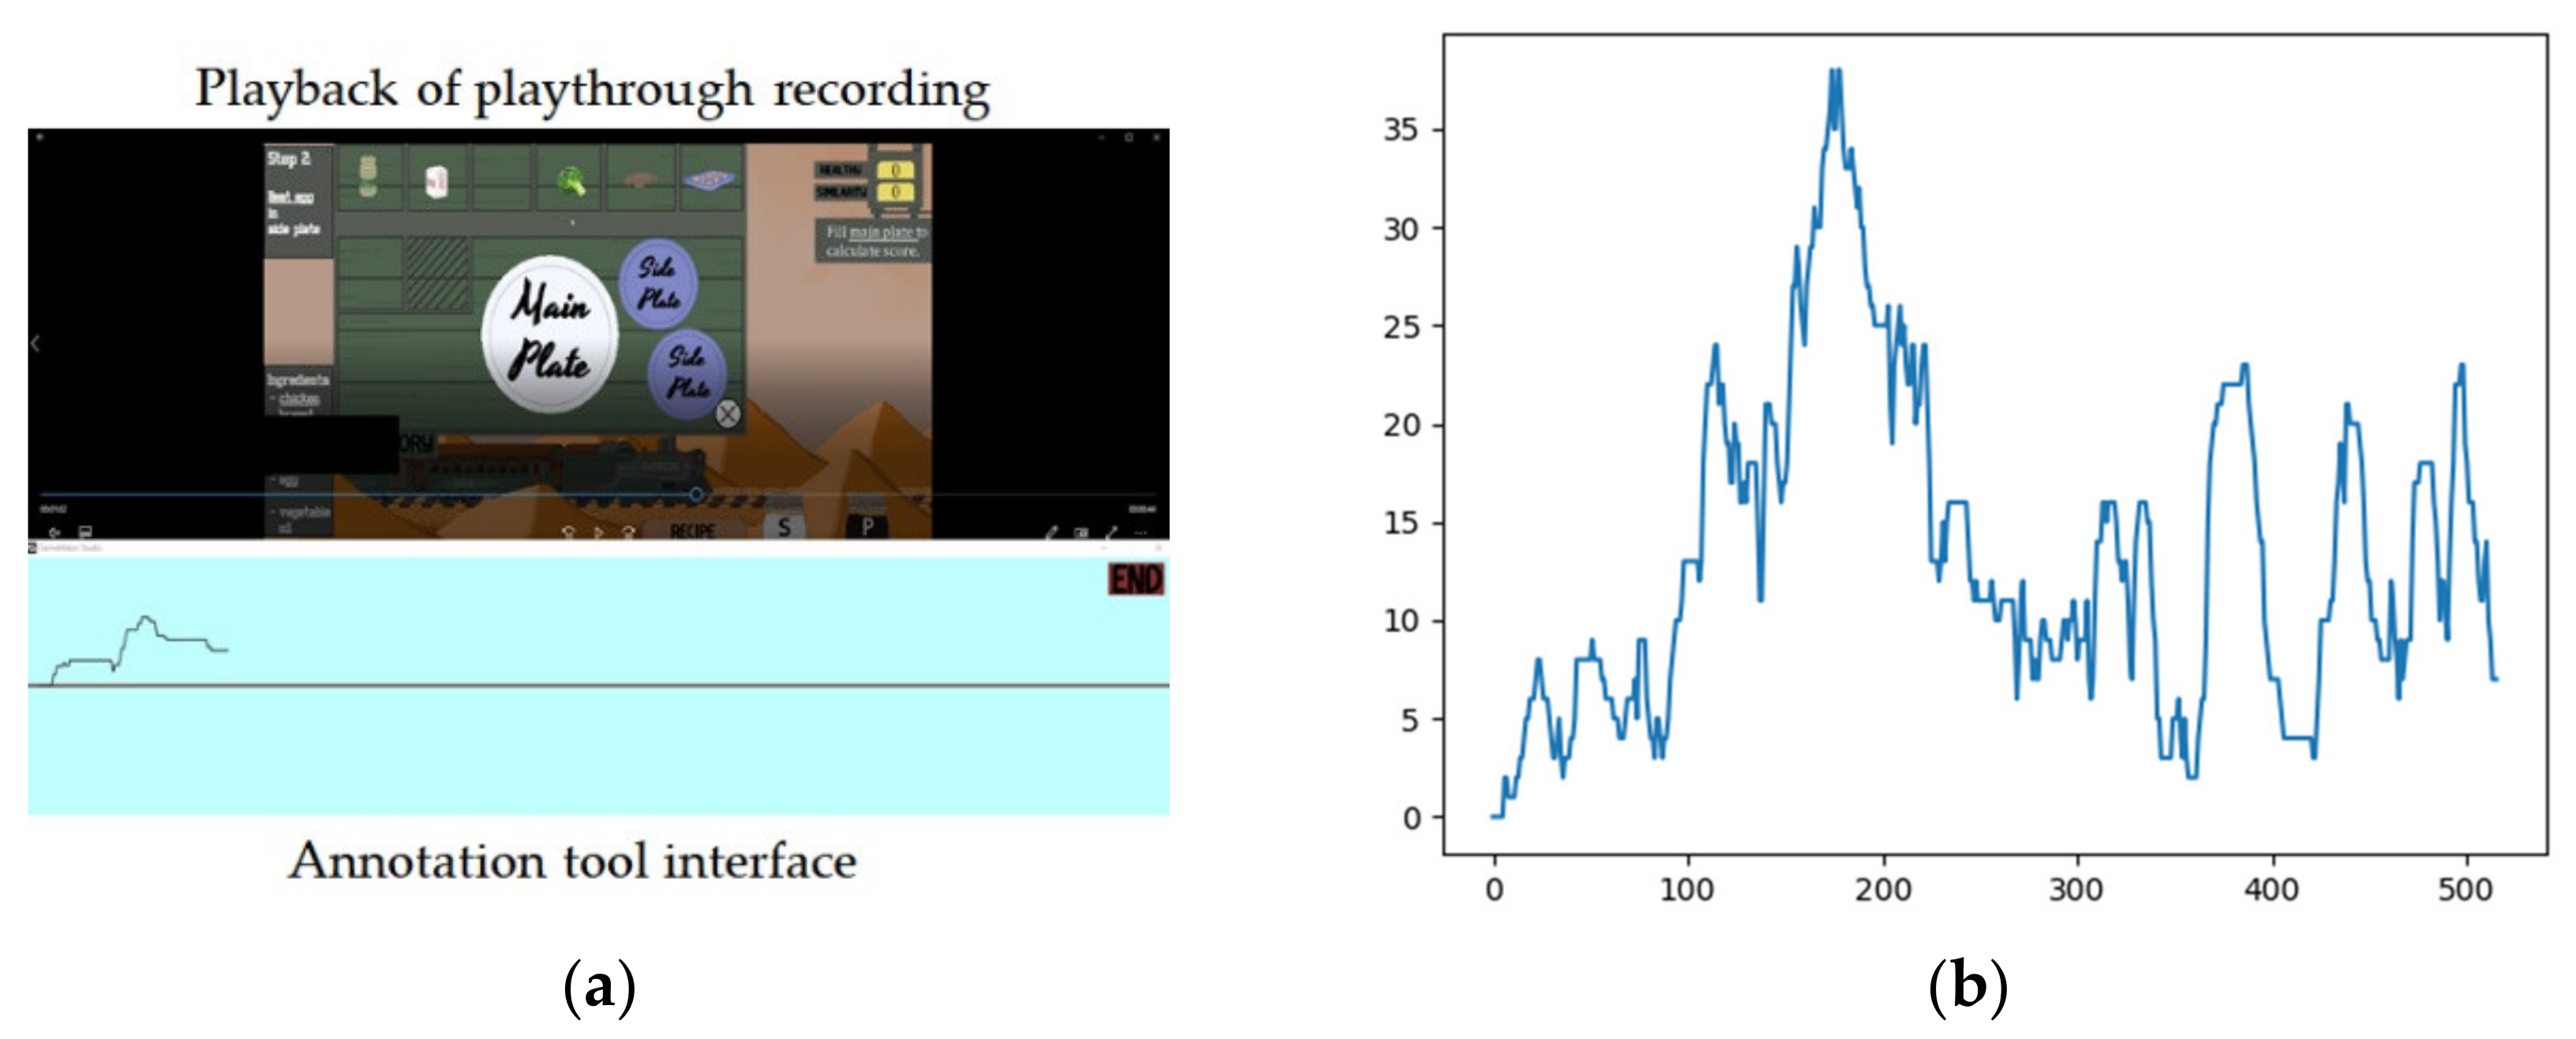
2.1.2. Annotation of Engagement
2.2. Sensing Space
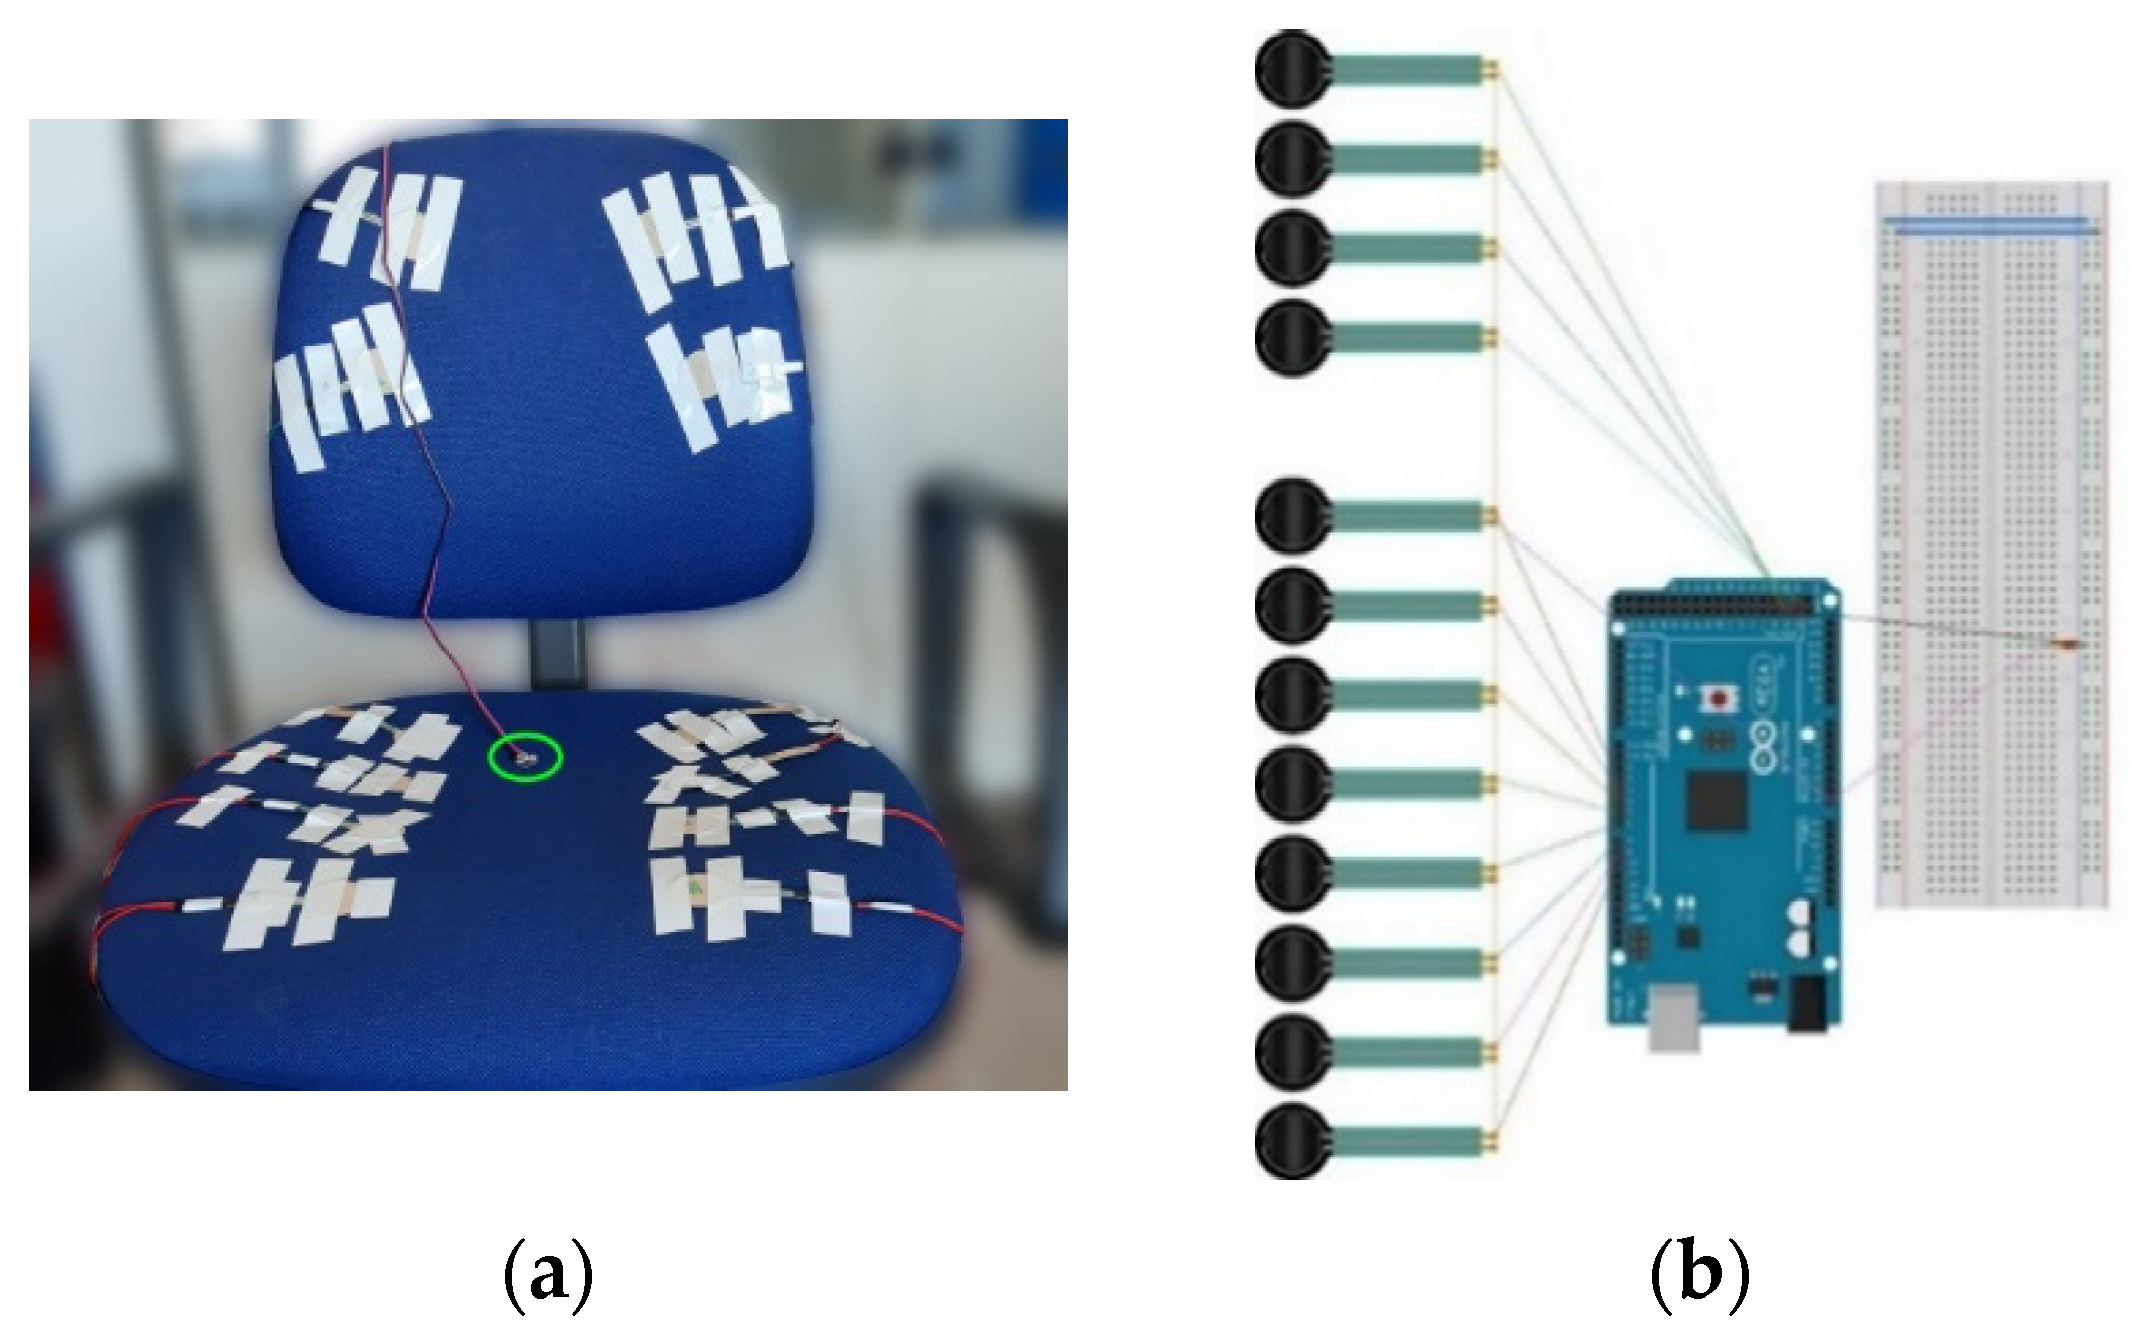
2.2.1. Smart Chair
2.2.2. Heart Rate Sensor
2.3. Participants and Experimental Protocol
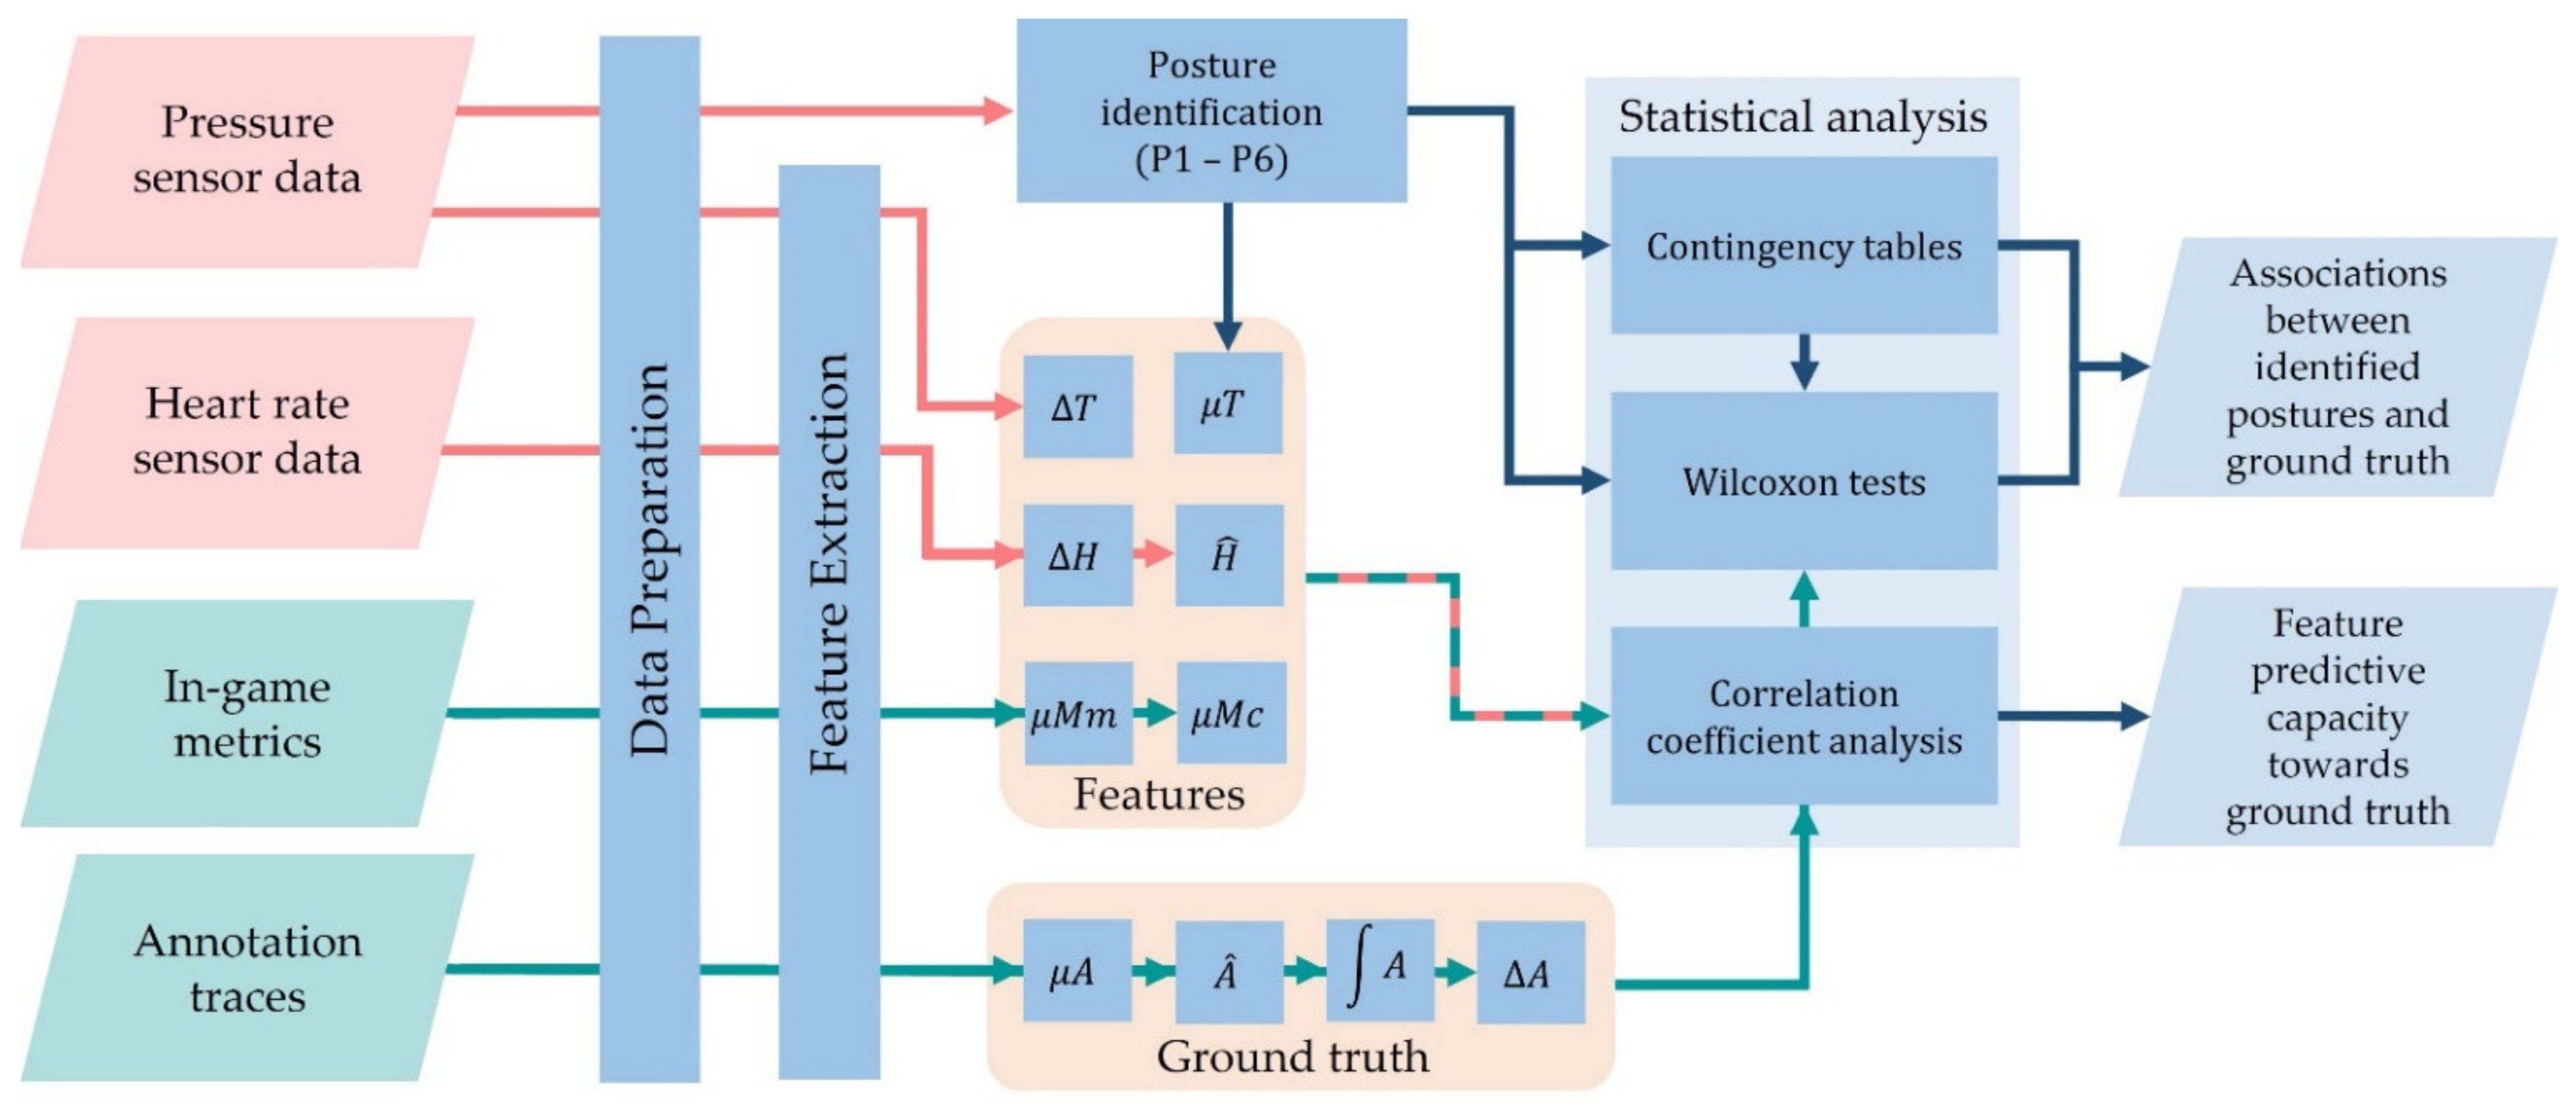
2.4. Data Analysis Space
2.4.1. Data Preparation
2.4.2. Statistical Data Analysis
3. Results
4. Discussion
5. Conclusions
Author Contributions
Funding
Institutional Review Board Statement
Informed Consent Statement
Data Availability Statement
Conflicts of Interest
References
- Djaouti, D.; Alvarez, J.; Jessel, J.-P. Classifying Serious Games. In Handbook of Research on Improving Learning and Motivation through Educational Games: Multidisciplinary Approaches; IGI Global: Hershey, PA, USA, 2011; pp. 118–136. [Google Scholar]
- Sardi, L.; Idri, A.; Fernández-Alemán, J.L. A systematic review of gamification in e-Health. J. Biomed. Inform. 2017, 71, 31–48. [Google Scholar] [CrossRef] [PubMed]
- Fleming, T.M.; Bavin, L.; Stasiak, K.; Hermansson-Webb, E.; Merry, S.N.; Cheek, C.; Lucassen, M.; Lau, H.M.; Pollmuller, B.; Hetrick, S. Serious games and gamification for mental health: Current status and promising directions. Front. Psychiatry 2017, 7, 215. [Google Scholar] [CrossRef] [PubMed]
- Orji, R.; Vassileva, J.; Mandryk, R.L. Modeling the efficacy of persuasive strategies for different gamer types in serious games for health. User Modeling User-Adapt. Interact. 2014, 24, 453–498. [Google Scholar] [CrossRef]
- Schrader, C.; Brich, J.; Frommel, J.; Riemer, V.; Rogers, K. Rising to the Challenge: An Emotion-Driven Approach Toward Adaptive Serious Games. In Serious Games and Edutainment Applications; Springer: Cham, Switzerland, 2017; Volume 2, pp. 3–28. [Google Scholar] [CrossRef]
- Sajjadi, P.; Ewais, A.; De Troyer, O. Individualization in Serious Games: A Systematic Review of the Literature on the Aspects of the Players to Adapt To. Entertain. Comput. 2021, 41, 100468. [Google Scholar] [CrossRef]
- Frutos-Pascual, M.; Zapirain, B.G. Review of the Use of AI Techniques in Serious Games: Decision Making and Machine Learning. IEEE Trans. Comput. Intell. AI Games 2017, 9, 133–152. [Google Scholar] [CrossRef]
- Procedural Content Generation in Serious Games. EAI Blog. Available online: https://blog.eai-conferences.org/2015/05/27/procedural-content-generation-in-serious-games/ (accessed on 30 October 2021).
- Streicher, A.; Smeddinck, J.D. Personalized and adaptive serious games. In Entertainment Computing and Serious Games; Springer: Cham, Switzerland, 2016; pp. 332–377. [Google Scholar] [CrossRef]
- Liu, J.; Snodgrass, S.; Khalifa, A.; Risi, S.; Yannakakis, G.N.; Togelius, J. Deep learning for procedural content generation. Neural Comput. Appl. 2021, 33, 19–37. [Google Scholar] [CrossRef]
- Schoenau-Fog, H. The Player Engagement Process-An Exploration of Continuation Desire in Digital Games. In Proceedings of the DiGRA Conference, Hilversum, The Netherlands, 14–17 September 2011. [Google Scholar]
- Hookham, G.; Nesbitt, K. A Systematic Review of the Definition and Measurement of Engagement in Serious Games. In Proceedings of the Australasian Computer Science Week Multiconference, Sydney, NSW, Australia, 29–31 January 2019. [Google Scholar] [CrossRef]
- Martey, R.M.; Kenski, K.; Folkestad, J.; Feldman, L.; Gordis, E.; Shaw, A.; Stromer-Galley, J.; Clegg, B.; Zhang, H.; Kaufman, N.; et al. Measuring Game Engagement: Multiple Methods and Construct Complexity. Simul. Gaming 2014, 45, 528–547. [Google Scholar] [CrossRef]
- D’Mello, S.; Chipman, P.; Graesser, A. Posture as a predictor of learner’s affective engagement. In Proceedings of the 29th Annual Meeting of the Cognitive Science Society, Nashville, TN, USA, 1–4 August 2007; Volume 1, pp. 905–910. [Google Scholar]
- Bibbo, D.; Carli, M.; Conforto, S.; Battisti, F. A sitting posture monitoring instrument to assess different levels of cognitive engagement. Sensors 2019, 19, 455. [Google Scholar] [CrossRef]
- Cowley, B.; Ravaja, N.; Heikura, T. Cardiovascular physiology predicts learning effects in a serious game activity. Comput. Educ. 2013, 60, 299–309. [Google Scholar] [CrossRef]
- Porter, A.M.; Goolkasian, P. Video games and stress: How stress appraisals and game content affect cardiovascular and emotion outcomes. Front. Psychol. 2019, 10, 967. [Google Scholar] [CrossRef]
- Bouvier, P.; Sehaba, K.; Lavoue, E.; George, S. Using traces to qualify learner’s engagement in game-based learning. In Proceedings of the 2013 IEEE 13th International Conference on Advanced Learning Technologies, Beijing, China, 15–18 July 2013; pp. 432–436. [Google Scholar] [CrossRef]
- Callaghan, M.J.; McShane, N.; Eguiluz, A.G. Using game analytics to measure student engagement/retention for engineering education. In Proceedings of the 2014 11th International Conference on Remote Engineering and Virtual Instrumentation (REV), Porto, Portugal, 26–28 February 2014; pp. 297–302. [Google Scholar] [CrossRef]
- Dewan, M.A.A.; Murshed, M.; Lin, F. Engagement detection in online learning: A review. Smart Learn. Environ. 2019, 6, 1–20. [Google Scholar] [CrossRef]
- Khan, S.; Colella, T. Inconsistencies in Measuring User Engagement in Virtual Learning—A Critical Review; IEEE Computer Society: Washington, DC, USA, 2021. [Google Scholar] [CrossRef]
- Fredricks, J.A.; McColskey, W. The Measurement of Student Engagement: A Comparative Analysis of Various Methods and Student Self-report Instruments. In Handbook of Research on Student Engagement; Springer: Boston, MA, USA, 2012; pp. 763–782. [Google Scholar] [CrossRef]
- Mulaffer, L.; Zafar, M.A.; Ahmed, B. Analyzing Player Engagement for Biofeedback. In Proceedings of the 2019 IEEE 7th International Conference on Serious Games and Applications for Health (SeGAH), Kyoto, Japan, 5–7 August 2019; pp. 1–5. [Google Scholar]
- Al Osman, H.; Dong, H.; El Saddik, A. Ubiquitous Biofeedback Serious Game for Stress Management. IEEE Access 2016, 4, 1274–1286. [Google Scholar] [CrossRef]
- Rodriguez, A.; Rey, B.; Vara, M.D.; Wrzesien, M.; Alcaniz, M.; Banos, R.M.; Perez-Lopez, D. A VR-based serious game for studying emotional regulation in adolescents. IEEE Comput. Graph. Appl. 2015, 35, 65–73. [Google Scholar] [CrossRef] [PubMed]
- Ben Moussa, M.; Magnenat-Thalmann, N. Applying affect recognition in serious games: The PlayMancer project. In Proceedings of the Motion in Games, Second International Workshop, Zeist, The Netherlands, 21–24 November 2009; pp. 53–62. [Google Scholar]
- Mahmoudi-Nejad, A. Automated Personalized Exposure Therapy Based on Physiological Measures Using Experience-Driven Procedural Content Generation. In Proceedings of the AAAI Conference on Artificial Intelligence and Interactive Digital Entertainment, Virtual, 11–15 October 2021; Volume 17, pp. 232–235. [Google Scholar]
- Kostoulas, T.; Mporas, I.; Kocsis, O.; Ganchev, T.; Katsaounos, N.; Santamaria, J.J.; Jimenez-Murcia, S.; Fernandez-Aranda, F.; Fakotakis, N. Affective speech interface in serious games for supporting therapy of mental disorders. Expert Syst. Appl. 2012, 39, 11072–11079. [Google Scholar] [CrossRef]
- Ahmad, S.; Mehmood, F.; Khan, F.; Whangbo, T.K. Architecting Intelligent Smart Serious Games for Healthcare Applications: A Technical Perspective. Sensors 2022, 22, 810. [Google Scholar] [CrossRef]
- Summerville, A.; Snodgrass, S.; Guzdial, M.; Holmgård, C.; Hoover, A.K.; Isaksen, A.; Nealen, A.; Togelius, J. Procedural content generation via machine learning (PCGML). IEEE Trans. Games 2018, 10, 257–270. [Google Scholar] [CrossRef]
- Singh, S.; Barto, A.G.; Chentanez, N. Intrinsically motivated reinforcement learning. In Proceedings of the Advances in Neural Information Processing Systems, Vancouver, BC, Canada, 1 December 2004. [Google Scholar]
- Mitsis, K.; Kalafatis, E.; Zarkogianni, K.; Mourkousis, G.; Nikita, K.S. Procedural content generation based on a genetic algorithm in a serious game for obstructive sleep apnea. In Proceedings of the 2020 IEEE Conference on Games (CoG), Osaka, Japan, 24–27 August 2020; pp. 694–697. [Google Scholar] [CrossRef]
- Zarkogianni, K.; Litsa, E.; Mitsis, K.; Wu, P.Y.; Kaddi, C.D.; Cheng, C.W.; Wang, M.D.; Nikita, K.S. A Review of Emerging Technologies for the Management of Diabetes Mellitus. IEEE Trans. Biomed. Eng. 2015, 62, 2735–2749. [Google Scholar] [CrossRef]
- Valavanis, I.K.; Mougiakakou, S.G.; Grimaldi, K.A.; Nikita, K.S. A multifactorial analysis of obesity as CVD risk factor: Use of neural network based methods in a nutrigenetics context. BMC Bioinform. 2010, 11, 453. [Google Scholar] [CrossRef]
- Skevofilakas, M.; Zarkogianni, K.; Karamanos, B.G.; Nikita, K.S. A hybrid Decision Support System for the risk assessment of retinopathy development as a long term complication of Type 1 Diabetes Mellitus. In Proceedings of the 2010 Annual International Conference of the IEEE Engineering in Medicine and Biology, Buenos Aires, Argentina, 31 August–4 September 2010; Volume 2010, pp. 6713–6716. [Google Scholar] [CrossRef]
- Mitsis, K.; Zarkogianni, K.; Bountouni, N.; Athanasiou, M.; Nikita, K.S. An Ontology-Based Serious Game Design for the Development of Nutrition and Food Literacy Skills. In Proceedings of the 2019 41st Annual International Conference of the IEEE Engineering in Medicine and Biology Society (EMBC), Berlin, Germany, 23–27 July 2019; pp. 1405–1408. [Google Scholar] [CrossRef]
- GameMaker Studio. Available online: https://www.yoyogames.com/en/gamemaker (accessed on 24 December 2021).
- Mitsis, K.; Zarkogianni, K.; Dalakleidi, K.; Mourkousis, G.; Nikita, K.S. Evaluation of a serious game promoting nutrition and food literacy: Experiment design and preliminary results. In Proceedings of the 2019 IEEE 19th International Conference on Bioinformatics and Bioengineering (BIBE), Athens, Greece, 28–30 October 2019; pp. 497–502. [Google Scholar] [CrossRef]
- Lopes, P.; Yannakakis, G.N.; Liapis, A. RankTrace: Relative and unbounded affect annotation. In Proceedings of the 2017 Seventh International Conference on Affective Computing and Intelligent Interaction (ACII), San Antonio, TX, USA, 23–26 October 2017; pp. 158–163. [Google Scholar] [CrossRef]
- Mega 2560 Rev3. Arduino Documentation. Available online: https://docs.arduino.cc/hardware/mega-2560 (accessed on 8 January 2022).
- Fragkiadakis, E.; Dalakleidi, K.V.; Nikita, K.S. Design and Development of a Sitting Posture Recognition System. In Proceedings of the 2019 41st Annual International Conference of the IEEE Engineering in Medicine and Biology Society (EMBC), Berlin, Germany, 23–27 July 2019; pp. 3364–3367. [Google Scholar] [CrossRef]
- Sensitronics. 2019. Available online: https://www.sensitronics.com/fsr101.htm (accessed on 24 December 2021).
- PulseSensor. Available online: https://pulsesensor.com/ (accessed on 24 December 2021).
- Shaffer, F.; Ginsberg, J.P. An Overview of Heart Rate Variability Metrics and Norms. Front. Public Health 2017, 5, 258. [Google Scholar] [CrossRef]
- Munoz, M.L.; Van Roon, A.; Riese, H.; Thio, C.; Oostenbroek, E.; Westrik, I.; De Geus, E.J.C.; Gansevoort, R.; Lefrandt, J.; Nolte, I.M.; et al. Validity of (Ultra-)Short Recordings for Heart Rate Variability Measurements. PLoS ONE 2015, 10, e0138921. [Google Scholar] [CrossRef]
- Salahuddin, L.; Cho, J.; Jeong, M.G.; Kim, D. Ultra short term analysis of heart rate variability for monitoring mental stress in mobile settings. In Proceedings of the 2007 29th Annual International Conference of the IEEE Engineering in Medicine and Biology Society, Lyon, France, 22–26 August 2007; pp. 4656–4659. [Google Scholar] [CrossRef]
- Yannakakis, G.N.; Hallam, J. Towards optimizing entertainment in computer games. Appl. Artif. Intell. 2007, 21, 933–971. [Google Scholar] [CrossRef]
- Poria, S.; Cambria, E.; Bajpai, R.; Hussain, A. A review of affective computing: From unimodal analysis to multimodal fusion. Inf. Fusion 2017, 37, 98–125. [Google Scholar] [CrossRef]
- Hernandez-Gonzalez, J.; Inza, I.; Lozano, J.A. A Note on the Behavior of Majority Voting in Multi-Class Domains with Biased Annotators. IEEE Trans. Knowl. Data Eng. 2019, 31, 195–200. [Google Scholar] [CrossRef]
- D’mello, S.; Graesser, A. Mining bodily patterns of affective experience during learning. In Proceedings of the 2010 3rd International Conference on Educational Data Mining, Pittsburgh, PA, USA, 11–13 June 2010; pp. 31–40. [Google Scholar]


| Posture | Description | Activated Sensors | Sensor Location on Chair |
|---|---|---|---|
| P1 | Upright position with backrest | (3 or 7) and (4 or 8) and (a or d) and (b or c) |  |
| P2 | Upright position without backrest | (3 or 7) and (2 or d) | |
| P3 | Front sitting position | (3 or 4) | |
| P4 | Front sitting position with backrest | (3 or 4) and (a or b or c or d) | |
| P5 | Upright position with right backrest | (3 or 7) and (2 or 8) and (a or c) | |
| P6 | Upright position with left backrest | (3 or 7) and (2 or 8) and (b or d) |
| Reactive Frames (10 s) | Reactive Frames (30 s) | Continuous Frames | |
|---|---|---|---|
| Primary features | 76 ± 5.6 | 83.7 ± 3.7 | 56.4 ± 0.6 |
| Multimodal feature | 76.5 ± 1.1 | 82.7 ± 0.4 | 55.7 ± 0.4 |
| Annotation Features | Reactive Frames (10 s Duration) | Reactive Frames (30 s Duration) | Continuous Frames | |||||||||||||||
|---|---|---|---|---|---|---|---|---|---|---|---|---|---|---|---|---|---|---|
| ΔT | ΔH | ΔT | ΔT | |||||||||||||||
| 0.00 | 0.20 | 0.34 * | 0.00 | 0.12 | 0.26 | 0.28 | 0.51* | 0.01 | 0.01 | −0.12 | 0.25 | - | - | −0.05 | −0.11 | −0.05 | −0.25 | |
| −0.01 | 0.19 | 0.33 * | 0.01 | 0.14 | 0.27 | 0.30 * | 0.49* | 0.03 | 0.04 | −0.10 | 0.28 | - | - | −0.05 | −0.11 | −0.05 | −0.25 | |
| −0.29 | 0.13 | 0.00 | 0.06 | −0.33* | −0.13 | −0.05 | 0.31* | 0.26 | 0.24 | 0.08 | 0.33* | - | - | 0.25 | 0.42 * | 0.18 | 0.42* | |
| −0.07 | 0.04 | 0.01 | 0.16 | −0.11 | 0.15 | 0.06 | 0.18 | 0.11 | 0.13 | −0.21 | 0.07 | - | - | −0.12 | 0.14 | −0.26 | −0.07 | |
Publisher’s Note: MDPI stays neutral with regard to jurisdictional claims in published maps and institutional affiliations. |
© 2022 by the authors. Licensee MDPI, Basel, Switzerland. This article is an open access article distributed under the terms and conditions of the Creative Commons Attribution (CC BY) license (https://creativecommons.org/licenses/by/4.0/).
Share and Cite
Mitsis, K.; Zarkogianni, K.; Kalafatis, E.; Dalakleidi, K.; Jaafar, A.; Mourkousis, G.; Nikita, K.S. A Multimodal Approach for Real Time Recognition of Engagement towards Adaptive Serious Games for Health. Sensors 2022, 22, 2472. https://doi.org/10.3390/s22072472
Mitsis K, Zarkogianni K, Kalafatis E, Dalakleidi K, Jaafar A, Mourkousis G, Nikita KS. A Multimodal Approach for Real Time Recognition of Engagement towards Adaptive Serious Games for Health. Sensors. 2022; 22(7):2472. https://doi.org/10.3390/s22072472
Chicago/Turabian StyleMitsis, Konstantinos, Konstantia Zarkogianni, Eleftherios Kalafatis, Kalliopi Dalakleidi, Amyn Jaafar, Georgios Mourkousis, and Konstantina S. Nikita. 2022. "A Multimodal Approach for Real Time Recognition of Engagement towards Adaptive Serious Games for Health" Sensors 22, no. 7: 2472. https://doi.org/10.3390/s22072472
APA StyleMitsis, K., Zarkogianni, K., Kalafatis, E., Dalakleidi, K., Jaafar, A., Mourkousis, G., & Nikita, K. S. (2022). A Multimodal Approach for Real Time Recognition of Engagement towards Adaptive Serious Games for Health. Sensors, 22(7), 2472. https://doi.org/10.3390/s22072472