
Monitoring and Predictive Maintenance of Centrifugal Pumps Based on Smart Sensors


Abstract
:1. Introduction
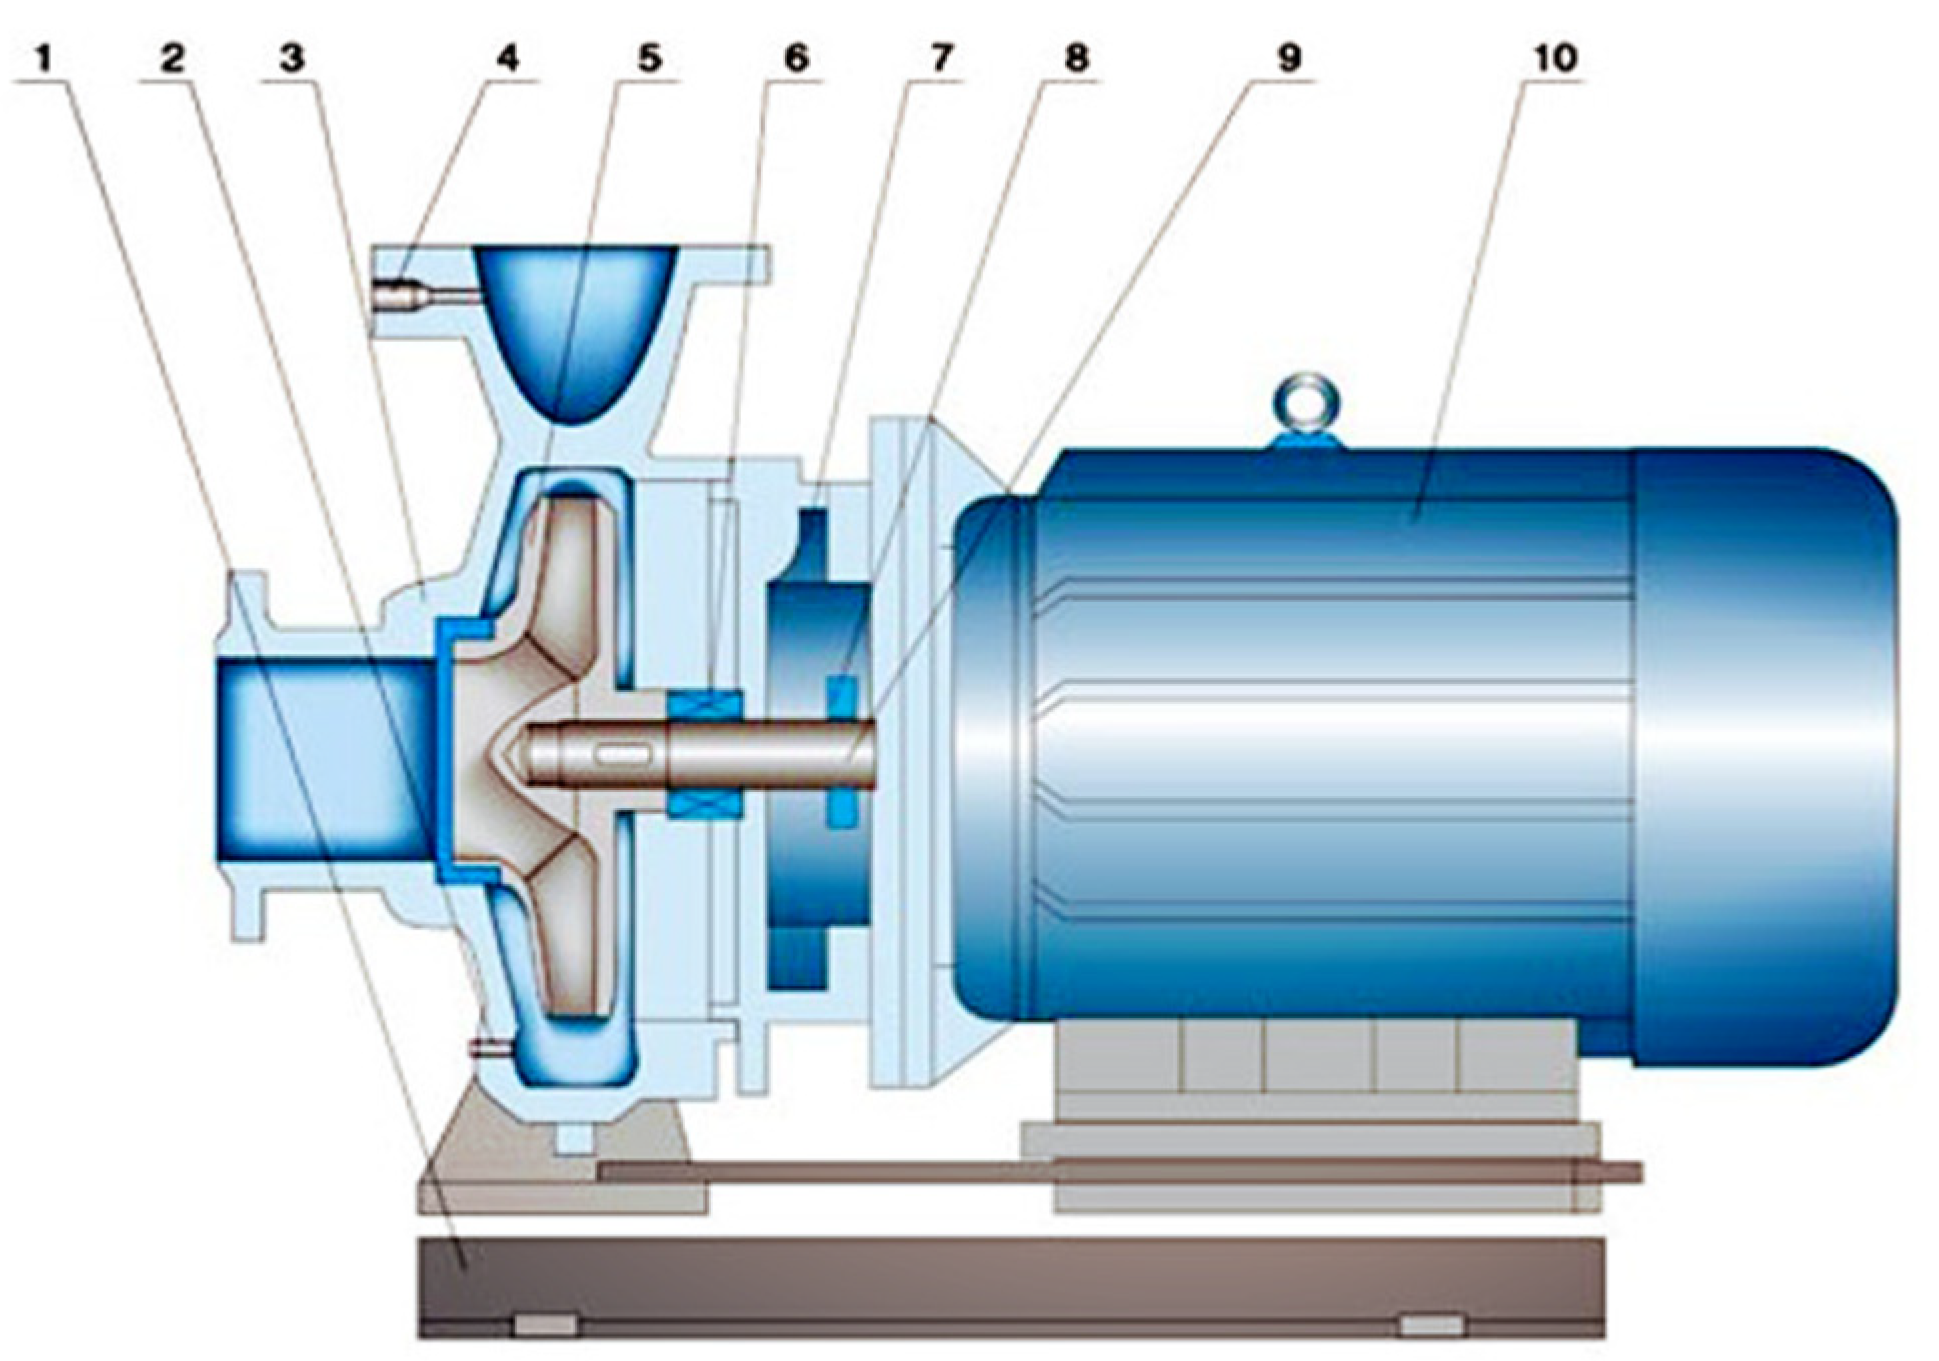
2. Centrifugal Pump Operation Failure and Its Features
2.1. Mechanical Failure
2.1.1. Bearing Fault and Feature
2.1.2. Misalignment Fault and Feature
2.1.3. Imbalance Fault and Feature
2.1.4. Loose Fault and Feature
2.2. Fluid Fault
2.2.1. Abnormal Flow Passage and Feature
2.2.2. Water Hammer Fault and Feature
2.2.3. Cavitation Fault and Feature
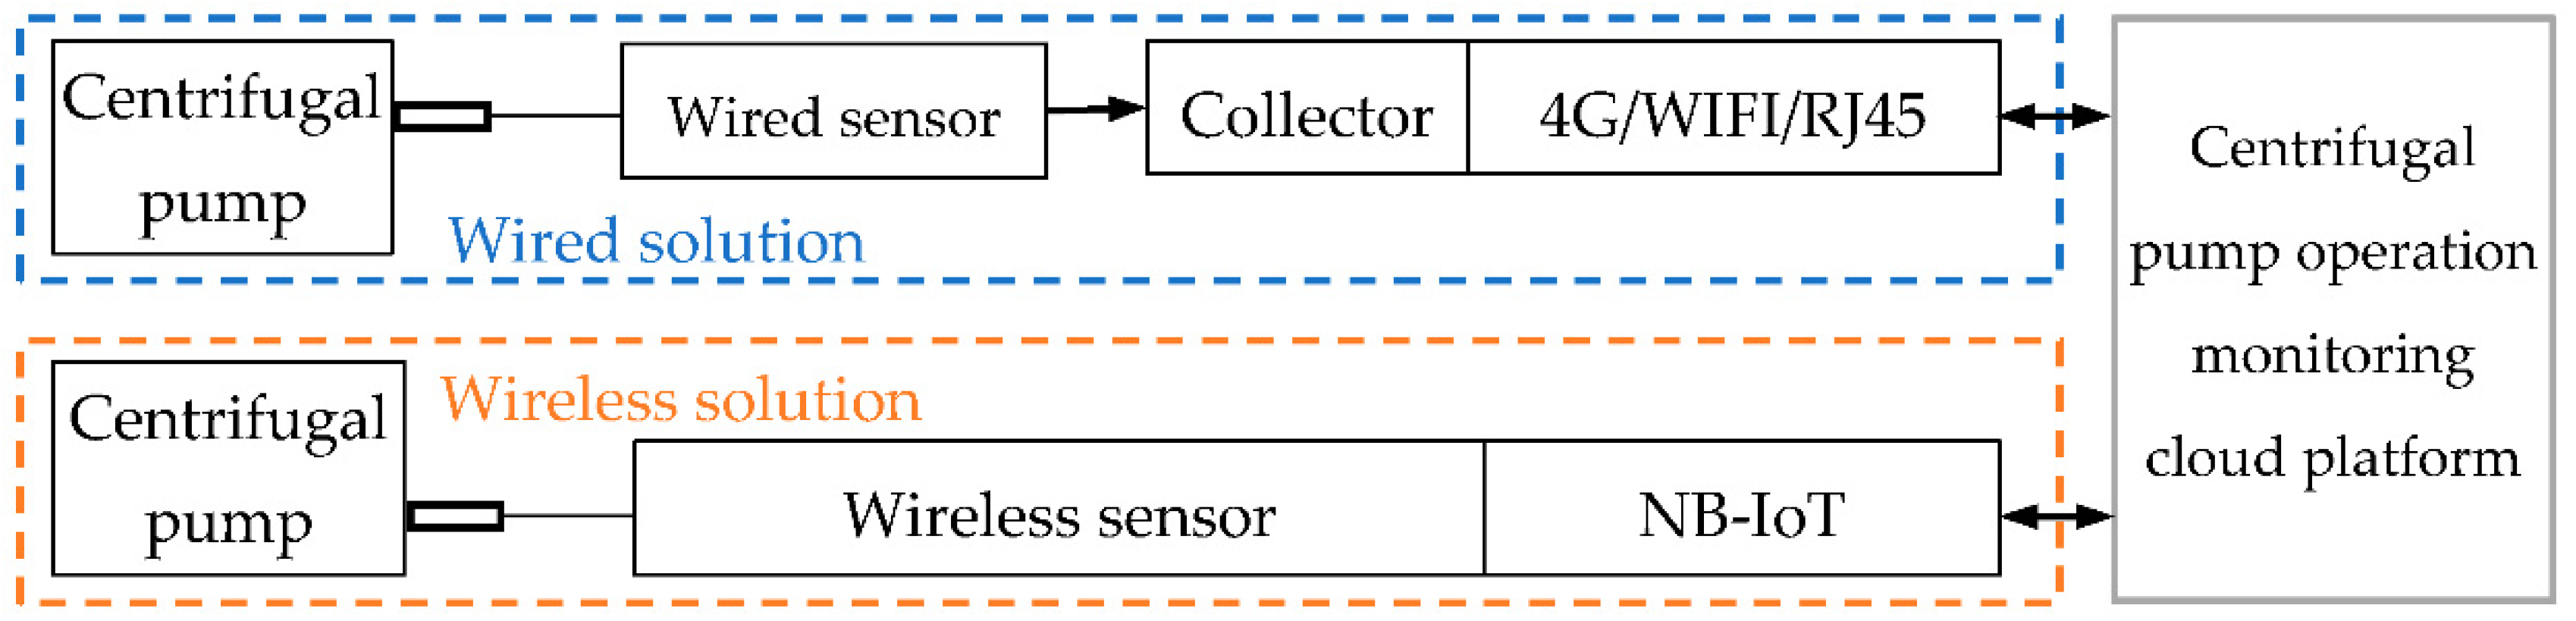
3. Smart Collection Equipment
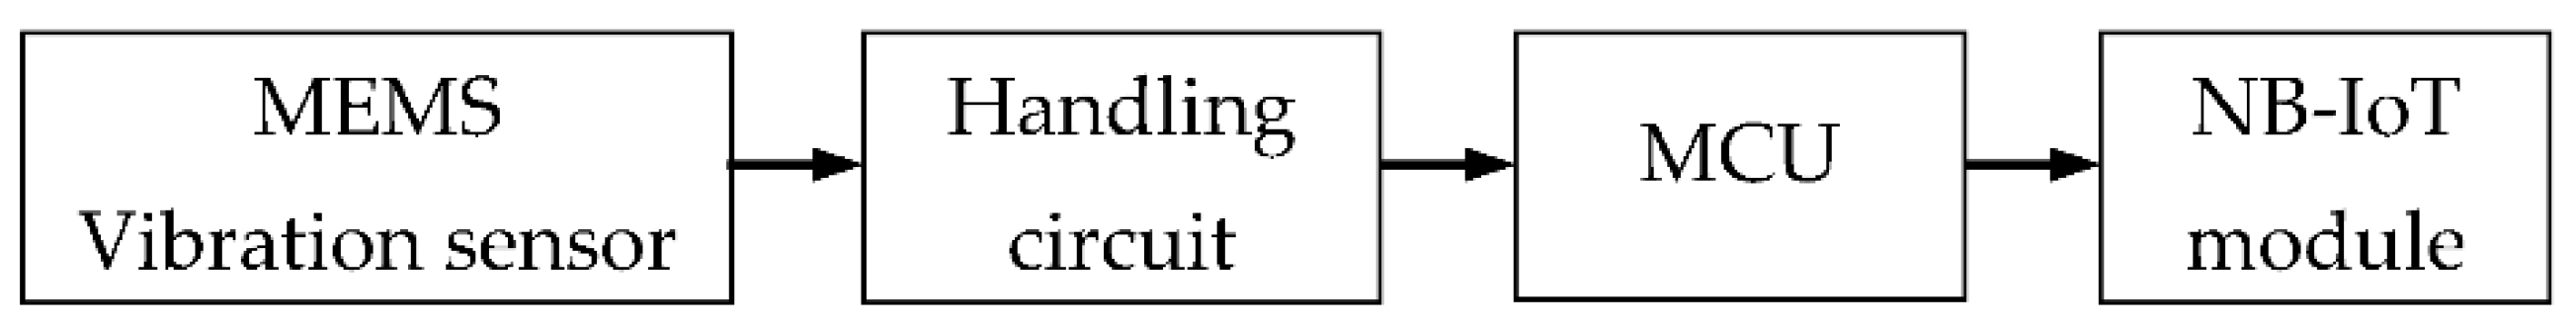
3.1. Wireless Sensor
3.2. Wired Sensors and Collectors
3.3. Monitoring and Diagnosis
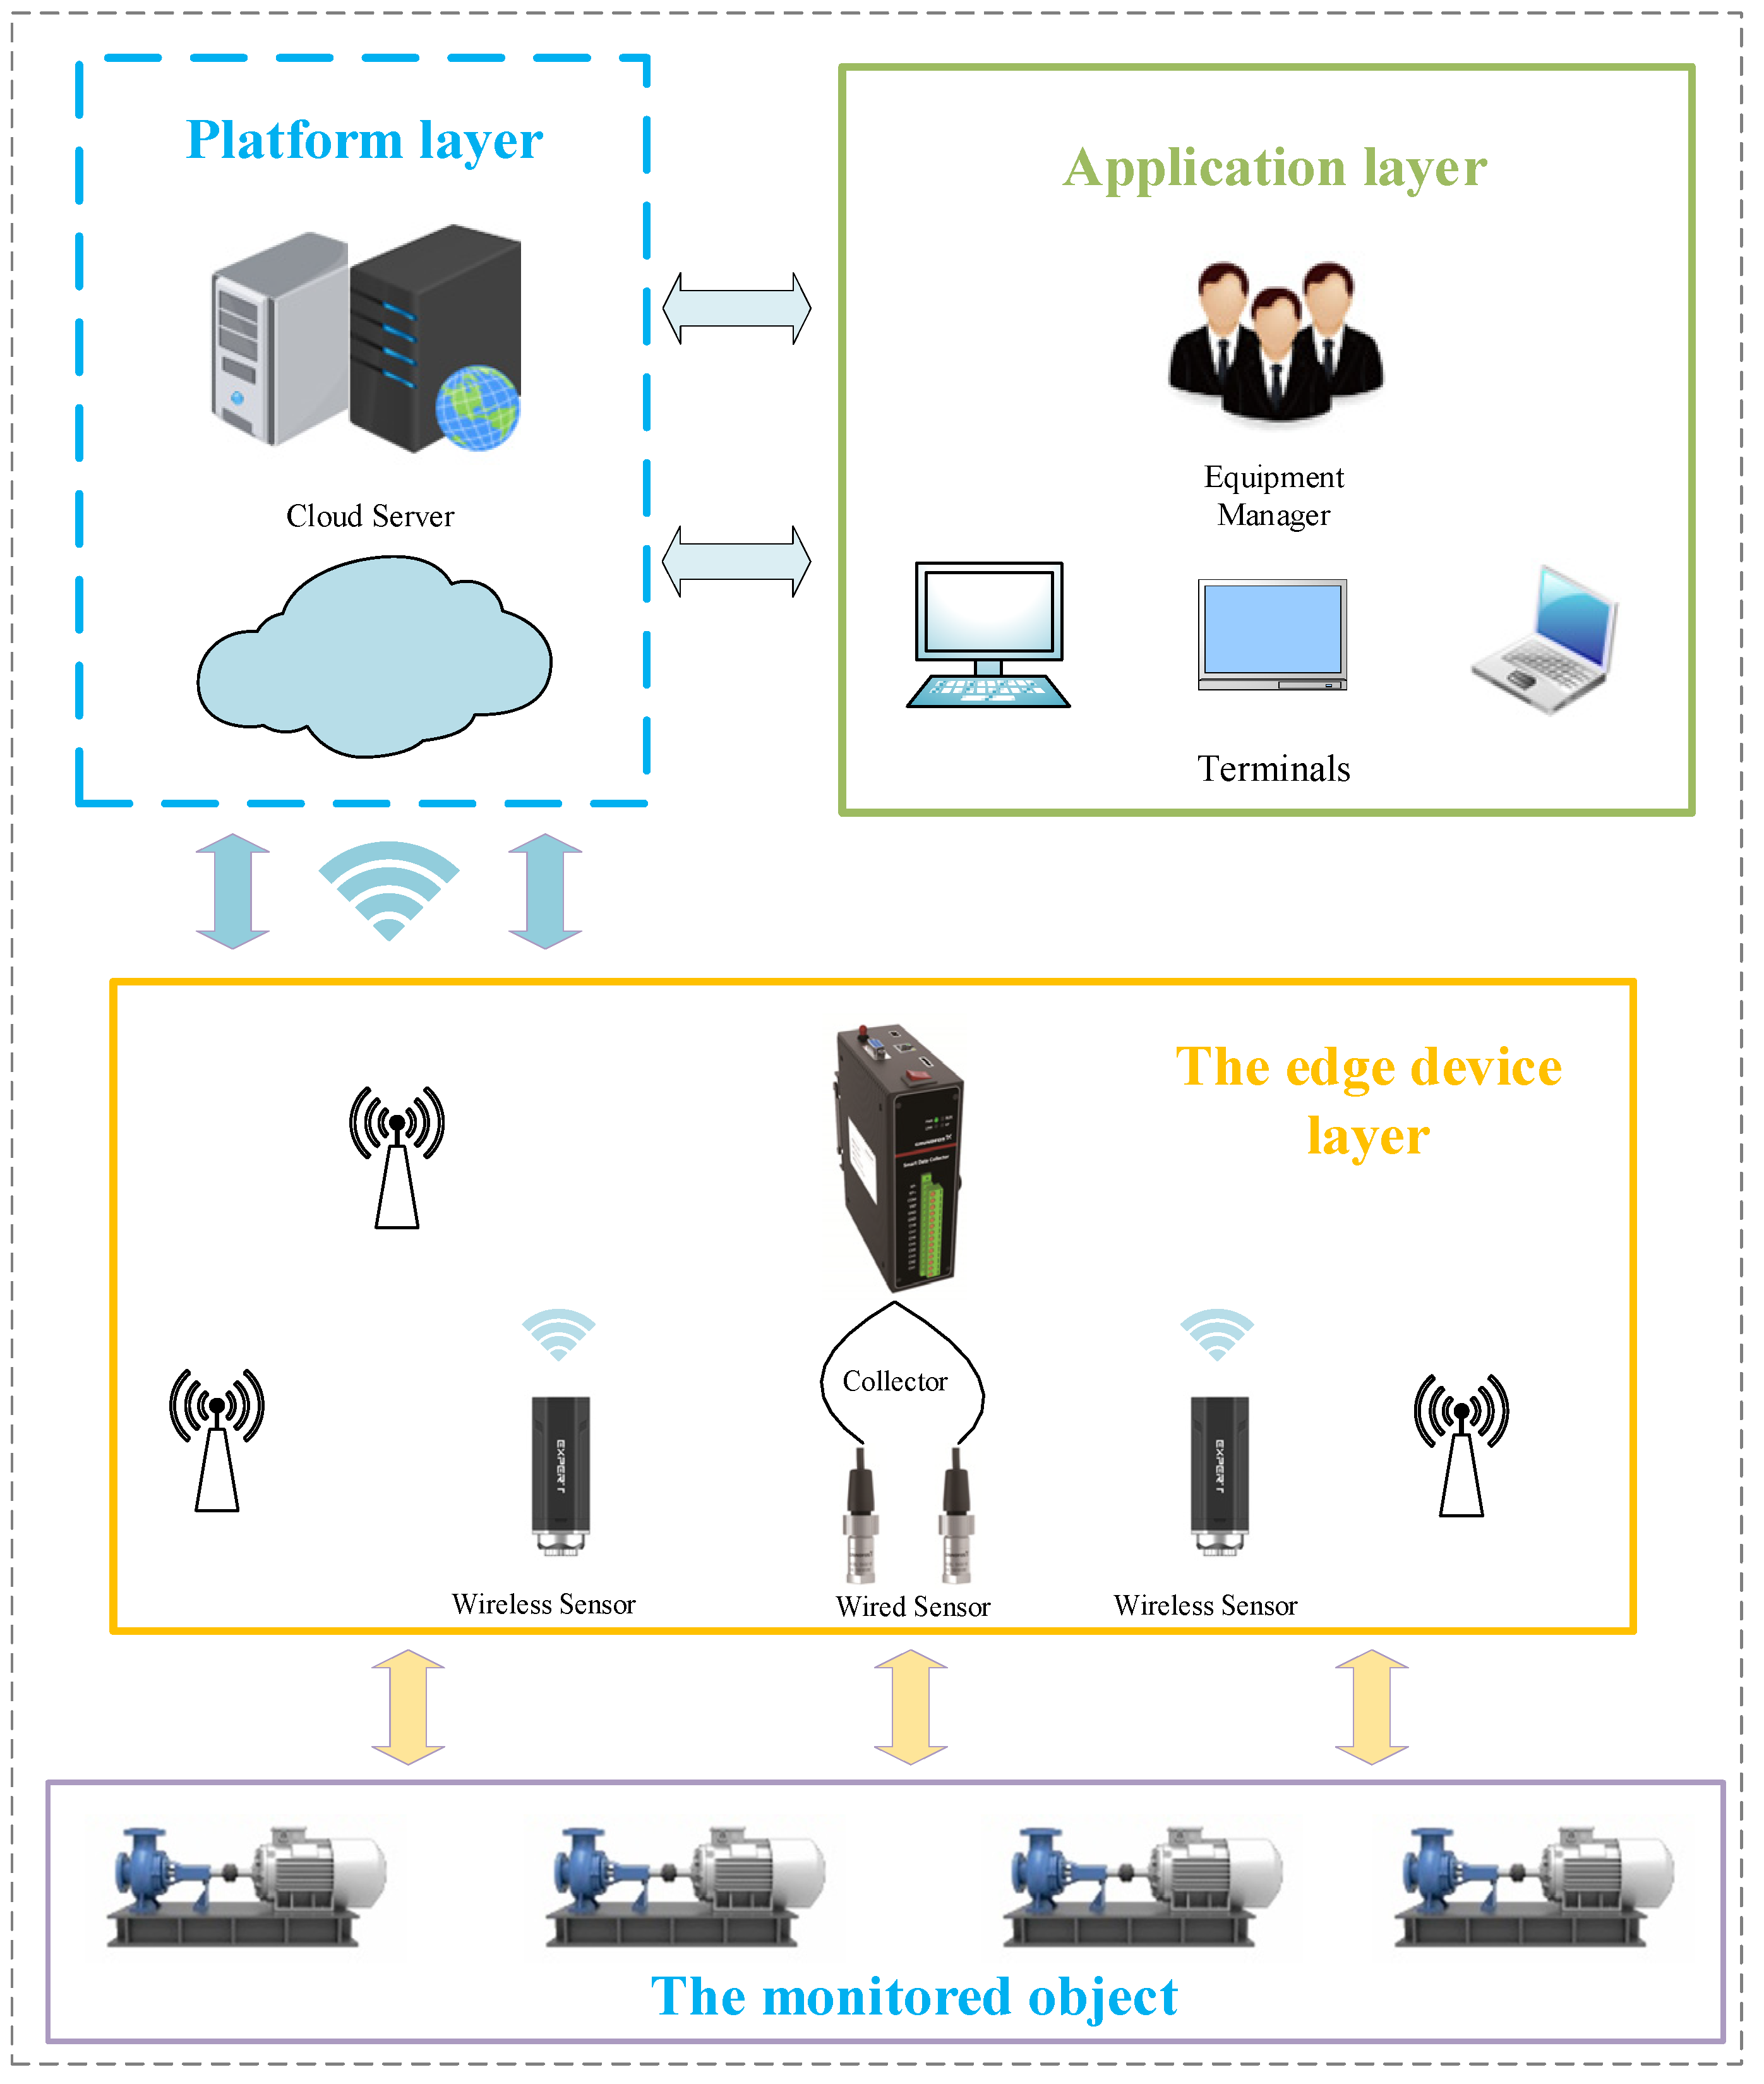
4. Overall System Architecture
5. Experimental Testing and Application Verification
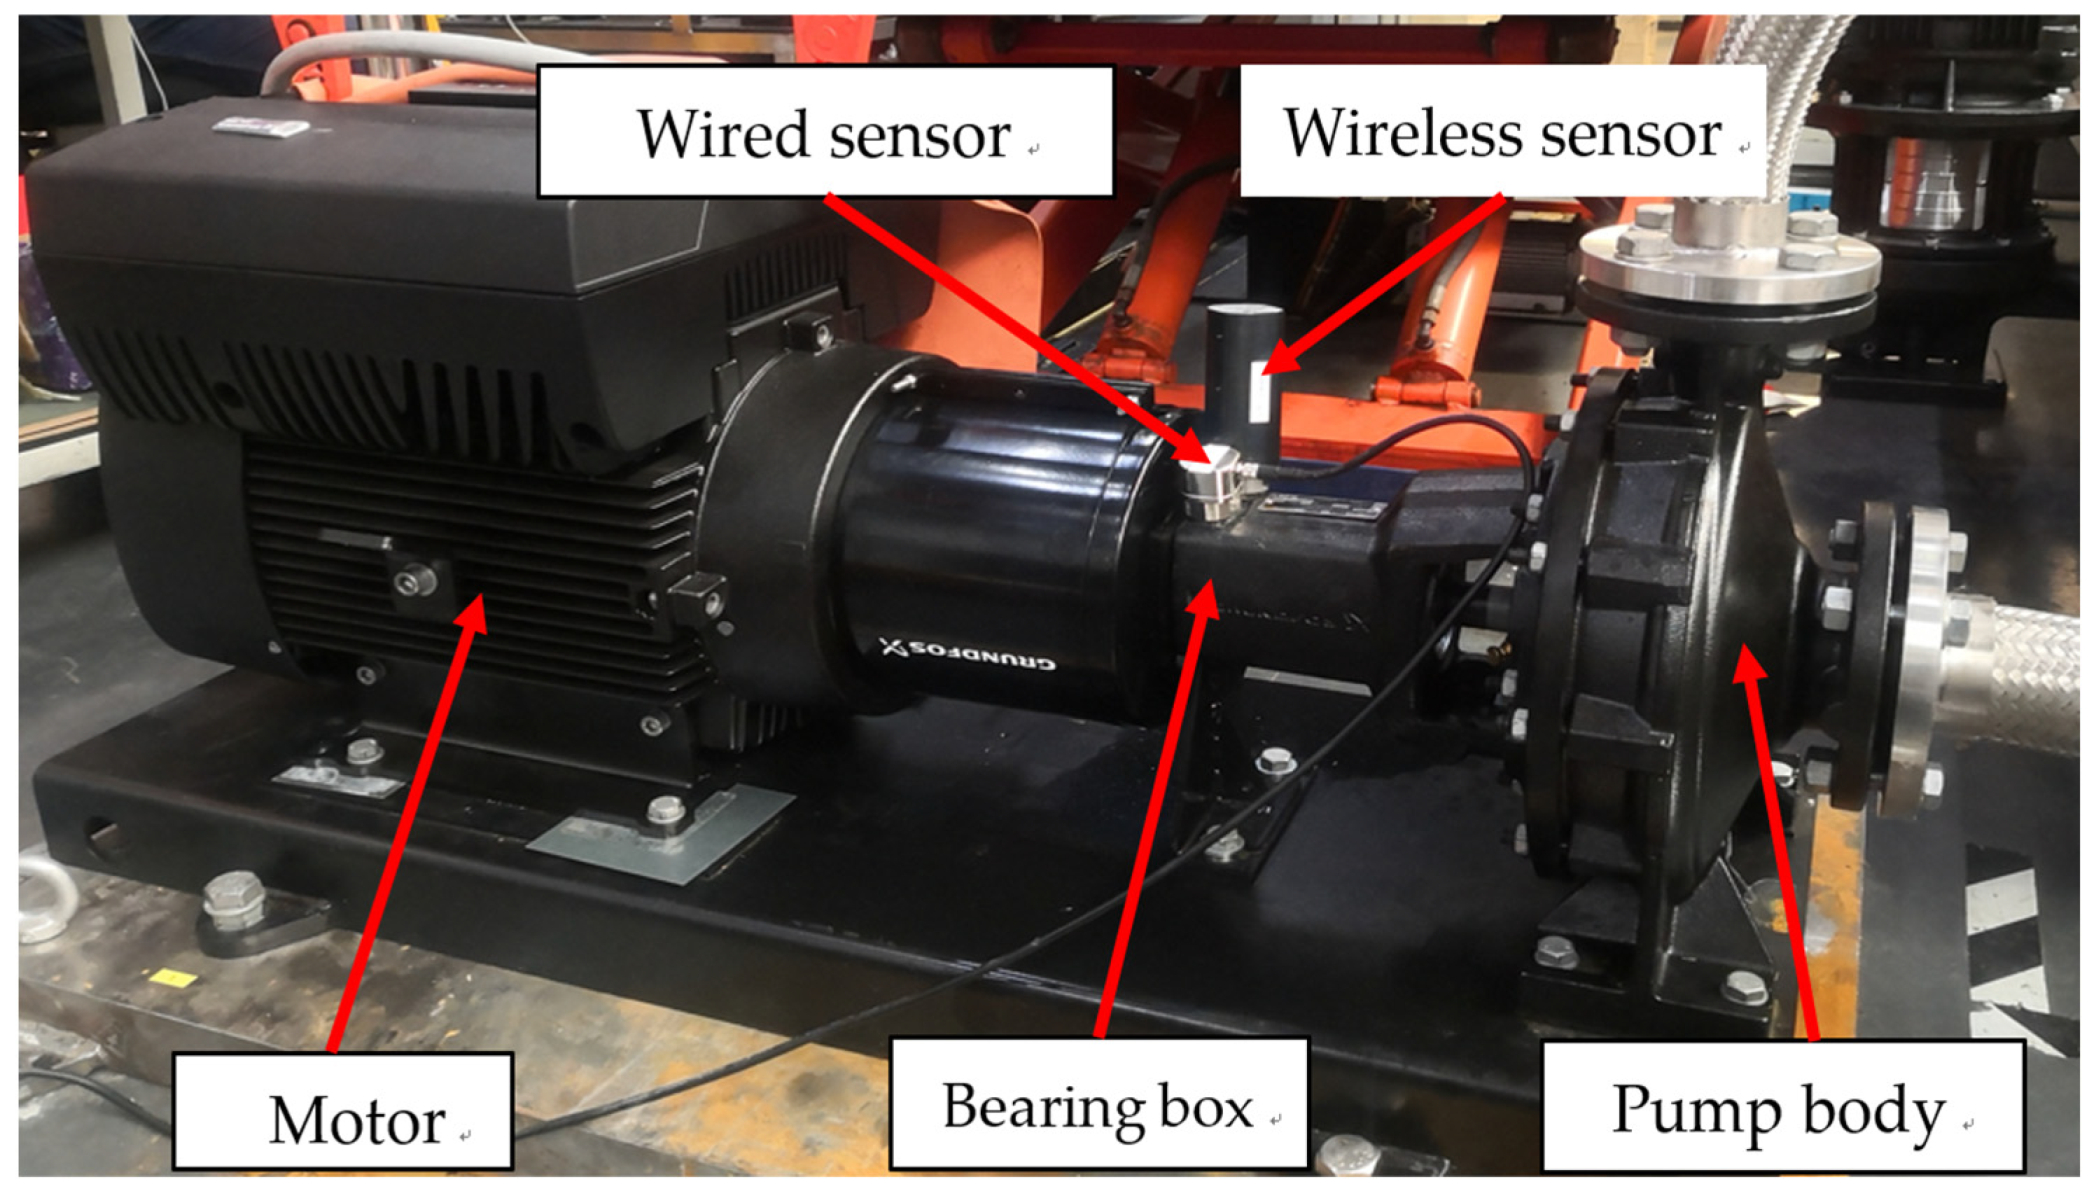
5.1. Test Environment
5.2. The Process of Testing
- (1)
- Imbalance fault:
- (2)
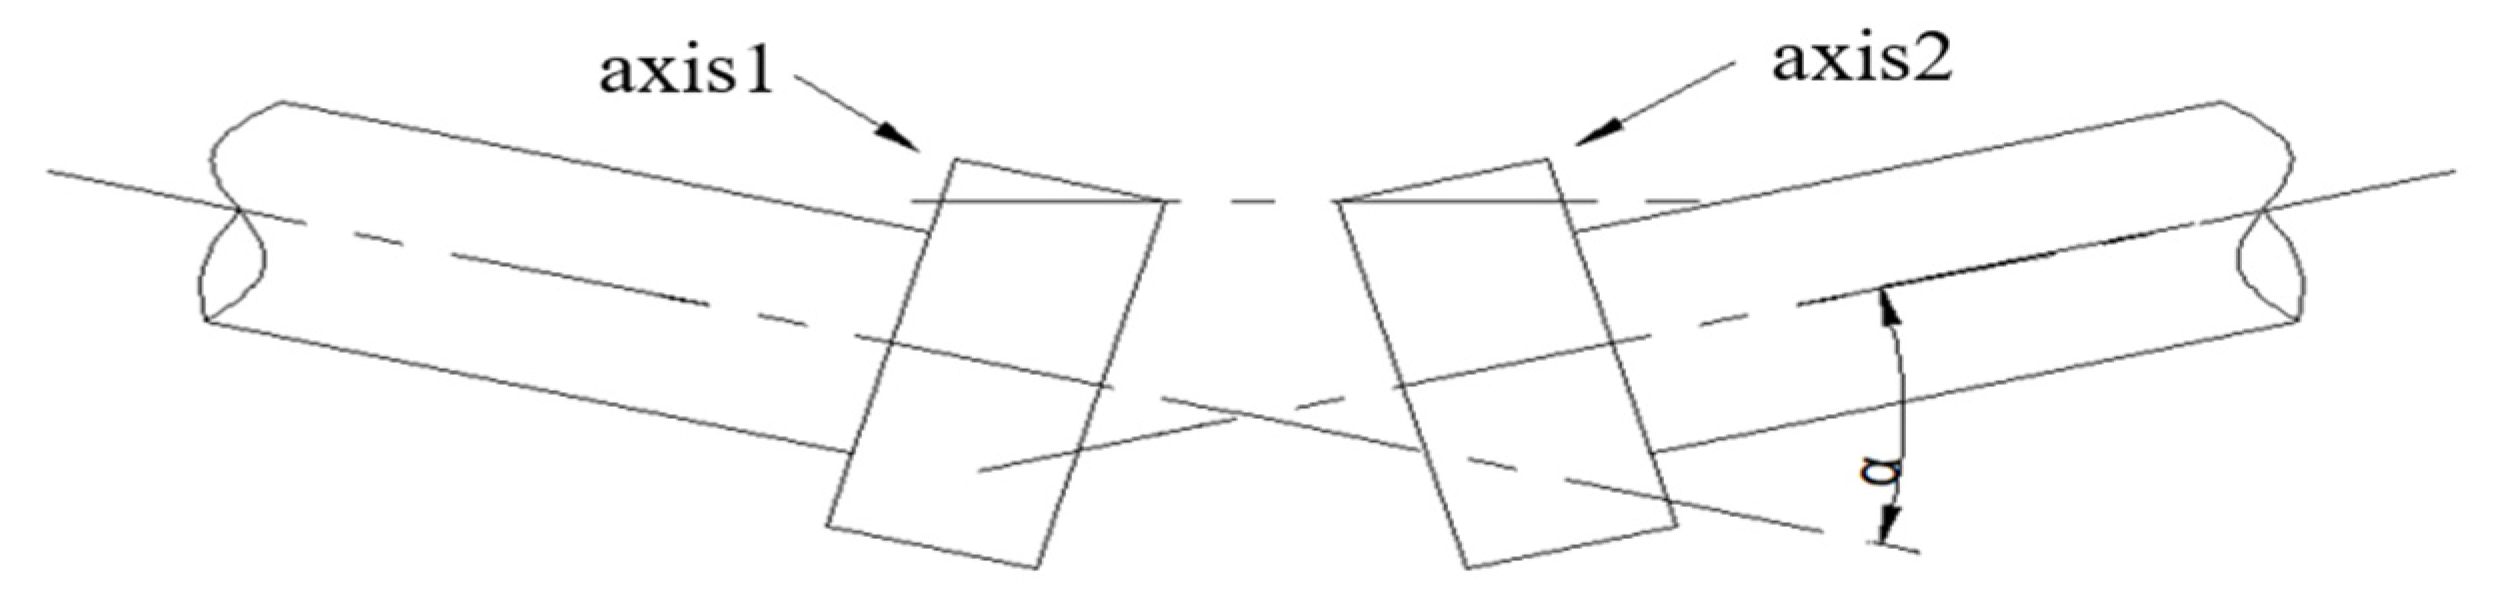
- Misalignment fault:
- (3)
- Loose fault:
- (4)
- Bearing fault:
5.3. Test Results and Analysis
6. Conclusions
Author Contributions
Funding
Institutional Review Board Statement
Informed Consent Statement
Data Availability Statement
Conflicts of Interest
References
- Sakthivel, N.R.; Sugumaran, V.; Babudevasenapati, S. Vibration Based Fault Diagnosis of Monoblock Centrifugal Pump Using Decision Tree. Expert Syst. Appl. 2010, 37, 4040–4049. [Google Scholar] [CrossRef]
- Rapur, J.S.; Tiwari, R. Experimental Fault Diagnosis for Known and Unseen Operating Conditions of Centrifugal Pumps Using MSVM and WPT Based Analyses. Measurement 2019, 147, 106809. [Google Scholar] [CrossRef]
- Zhao, W.; Egusquiza, M.; Valero, C.; Valentín, D.; Presas, A.; Egusquiza, E. On the Use of Artificial Neural Networks for Condition Monitoring of Pump-Turbines with Extended Operation. Measurement 2020, 163, 107952. [Google Scholar] [CrossRef]
- Mobley, R.K. (Ed.) 4—Benefits of Predictive Maintenance. In An Introduction to Predictive Maintenance, 2nd ed.; Plant Engineering; Butterworth-Heinemann: Burlington, NJ, USA, 2002; pp. 60–73. ISBN 978-0-7506-7531-4. [Google Scholar]
- Lee, J.; Wu, F.; Zhao, W.; Ghaffari, M.; Liao, L.; Siegel, D. Prognostics and Health Management Design for Rotary Machinery Systems—Reviews, Methodology and Applications. Mech. Syst. Signal Process. 2014, 42, 314–334. [Google Scholar] [CrossRef]
- Bousdekis, A.; Lepenioti, K.; Apostolou, D.; Mentzas, G. Decision Making in Predictive Maintenance: Literature Review and Research Agenda for Industry 4.0. IFAC-PapersOnLine 2019, 52, 607–612. [Google Scholar] [CrossRef]
- Azadeh, A.; Saberi, M.; Kazem, A.; Ebrahimipour, V.; Nourmohammadzadeh, A.; Saberi, Z. A Flexible Algorithm for Fault Diagnosis in a Centrifugal Pump with Corrupted Data and Noise Based on ANN and Support Vector Machine with Hyper-Parameters Optimization. Appl. Soft Comput. 2013, 13, 1478–1485. [Google Scholar] [CrossRef]
- Orrù, P.F.; Zoccheddu, A.; Sassu, L.; Mattia, C.; Cozza, R.; Arena, S. Machine Learning Approach Using MLP and SVM Algorithms for the Fault Prediction of a Centrifugal Pump in the Oil and Gas Industry. Sustainability 2020, 12, 4776. [Google Scholar] [CrossRef]
- Gonçalves, J.P.S.; Fruett, F.; Dalfré Filho, J.G.; Giesbrecht, M. Faults Detection and Classification in a Centrifugal Pump from Vibration Data Using Markov Parameters. Mech. Syst. Signal Process. 2021, 158, 107694. [Google Scholar] [CrossRef]
- Ahmad, Z.; Nguyen, T.-K.; Ahmad, S.; Nguyen, C.D.; Kim, J.-M. Multistage Centrifugal Pump Fault Diagnosis Using Informative Ratio Principal Component Analysis. Sensors 2022, 22, 179. [Google Scholar] [CrossRef]
- Bozorgasareh, H.; Khalesi, J.; Jafari, M.; Gazori, H.O. Performance Improvement of Mixed-Flow Centrifugal Pumps with New Impeller Shrouds: Numerical and Experimental Investigations. Renew. Energy 2021, 163, 635–648. [Google Scholar] [CrossRef]
- McKee, K.K.; Forbes, G.L.; Mazhar, M.; Entwistle, R.; Howard, I. A Review of Major Centrifugal Pump Failure Modes with Application to the Water Supply and Sewerage Industries. In Proceedings of the ICOMS Asset Management Conference Proceedings, Gold Coast, QLD, Australia, 16 May 2011. [Google Scholar]
- Tong, Z.; Xin, J.; Tong, S.; Yang, Z.; Zhao, J.; Mao, J. Internal Flow Structure, Fault Detection, and Performance Optimization of Centrifugal Pumps. J. Zhejiang Univ.-Sci. A 2020, 21, 85–117. [Google Scholar] [CrossRef]
- De Araújo, R.D.B.; Rocha, J.M.M.; Dos Santos, M.A.; Ramalho, G.L.B. Fast Detection of Centrifugal Pumps Condition by Structural Analysis of MEMS Sensor Signals. J. Control Autom. Electr. Syst. 2022, 33, 293–303. [Google Scholar] [CrossRef]
- McKee, K.K.; Forbes, G.L.; Mazhar, I.; Entwistle, R.; Howard, I. A Review of Machinery Diagnostics and Prognostics Implemented on a Centrifugal Pump. In Proceedings of the Engineering Asset Management 2011; Lee, J., Ni, J., Sarangapani, J., Mathew, J., Eds.; Springer: London, UK, 2014; pp. 593–614. [Google Scholar]
- Catelani, M.; Ciani, L.; Bartolini, A.; Del Rio, C.; Guidi, G.; Patrizi, G. Reliability Analysis of Wireless Sensor Network for Smart Farming Applications. Sensors 2021, 21, 7683. [Google Scholar] [CrossRef] [PubMed]
- Sunny, A.I.; Zhao, A.; Li, L.; Kanteh Sakiliba, S. Low-Cost IoT-Based Sensor System: A Case Study on Harsh Environmental Monitoring. Sensors 2021, 21, 214. [Google Scholar] [CrossRef] [PubMed]
- Abraham, M.T.; Satyam, N.; Pradhan, B.; Alamri, A.M. IoT-Based Geotechnical Monitoring of Unstable Slopes for Landslide Early Warning in the Darjeeling Himalayas. Sensors 2020, 20, 2611. [Google Scholar] [CrossRef] [PubMed]
- Ren, S.; Kim, J.-S.; Cho, W.-S.; Soeng, S.; Kong, S.; Lee, K.-H. Big Data Platform for Intelligence Industrial IoT Sensor Monitoring System Based on Edge Computing and AI. In Proceedings of the 2021 International Conference on Artificial Intelligence in Information and Communication (ICAIIC), Jeju Island, Korea, 13–16 April 2021; pp. 480–482. [Google Scholar]
- Vaclavova, A.; Strelec, P.; Horak, T.; Kebisek, M.; Tanuska, P.; Huraj, L. Proposal for an IIoT Device Solution According to Industry 4.0 Concept. Sensors 2022, 22, 325. [Google Scholar] [CrossRef] [PubMed]
- Hasan, M.J.; Rai, A.; Ahmad, Z.; Kim, J.-M. A Fault Diagnosis Framework for Centrifugal Pumps by Scalogram-Based Imaging and Deep Learning. IEEE Access 2021, 9, 58052–58066. [Google Scholar] [CrossRef]
- Chen, L.; Han, J.; Lei, W.; Guan, Z.; Gao, Y. Prediction Model of Vibration Feature for Equipment Maintenance Based on Full Vector Spectrum. Shock. Vib. 2017, 2017, e6103947. [Google Scholar] [CrossRef] [Green Version]
- Cao, R.; Yuan, J.; Deng, F.; Wang, L. Numerical Method to Predict Vibration Characteristics Induced by Cavitation in Centrifugal Pumps. Meas. Sci. Technol. 2021, 32, 115109. [Google Scholar] [CrossRef]
- Al-Braik, A.; AlThobiani, F.; Gu, F.; Ball, A. Diagnosis of Centrifugal Pump Faults Using Vibration Methods. J. Phys. Conf. Ser. 2012, 364, 012139. [Google Scholar] [CrossRef] [Green Version]
- Hu, Y.; Chit Tan, A.; Liang, C.; Li, Y. Failure Analysis of Fractured Motor Bolts in High-Speed Train Due to Cardan Shaft Misalignment. Eng. Fail. Anal. 2021, 122, 105246. [Google Scholar] [CrossRef]
- Wang, Z.; He, W.; Du, S.; Yuan, Z. Study on the Unbalanced Fault Dynamic Characteristics of Eccentric Motorized Spindle Considering the Effect of Magnetic Pull. Shock. Vib. 2021, 2021, 5536853. [Google Scholar] [CrossRef]
- Chu, F.; Tang, Y. Stability and Nonlinear Responses of a Rotor-Bearing System with Pedestal Looseness. J. Sound Vib. 2001, 241, 879–893. [Google Scholar] [CrossRef]
- Zhou, T.; Huang, F.; Han, Y.; Luo, Y. Study on Dynamics Characteristics of Labyrinth-Seal-Rotor System with Pedestal Looseness. In Proceedings of the 2021 Global Reliability and Prognostics and Health Management (PHM-Nanjing), Nanjing, China, 15–17 October 2021; pp. 1–8. [Google Scholar]
- Kan, E.; Muratov, A.; Yusupov, M.; Ikramov, N. Calculation of Water Hammer on the Pressure Pipeline of Modernized Irrigation Pumping Station. IOP Conf. Ser. Mater. Sci. Eng. 2021, 1030, 012127. [Google Scholar] [CrossRef]
- Zhang, W.; Yang, S.; Wu, D.; Xu, Z. Dynamic Interaction between Valve-Closure Water Hammer Wave and Centrifugal Pump. Proc. Inst. Mech. Eng. Part C J. Mech. Eng. Sci. 2021, 235, 6767–6781. [Google Scholar] [CrossRef]
- Tiwari, R.; Bordoloi, D.J.; Dewangan, A. Blockage and Cavitation Detection in Centrifugal Pumps from Dynamic Pressure Signal Using Deep Learning Algorithm. Measurement 2021, 173, 108676. [Google Scholar] [CrossRef]
- Al-Obaidi, A.R. Detection of Cavitation Phenomenon within a Centrifugal Pump Based on Vibration Analysis Technique in Both Time and Frequency Domains. Exp. Tech. 2020, 44, 329–347. [Google Scholar] [CrossRef]
- Guo, C.; Gao, M.; He, S. A Review of the Flow-Induced Noise Study for Centrifugal Pumps. Appl. Sci. 2020, 10, 1022. [Google Scholar] [CrossRef] [Green Version]
- Sinha, R.S.; Wei, Y.; Hwang, S.-H. A Survey on LPWA Technology: LoRa and NB-IoT. ICT Express 2017, 3, 14–21. [Google Scholar] [CrossRef]
- Yogendra Prasad, P.; Heera, H.; Padmaja, N.; Sony, B. A Comparative Analysis of Long Range and NB-IoT in Terms of Quality of Connectivity. Mater. Today Proc. 2021, 1–10. [Google Scholar] [CrossRef]
- Goutte, C.; Gaussier, E. A Probabilistic Interpretation of Precision, Recall and F-Score, with Implication for Evaluation. In Proceedings of the Advances in Information Retrieval, Santiago de Compostela, Spain, 21–23 March 2005; Losada, D.E., Fernández-Luna, J.M., Eds.; Springer: Berlin/Heidelberg, Germany, 2005; pp. 345–359. [Google Scholar]
- Flach, P.; Kull, M. Precision-Recall-Gain Curves: PR Analysis Done Right. In Proceedings of the Advances in Neural Information Processing Systems, Montreal, QC, Canada, 7–12 December 2015; Volume 28. [Google Scholar]


| Common faults in the running state of centrifugal pumps | Mechanical failure | Imbalance fault |
| Misalignment fault | ||
| Loose fault | ||
| Bearing fault | ||
| Fluid failure | Cavitation | |
| Water hammer | ||
| Abnormal flow passage |
| Parameter | Numeric Value |
|---|---|
| Type of pump | NKE 40-250/255 |
| Rated power (kW) | 22 |
| Rated speed (rpm) | 2940 |
| Center height (mm) | 185 |
| Number of impeller blades | 5 |
| Mains frequency (Hz) | 50 |
| Type of bearing | Cylindrical roller bearing |
| Serial Number | Misaligned (Parallel) Level (μm) | Misaligned (Angle) Level (μm) |
|---|---|---|
| 1 | Initial | Initial |
| 2 | −500 | −3000 |
| 3 | −200 | −1500 |
| 4 | +200 | +3000 |
| 5 | +500 | +1500 |
| Serial Number | X (Length) (mm) | Y (Width) (mm) | Z (Depth) (mm) |
|---|---|---|---|
| 1 | 0 | 0 | 0 |
| 2 | 3 | 15 | 1 |
| 3 | 6 | 15 | 1 |
| 4 | 15 | 15 | 1 |
| Diagnosis: Fault A | Diagnosis: Normal or Other Faults | |
|---|---|---|
| Real: Fault A | True positive | False negative |
| Real: Normal | False positive | True negative |
| Type of Fault | Type of Sensor | Number of Test Samples | Sample of Normal | Sample of Failure | Number of Correct Diagnosis | Number of Missed Diagnosis | Number of Misdiagnosis | Diagnostic Accuracy | Diagnostic Precision | Diagnostic Recall |
|---|---|---|---|---|---|---|---|---|---|---|
| Imbalance fault | Wired | 90 | 35 | 55 | 46 | 4 | 5 | 90.00% | 90.20% | 92.00% |
| Wireless | 88 | 41 | 47 | 39 | 4 | 4 | 90.91% | 90.70% | 90.70% | |
| Misalignment fault | Wired | 38 | 20 | 18 | 17 | 0 | 1 | 97.37% | 94.44% | 100% |
| Wireless | 37 | 23 | 14 | 11 | 2 | 1 | 91.89% | 91.67% | 84.62% |
| The Type of Fault | The Type of Sensor | Diagnostic Accuracy | Diagnostic Precision | Diagnostic Recall |
|---|---|---|---|---|
| Imbalance fault | Wired | 90.00% | 90.20% | 92.00% |
| Wireless | 90.91% | 90.70% | 90.70% | |
| Misalignment fault | Wired | 97.37% | 94.44% | 100% |
| Wireless | 91.89% | 91.67% | 84.62% | |
| Loose fault | Wired | 95.08% | 100% | 91.43% |
| Wireless | 80.33% | 91.30% | 83.13% | |
| Bearing fault | Wired | 100% | 100% | 100% |
| Wireless | N.A. | N.A. | N.A. | |
| Cavitation fault | Wired | 85.71% | 100% | 85.71% |
| Wireless | N.A. | N.A. | N.A. |
Publisher’s Note: MDPI stays neutral with regard to jurisdictional claims in published maps and institutional affiliations. |
© 2022 by the authors. Licensee MDPI, Basel, Switzerland. This article is an open access article distributed under the terms and conditions of the Creative Commons Attribution (CC BY) license (https://creativecommons.org/licenses/by/4.0/).
Share and Cite
Chen, L.; Wei, L.; Wang, Y.; Wang, J.; Li, W. Monitoring and Predictive Maintenance of Centrifugal Pumps Based on Smart Sensors. Sensors 2022, 22, 2106. https://doi.org/10.3390/s22062106
Chen L, Wei L, Wang Y, Wang J, Li W. Monitoring and Predictive Maintenance of Centrifugal Pumps Based on Smart Sensors. Sensors. 2022; 22(6):2106. https://doi.org/10.3390/s22062106
Chicago/Turabian StyleChen, Lei, Lijun Wei, Yu Wang, Junshuo Wang, and Wenlong Li. 2022. "Monitoring and Predictive Maintenance of Centrifugal Pumps Based on Smart Sensors" Sensors 22, no. 6: 2106. https://doi.org/10.3390/s22062106
APA StyleChen, L., Wei, L., Wang, Y., Wang, J., & Li, W. (2022). Monitoring and Predictive Maintenance of Centrifugal Pumps Based on Smart Sensors. Sensors, 22(6), 2106. https://doi.org/10.3390/s22062106