
The Microsoft HoloLens 2 Provides Accurate Measures of Gait, Turning, and Functional Mobility in Healthy Adults

Abstract
:1. Introduction
2. Methods
2.1. Participants
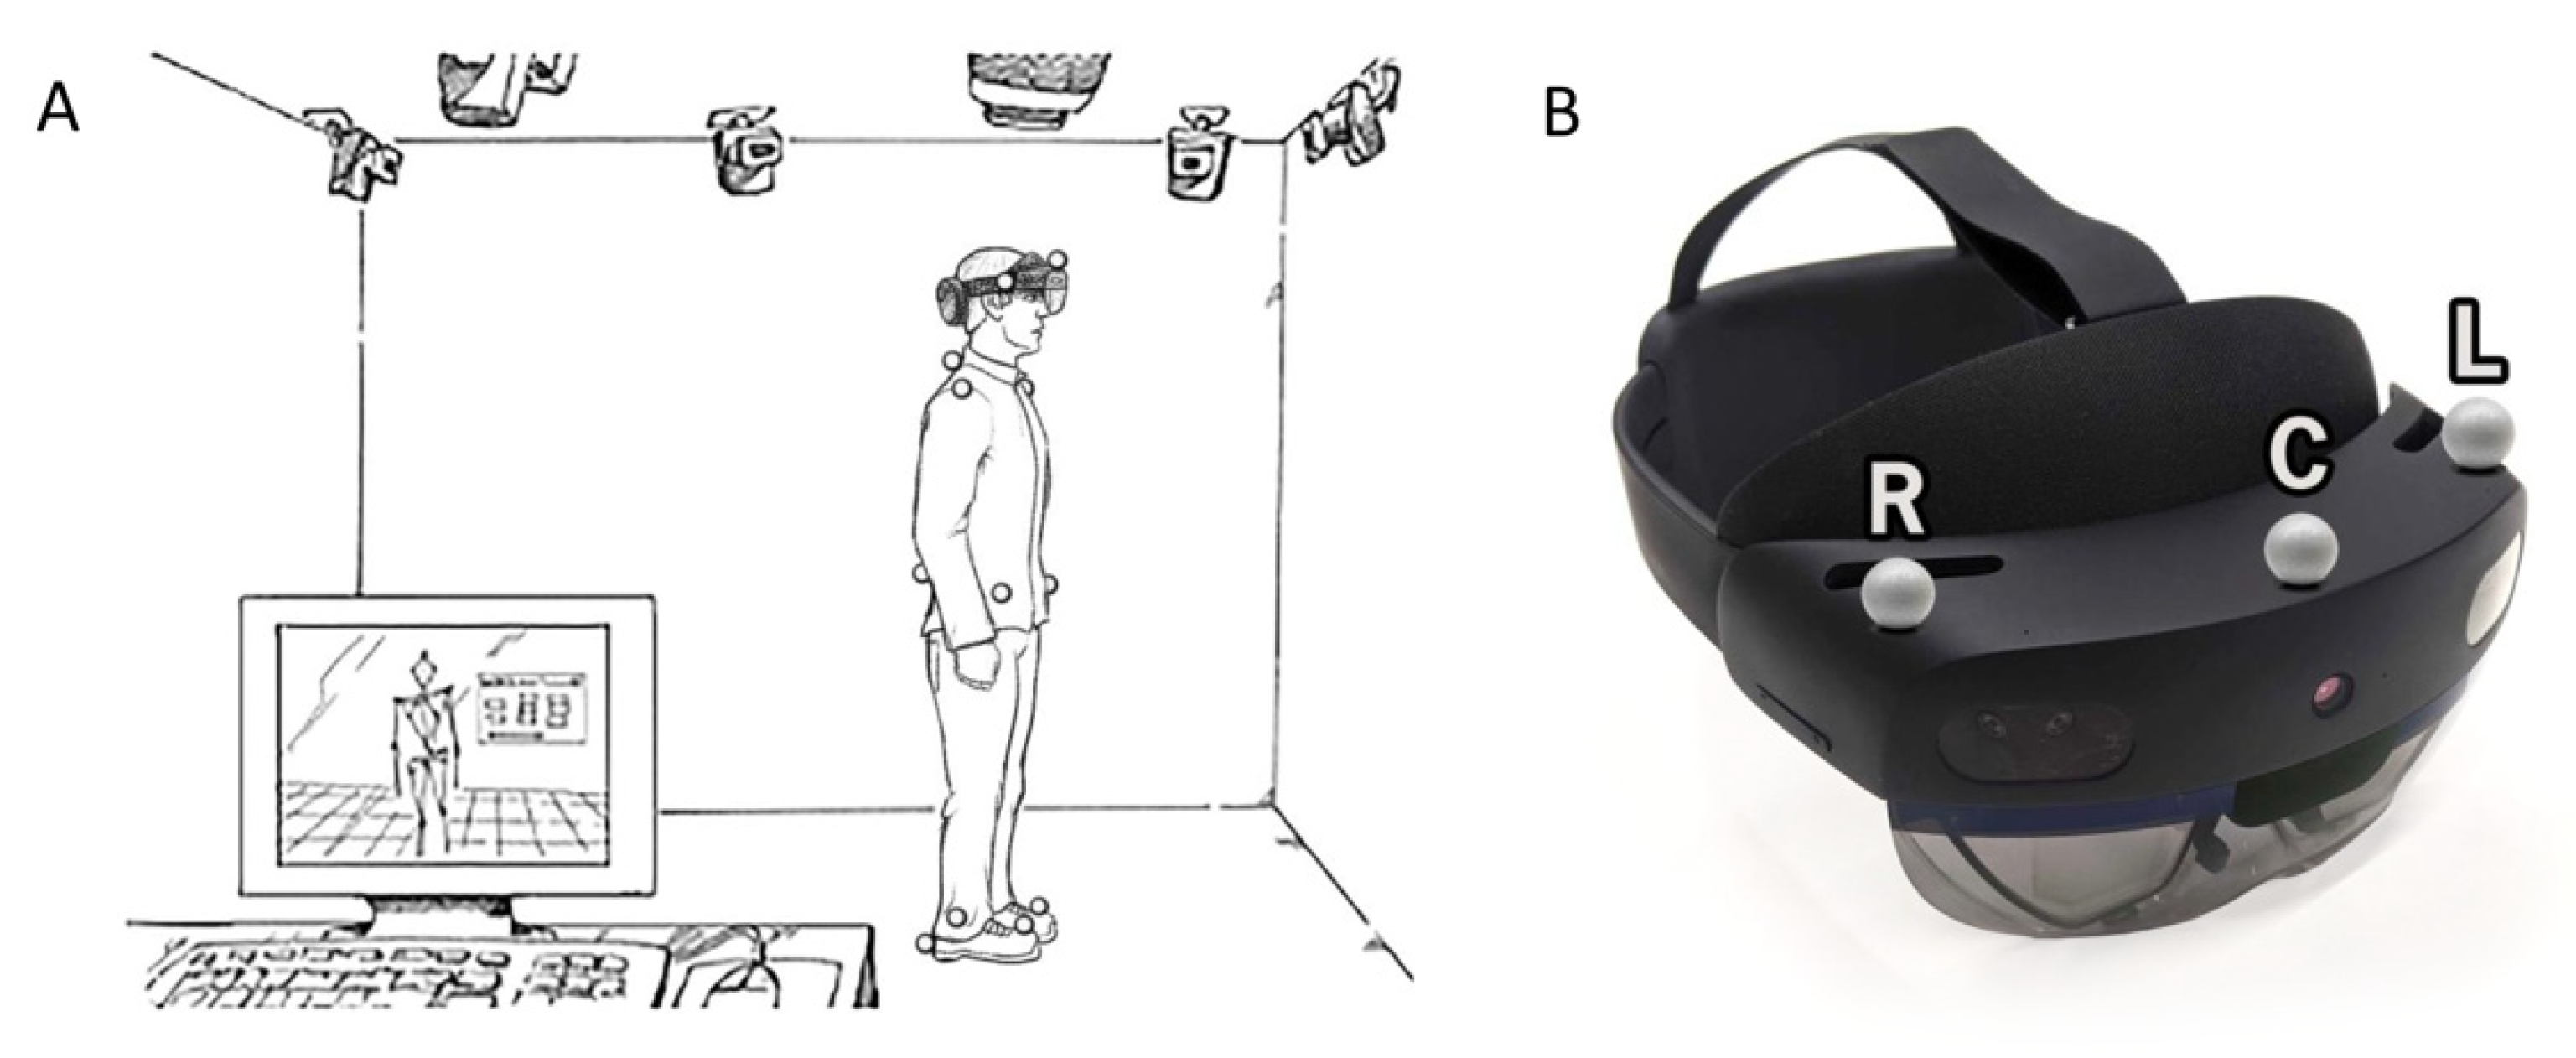
2.2. Procedures
2.3. Equipment, Processing, and Data Analysis
2.4. Continuous Gait Biomechanical Variables
2.5. Timed Up-and-Go Biomechanical Variables
2.6. Statistical Analysis
3. Results
3.1. Participant Demographics
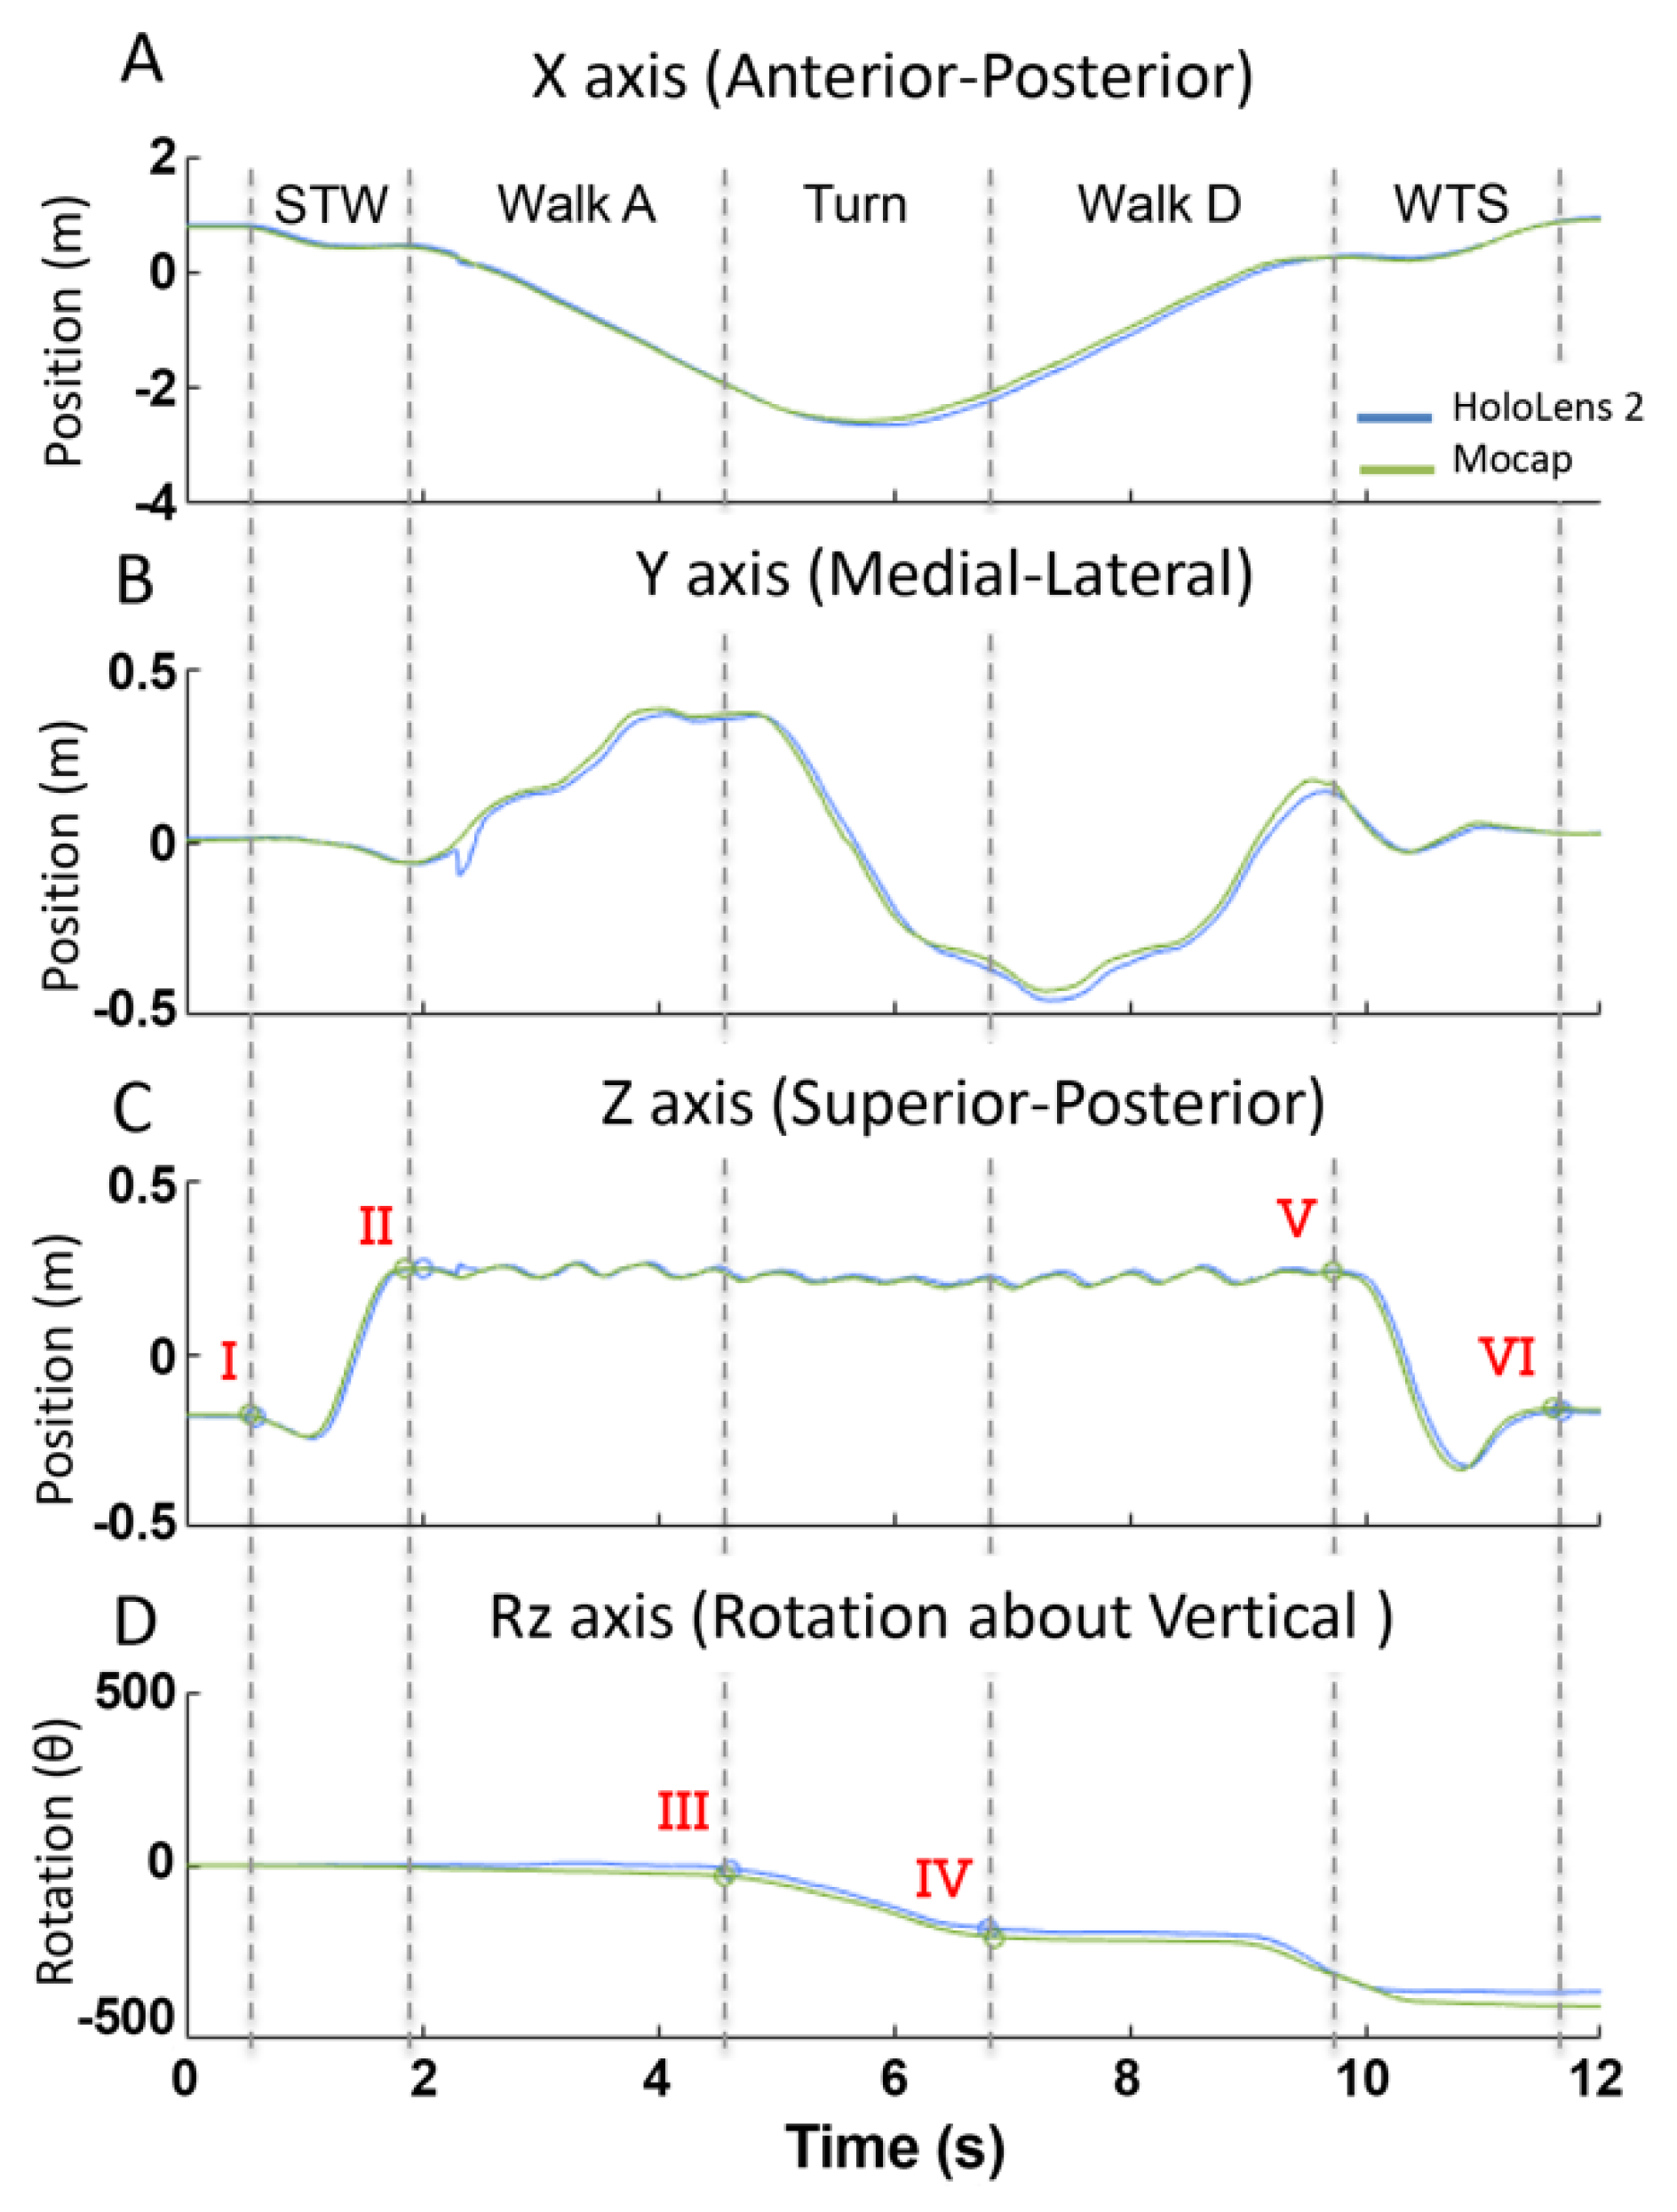
3.2. Time-Series Data Demonstrate Excellent Agreement for Continuous Walking
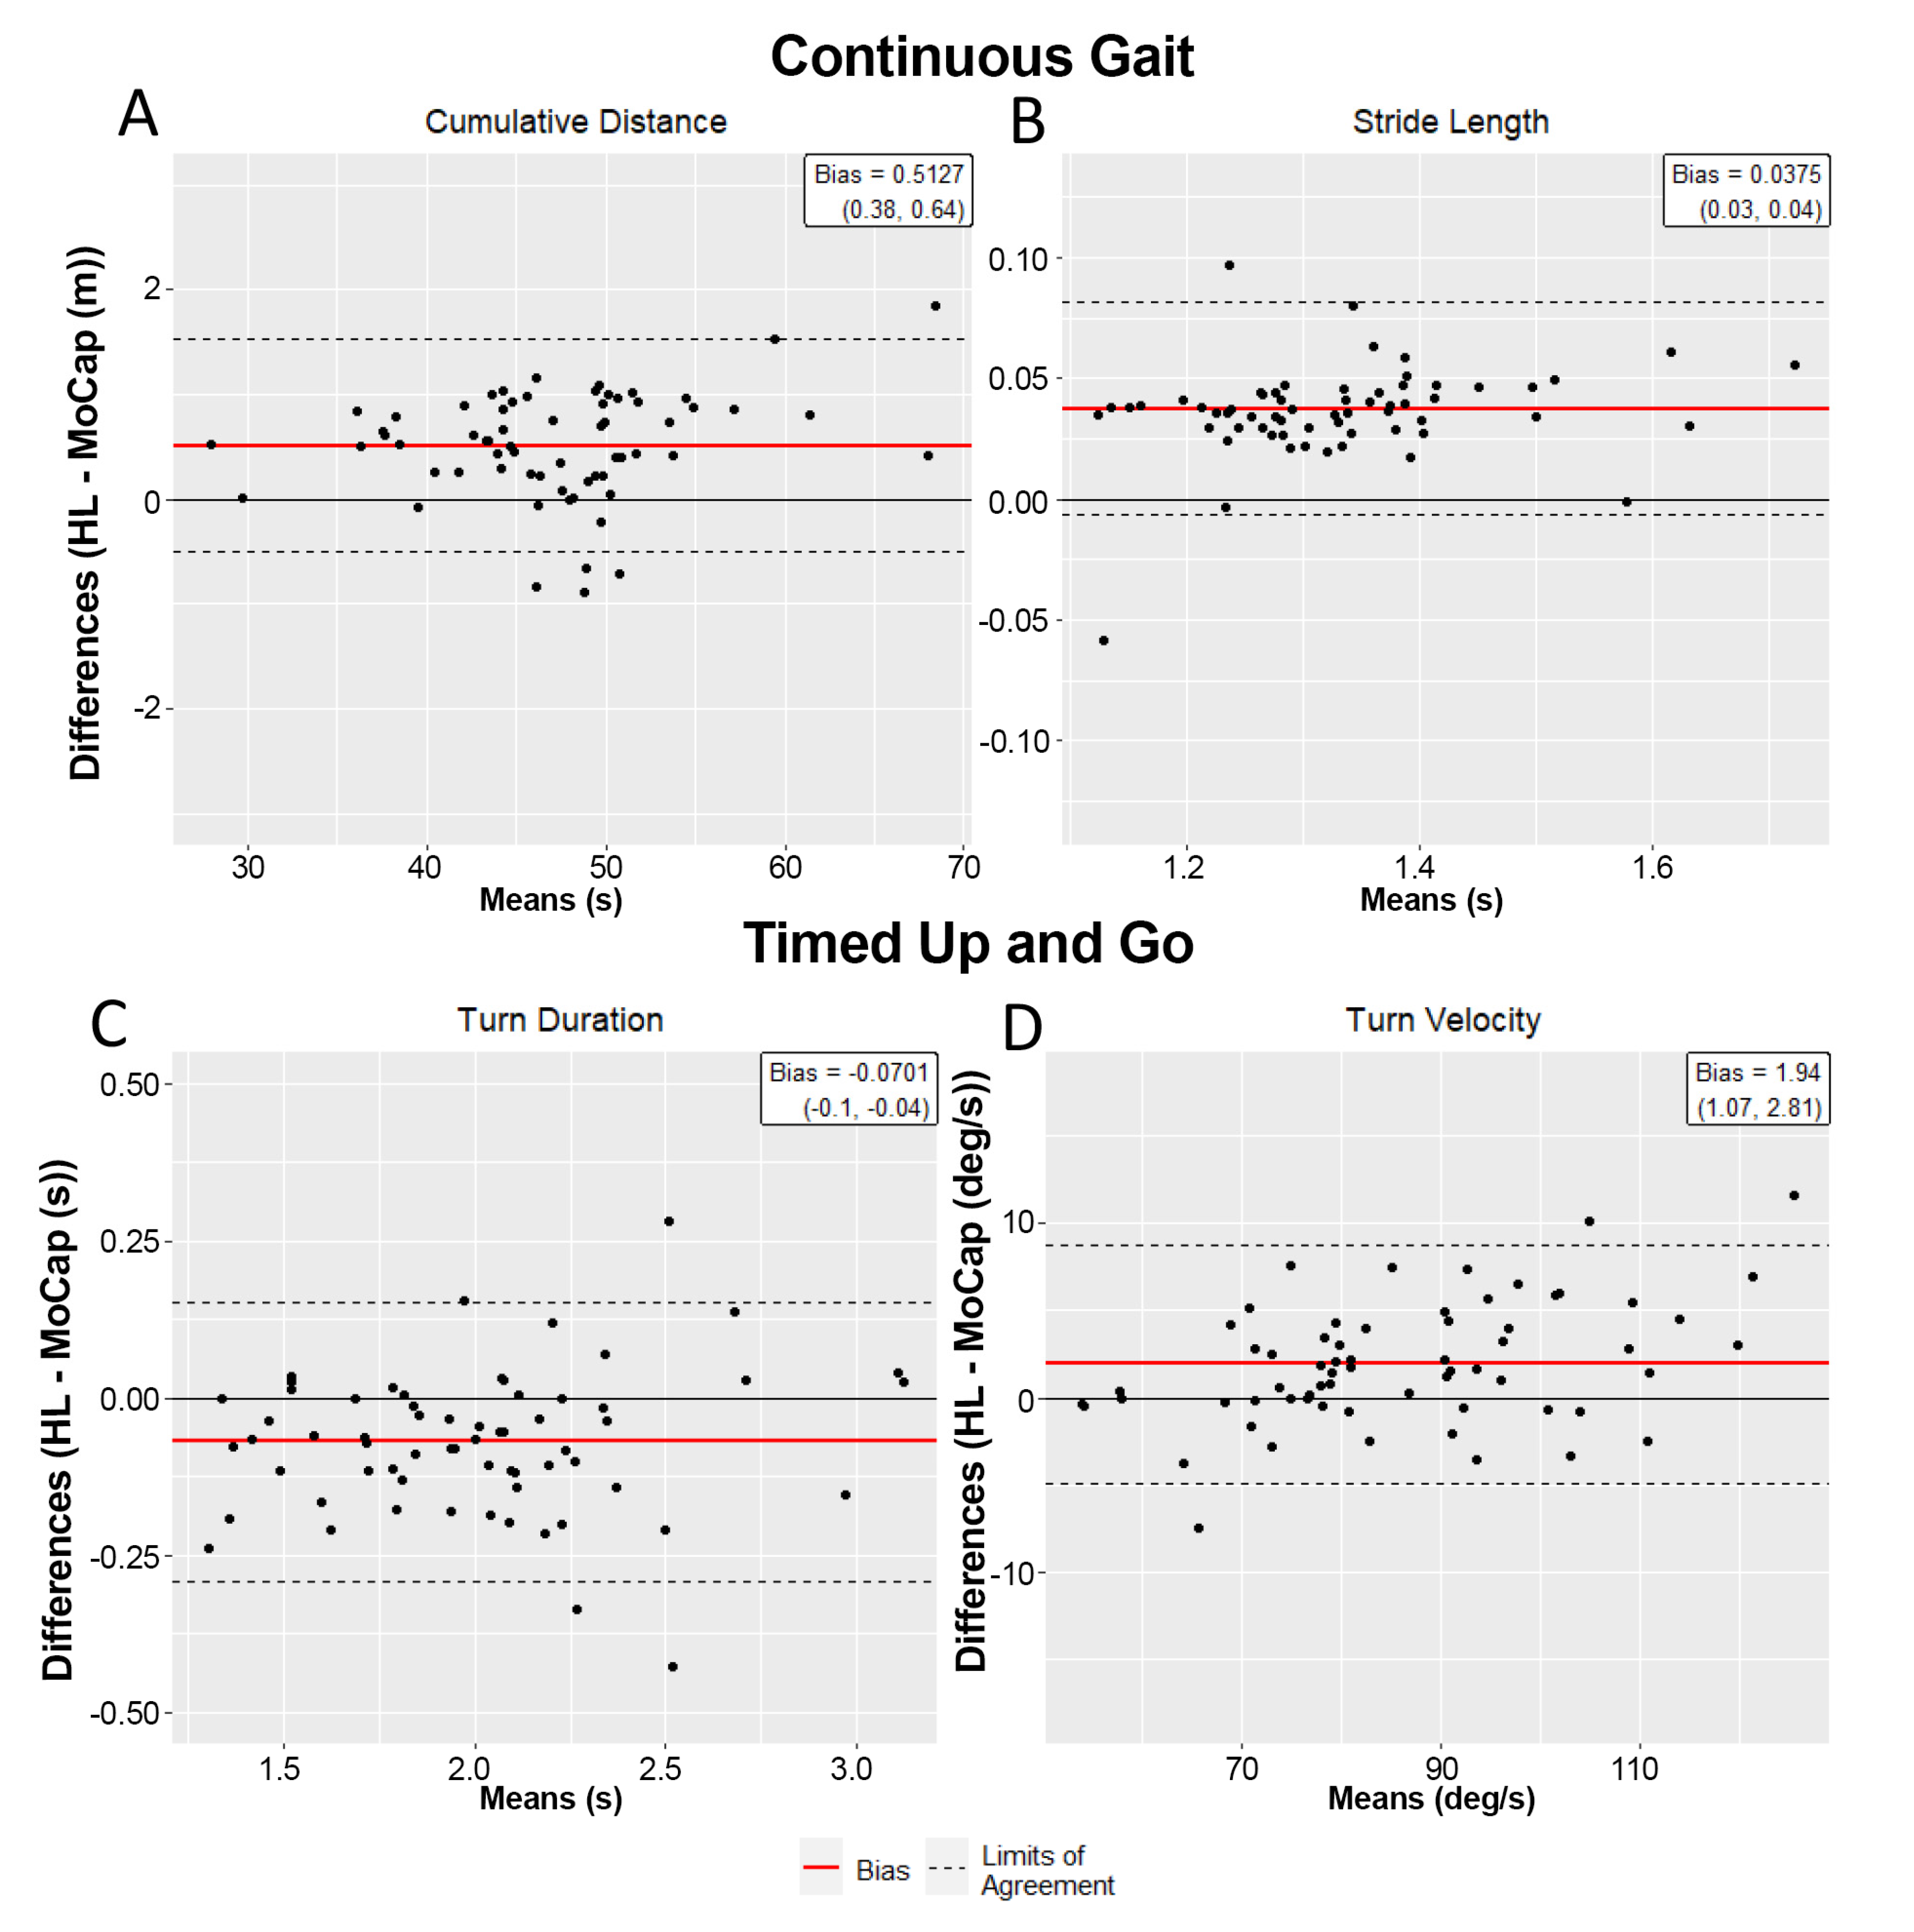
3.3. Biomechanical Outcomes across Systems Are Equivalent during Continuous Walking
3.4. Time Series Data Demonstrate Excellent Alignment for TUG Task
3.5. HL2 Is Eequivalent to Motion Capture at Characterizing TUG
4. Discussion
5. Conclusions
Author Contributions
Funding
Institutional Review Board Statement
Informed Consent Statement
Data Availability Statement
Acknowledgments
Conflicts of Interest
References
- Bloem, B.R.; Grimbergen, Y.A.; Cramer, M.; Willemsen, M.; Zwinderman, A.H. Prospective Assessment of Falls in Parkinson’s Disease. J. Neurol. 2001, 248, 950–958. [Google Scholar] [CrossRef] [PubMed]
- Allen, N.E.; Schwarzel, A.K.; Canning, C.G. Recurrent Falls in Parkinson’s Disease: A Systematic Review. Parkinsons Dis. 2013, 2013, 906274. [Google Scholar] [CrossRef] [PubMed] [Green Version]
- Fritz, S.; Lusardi, M. White Paper: “Walking Speed: The Sixth Vital Sign”. J. Geriatr. Phys. Ther. 2009, 32, 46–49. [Google Scholar] [CrossRef] [PubMed] [Green Version]
- Bohannon, R.W.; Ahlquist, M. Documentation of Prestroke Ambulation. Int. J. Rehabil. Res. 2003, 26, 71–72. [Google Scholar] [CrossRef]
- Purser, J.L.; Weinberger, M.; Cohen, H.J.; Pieper, C.F.; Morey, M.C.; Li, T.; Williams, G.R.; Lapuerta, P. Walking Speed Predicts Health Status and Hospital Costs for Frail Elderly Male Veterans. J. Rehabil. Res. Dev. 2005, 42, 535–546. [Google Scholar] [CrossRef] [Green Version]
- Goldie, P.A.; Matyas, T.A.; Evans, O.M. Deficit and Change in Gait Velocity during Rehabilitation after Stroke. Arch. Phys. Med. Rehabil. 1996, 77, 1074–1082. [Google Scholar] [CrossRef]
- Bohannon, R.W. Measurement of Gait Speed of Older Adults is Feasible and Informative in a Home-Care Setting. J. Geriatr. Phys. Ther. 2009, 32, 22–23. [Google Scholar] [CrossRef]
- Horak, F.B.; Mancini, M. Objective Biomarkers of Balance and Gait for Parkinson’s Disease Using Body-Worn Sensors. Mov. Disord. 2013, 28, 1544–1551. [Google Scholar] [CrossRef] [Green Version]
- Mathias, S.; Nayak, U.S.; Isaacs, B. Balance in Elderly Patients: The “Get-Up and Go” Test. Arch. Phys. Med. Rehabil. 1986, 67, 387–389. [Google Scholar]
- Miller Koop, M.; Ozinga, S.J.; Rosenfeldt, A.B.; Alberts, J.L. Quantifying Turning Behavior and Gait in Parkinson’s Disease Using Mobile Technology. IBRO Rep. 2018, 5, 10–16. [Google Scholar] [CrossRef]
- Shumway-Cook, A.; Brauer, S.; Woollacott, M. Predicting the Probability for Falls in Community-Dwelling Older Adults Using the Timed Up & Go Test. Phys. Ther. 2000, 80, 896–903. [Google Scholar] [PubMed] [Green Version]
- Sun, R.; Sosnoff, J.J. Novel Sensing Technology in Fall Risk Assessment in Older Adults: A Systematic Review. BMC Geriatr. 2018, 18, 14. [Google Scholar] [CrossRef] [PubMed] [Green Version]
- Espay, A.J.; Bonato, P.; Nahab, F.B.; Maetzler, W.; Dean, J.M.; Klucken, J.; Eskofier, B.M.; Merola, A.; Horak, F.; Lang, A.E.; et al. Technology in Parkinson’s Disease: Challenges and Opportunities. Mov. Disord. 2016, 31, 1272–1282. [Google Scholar] [CrossRef] [PubMed] [Green Version]
- Sangarapillai, K.; Norman, B.M.; Almeida, Q.J. Rehabilitation of Falls in Parkinson’s Disease: Self-Perception vs. Objective Measures of Fall Risk. Brain Sci. 2021, 11, 320. [Google Scholar] [CrossRef]
- Miller, M.R.; Jun, H.; Herrera, F.; Yu Villa, J.; Welch, G.; Bailenson, J.N. Social Interaction in Augmented Reality. PLoS ONE 2019, 14, e0216290. [Google Scholar] [CrossRef] [Green Version]
- Sun, R.; Aldunate, R.G.; Sosnoff, J.J. The Validity of a Mixed Reality-Based Automated Functional Mobility Assessment. Sensors 2019, 19, 2183. [Google Scholar] [CrossRef] [Green Version]
- Geerse, D.J.; Coolen, B.; Roerdink, M. Quantifying Spatiotemporal Gait Parameters with HoloLens in Healthy Adults and People with Parkinson’s Disease: Test-Retest Reliability, Concurrent Validity, and Face Validity. Sensors 2020, 20, 3216. [Google Scholar] [CrossRef]
- Koop, M.M.; Rosenfeldt, A.B.; Johnston, J.D.; Streicher, M.C.; Qu, J.; Alberts, J.L. The HoloLens Augmented Reality System Provides Valid Measures of Gait Performance in Healthy Adults. IEEE Trans. Hum. Mach. Syst. 2020, 50, 584–592. [Google Scholar] [CrossRef]
- Guinet, A.L.; Bouyer, G.; Otmane, S.; Desailly, E. Validity of Hololens Augmented Reality Head Mounted Display for Measuring Gait Parameters in Healthy Adults and Children with Cerebral Palsy. Sensors 2021, 21, 2697. [Google Scholar] [CrossRef]
- Bohannon, R.W.; Wang, Y.C. Four-Meter Gait Speed: Normative Values and Reliability Determined for Adults Participating in the NIH Toolbox Study. Arch. Phys. Med. Rehabil. 2019, 100, 509–513. [Google Scholar] [CrossRef]
- Herssens, N.; Verbecque, E.; Hallemans, A.; Vereeck, L.; Van Rompaey, V.; Saeys, W. Do Spatiotemporal Parameters and Gait Variability Differ across the Lifespan of Healthy Adults? A Systematic Review. Gait Posture 2018, 64, 181–190. [Google Scholar] [CrossRef]
- Brown, M.J.; Hutchinson, L.A.; Rainbow, M.J.; Deluzio, K.J.; De Asha, A.R. A Comparison of Self-Selected Walking Speeds and Walking Speed Variability When Data Are Collected During Repeated Discrete Trials and During Continuous Walking. J. Appl. Biomech. 2017, 33, 384–387. [Google Scholar] [CrossRef] [PubMed]
- Schurr, S.A.; Marshall, A.N.; Resch, J.E.; Saliba, S.A. Two-Dimensional Video Analysis Is Comparable to 3d Motion Capture in Lower Extremity Movement Assessment. Int. J. Sports Phys. Ther. 2017, 12, 163–172. [Google Scholar] [PubMed]
- Salarian, A.; Horak, F.B.; Zampieri, C.; Carlson-Kuhta, P.; Nutt, J.G.; Aminian, K. iTUG, a sensitive and reliable measure of mobility. IEEE Trans. Neural Syst Rehabil Eng. 2010, 18, 303–310. [Google Scholar] [CrossRef] [PubMed] [Green Version]
- Strang, E.J.H.G. Calculus, OpenStax; Rice University: Houston, TX, USA, 2016. [Google Scholar]
- Bland, J.M.; Altman, D.G. Measuring Agreement in Method Comparison Studies. Stat. Methods Med. Res. 1999, 8, 135–160. [Google Scholar] [CrossRef]
- Lakens, D. Equivalence Tests: A Practical Primer for t Tests, Correlations, and Meta-Analyses. Soc. Psychol. Personal. Sci. 2017, 8, 355–362. [Google Scholar] [CrossRef] [Green Version]
- Fusca, M.; Perego, P.; Andreoni, G. Method for Wearable Kinematic Gait Analysis Using a Harmonic Oscillator Applied to the Center of Mass. J. Sens. 2018, 2018, 4548396. [Google Scholar] [CrossRef] [Green Version]
- Renaudin, V.; Susi, M.; Lachapelle, G. Step Length Estimation Using Handheld Inertial Sensors. Sensors 2012, 12, 8507–8525. [Google Scholar] [CrossRef]
- Shin, S.H.; Park, C.G. Adaptive Step Length Estimation Algorithm Using Optimal Parameters and Movement Status Awareness. Med. Eng. Phys. 2011, 33, 1064–1071. [Google Scholar] [CrossRef]
- McGraw, K.O.; Wong, S.P. Forming Inferences about Some Intraclass Correlation Coefficients. Psychol. Methods 1996, 1, 30–46. [Google Scholar] [CrossRef]
- Santos, P.C.; Gobbi, L.T.; Orcioli-Silva, D.; Simieli, L.; van Dieen, J.H.; Barbieri, F.A. Effects of Leg Muscle Fatigue on Gait in Patients with Parkinson’s Disease and Controls with High and Low Levels of Daily Physical Activity. Gait Posture 2016, 47, 86–91. [Google Scholar] [CrossRef] [PubMed] [Green Version]
- Sehle, A.; Mundermann, A.; Starrost, K.; Sailer, S.; Becher, I.; Dettmers, C.; Vieten, M. Objective assessment of motor fatigue in Multiple Sclerosis using kinematic gait analysis: A pilot study. J. Neuroeng. Rehabil. 2011, 8, 59. [Google Scholar] [CrossRef] [PubMed] [Green Version]
- Kear, B.M.; Guck, T.P.; McGaha, A.L. Timed Up and Go (TUG) Test: Normative Reference Values for Ages 20 to 59 Years and Relationships with Physical and Mental Health Risk Factors. J. Prim. Care Community Health 2017, 8, 9–13. [Google Scholar] [CrossRef] [PubMed] [Green Version]
- Leach, J.M.; Mellone, S.; Palumbo, P.; Bandinelli, S.; Chiari, L. Natural Turn Measures Predict Recurrent Falls in Community-Dwelling Older Adults: A Longitudinal Cohort Study. Sci. Rep. 2018, 8, 4316. [Google Scholar] [CrossRef] [PubMed] [Green Version]
- Cheng, F.Y.; Yang, Y.R.; Wang, C.J.; Wu, Y.R.; Cheng, S.J.; Wang, H.C.; Wang, R.Y. Factors Influencing Turning and Its Relationship with Falls in Individuals with Parkinson’s Disease. PLoS ONE 2014, 9, e93572. [Google Scholar] [CrossRef] [Green Version]
- Spildooren, J.; Vinken, C.; Van Baekel, L.; Nieuwboer, A. Turning Problems and Freezing of Gait in Parkinson’s Disease: A Systematic Review and Meta-Analysis. Disabil. Rehabil. 2019, 41, 2994–3004. [Google Scholar] [CrossRef]
- Cummings, S.R.; Nevitt, M.C. Non-Skeletal Determinants of Fractures: The Potential Importance of the Mechanics of Falls. Study of Osteoporotic Fractures Research Group. Osteoporos. Int. 1994, 4 (Suppl. 1), 67–70. [Google Scholar] [CrossRef]
- Cummings, S.R.; Nevitt, M.C. Falls. N. Engl. J. Med. 1994, 331, 872–873. [Google Scholar] [CrossRef]
- Nevitt, M.C.; Cummings, S.R. Type of Fall and Risk of Hip and Wrist Fractures: The Study of Osteoporotic Fractures. J. Am. Geriatr. Soc. 1994, 42, 909. [Google Scholar] [CrossRef]
- Cotter, P.E.; Timmons, S.; O’Connor, M.; Twomey, C.; O’Mahony, D. The Financial Implications of Falls in Older People for an Acute Hospital. Ir. J. Med. Sci. 2006, 175, 11–13. [Google Scholar] [CrossRef]
- Bloem, B.R.; Hausdorff, J.M.; Visser, J.E.; Giladi, N. Falls and Freezing of Gait in Parkinson’s Disease: A Review of Two Interconnected, Episodic Phenomena. Mov. Disord. 2004, 19, 871–884. [Google Scholar] [CrossRef] [PubMed]
- Okuma, Y.; Silva de Lima, A.L.; Fukae, J.; Bloem, B.R.; Snijders, A.H. A Prospective study of Falls in Relation to Freezing of Gait and Response Fluctuations in Parkinson’s Disease. Parkinsonism Relat. Disord. 2018, 46, 30–35. [Google Scholar] [CrossRef]
- Held, J.P.O.; Yu, K.; Pyles, C.; Veerbeek, J.M.; Bork, F.; Heining, S.M.; Navab, N.; Luft, A.R. Augmented Reality-Based Rehabilitation of Gait Impairments: Case Report. JMIR mHealth uHealth 2020, 8, e17804. [Google Scholar] [CrossRef] [PubMed]
- Blomqvist, S.; Seipel, S.; Engstrom, M. Using Augmented Reality Technology for Balance Training in the Older Adults: A Feasibility Pilot Study. BMC Geriatr. 2021, 21, 144. [Google Scholar] [CrossRef] [PubMed]
- Janssen, S.; de Ruyter van Steveninck, J.; Salim, H.S.; Cockx, H.M.; Bloem, B.R.; Heida, T.; van Wezel, R.J.A. The Effects of Augmented Reality Visual Cues on Turning in Place in Parkinson’s Disease Patients with Freezing of Gait. Front. Neurol. 2020, 11, 185. [Google Scholar] [CrossRef]
- Karatsidis, A.; Richards, R.E.; Konrath, J.M.; van den Noort, J.C.; Schepers, H.M.; Bellusci, G.; Harlaar, J.; Veltink, P.H. Validation of Wearable Visual Feedback for Retraining Foot Progression Angle Using Inertial Sensors and an Augmented Reality Headset. J. Neuroeng. Rehabil. 2018, 15, 78. [Google Scholar] [CrossRef]
- Gao, B.; He, Z.; He, B.; Gu, Z. Wearable eye health monitoring sensors based on peacock tail-inspired inverse opal carbon. Sens. Actuators B Chem. 2019, 288, 734–741. [Google Scholar] [CrossRef]
- Alberts, J.L.; Modic, M.T.; Udeh, B.L.; Zimmerman, N.; Cherian, K.; Lu, X.; Gray, R.; Figler, R.; Russman, A.; Linder, S.M. A Technology-Enabled Concussion Care Pathway Reduces Costs and Enhances Care. Phys. Ther. 2020, 100, 136–148. [Google Scholar] [CrossRef]
- Macaron, G.; Moss, B.P.; Li, H.; Baldassari, L.E.; Rao, S.M.; Schindler, D.; Alberts, J.L.; Weber, M.; Ayers, M.; Bethoux, F.; et al. Technology-Enabled Assessments to Enhance Multiple Sclerosis Clinical Care and Research. Neurol. Clin. Pract. 2020, 10, 222–231. [Google Scholar] [CrossRef]
- Goetz, C.G.; Poewe, W.; Rascol, O.; Sampaio, C.; Stebbins, G.T.; Counsell, C.; Giladi, N.; Holloway, R.G.; Moore, C.G.; Wenning, G.K.; et al. Movement Disorder Society Task Force report on the Hoehn and Yahr staging scale: Status and recommendations. Mov. Disord. 2004, 19, 1020–1028. [Google Scholar] [CrossRef]


| Age 18–44 (Years) Cohort by Age Group | 26.8 (6.4) |
|---|---|
| 18–23 | 23 (35.9%) |
| 24–40 | 38 (59.4%) |
| 40–44 | 3 (4.7%) |
| Height (in) | 68.4 (3.9) |
| Weight (lbs.) | 164.9 (41) |
| BMI | 24.6 (4.4) |
| Gender | |
| Female | 29 (45.3%) |
| Male | 34 (53.1%) |
| Other/No Response | 1 (1.6%) |
| Race | |
| Asian | 2 (3.1%) |
| Black or African American | 0 (0%) |
| White | 60 (93.8%) |
| More than One Race | 1 (1.6%) |
| Unknown/Not Reported | 1 (1.6%) |
| Years of Education | 16.5 (2.2) |
| MoCap Mean (SD) | HoloLens 2 Mean (SD) | Bias (95% CI) | ICC (95% CI) | |
|---|---|---|---|---|
| Cumulative distance (m) | 46.95 (7.15) | 47.46 (7.26) | 0.51 (0.38, 0.64) * | 0.99(0.99, 0.99) |
| Number of steps (count) | 51.39 (5.70) | 51.53 (5.61) | 0.14 (−0.04, 0.32) * | 0.99(0.99, 1.00) |
| Step length (m) | 0.64 (0.06) | 0.66 (0.06) | 0.02 (0.02, 0.02) * | 0.99(0.99, 1.00) |
| Stride length (m) | 1.31 (0.12) | 1.35 (0.12) | 0.04 (0.03, 0.04) * | 0.98(0.97, 0.99) |
| Total walking time (s) | 29.74 (1.75) | 29.72 (1.74) | −0.02 (−0.03, 0) * | 0.99(0.99, 0.99) |
| Gait velocity (m/s) | 1.59 (0.23) | 1.61 (0.24) | 0.02 (0.02, 0.03) * | 0.99(0.99, 0.99) |
| MoCap Mean (SD) | HoloLens 2 Mean (SD) | Bias (95% CI) | ICC (95% CI) | |
|---|---|---|---|---|
| Total trial duration (s) | 10.82 (1.59) | 10.7 (1.56) | −0.12 (−0.2, −0.03) * | 0.98 (0.96,0.99) |
| Sit-to-walk duration (s) | 1.56 (0.37) | 1.52 (0.33) | −0.04 (−0.09, 0.01) | 0.84 (0.76,0.90) |
| Walking time (s) | 6.79 (1.17) | 6.84 (1.11) | 0.05 (0, 0.1) * | 0.98 (0.98,0.99) |
| Turn duration (s) | 2.04 (0.41) | 1.97 (0.42) | −0.07 (−0.1, −0.04) * | 0.96 (0.94,0.98) |
| Walk-to-sit duration (s) | 2.47 (0.67) | 2.35 (0.6) | −0.12 (−0.21, −0.03) | 0.85 (0.76,0.91) |
| Turn velocity (deg/s) | 85.24 (15.79) | 87.18 (17.25) | 1.94 (1.07, 2.81) * | 0.99 (0.99,1.00) |
| Peak turn velocity (deg/s) | 125.99 (23.02) | 131.1 (30.62) | 5.1 (0.74, 9.47) | 0.79 (0.68,0.87) |
| Gait velocity (m/s) | 0.94 (0.11) | 0.97 (0.11) | 0.03 (0.03, 0.04) * | 0.99 (0.99,1.00) |
| Number of steps in a turn | 3.23 (1) | 3.23 (0.94) | 0 (−0.15, 0.15) * | 0.82 (0.71,0.88) |
| Number of steps | 10.89 (1.76) | 11.2 (1.65) | 0.31 (0.14, 0.48) * | 0.92 (0.87,0.95) |
| Step length (m) | 0.59 (0.07) | 0.6 (0.06) | 0.01 (0, 0.02) * | 0.87 (0.79,0.92) |
| Cumulative distance (m) | 8.09 (0.46) | 8.18 (0.44) | 0.09 (0.07, 0.12) * | 0.98 (0.96,0.98) |
Publisher’s Note: MDPI stays neutral with regard to jurisdictional claims in published maps and institutional affiliations. |
© 2022 by the authors. Licensee MDPI, Basel, Switzerland. This article is an open access article distributed under the terms and conditions of the Creative Commons Attribution (CC BY) license (https://creativecommons.org/licenses/by/4.0/).
Share and Cite
Miller Koop, M.; Rosenfeldt, A.B.; Owen, K.; Penko, A.L.; Streicher, M.C.; Albright, A.; Alberts, J.L. The Microsoft HoloLens 2 Provides Accurate Measures of Gait, Turning, and Functional Mobility in Healthy Adults. Sensors 2022, 22, 2009. https://doi.org/10.3390/s22052009
Miller Koop M, Rosenfeldt AB, Owen K, Penko AL, Streicher MC, Albright A, Alberts JL. The Microsoft HoloLens 2 Provides Accurate Measures of Gait, Turning, and Functional Mobility in Healthy Adults. Sensors. 2022; 22(5):2009. https://doi.org/10.3390/s22052009
Chicago/Turabian StyleMiller Koop, Mandy, Anson B. Rosenfeldt, Kelsey Owen, Amanda L. Penko, Matthew C. Streicher, Alec Albright, and Jay L. Alberts. 2022. "The Microsoft HoloLens 2 Provides Accurate Measures of Gait, Turning, and Functional Mobility in Healthy Adults" Sensors 22, no. 5: 2009. https://doi.org/10.3390/s22052009
APA StyleMiller Koop, M., Rosenfeldt, A. B., Owen, K., Penko, A. L., Streicher, M. C., Albright, A., & Alberts, J. L. (2022). The Microsoft HoloLens 2 Provides Accurate Measures of Gait, Turning, and Functional Mobility in Healthy Adults. Sensors, 22(5), 2009. https://doi.org/10.3390/s22052009