
Inter-Unit Consistency and Validity of 10-Hz GNSS Units in Straight-Line Sprint Running


Abstract
:1. Introduction
2. Materials and Methods
2.1. Participants
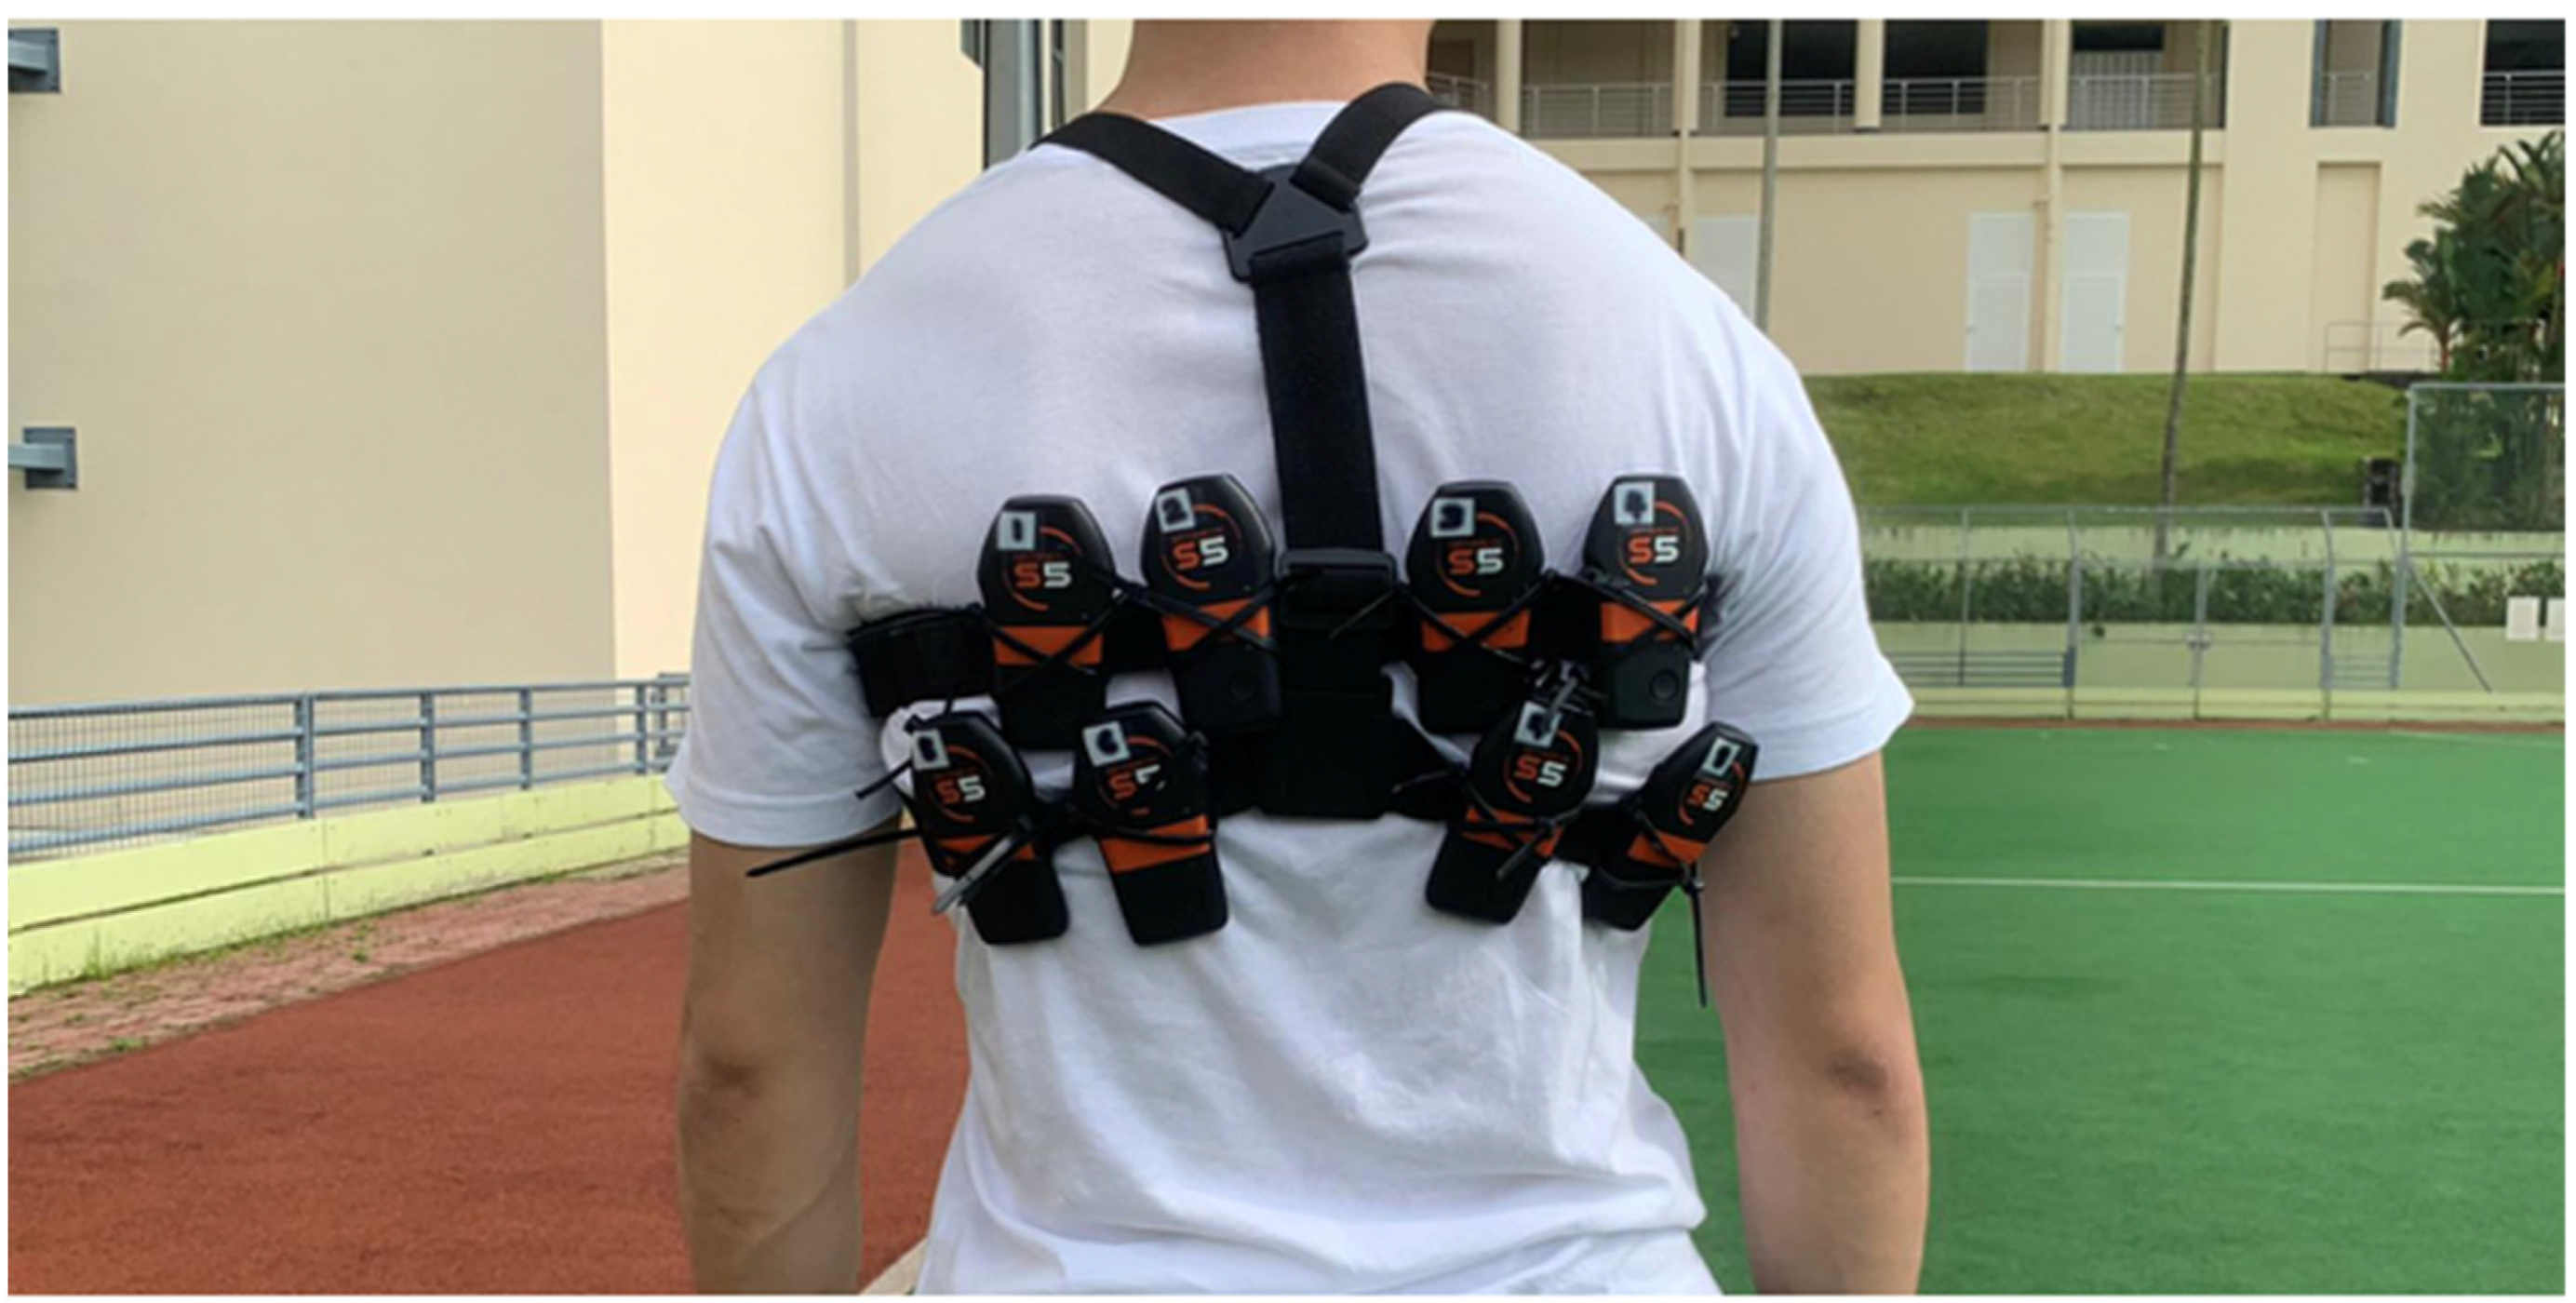
2.2. Equipment
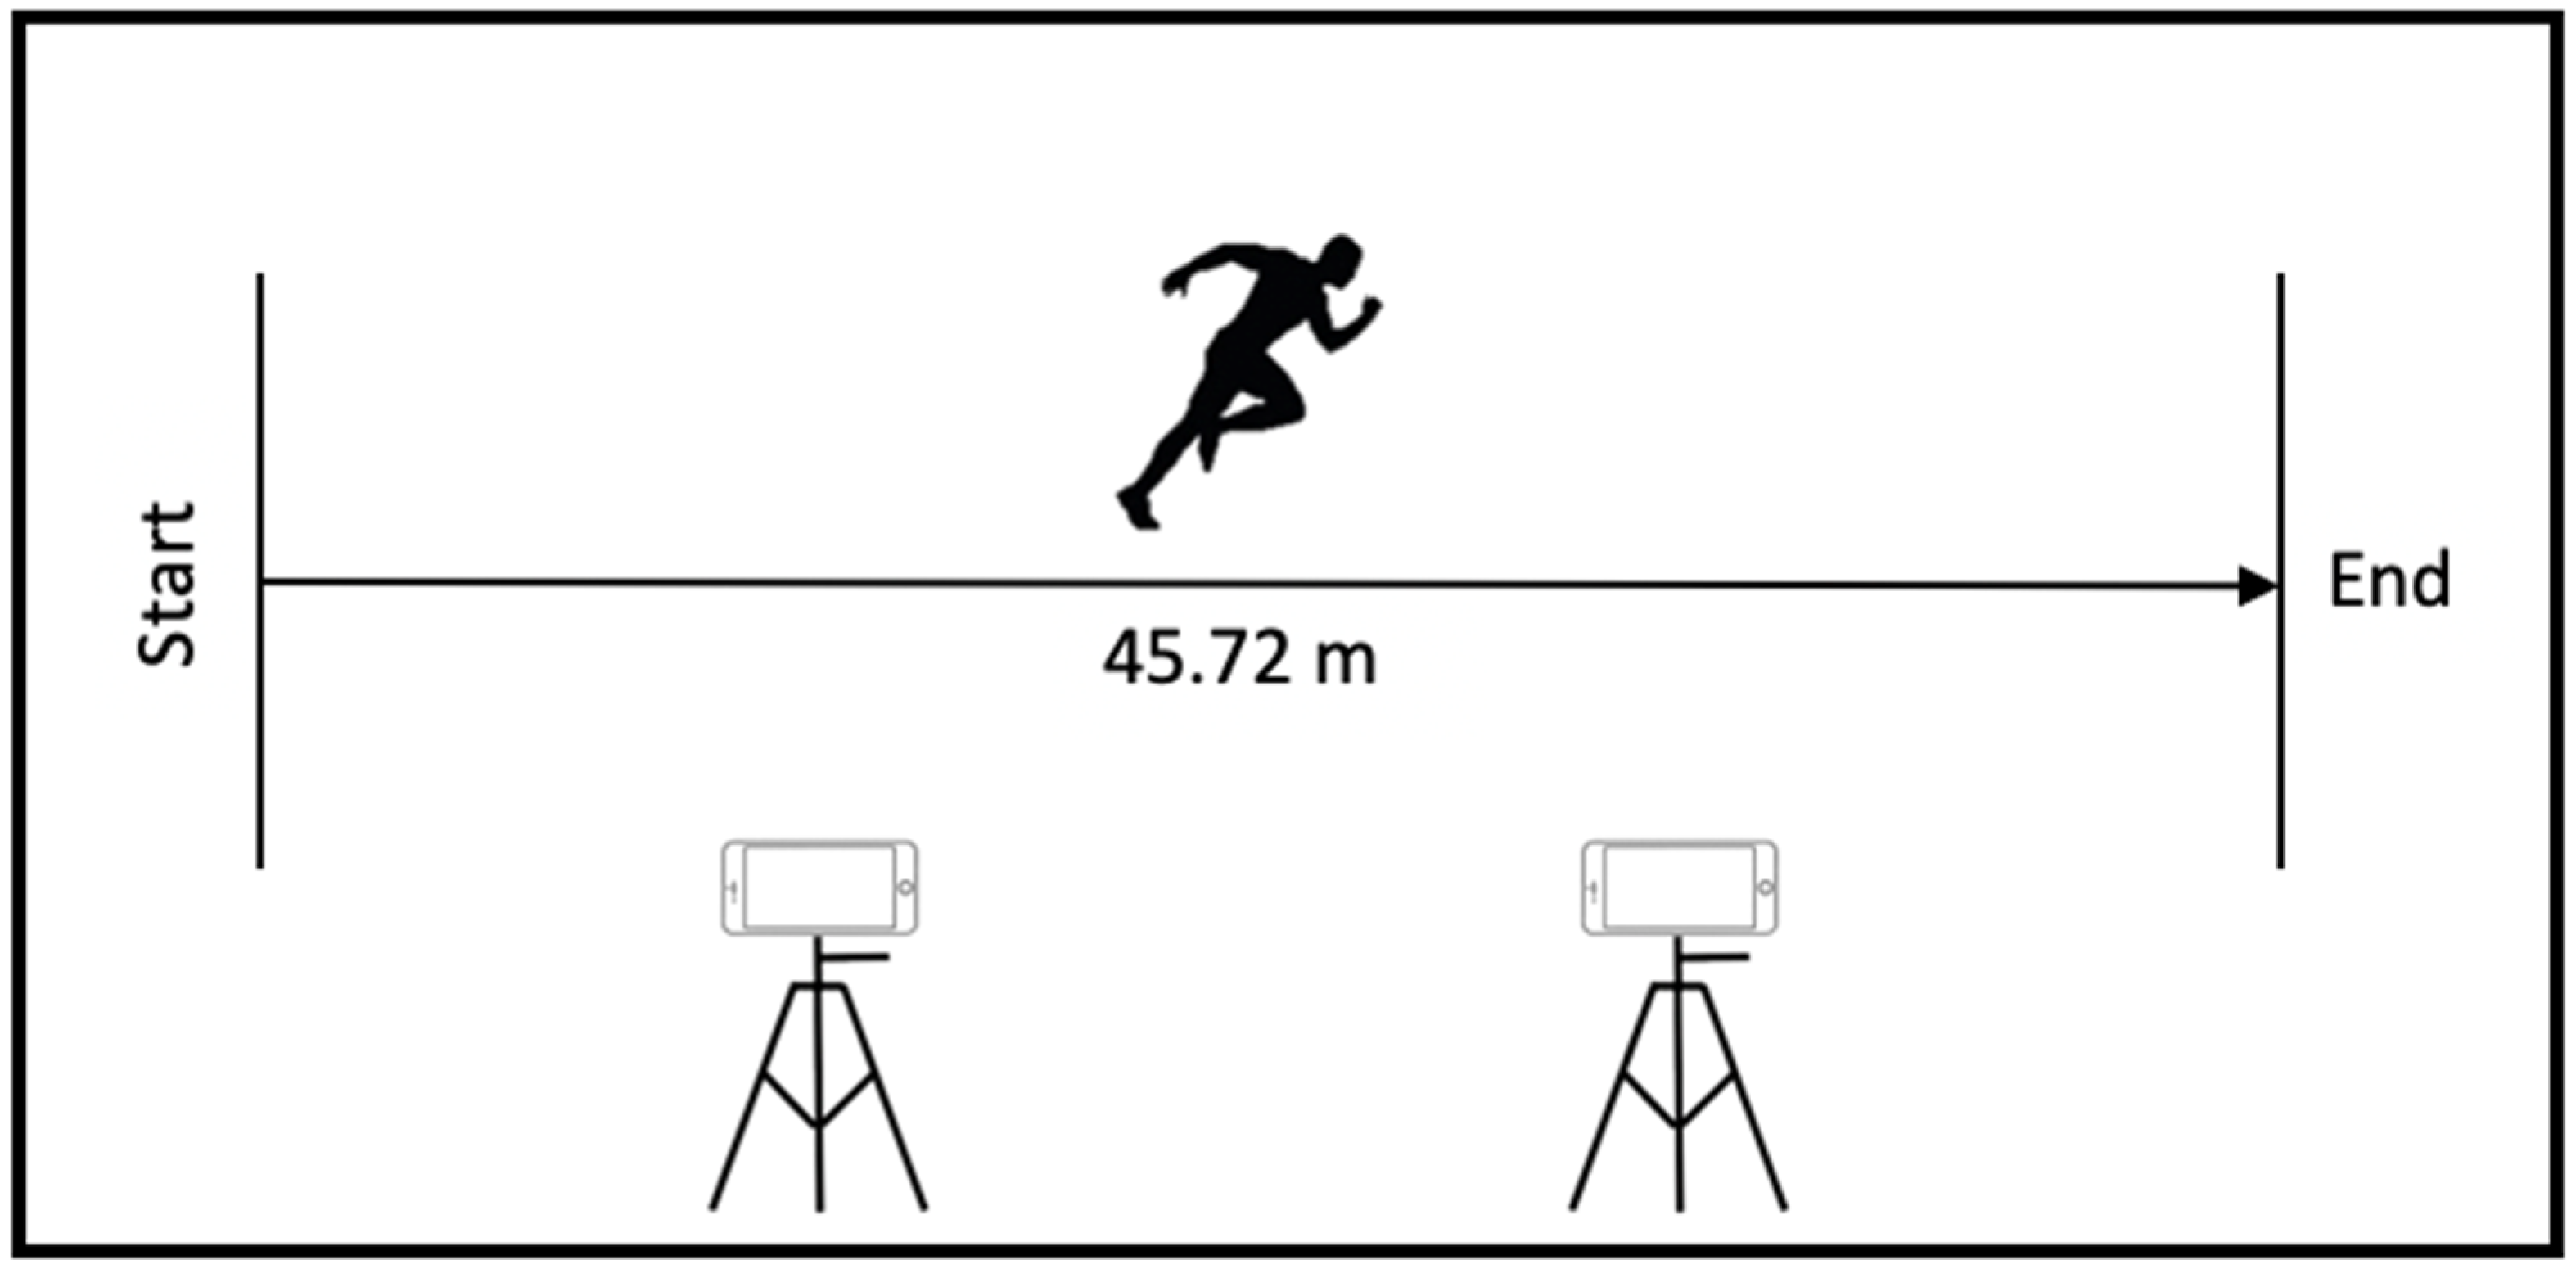
2.3. Experimental Protocol
2.4. Data Processing
2.5. Statistical Analyses
3. Results
3.1. Inter-Unit Consistency
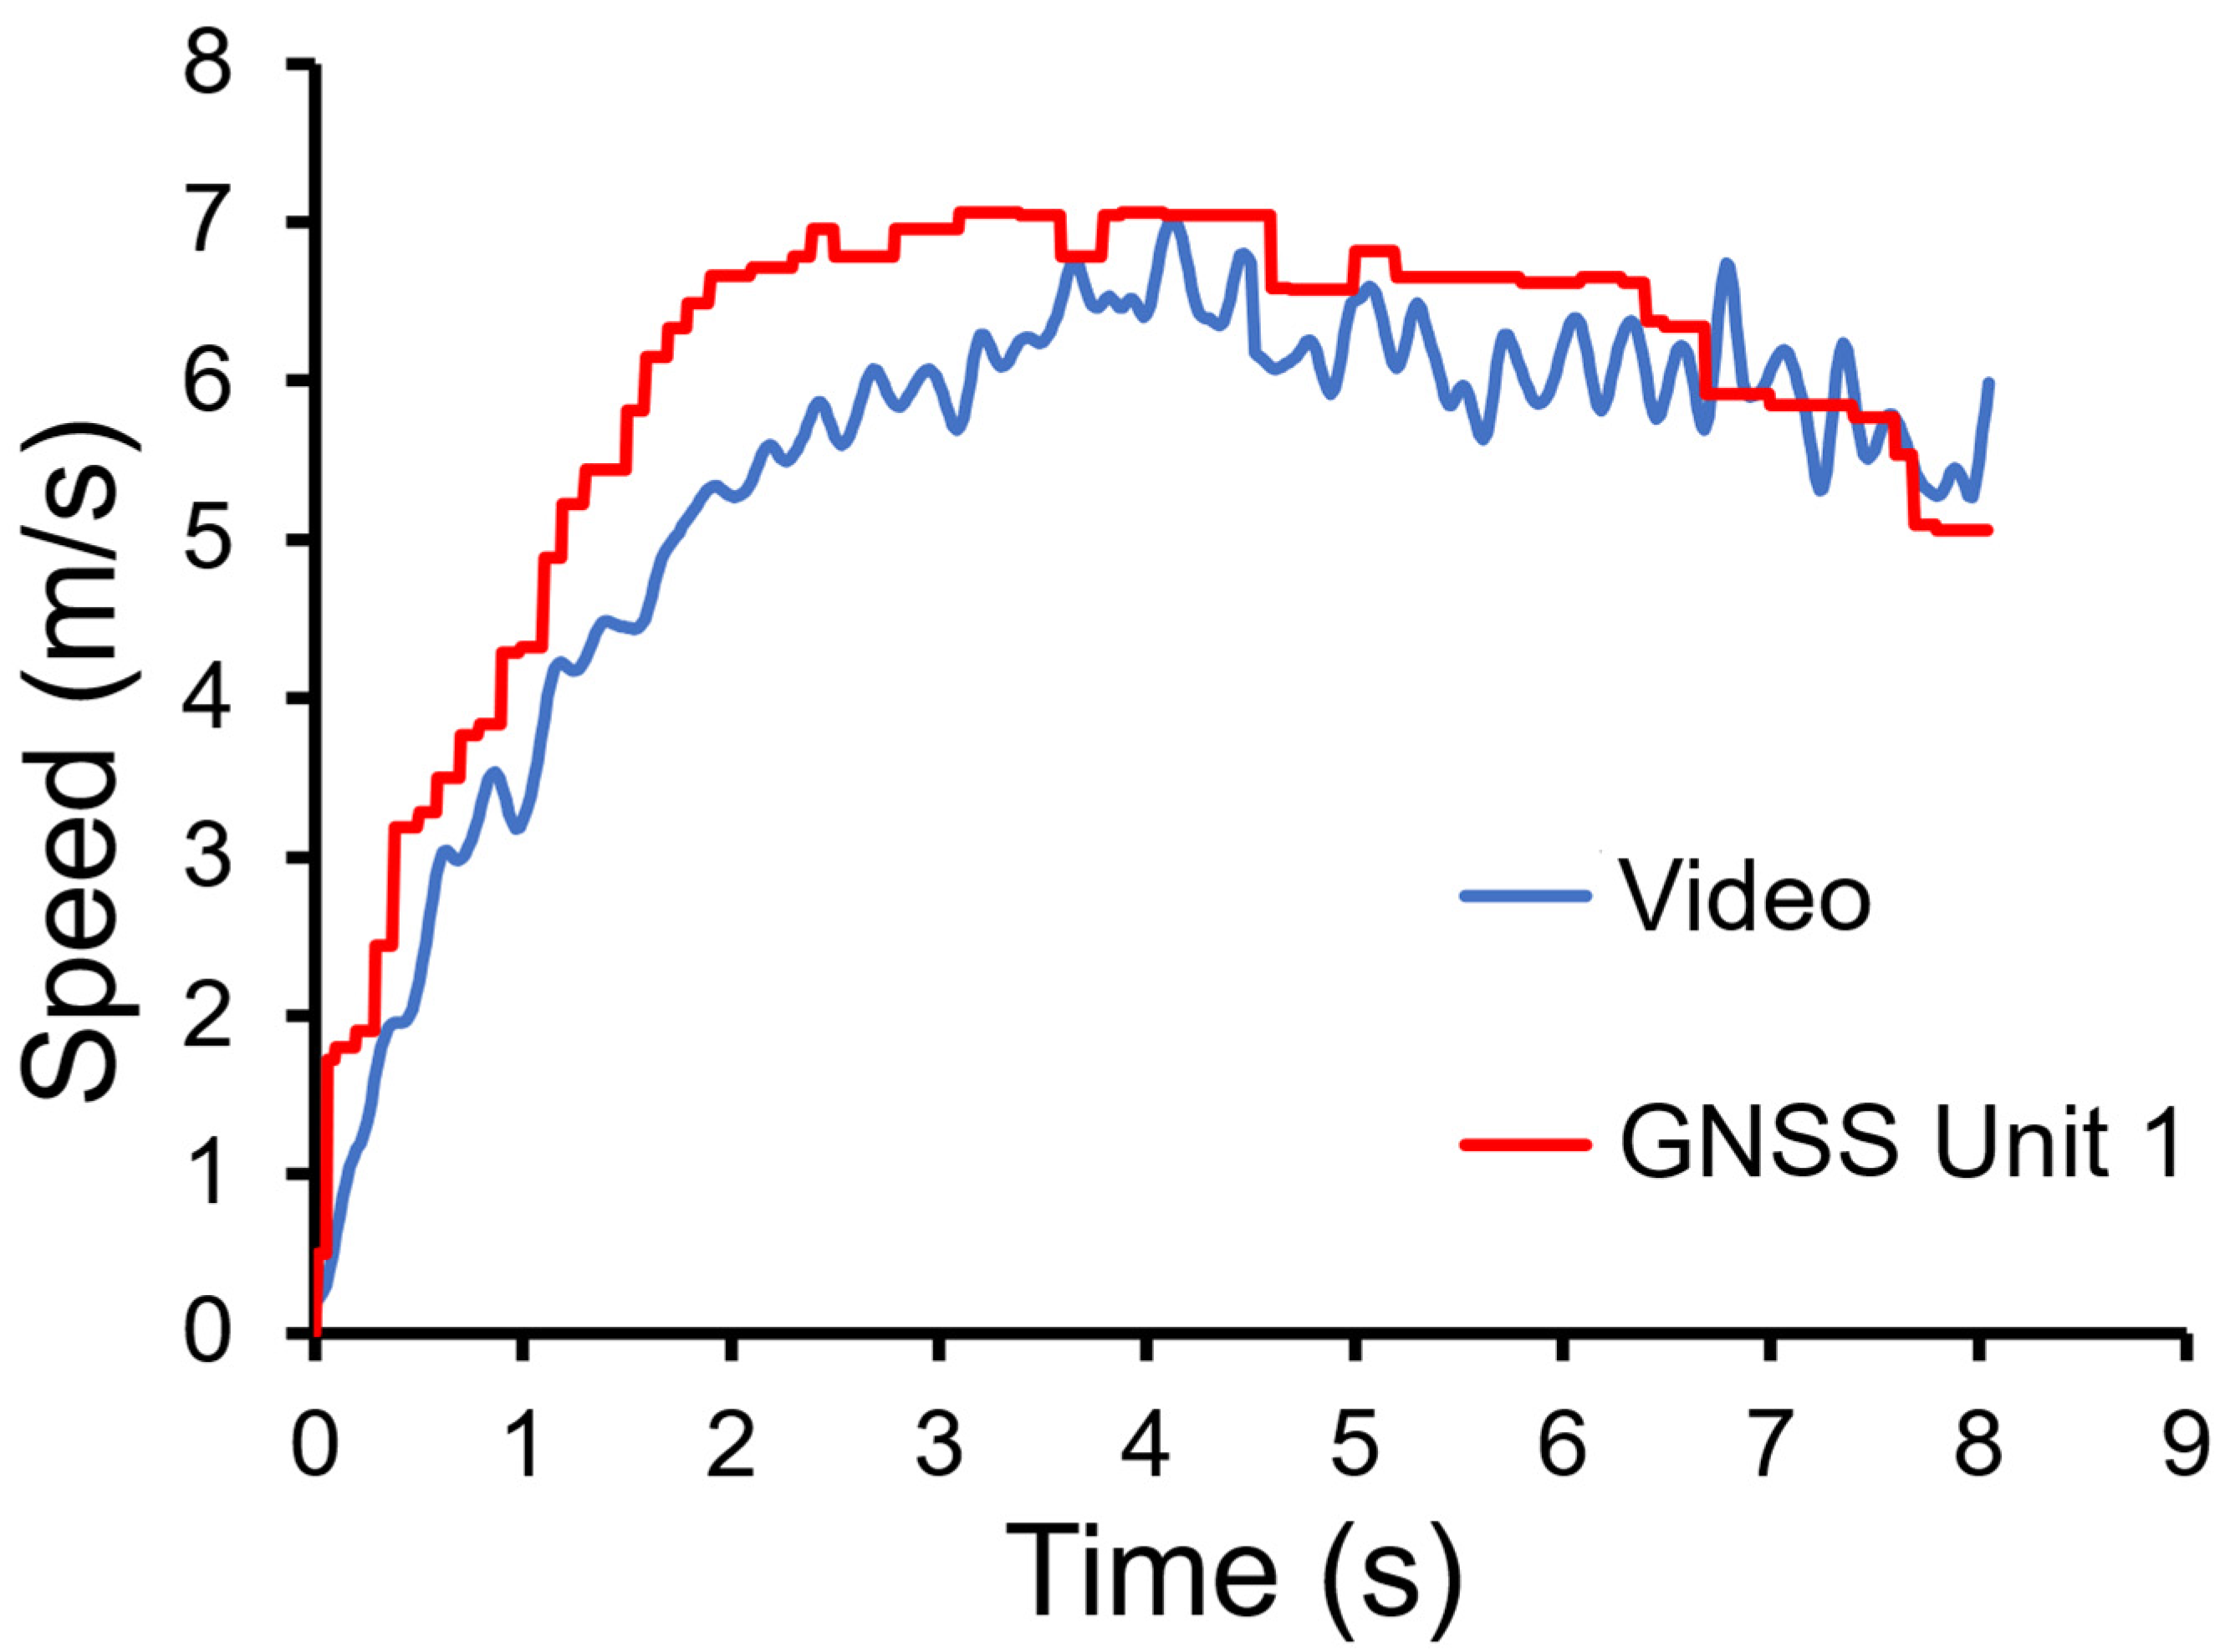
3.2. Validity
4. Discussion
4.1. Distance
4.2. Peak Speed
4.3. Limitations
5. Conclusions
Author Contributions
Funding
Institutional Review Board Statement
Informed Consent Statement
Acknowledgments
Conflicts of Interest
References
- Roberts, S.; Trewartha, G.; Stokes, K. A Comparison of Time–Motion Analysis Methods for Field-Based Sports. Int. J. Sports Physiol. Perform. 2006, 1, 388–399. [Google Scholar] [CrossRef] [Green Version]
- Carling, C.; Bloomfield, J.; Nelsen, L.; Reilly, T. The Role of Motion Analysis in Elite Soccer. Sports Med. 2008, 38, 839–862. [Google Scholar] [CrossRef]
- Cummins, C.; Orr, R.; O’Connor, H.; West, C. Global Positioning Systems (GPS) and Microtechnology Sensors in Team Sports: A Systematic Review. Sports Med. 2013, 43, 1025–1042. [Google Scholar] [CrossRef]
- Shergill, A.S.; Twist, C.; Highton, J. Importance of GNSS data quality assessment with novel control criteria in professional soccer match-play. Int. J. Perform. Anal. Sport 2021, 21, 820–830. [Google Scholar] [CrossRef]
- Duthie, G.; Pyne, D.; Hooper, S. Time motion analysis of 2001 and 2002 super 12 rugby. J. Sports Sci. 2005, 23, 523–530. [Google Scholar] [CrossRef]
- Sirotic, A.C.; Coutts, A.J.; Knowles, H.; Catterick, C. A comparison of match demands between elite and semi-elite rugby league competition. J. Sports Sci. 2009, 27, 203–211. [Google Scholar] [CrossRef]
- Spencer, M.; Lawrence, S.; Rechichi, C.; Bishop, D.; Dawson, B.; Goodman, C. Time–motion analysis of elite field hockey, with special reference to repeated-sprint activity. J. Sports Sci. 2004, 22, 843–850. [Google Scholar] [CrossRef]
- Aughey, R.J.; Falloon, C. Real-time versus post-game GPS data in team sports. J. Sci. Med. Sport 2010, 13, 348–349. [Google Scholar] [CrossRef]
- Gabbett, T.J.; Jenkins, D.G.; Abernethy, B. Physical demands of professional rugby league training and competition using microtechnology. J. Sci. Med. Sport 2012, 15, 80–86. [Google Scholar] [CrossRef]
- Hartwig, T.B.; Naughton, G.; Searl, J. Motion Analyses of Adolescent Rugby Union Players: A Comparison of Training and Game Demands. J. Strength Cond. Res. 2011, 25, 966–972. [Google Scholar] [CrossRef]
- Johnston, R.J.; Watsford, M.L.; Pine, M.J.; Spurrs, R.W.; Murphy, A.; Pruyn, E.C. Movement Demands and Match Performance in Professional Australian Football. Laryngo-Rhino-Otologie 2012, 33, 89–93. [Google Scholar] [CrossRef]
- Beato, M.; Bartolini, D.; Ghia, G.; Zamparo, P. Accuracy of a 10 Hz GPS Unit in Measuring Shuttle Velocity Performed at Different Speeds and Distances (5–20 M). J. Hum. Kinet. 2016, 54, 15–22. [Google Scholar] [CrossRef] [PubMed] [Green Version]
- Buchheit, M.; Simpson, B.M. Player-Tracking Technology: Half-Full or Half-Empty Glass? Int. J. Sports Physiol. Perform. 2017, 12, 35–41. [Google Scholar] [CrossRef] [PubMed] [Green Version]
- Witte, T.; Wilson, A. Accuracy of non-differential GPS for the determination of speed over ground. J. Biomech. 2004, 37, 1891–1898. [Google Scholar] [CrossRef] [PubMed]
- Lutz, J.; Memmert, D.; Raabe, D.; Dornberger, R.; Donath, L. Wearables for Integrative Performance and Tactic Analyses: Opportunities, Challenges, and Future Directions. Int. J. Environ. Res. Public Health 2019, 17, 59. [Google Scholar] [CrossRef] [PubMed] [Green Version]
- Jennings, D.; Cormack, S.; Coutts, A.J.; Boyd, L.; Aughey, R.J. The Validity and Reliability of GPS Units for Measuring Distance in Team Sport Specific Running Patterns. Int. J. Sports Physiol. Perform. 2010, 5, 328–341. [Google Scholar] [CrossRef] [Green Version]
- Rampinini, E.; Alberti, G.; Fiorenza, M.; Riggio, M.; Sassi, R.; Borges, T.O.; Coutts, A.J. Accuracy of GPS Devices for Measuring High-intensity Running in Field-based Team Sports. Laryngo-Rhino-Otologie 2014, 36, 49–53. [Google Scholar] [CrossRef] [Green Version]
- Scott, M.T.U.; Scott, T.J.; Kelly, V.G. The Validity and Reliability of Global Positioning Systems in Team Sport. J. Strength Cond. Res. 2016, 30, 1470–1490. [Google Scholar] [CrossRef]
- Johnston, R.J.; Watsford, M.L.; Pine, M.J.; Spurrs, R.W.; Murphy, A.J.; Pruyn, E.C. The Validity and Reliability of 5-hZ Global Positioning System Units to Measure Team Sport Movement Demands. J. Strength Cond. Res. 2012, 26, 758–765. [Google Scholar] [CrossRef]
- Osgnach, C.; Poser, S.; Bernardini, R.; Rinaldo, R.; DI Prampero, P.E. Energy Cost and Metabolic Power in Elite Soccer. Med. Sci. Sports Exerc. 2010, 42, 170–178. [Google Scholar] [CrossRef] [PubMed]
- Akenhead, R.; Harley, J.A.; Tweddle, S.P. Examining the External Training Load of an English Premier League Football Team with Special Reference to Acceleration. J. Strength Cond. Res. 2016, 30, 2424–2432. [Google Scholar] [CrossRef] [PubMed]
- Dawson, B.; Gow, S.; Modra, S.; Bishop, D.; Stewart, G. Effects of immediate post-game recovery procedures on muscle soreness, power and flexiblity levels over the next 48 hours. J. Sci. Med. Sport 2005, 8, 210–221. [Google Scholar] [CrossRef]
- Dawson, B.; Hopkinson, R.; Appleby, B.; Stewart, G.; Roberts, C. Comparison of training activities and game demands in the Australian Football League. J. Sci. Med. Sport 2004, 7, 292–301. [Google Scholar] [CrossRef]
- Larsson, P. Global positioning system and sport-specific testing. Sports Med. 2003, 33, 1093–1101. [Google Scholar] [CrossRef]
- Pireaux, S.; Defraigne, P.; Wauters, L.; Bergeot, N.; Baire, Q.; Bruyninx, C. Influence of ionospheric perturbations in GPS time and frequency transfer. Adv. Space Res. 2010, 45, 1101–1112. [Google Scholar] [CrossRef] [Green Version]
- López, A.M.; Granero-Gil, P.; Ortega, J.P.; De Hoyo, M. The validity and reliability of a 5-hz GPS device for quantifying athletes’ sprints and movement demands specific to team sports. J. Hum. Sport Exerc. 2017, 12. [Google Scholar] [CrossRef]
- Coutts, A.J.; Duffield, R. Validity and reliability of GPS devices for measuring movement demands of team sports. J. Sci. Med. Sport 2010, 13, 133–135. [Google Scholar] [CrossRef]
- Akenhead, R.; French, D.; Thompson, K.G.; Hayes, P.R. The acceleration dependent validity and reliability of 10Hz GPS. J. Sci. Med. Sport 2014, 17, 562–566. [Google Scholar] [CrossRef]
- Johnston, R.J.; Watsford, M.L.; Kelly, S.J.; Pine, M.J.; Spurrs, R.W. Validity and Interunit Reliability of 10 Hz and 15 Hz GPS Units for Assessing Athlete Movement Demands. J. Strength Cond. Res. 2014, 28, 1649–1655. [Google Scholar] [CrossRef]
- Buchheit, M.; Al Haddad, H.; Simpson, B.M.; Palazzi, D.; Bourdon, P.C.; Di Salvo, V.; Mendez-Villanueva, A. Monitoring Accelerations With GPS in Football: Time to Slow Down? Int. J. Sports Physiol. Perform. 2014, 9, 442–445. [Google Scholar] [CrossRef]
- Tessaro, E.; Williams, J.H. Validity and reliability of a 15 Hz GPS device for court-based sports movements. Sport Perform. Sci. Rep. 2018, 1, 29. [Google Scholar]
- Duffield, R.; Reid, M.; Baker, J.; Spratford, W. Accuracy and reliability of GPS devices for measurement of movement patterns in confined spaces for court-based sports. J. Sci. Med. Sport 2010, 13, 523–525. [Google Scholar] [CrossRef]
- Gray, A.; Jenkins, D.; Andrews, M.H.; Taaffe, D.; Glover, M.L. Validity and reliability of GPS for measuring distance travelled in field-based team sports. J. Sports Sci. 2010, 28, 1319–1325. [Google Scholar] [CrossRef]
- Williams, M.; Morgan, S. Horizontal positioning error derived from stationary GPS units: A function of time and proximity to building infrastructure. Int. J. Perform. Anal. Sport 2009, 9, 275–280. [Google Scholar] [CrossRef]
- Puig-Diví, A.; Escalona-Marfil, C.; Padullés-Riu, J.M.; Busquets, A.; Padullés-Chando, X.; Marcos-Ruiz, D. Validity and reliability of the Kinovea program in obtaining angles and distances using coordinates in 4 perspectives. PLoS ONE 2019, 14, e0216448. [Google Scholar] [CrossRef]
- Altman, D.G. Practical Statistics for Medical Research; Chapman and Hall: London, UK, 1991; pp. 403–405. [Google Scholar]
- Heng, M.L.; Chua, Y.K.; Pek, H.K.; Krishnasamy, P.; Kong, P.W. A novel method of measuring passive quasi-stiffness in the first metatarsophalangeal joint. J. Foot Ankle Res. 2016, 9, 41. [Google Scholar] [CrossRef] [Green Version]
- Varley, M.; Fairweather, I.H.; Aughey, R.J. Validity and reliability of GPS for measuring instantaneous velocity during acceleration, deceleration, and constant motion. J. Sports Sci. 2012, 30, 121–127. [Google Scholar] [CrossRef] [PubMed]


| GNSS Variables | ICC | 95% Confidence Intervals | SEM |
|---|---|---|---|
| Total distance | 0.131 | [−0.024, 0.556] | 8.8 m |
| Peak speed | 0.323 | [0.101, 0.736] | 1.3 m/s |
| GNSS Units | Mean (SD) | p-Value | Effect Size (d) | |
|---|---|---|---|---|
| Unit 1 (n = 13) | 49.77 (5.92) | 0.030 * | 8.41 | Large |
| Unit 2 (n = 13) | 46.69 (10.62) | 0.747 | 4.49 | Large |
| Unit 3 (n = 10) | 44.50 (8.55) | 0.663 | 5.29 | Large |
| Unit 4 (n = 13) | 52.23 (10.11) | 0.039 * | 5.17 | Large |
| Unit 5 (n = 11) | 52.00 (10.13) | 0.067 | 5.13 | Large |
| Unit 6 (n = 12) | 50.83 (8.57) | 0.063 | 5.93 | Large |
| Unit 7 (n = 12) | 47.50 (8.06) | 0.460 | 5.89 | Large |
| Unit 8 (n = 13) | 52.69 (12.18) | 0.061 | 4.33 | Large |
| GNSS Units | Mean (SD) | p-Value | Effect Size (r) | |
|---|---|---|---|---|
| Unit 1 (n = 13) | 7.04 (1.15) | 0.057 | 0.604 | Large |
| Unit 2 (n = 13) | 6.89 (1.98) | 0.127 | 0.495 | Medium |
| Unit 3 (n = 10) | 6.92 (1.03) | 0.064 | 0.673 | Large |
| Unit 4 (n = 13) | 7.11 (0.89) | 0.010 * | 0.780 | Large |
| Unit 5 (n = 11) | 7.37 (1.55) | 0.416 | 0.303 | Medium |
| Unit 6 (n = 12) | 8.40 (2.53) | 0.970 | 0.026 | Negligible |
| Unit 7 (n = 12) | 6.86 (1.34) | 0.064 | 0.615 | Large |
| Unit 8 (n = 13) | 7.37 (1.05) | 0.057 | 0.604 | Large |
Publisher’s Note: MDPI stays neutral with regard to jurisdictional claims in published maps and institutional affiliations. |
© 2022 by the authors. Licensee MDPI, Basel, Switzerland. This article is an open access article distributed under the terms and conditions of the Creative Commons Attribution (CC BY) license (https://creativecommons.org/licenses/by/4.0/).
Share and Cite
Chahal, A.K.; Lim, J.Z.; Pan, J.-W.; Kong, P.W. Inter-Unit Consistency and Validity of 10-Hz GNSS Units in Straight-Line Sprint Running. Sensors 2022, 22, 1888. https://doi.org/10.3390/s22051888
Chahal AK, Lim JZ, Pan J-W, Kong PW. Inter-Unit Consistency and Validity of 10-Hz GNSS Units in Straight-Line Sprint Running. Sensors. 2022; 22(5):1888. https://doi.org/10.3390/s22051888
Chicago/Turabian StyleChahal, Amandeep Kaur, Jolene Ziyuan Lim, Jing-Wen Pan, and Pui Wah Kong. 2022. "Inter-Unit Consistency and Validity of 10-Hz GNSS Units in Straight-Line Sprint Running" Sensors 22, no. 5: 1888. https://doi.org/10.3390/s22051888
APA StyleChahal, A. K., Lim, J. Z., Pan, J.-W., & Kong, P. W. (2022). Inter-Unit Consistency and Validity of 10-Hz GNSS Units in Straight-Line Sprint Running. Sensors, 22(5), 1888. https://doi.org/10.3390/s22051888