
Characterization of English Braille Patterns Using Automated Tools and RICA Based Feature Extraction Methods


Abstract
:1. Introduction
- (a)
- Collection of the English Braille Grade 1 dataset from visually impaired students of Muzaffarabad Special Education School, using the position-free Braille input application developed by Sana et al. This dataset was collected, as no such prior dataset exists that gathers Braille input from visually impaired users directly on touchscreen devices in real time.
- (b)
- A novel backend storage mechanism for Braille characters entered using the touchscreen-based application.
- (c)
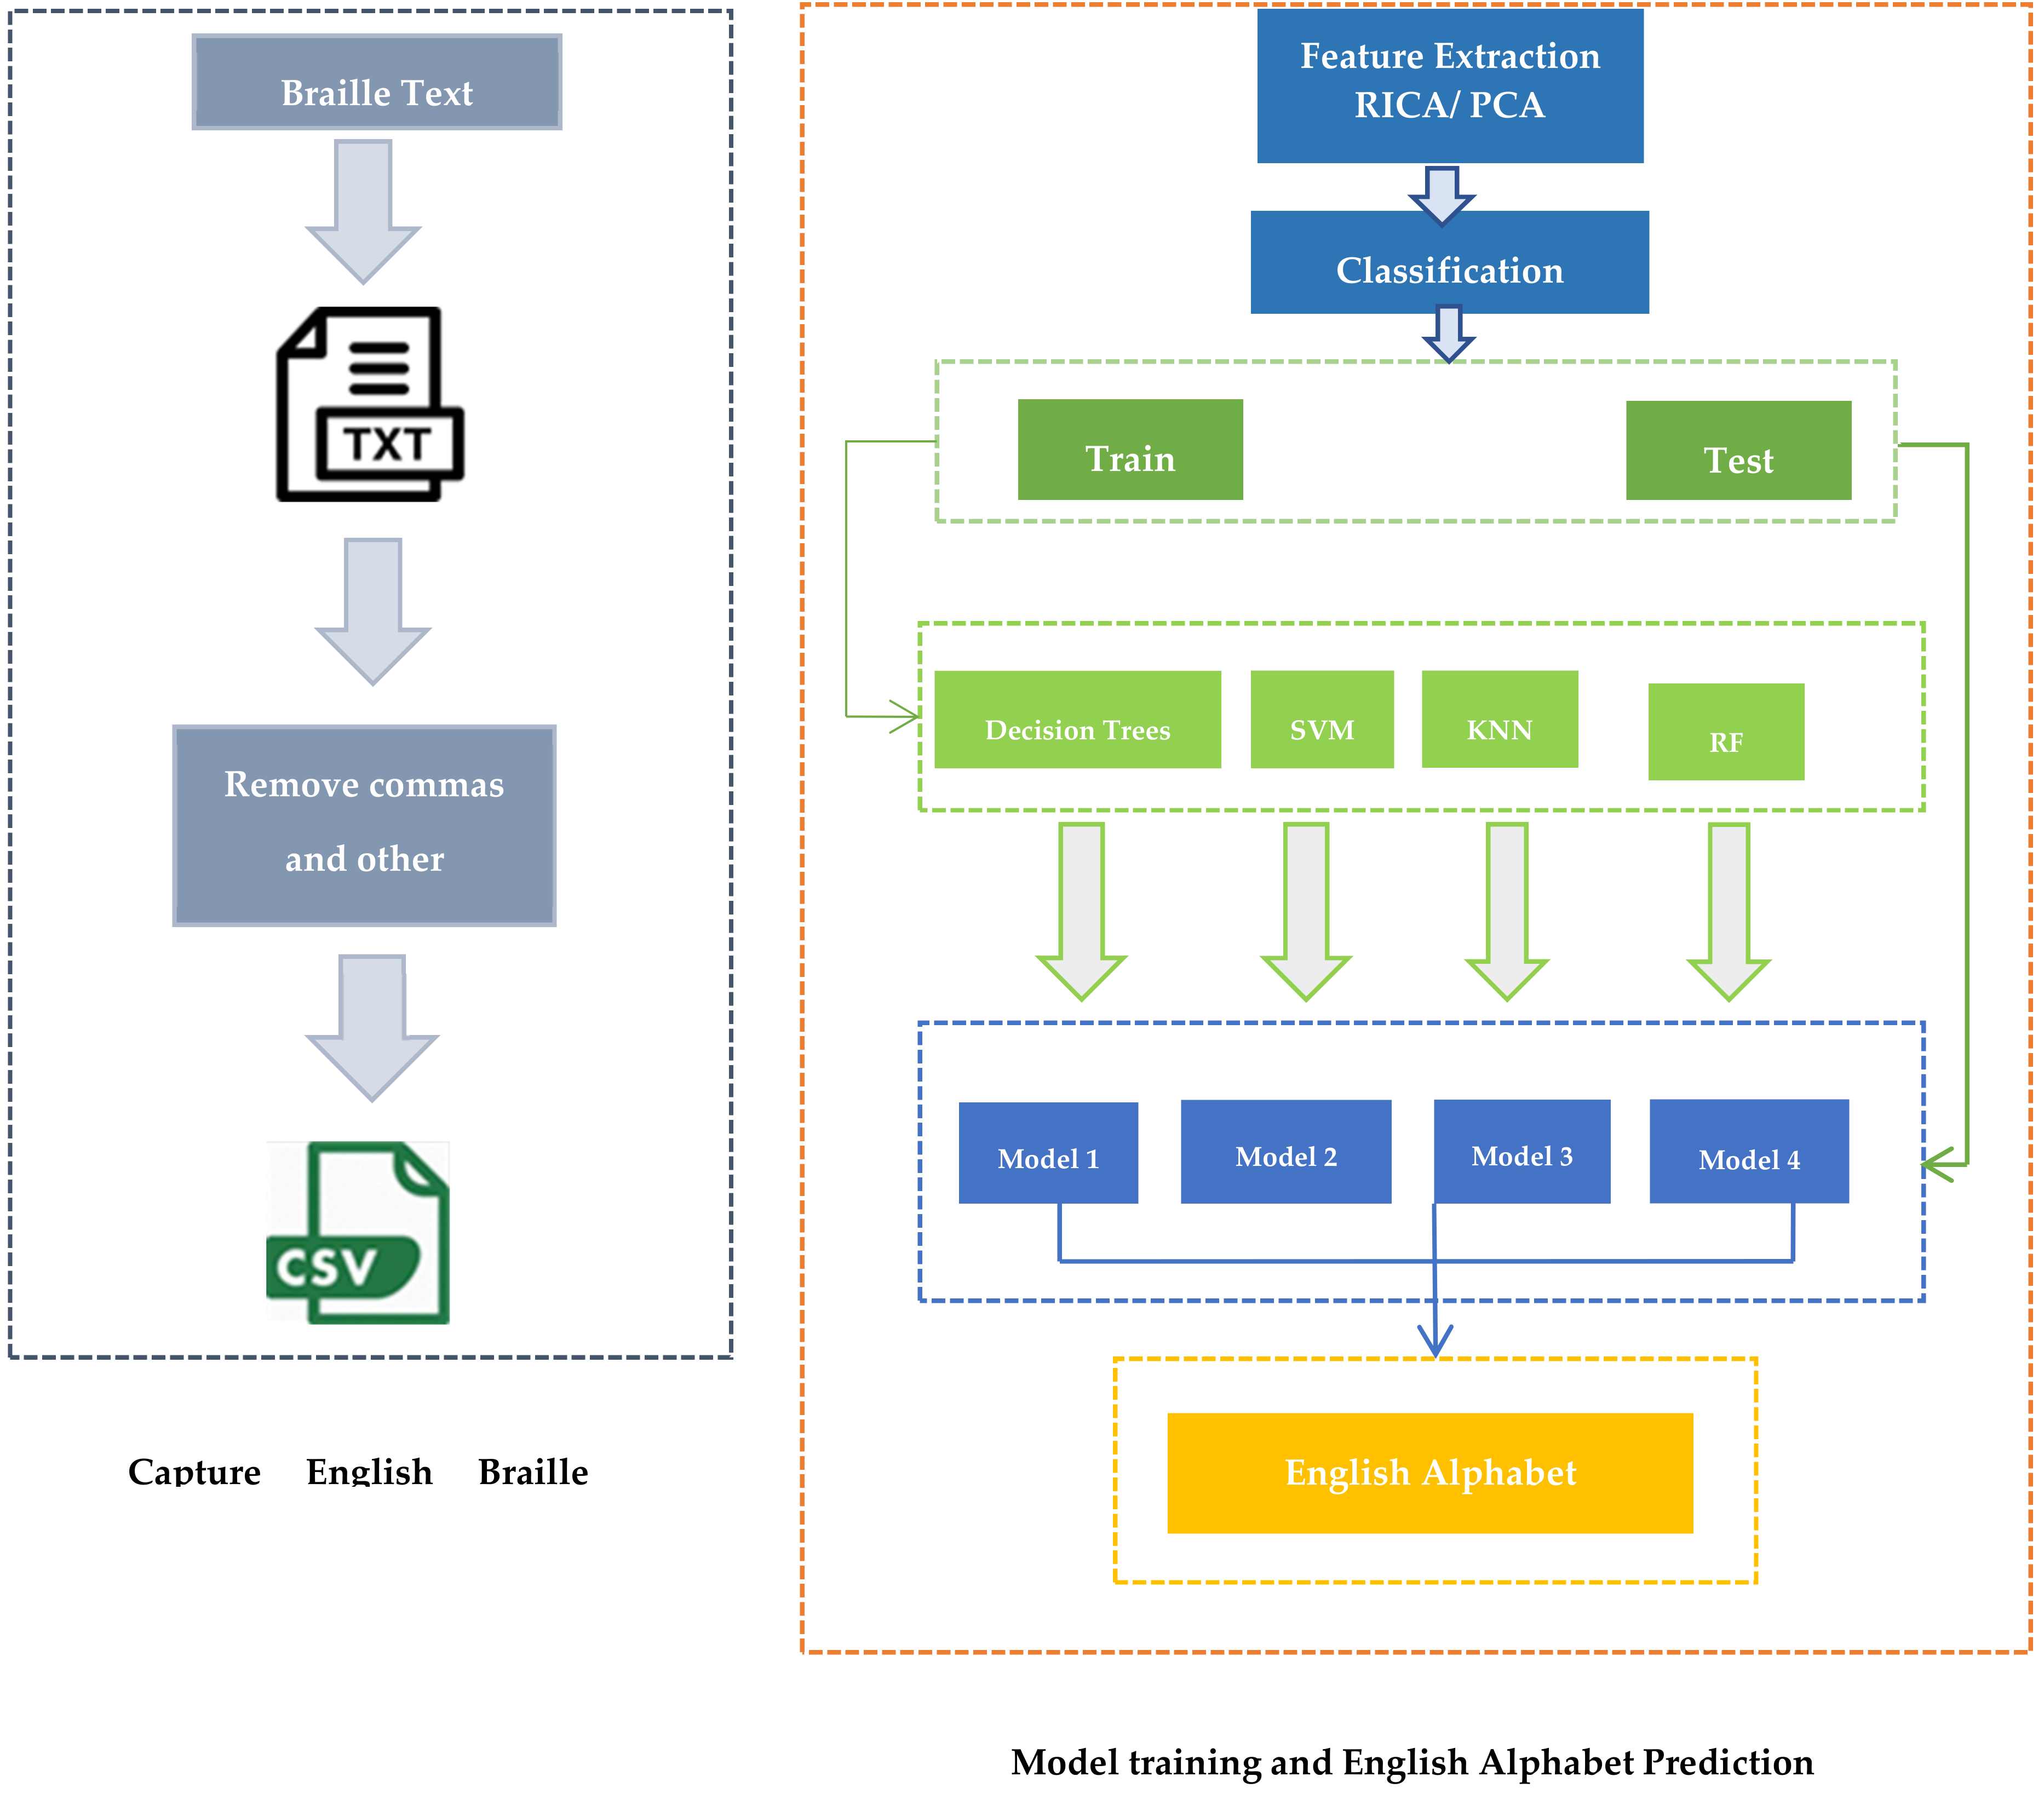
- Prediction of the English alphabet for the corresponding Braille characters using Decision Tree (DT), Support Vector Machine (SVM), K-Nearest Neighbor (KNN) and Random Forest (RF) with RICA- and PCA-based feature extraction methods.
- (d)
- Evaluation and comparison of the proposed mechanism with previous studies and using other techniques like the Random Forest and Sequential methods.
2. Literature Review
3. Materials and Methods
3.1. Dataset Collection
3.2. English Braille Character Recognition
3.3. Feature Extraction
3.3.1. RICA Feature Extraction Method
3.3.2. Principal Component Analysis
3.4. Classification
3.4.1. Decision Trees
3.4.2. K-Nearest Neighbor
3.4.3. Random Forest
3.4.4. Support Vector Machine
3.4.5. Sequential Model
4. Results
5. Discussion

| Paper Title | Input Method | Supported Language | Braille to Text | Text to Braille | Techniques Used | Feature Extraction/Algorithms/Others | Accuracy | Reference |
|---|---|---|---|---|---|---|---|---|
| Braille Messenger: Adaptive Learning Based Non-Visual Touchscreen Text Input for the Blind Community Using Braille | Gesture-Based Touchscreen Input | English | Yes | No | KNN | Bayesian Touch Distance | 97.4% | [73] |
| Nill | Newly Proposed Static Mathematical Algorithm | 94.86% | ||||||
| Conversion of Braille to Text in English, Hindi, And Tamil Languages | Hand-Written Scanned Braille Sheets | English | Yes | No | Nill | Image Segmentation Technique | 99.4% | [22] |
| Optical Braille Recognition with HAAR Wavelet Features and Support-Vector Machine | Hand-Written Scanned Braille Sheets | English | Yes | No | SVM | HAAR Feature Extraction Method | Reduced classification error to 10 | [36] |
| Optical Braille Recognition Based on Histogram of Oriented Gradient Features and Support-Vector Machine | Hand-Written Scanned Braille Sheet | English | Yes | No | SVM | HOG Feature Extraction Method | 99% | [23] |
| Robust Braille recognition system using image preprocessing and feature extraction algorithms | Hand-Written Braille Scanned Sheet | English | Yes | No | Image Processing Techniques | Edge Detection, Image Projection, and Image Segmentation | 100% | [75] |
| Braille Identification System Using Artificial Neural Networks | Hand-Written Braille Scanned Sheet | English | Yes | No | Artificial Neural Network | Back Propagation Algorithm | 85% | [76] |
| Conversion Of English Characters Into Braille Using Neural Network | Hand-Written English Scanned Sheet | English | No | Yes | Neural Network | Noise with 0.1 std showed no errors | [18] | |
| Designing Of English Text To Braille Conversion System: A Survey | Hand-Written English Scanned Sheet | English | No | Yes | Microcontroller | Accurate mapping of English to Braille text | [20] | |
| Efficient Approach for English Braille to Text Conversion | Hand-Written English Scanned Sheet | English | Yes | No | SVM | Image Enhancement, Noise Reduction, Contrast Enhancement and Image Dilation | 96% | [21] |
| The Methods Used in Text to Braille Conversion and Vice Versa | Image Taken from Camera | English | No | Yes | Raspberry PI | Accurate output was achieved | [24] | |
| Automated Conversion of English and Hindi Text to Braille Representation | Hand-Written Scanned Sheets | English | No | Yes | Using Lookup Tables | English To Braille characters were accurately mapped | [19] | |
| Application of Deep Learning to Classification of Braille Dot for Restoration of Old Braille Books | Hand-Written Braille Scanned Sheets | Braille | Deep Learning | Image Enhancement and Restoration Techniques | 98% | [77] | ||
| A Recurrent Neural Network Approach to Image Captioning in Braille for Blind-Deaf People | English Captions of Images Taken from Camera | English | Deep Recurrent Neural Network | BLEU-4 Score Of 0.24 is achieved | [78] | |||
| Smart Braille Recognition System | Braille Images Taken from Camera | English | Yes | No | Bayesian | Centroid Features | 100% | [79] |
| KNN | 100% | |||||||
| Classification Tree | 80.76% | |||||||
| SVM | 67.9% | |||||||
| Proposed Schemes | Touch-Screen Based Input Method | English | Yes | No | SVM | RICA Feature Extraction | 99.86% | |
| KNN | 99.50% | |||||||
| DT | 99.79% | |||||||
| RF | 90.02% | |||||||
| SVM | PCA Feature Extraction | 86% | ||||||
| KNN | 75% | |||||||
| DT | 70.02% | |||||||
| RF | 80% | |||||||
| Sequential Method | 93.51% |
6. Conclusions and Future Work
Author Contributions
Funding
Informed Consent Statement
Conflicts of Interest
Abbreviations
| ANN | Artificial Neural Network |
| ASCII | American Standard Code for Information Interchange |
| AUC | Area under the Curve |
| DT | Decision Tree |
| FDR | False Discovery Rate |
| FN | False Negative |
| FNR | False Negative Rate |
| FP | False Positive |
| FPR | False Positive Rate |
| GPU’s | Graphics Processing Unit |
| HOG | Histogram of Oriented Gradients |
| KNN | K-Nearest Neighbor |
| NPV | Negative Predicted Value |
| PCA | Principal Component Analysis |
| PPV | Positive Predicted Value |
| RF | Random Forest |
| ROC | Receiver Operating Characteristics |
| SVM | Support Vector Machine |
| Sn | Sensitivity |
| Sp | Specificity |
| TNR | True Negative Rate |
| TPR | True Positive Rate |
References
- WHO. Blindness and Vision Impairment; WHO: Geneva, Switzerland, 2019. [Google Scholar]
- Jared Smith WebAIM: Screen Reader User Survey #5 Results. Available online: http://webaim.org/projects/screenreadersurvey5/ (accessed on 10 September 2020).
- Miyauchi, H. A Systematic Review on Inclusive Education of Students with Visual Impairment. Educ. Sci. 2020, 10, 346. [Google Scholar] [CrossRef]
- Works, B. History of Braille. Available online: https://brailleworks.com/braille-resources/history-of-braille/#:~:text=Braille (accessed on 12 August 2020).
- Alnfiai, M.; Sampalli, S. SingleTapBraille: Developing a Text Entry Method Based on Braille Patterns Using a Single Tap. Procedia Comput. Sci. 2016, 94, 248–255. [Google Scholar] [CrossRef] [Green Version]
- Alnfiai, M.; Sampalli, S. Improved SingleTapBraille: Developing a Single Tap Text Entry Method Based on Grade 1 and 2 Braille Encoding. J. Ubiquitous Syst. Pervasive Netw. 2017, 9, 23–31. [Google Scholar] [CrossRef]
- National Institutes of Health. National Eye Institute LookTel—Instant Recognition Apps for Persons with Low Vision or Blindness. Available online: https://www.nih.gov/about-nih/what-we-do/nih-almanac/national-eye-institute-nei (accessed on 12 September 2020).
- Reader, K. KNFB Reader App Features the Best OCR. Available online: https://www.knfbreader.com/ (accessed on 10 February 2020).
- CloudSight TapTapSee—Blind and Visually Impaired Assistive Technology. Image Recognition API. Available online: https://taptapseeapp.com/ (accessed on 2 September 2020).
- Al-Doweesh, S.A.; Al-Hamed, F.A.; Al-Khalifa, H.S. What Color? A Real-Time Color Identification Mobile Application for Visually Impaired People. In Proceedings of the International Conference on Human-Computer Interaction, 22–24 June 2014; Springer: Toronto, ON, Canada, 2014; pp. 203–208. [Google Scholar]
- Wiberg, H.J. Be My Eyes—See the World Together. Available online: https://www.bemyeyes.com/ (accessed on 2 July 2019).
- Kouroupetroglou, G.; Pino, A.; Riga, P. A Methodological Approach for Designing and Developing Web-Based Inventories of Mobile Assistive Technology Applications. Multimed. Tools Appl. 2017, 76, 5347–5366. [Google Scholar] [CrossRef]
- Louis Braille and the Night Writer. Available online: https://www.historytoday.com/louis-braille-and-night-writer (accessed on 18 September 2020).
- Šepić, B.; Ghanem, A.; Vogel, S. BrailleEasy: One-Handed Braille Keyboard for Smartphones. Stud. Health Technol. Inform. 2015, 217, 1030–1035. [Google Scholar] [CrossRef]
- Siqueira, J.; Soares, A.d.M.F.A.; Silva, C.R.G.; de Oliveira Berretta, L.; Ferreira, C.B.R.; Felix, I.M.; Luna, M.M. BrailleÉcran: A Braille Approach to Text Entry on Smartphones. In Proceedings of the 2016 IEEE 40th Annual Computer Software and Applications Conference (COMPSAC), Atlanta, GA, USA, 10–14 June 2016; pp. 608–609. [Google Scholar]
- Alnfiai, M.; Sampalli, S. BrailleEnter: A Touch Screen Braille Text Entry Method for the Blind. Procedia Comput. Sci. 2017, 109, 257–264. [Google Scholar] [CrossRef]
- Li, M.; Fan, M.; Truong, K.N. BrailleSketch. In Proceedings of the 19th International ACM SIGACCESS Conference on Computers and Accessibility, Baltimore, MD, USA, 20 October–1 November 2017; ACM: New York, NY, USA, 2017; pp. 12–21. [Google Scholar]
- Hassan, M.Y.; Mohammed, A.G. Conversion of English Characters into Braille Using Neural Network 1. Iraqi J. Comput. Commun. Control Syst. Eng. 2011, 11, 30–37. [Google Scholar]
- Singh, M.; Bhatia, P. Automated Conversion of English and Hindi Text to Braille Representation. Int. J. Comput. Appl. 2010, 4, 25–29. [Google Scholar] [CrossRef]
- Dharme, V.S.; Karmore, S.P. Designing of English Text to Braille Conversion System: A Survey. In Proceedings of the 2015 International Conference on Innovations in Information, Embedded and Communication Systems (ICIIECS), Coimbatore, India, 19–20 March 2015; pp. 1–6. [Google Scholar]
- Gadag, M.; Udayashankara, V. Efficient Approach for English Braille to Text Conversion. Int. J. Adv. Res. Electr. Electron. Instrum. Eng. 2016, 5, 3343–3348. [Google Scholar] [CrossRef]
- Padmavathi, S.; Reddy, S.S.; Meenakshy, D. Conversion of Braille to Text in English, Hindi and Tamil Languages. Int. J. Comput. Sci. Eng. Appl. 2013, 3, 19–32. [Google Scholar] [CrossRef]
- Perera, T.D.S.H.; Wanniarachchi, W.K.I.L.I. Optical Braille Recognition Based on Histogram of Oriented Gradient Features and Support-Vector Machine. Int. J. Eng. Sci. 2018, 8, 19192–19195. [Google Scholar]
- Raghunadan, A.; MR, A. The Methods Used in Text to Braille Conversion and Vice Versa. Int. J. Innov. Res. Comput. Commun. Eng. 2017, 5, 8198–8205. [Google Scholar] [CrossRef]
- Kumar, P.R. Braille Language Converter for Visually Impaired People. Int. J. Intellect. Adv. Res. Eng. Comput. 2018, 6, 2229–2232. [Google Scholar]
- Devi, G.G. Braille Document Recongnition Languages—A Review. In Proceedings of the 2018 Fourth International Conference on Advances in Electrical, Electronics, Information, Communication and Bio-Informatics (AEEICB), Chennai, India, 27–28 February 2018; pp. 1–4. [Google Scholar]
- Guerreiro, T.; Lagoá, P.; Santana, P.; Gonçalves, D.; Jorge, J. NavTap and BrailleTap: Non-Visual Texting Interfaces. In Proceedings of the Rehabilitation Engineering and Assistive Technology Society of North America Conference (Resna), Arlington, VA, USA, 27 June 2008; pp. 1–10. Available online: https://www.researchgate.net/profile/Tiago-Guerreiro-5/publication/267550620_NavTap_and_BrailleTap_NavTap_and_BrailleTap_Non-Visual_Texting_Interfaces/links/09e4151066a4ee9c12000000/NavTap-and-BrailleTap-NavTap-and-BrailleTap-Non-Visual-Texting-Interfaces.pdf (accessed on 20 August 2021).
- Jayant, C.; Acuario, C.; Johnson, W.A.; Hollier, J.; Ladner, R.E. VBraille: Haptic Braille Perception Using a Touch-Screen and Vibration on Mobile Phones. In Proceedings of the 12th International ACM SIGACCESS Conference on Computers and Accessibility, ASSETS 2010, Orlando, FL, USA, 25–27 October 2010; ACM: New York, NY, USA; pp. 295–296. [Google Scholar]
- Mascetti, S.; Bernareggi, C.; Belotti, M. TypeInBraille: A Braille-Based Typing Application for Touchscreen Devices. In Proceedings of the 13th International ACM SIGACCESS conference on Computers and Accessibility, Dundee Scotland, UK, 24–26 October 2011; ACM: New York, NY, USA; pp. 295–296. [Google Scholar]
- Frey, B.; Southern, C.; Romero, M. BrailleTouch: Mobile Texting for the Visually Impaired. In Universal Access in Human-Computer Interaction; Springer: Berlin/Heidelberg, Germany, 2011; pp. 19–25. [Google Scholar]
- Milne, L.R.; Bennett, C.L.; Ladner, R.E.; Azenkot, S. BraillePlay: Educational Smartphone Games for Blind Children. In Proceedings of the 16th International ACM SIGACCESS Conference on Computers & Accessibility, Rochester, NY, USA, 20–22 October 2014; ACM: New York, NY, USA, 2014; pp. 137–144. [Google Scholar]
- Mattheiss, E.; Regal, G.; Schrammel, J.; Garschall, M.; Tscheligi, M. EdgeBraille: Braille-Based Text Input for Touch Devices. J. Assist. Technol. 2015, 9, 147–158. [Google Scholar] [CrossRef]
- BeSpecular. Available online: https://www.bespecular.com/ (accessed on 20 February 2020).
- Kacorri, H.; Kitani, K.M.; Bigham, J.P.; Asakawa, C. People with Visual Impairment Training Personal Object Recognizers: Feasibility and Challenges. In Proceedings of the 2017 CHI Conference on Human Factors in Computing Systems, Denver, CO, USA, 6–11 May 2017; ACM: New York, NY, USA; pp. 5839–5849. [Google Scholar]
- Priyadarsini, S.; Ajit, P.; Nayak, K.; Champati, S. A Survey on Speech Synthesis Techniques in Indian Languages. Multimed. Syst. 2020, 26, 453–478. [Google Scholar] [CrossRef]
- Li, J.; Yan, X.; Zhang, D. Optical Braille Recognition with Haar Wavelet Features and Support-Vector Machine. In Proceedings of the International Conference on Computer, Mechatronics, Control and Electronic Engineering, Changchun, China, 24–26 August 2010; pp. 64–67. [Google Scholar]
- Bier, A.; Sroczyński, Z. Rule Based Intelligent System Verbalizing Mathematical Notation. Multimed. Tools Appl. 2019, 78, 28089–28110. [Google Scholar] [CrossRef] [Green Version]
- Maćkowski, M.; Brzoza, P.; Żabka, M.; Spinczyk, D. Multimedia Platform for Mathematics’ Interactive Learning Accessible to Blind People. Multimed. Tools Appl. 2018, 77, 6191–6208. [Google Scholar] [CrossRef] [Green Version]
- Yook, J.; Kim, K.; Son, B.C.; Park, S. A Translating Program Usability Analysis of Alternative Multimedia Mathematics Materials for the Blind. Multimed. Tools Appl. 2021, 80, 34643–34659. [Google Scholar] [CrossRef]
- Fahiem, M.A. A. A Deterministic Turing Machine for Context Sensitive Translation of Braille Codes to Urdu Text. In Combinatorial Image Analysis; Springer: Berlin/Heidelberg, Germany, 2008; pp. 342–351. [Google Scholar]
- Iqbal, M.Z.; Shahid, S.; Naseem, M. Interactive Urdu Braille Learning System for Parents of Visually Impaired Students. In Proceedings of the 19th International ACM SIGACCESS Conference on Computers and Accessibility, Baltimore, MD, USA, 20 October–1 November 2017; ACM: New York, NY, USA, 2017; pp. 327–328. [Google Scholar]
- Al-Salman, A.; AlOhali, Y.; AlKanhal, M.; AlRajih, A. An Arabic Optical Braille Recognition System. In Proceedings of the New Trends in ICT and Accessibility–Proceedings of the 1st International Conference in Information and Communication Technology and Accessibility, Hammamet, Tunisia, 12–14 April 2007. [Google Scholar]
- Al-Shamma, S.D.; Fathi, S. Arabic Braille Recognition and Transcription into Text and Voice. In Proceedings of the 2010 5th Cairo International Biomedical Engineering Conference, Cairo, Egypt, 16–18 December 2010; pp. 227–231. [Google Scholar]
- Al-Salman, A.S. A Bi-Directional Bi-Lingual Translation Braille-Text System. J. King Saud Univ.-Comput. Inf. Sci. 2008, 20, 13–29. [Google Scholar] [CrossRef] [Green Version]
- Beg, U.; Parvathi, K.; Jha, V. Text Translation of Scanned Hindi Document to Braille via Image Processing. Indian J. Sci. Technol. 2017, 10, 1–8. [Google Scholar] [CrossRef]
- Nahar, L.; Jaafar, A.; Ahamed, E.; Kaish, A.B.M.A. Design of a Braille Learning Application for Visually Impaired Students in Bangladesh. Assist. Technol. 2015, 27, 172–182. [Google Scholar] [CrossRef] [PubMed]
- Abir, T.R.; Ahmed, T.S.B.; Rahman, M.D.T.; Jafreen, S. Handwritten Bangla Character Recognition to Braille Pattern Conversion Using Image Processing and Machine Learning. Ph.D. Thesis, Brac University, Dhaka, Bangladesh, 2018. [Google Scholar]
- Umarani, M.V.; Sheddi, R.P. A Review of Kannada Text to Braille Conversion. Int. J. Eng. Sci. Comput. 2018, 8, 15953–15956. [Google Scholar]
- Jha, V.; Parvathi, K. Machine Learning Based Braille Transliteration of Odia Language. Int. J. Innov. Technol. Explor. Eng. 2020, 9, 1866–1871. [Google Scholar] [CrossRef]
- Wang, X.; Yang, Y.; Liu, H.; Qian, Y. Chinese-Braille Translation Based on Braille Corpus. Int. J. Adv. Pervasive Ubiquitous Comput. 2016, 8, 56–63. [Google Scholar] [CrossRef] [Green Version]
- Wang, X.; Zhong, J.; Cai, J.; Liu, H.; Qian, Y. CBConv: Service for Automatic Conversion of Chinese Characters into Braille with High Accuracy. In Proceedings of the 21st International ACM SIGACCESS Conference on Computers and Accessibility, Pittsburgh, PA, USA, 28–30 October 2019; ACM: New York, NY, USA, 2019; pp. 566–568. [Google Scholar]
- Lee, S.; Jung, S.; Song, H. CNN-Based Drug Recognition and Braille Embosser System for the Blind. J. Comput. Sci. Eng. 2018, 12, 149–156. [Google Scholar] [CrossRef]
- Parekh, H.; Shah, S.; Patel, F.; Vyas, H. Gujarati Braille Text Recognition: A Review. Int. J. Comput. Sci. Commun. 2015, 7, 19–24. [Google Scholar] [CrossRef]
- Jariwala, N.; Patel, B. A System for the Conversion of Digital Gujarati Text-to-Speech for Visually Impaired People. In Speech and Language Processing for Human-Machine Communications; Advances in Intelligent Systems and Computing; Springer: Singapore, 2018; Volume 664, pp. 67–75. ISBN 9789811066252. [Google Scholar]
- Vyas, H.A.; Virparia, P.V. Transliteration of Braille Character to Gujarati Text the Application. Int. J. Comput. Sci. Eng. 2019, 7, 701–705. [Google Scholar] [CrossRef]
- Shokat, S.; Riaz, R.; Rizvi, S.S.; Abbasi, A.M.; Abbasi, A.A.; Kwon, S.J. Deep Learning Scheme for Character Prediction with Position-Free Touch Screen-Based Braille Input Method. Hum.-Cent. Comput. Inf. Sci. 2020, 10, 41. [Google Scholar] [CrossRef]
- Jha, V.; Parvathi, K. Braille Transliteration of Hindi Handwritten Texts Using Machine Learning for Character Recognition. Int. J. Sci. Technol. Res. 2019, 8, 1188–1193. [Google Scholar] [CrossRef]
- Li, T.; Zeng, X.; Xu, S. A Deep Learning Method for Braille Recognition. In Proceedings of the 2014 International Conference on Computational Intelligence and Communication Networks, Bhopal, India, 14–16 November 2014; pp. 1092–1095. [Google Scholar]
- Hyvärinen, A.; Oja, E. Independent Component Analysis: Algorithms and Applications. Neural Netw. 2000, 13, 411–430. [Google Scholar] [CrossRef] [Green Version]
- Xiao, Y.; Zhu, Z.; Zhao, Y.; Wei, Y.; Wei, S. Kernel Reconstruction ICA for Sparse Representation. IEEE Trans. Neural Netw. Learn. Syst. 2015, 26, 1222–1232. [Google Scholar] [CrossRef]
- Hyvärinen, A.; Hurri, J.; Hoyer, P.O. Natural Image Statistics: A Probabilistic Approach to Early Computational Vision; Springer: London, UK, 2009; Volume 39, ISBN 978-1-84882-490-4. [Google Scholar]
- Le, Q.V.; Karpenko, A.; Ngiam, J.; Ng, A.Y. ICA with Reconstruction Cost for Efficient Overcomplete Feature Learning. In Proceedings of the Advances in Neural Information Processing Systems, Granada, Spain, 12–15 December 2011; pp. 1017–1025. [Google Scholar]
- Le, Q.V. Building High-Level Features Using Large Scale Unsupervised Learning. In Proceedings of the 2013 IEEE International Conference on Acoustics, Speech and Signal Processing, Vancouver, BC, Canada, 26–31 May 2013; pp. 8595–8598. [Google Scholar]
- Boureau, Y.-L.; Ponce, J.; LeCun, Y. A Theoretical Analysis of Feature Pooling in Visual Recognition. In Proceedings of the 27th International Conference on Machine Learning (ICML-10), Haifa, Israel, 21–24 June 2010; pp. 111–118. [Google Scholar]
- Odhiambo Omuya, E.; Onyango Okeyo, G.; Waema Kimwele, M. Feature Selection for Classification Using Principal Component Analysis and Information Gain. Expert Syst. Appl. 2021, 174, 114765. [Google Scholar] [CrossRef]
- Rasheed, I.; Gupta, V.; Banka, H.; Kumar, C. Urdu Text Classification: A Comparative Study Using Machine Learning Techniques. In Proceedings of the 2018 Thirteenth International Conference on Digital Information Management (ICDIM), Berlin, Germany, 24–26 September 2018; pp. 274–278. [Google Scholar]
- Shaikhina, T.; Lowe, D.; Daga, S.; Briggs, D.; Higgins, R.; Khovanova, N. Decision Tree and Random Forest Models for Outcome Prediction in Antibody Incompatible Kidney Transplantation. Biomed. Signal Process. Control 2019, 52, 456–462. [Google Scholar] [CrossRef]
- Hussain, L.; Awan, I.A.; Aziz, W.; Saeed, S.; Ali, A.; Zeeshan, F.; Kwak, K.S. Detecting Congestive Heart Failure by Extracting Multimodal Features and Employing Machine Learning Techniques. BioMed Res. Int. 2020, 2020, 4281243. [Google Scholar] [CrossRef]
- Taylor, K.; Silver, L. Smartphone Ownership Is Growing Rapidly around the World, but Not Always Equally|Pew Research Center. 2019. Available online: https://www.Pewresearch.Org/Global/2019/02/05/Smartphone-Ownership-Is-Growing-Rapidly-Around-the-World-But-Not-Always-Equally/ (accessed on 20 September 2021).
- Pranckevičius, T.; Marcinkevičius, V. Comparison of Naïve Bayes, Random Forest, Decision Tree, Support Vector Machines, and Logistic Regression Classifiers for Text Reviews Classification. Balt. J. Mod. Comput. 2017, 5, 221–232. [Google Scholar] [CrossRef]
- Tanveer, M.; Sharma, A.; Suganthan, P.N. General Twin Support Vector Machine with Pinball Loss Function. Inf. Sci. 2019, 494, 311–327. [Google Scholar] [CrossRef]
- Gammerman, A.; Vovk, V.; Boström, H.; Carlsson, L. Conformal and Probabilistic Prediction with Applications: Editorial. Mach. Learn. 2019, 108, 379–380. [Google Scholar] [CrossRef] [Green Version]
- Udapola, H.; Liyanage, S.R. Braille Messenger: Adaptive Learning Based Non-Visual Touch Screen Input for the Blind Community Using Braille. In Proceedings of the International Conference on Innovations in Info-Business and Technology, Colombo, Sri Lanka, 9–10 September 2017; pp. 1–11. [Google Scholar]
- Zhong, M.; Zhou, Y.; Chen, G. Sequential Model Based Intrusion Detection System for Iot Servers Using Deep Learning Methods. Sensors 2021, 21, 1113. [Google Scholar] [CrossRef]
- Taha, H.M. Robust Braille Recognition System Using Image Preprocessing and Feature Extraction Algorithms. Ph.D. Thesis, Universiti Tun Hussien Onn Malaysia, Parit Raja, Malaysia, 2014. [Google Scholar]
- Waleed, M. Braille Identification System Using Artificial Neural Networks. Tikrit J. Pure Sci. 2017, 22, 140–145. [Google Scholar]
- Kawabe, H.; Shimomura, Y.; Nambo, H.; Seto, S. Application of Deep Learning to Classification of Braille Dot for Restoration of Old Braille Books. In Proceedings of the International Conference on Management Science and Engineering Management; Xu, J., Cooke, F.L., Gen, M., Ahmed, S.E., Eds.; Lecture Notes on Multidisciplinary Industrial Engineering; Springer International Publishing: Cham, Switzerland, 2019; pp. 913–926. ISBN 978-3-319-93350-4. [Google Scholar]
- Zaman, S.; Abrar, M.A.; Hassan, M.M.; Islam, A.N.M.N. A Recurrent Neural Network Approach to Image Captioning in Braille for Blind-Deaf People. In Proceedings of the 2019 IEEE International Conference on Signal Processing, Information, Communication & Systems (SPICSCON), Dhaka, Bangladesh, 28–30 November 2019; pp. 49–53. [Google Scholar]
- Valsan, K.S.; Stella, S.J. Smart Braille Recognition System. Int. J. Res. Appl. Sci. Eng. Technol. 2017, 5, 2452–2460. [Google Scholar] [CrossRef]


| Kernel Type | Classification Method | Mathematical Description |
|---|---|---|
| Linear Kernel | Linear SVM | |
| Polynomial Kernel | Quadratic SVM | |
| Cubic SVM | ||
| Gaussian Radial Base Function | Fine Gaussian SVM | |
| Medium Gaussian SVM | ||
| Course Gaussian SVM |
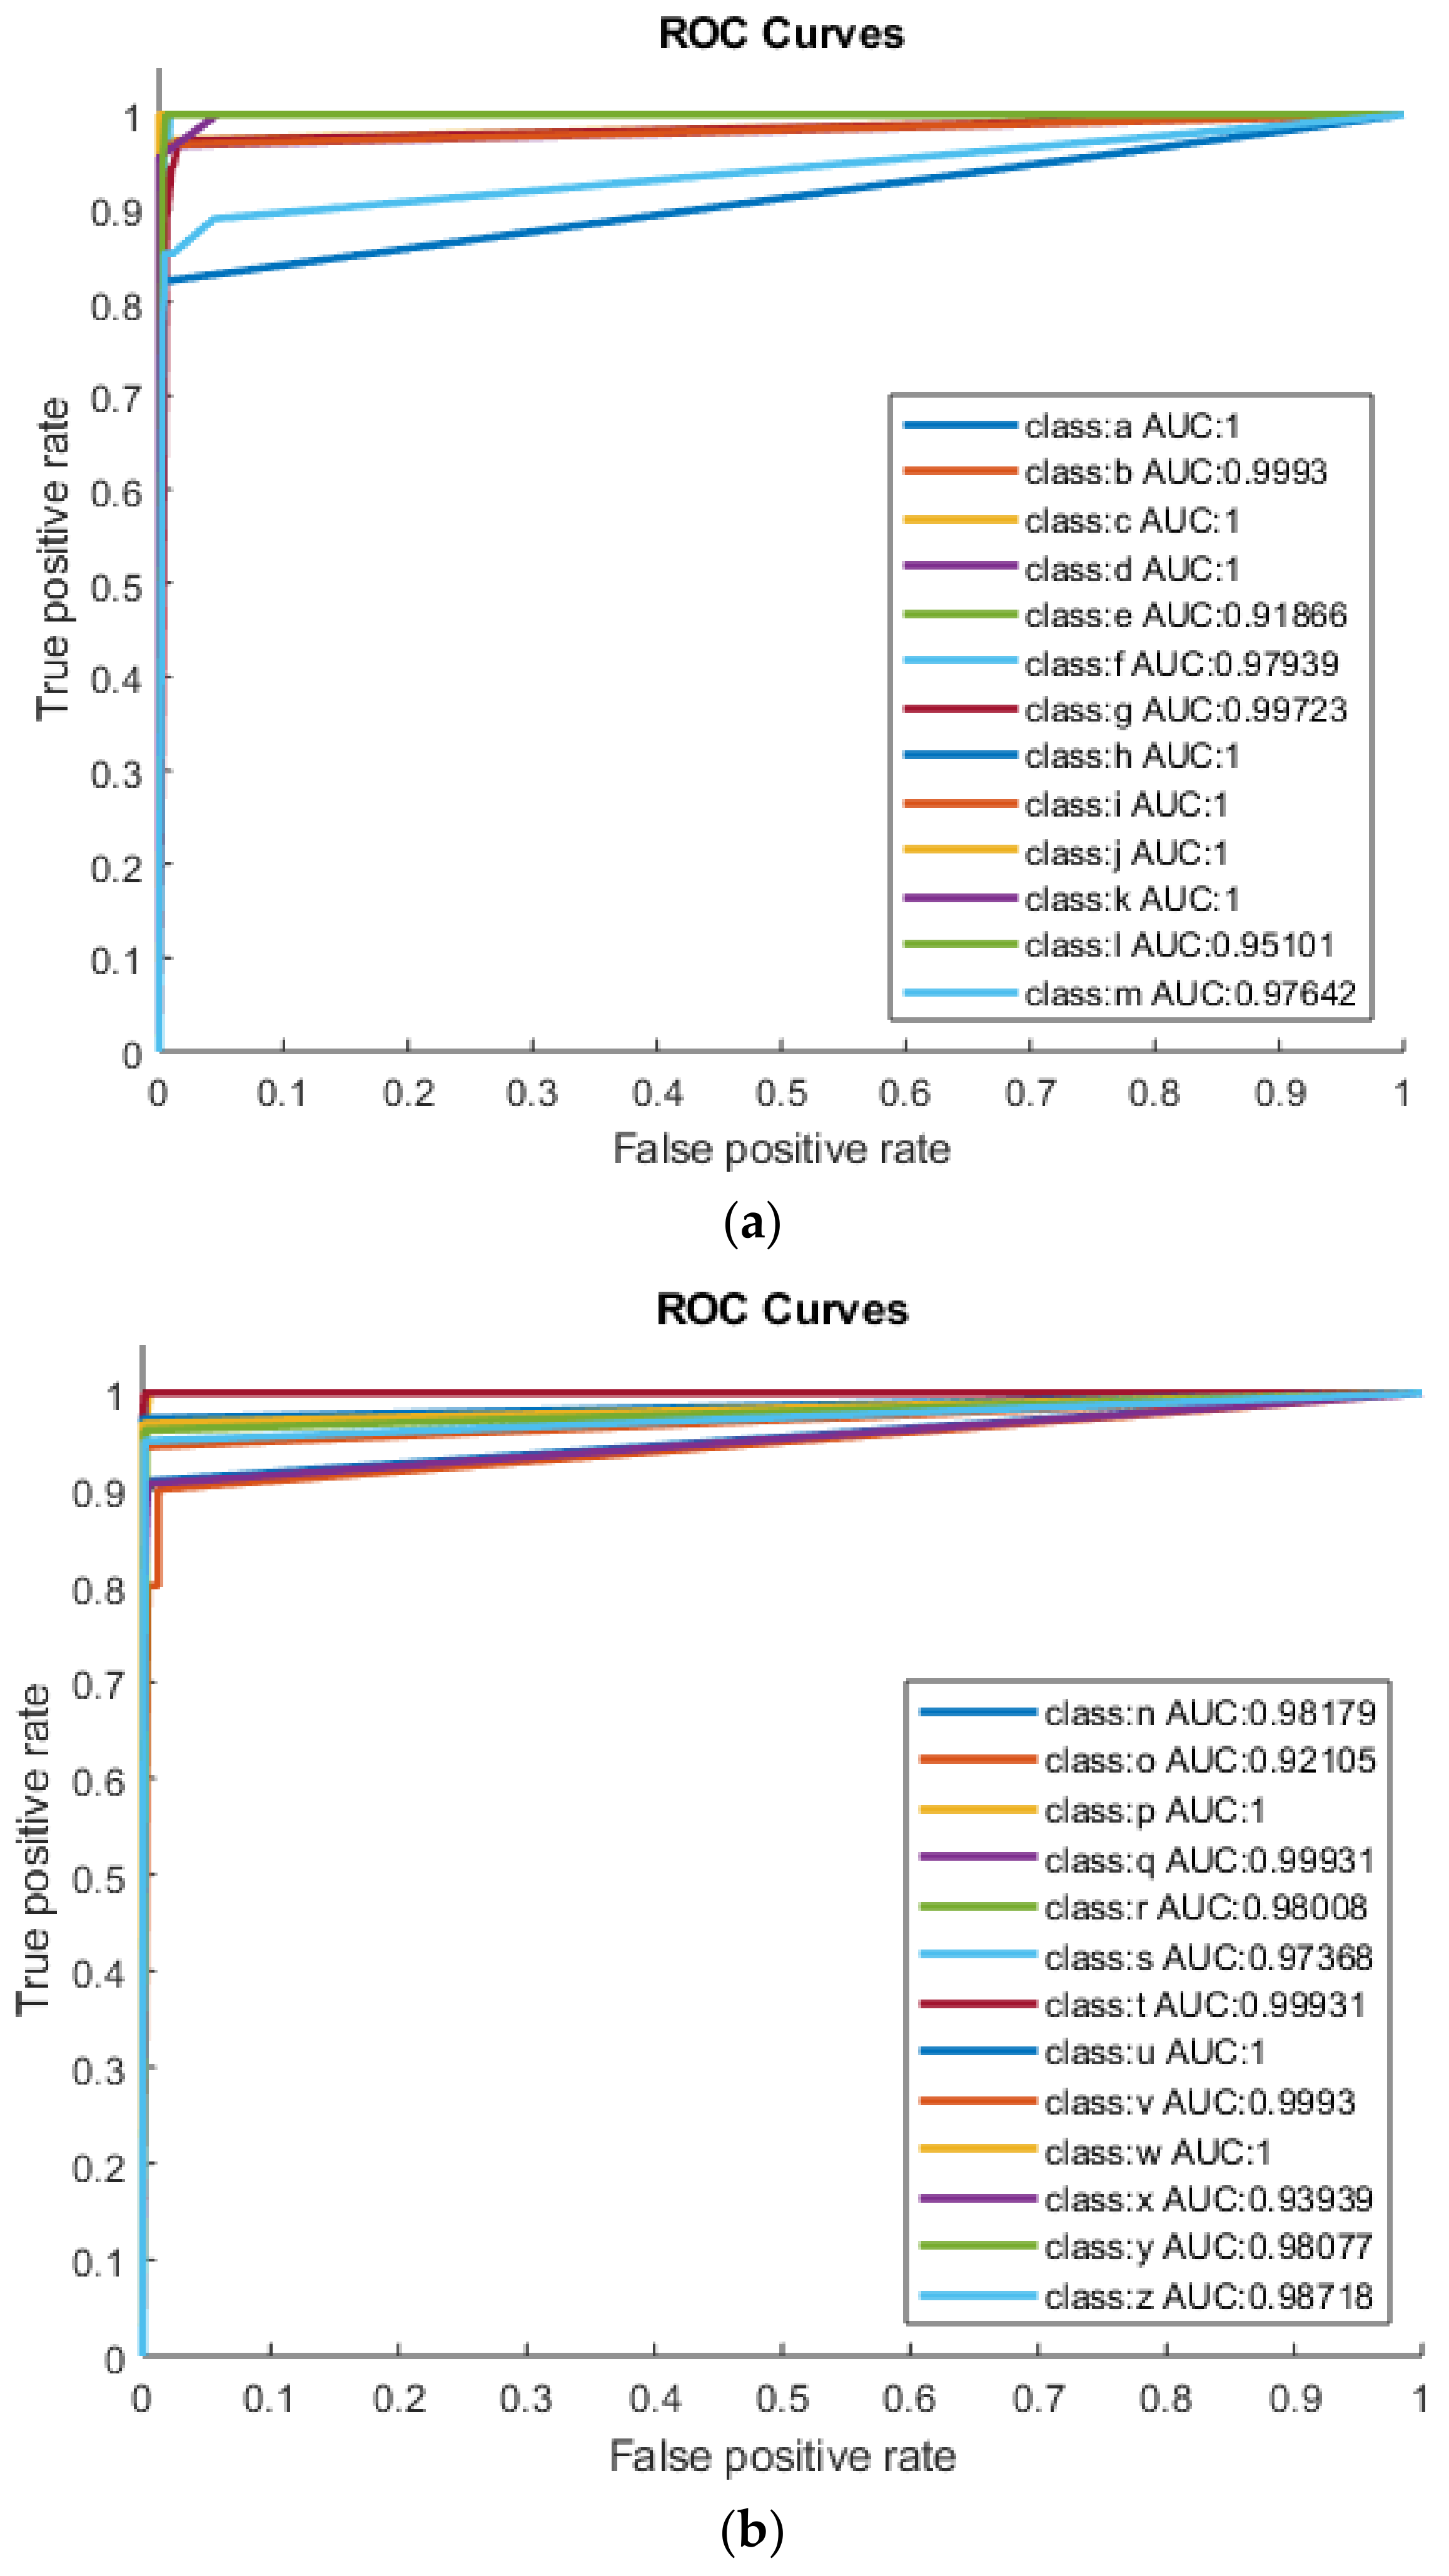
| Serial Number | English Characters | TPR (%) | TNR (%) | PPV (%) | NPV (%) | FPR (%) | Total Accuracy (%) | AUC | F1-Score |
|---|---|---|---|---|---|---|---|---|---|
| 1 | a | 100 | 100 | 100 | 100 | 0.00 | 100 | 1.00 | 1.00 |
| 2 | b | 100 | 99.86 | 97.14 | 100 | 0.14 | 99.87 | 0.99 | 0.99 |
| 3 | c | 100 | 100 | 100 | 100 | 0.00 | 100 | 1.00 | 1.00 |
| 4 | d | 100 | 100 | 100 | 100 | 0.00 | 100 | 1.00 | 1.00 |
| 5 | e | 83.87 | 99.86 | 96.30 | 99.31 | 0.14 | 99.20 | 0.91 | 0.90 |
| 6 | f | 96.15 | 99.72 | 92.59 | 99.86 | 0.28 | 99.60 | 0.97 | 0.94 |
| 7 | g | 100 | 99.45 | 88.89 | 100 | 0.55 | 99.47 | 0.99 | 0.94 |
| 8 | h | 100 | 100 | 100 | 100 | 0.00 | 100 | 1.00 | 1.00 |
| 9 | i | 100 | 100 | 100 | 100 | 0.00 | 100 | 1.00 | 1.00 |
| 10 | j | 100 | 100 | 100 | 100 | 0.00 | 100 | 1.00 | 1.00 |
| 11 | k | 100 | 100 | 100 | 100 | 0.00 | 100 | 1.00 | 1.00 |
| 12 | l | 90.48 | 99.73 | 90.48 | 99.73 | 0.27 | 99.47 | 0.95 | 0.90 |
| 13 | m | 95.83 | 99.45 | 85.19 | 99.86 | 0.55 | 99.34 | 0.97 | 0.90 |
| 14 | n | 96.77 | 99.58 | 90.91 | 99.86 | 0.42 | 99.47 | 0.98 | 0.94 |
| 15 | o | 84.21 | 100 | 100 | 99.59 | 0.00 | 99.60 | 0.92 | 0.91 |
| 16 | p | 100 | 100 | 100 | 100 | 0.00 | 100 | 1.00 | 1.00 |
| 17 | q | 100 | 99.86 | 96.30 | 100 | 0.14 | 99.87 | 0.99 | 0.98 |
| 18 | r | 96.15 | 99.86 | 96.15 | 99.86 | 0.14 | 99.73 | 0.98 | 0.96 |
| 19 | s | 94.74 | 100 | 100 | 99.86 | 0.00 | 99.87 | 0.97 | 0.97 |
| 20 | t | 100 | 99.86 | 96.55 | 100 | 0.14 | 99.87 | 0.99 | 0.98 |
| 21 | u | 100 | 100 | 100 | 100 | 0.00 | 100 | 1.00 | 1.00 |
| 22 | v | 100 | 99.86 | 97.14 | 100 | 0.14 | 99.87 | 0.99 | 0.99 |
| 23 | w | 100 | 100 | 100 | 100 | 0.00 | 100 | 1.00 | 1.00 |
| 24 | x | 87.88 | 100 | 100 | 99.45 | 0.00 | 99.47 | 0.93 | 0.94 |
| 25 | y | 96.15 | 100 | 100 | 99.86 | 0.00 | 99.87 | 0.98 | 0.98 |
| 26 | z | 97.44 | 100 | 100 | 99.86 | 0.00 | 99.87 | 0.98 | 0.99 |
| 26 | z | 97.44 | 100 | 100 | 99.86 | 0.00 | 99.87 | 0.98 | 0.99 |
| Serial Number | English Characters | TPR (%) | TNR (%) | PPV (%) | NPV (%) | FPR (%) | Total Accuracy (%) | AUC | F1-Score |
|---|---|---|---|---|---|---|---|---|---|
| 1 | a | 100 | 100 | 100 | 100 | 0.00 | 100 | 1.00 | 1.00 |
| 2 | b | 100 | 99.58 | 91.89 | 100 | 0.42 | 99.60 | 0.99 | 0.96 |
| 3 | c | 100 | 99.32 | 80.00 | 100 | 0.68 | 99.34 | 0.99 | 0.89 |
| 4 | d | 100 | 99.86 | 96.67 | 100 | 0.14 | 99.87 | 0.99 | 0.98 |
| 5 | e | 55.81 | 99.86 | 96.00 | 97.39 | 0.14 | 97.34 | 0.77 | 0.71 |
| 6 | f | 96.15 | 98.35 | 67.57 | 99.86 | 1.65 | 98.27 | 0.97 | 0.79 |
| 7 | g | 100 | 97.36 | 62.75 | 100 | 2.64 | 97.48 | 0.98 | 0.77 |
| 8 | h | 96.43 | 99.31 | 84.38 | 99.86 | 0.69 | 99.20 | 0.98 | 0.90 |
| 9 | i | 100 | 100 | 100 | 100 | 0.00 | 100 | 1.00 | 1.00 |
| 10 | j | 100 | 100 | 100 | 100 | 0.00 | 100 | 1.00 | 1.00 |
| 11 | k | 100 | 100 | 100 | 100 | 0.00 | 100 | 1.00 | 1.00 |
| 12 | l | 94.74 | 100 | 100 | 99.86 | 0.00 | 99.87 | 0.97 | 0.97 |
| 13 | m | 100 | 99.87 | 92.31 | 100 | 0.13 | 99.87 | 0.99 | 0.96 |
| 14 | n | 96.30 | 99.17 | 81.25 | 99.86 | 0.83 | 99.07 | 0.97 | 0.88 |
| 15 | o | 85.71 | 100 | 100 | 99.59 | 0.00 | 99.60 | 0.93 | 0.92 |
| 16 | p | 100 | 100 | 100 | 100 | 0.00 | 100 | 1.00 | 1.00 |
| 17 | q | 100 | 99.86 | 96.43 | 100 | 0.14 | 99.87 | 0.99 | 0.98 |
| 18 | r | 96.15 | 99.72 | 92.59 | 99.86 | 0.28 | 99.60 | 0.98 | 0.94 |
| 19 | s | 88.89 | 100 | 100 | 99.73 | 0.00 | 99.73 | 0.94 | 0.94 |
| 20 | t | 89.66 | 100 | 100 | 99.59 | 0.00 | 99.60 | 0.95 | 0.95 |
| 21 | u | 100 | 100 | 100 | 100 | 0.00 | 100 | 1.00 | 1.00 |
| 22 | v | 96.97 | 100 | 100 | 99.86 | 0.00 | 99.87 | 0.98 | 0.98 |
| 23 | w | 96.97 | 100 | 100 | 99.86 | 0.00 | 99.87 | 0.98 | 0.98 |
| 24 | x | 100 | 99.86 | 94.44 | 100 | 0.14 | 99.87 | 0.99 | 0.97 |
| 25 | y | 100 | 100 | 100 | 100 | 0.00 | 100 | 1.00 | 1.00 |
| 26 | z | 84.62 | 100 | 100 | 99.17 | 0.00 | 99.20 | 0.92 | 0.92 |
| Serial Number | English Characters | TPR (%) | TNR (%) | PPV (%) | NPV (%) | FPR (%) | Total Accuracy (%) | AUC | F1-Score |
|---|---|---|---|---|---|---|---|---|---|
| 1 | a | 100 | 100 | 100 | 100 | 0.00 | 100 | 1.00 | 1.00 |
| 2 | b | 100 | 99.86 | 97.30 | 100 | 0.14 | 99.87 | 0.99 | 0.99 |
| 3 | c | 100 | 100 | 100 | 100 | 0.00 | 100 | 1.00 | 1.00 |
| 4 | d | 100 | 100 | 100 | 100 | 0.00 | 100 | 1.00 | 1.00 |
| 5 | e | 92.86 | 100 | 100 | 99.72 | 0.00 | 99.73 | 0.96 | 0.96 |
| 6 | f | 100 | 99.73 | 92.00 | 100 | 0.27 | 99.73 | 0.99 | 0.96 |
| 7 | g | 100 | 99.16 | 85.37 | 100 | 0.84 | 99.20 | 0.99 | 0.92 |
| 8 | h | 100 | 100 | 100 | 100 | 0.00 | 100 | 1.00 | 1.00 |
| 9 | i | 100 | 100 | 100 | 100 | 0.00 | 100 | 1.00 | 1.00 |
| 10 | j | 100 | 100 | 100 | 100 | 0.00 | 100 | 1.00 | 1.00 |
| 11 | k | 100 | 100 | 100 | 100 | 0.00 | 100 | 1.00 | 1.00 |
| 12 | l | 100 | 99.86 | 95.00 | 100 | 0.14 | 99.87 | 0.99 | 0.97 |
| 13 | m | 92.59 | 99.59 | 89.29 | 99.72 | 0.41 | 99.34 | 0.96 | 0.91 |
| 14 | n | 100 | 100 | 100 | 100 | 0.00 | 100 | 1.00 | 1.00 |
| 15 | o | 94.74 | 99.86 | 94.74 | 99.86 | 0.14 | 99.73 | 0.97 | 0.95 |
| 16 | p | 100 | 100 | 100 | 100 | 0.00 | 100 | 1.00 | 1.00 |
| 17 | q | 100 | 99.86 | 96.43 | 100 | 0.14 | 99.87 | 0.99 | 0.98 |
| 18 | r | 100 | 99.86 | 96.30 | 100 | 0.14 | 99.87 | 0.99 | 0.98 |
| 19 | s | 88.89 | 100 | 100 | 99.73 | 0.00 | 99.73 | 0.94 | 0.94 |
| 20 | t | 100 | 100 | 100 | 100 | 0.00 | 100 | 1.00 | 1.00 |
| 21 | u | 100 | 100 | 100 | 100 | 0.00 | 100 | 1.00 | 1.00 |
| 22 | v | 100 | 100 | 100 | 100 | 0.00 | 100 | 1.00 | 1.00 |
| 23 | w | 100 | 100 | 100 | 100 | 0.00 | 100 | 1.00 | 1.00 |
| 24 | x | 84.85 | 100 | 100 | 99.31 | 0.00 | 99.34 | 0.92 | 0.92 |
| 25 | y | 100 | 100 | 100 | 100 | 0.00 | 100 | 1.00 | 1.00 |
| 26 | z | 100 | 100 | 100 | 100 | 0.00 | 100 | 1.00 | 1.00 |
| Classifier | Feature Extraction Method | Precision (%) | Recall (%) | F1-Score | Accuracy (%) |
|---|---|---|---|---|---|
| DT | RICA | 97.22 | 96.91 | 0.970 | 99.79 |
| KNN | 93.70 | 95.32 | 0.939 | 99.50 | |
| SVM | 97.94 | 98.23 | 0.980 | 99.86 | |
| RF | 90.12 | 90.34 | 0.904 | 90.02 | |
| DT | PCA | 72.01 | 68.04 | 0.71 | 70.02 |
| KNN | 79.56 | 75.45 | 0.76 | 75.40 | |
| SVM | 88.12 | 86.32 | 0.86 | 86.32 | |
| RF | 80.0 | 79.0 | 0.79 | 80.0 |
| Classifier | Feature Extraction Method | p-Value |
|---|---|---|
| DT vs. KNN | RICA | 0.001 |
| SVM vs. DT | 0.000 | |
| DT vs. RF | 0.021 | |
| KNN vs. DT | PCA | 0.024 |
| DT vs. SVM | 0.031 | |
| RF vs. DT | 0.03 |
Publisher’s Note: MDPI stays neutral with regard to jurisdictional claims in published maps and institutional affiliations. |
© 2022 by the authors. Licensee MDPI, Basel, Switzerland. This article is an open access article distributed under the terms and conditions of the Creative Commons Attribution (CC BY) license (https://creativecommons.org/licenses/by/4.0/).
Share and Cite
Shokat, S.; Riaz, R.; Rizvi, S.S.; Khan, I.; Paul, A. Characterization of English Braille Patterns Using Automated Tools and RICA Based Feature Extraction Methods. Sensors 2022, 22, 1836. https://doi.org/10.3390/s22051836
Shokat S, Riaz R, Rizvi SS, Khan I, Paul A. Characterization of English Braille Patterns Using Automated Tools and RICA Based Feature Extraction Methods. Sensors. 2022; 22(5):1836. https://doi.org/10.3390/s22051836
Chicago/Turabian StyleShokat, Sana, Rabia Riaz, Sanam Shahla Rizvi, Inayat Khan, and Anand Paul. 2022. "Characterization of English Braille Patterns Using Automated Tools and RICA Based Feature Extraction Methods" Sensors 22, no. 5: 1836. https://doi.org/10.3390/s22051836
APA StyleShokat, S., Riaz, R., Rizvi, S. S., Khan, I., & Paul, A. (2022). Characterization of English Braille Patterns Using Automated Tools and RICA Based Feature Extraction Methods. Sensors, 22(5), 1836. https://doi.org/10.3390/s22051836