
Smart-Sleeve: A Wearable Textile Pressure Sensor Array for Human Activity Recognition


Abstract
:1. Introduction
- A Smart-Sleeve based on pressure mapping textiles is proposed for HAR. The sleeve is soft, stretchable, washable, and can be easily incorporated into ordinary clothing.
- Both classic machine learning and deep learning methods are used to evaluate the performance of the Smart-Sleeve for everyday activity recognition. To normalize the data differences caused by different body sizes, a new preprocessing method is adopted. A feature set of 100 features, including statistical, geometric, and symmetry features, is proposed.
- Our dataset is open to the public, including 18 daily activities performed by 14 participants in an office scenario. To the best of our knowledge, there are no publicly available datasets of pressure sensor-based sleeves for HAR.
2. Related Work
2.1. Systems for Human Activity Recognition
2.2. Textile Sensors and Applications
3. System and Experiment Design
3.1. Smart-Sleeve
3.2. Experiment Design
4. Data Processing
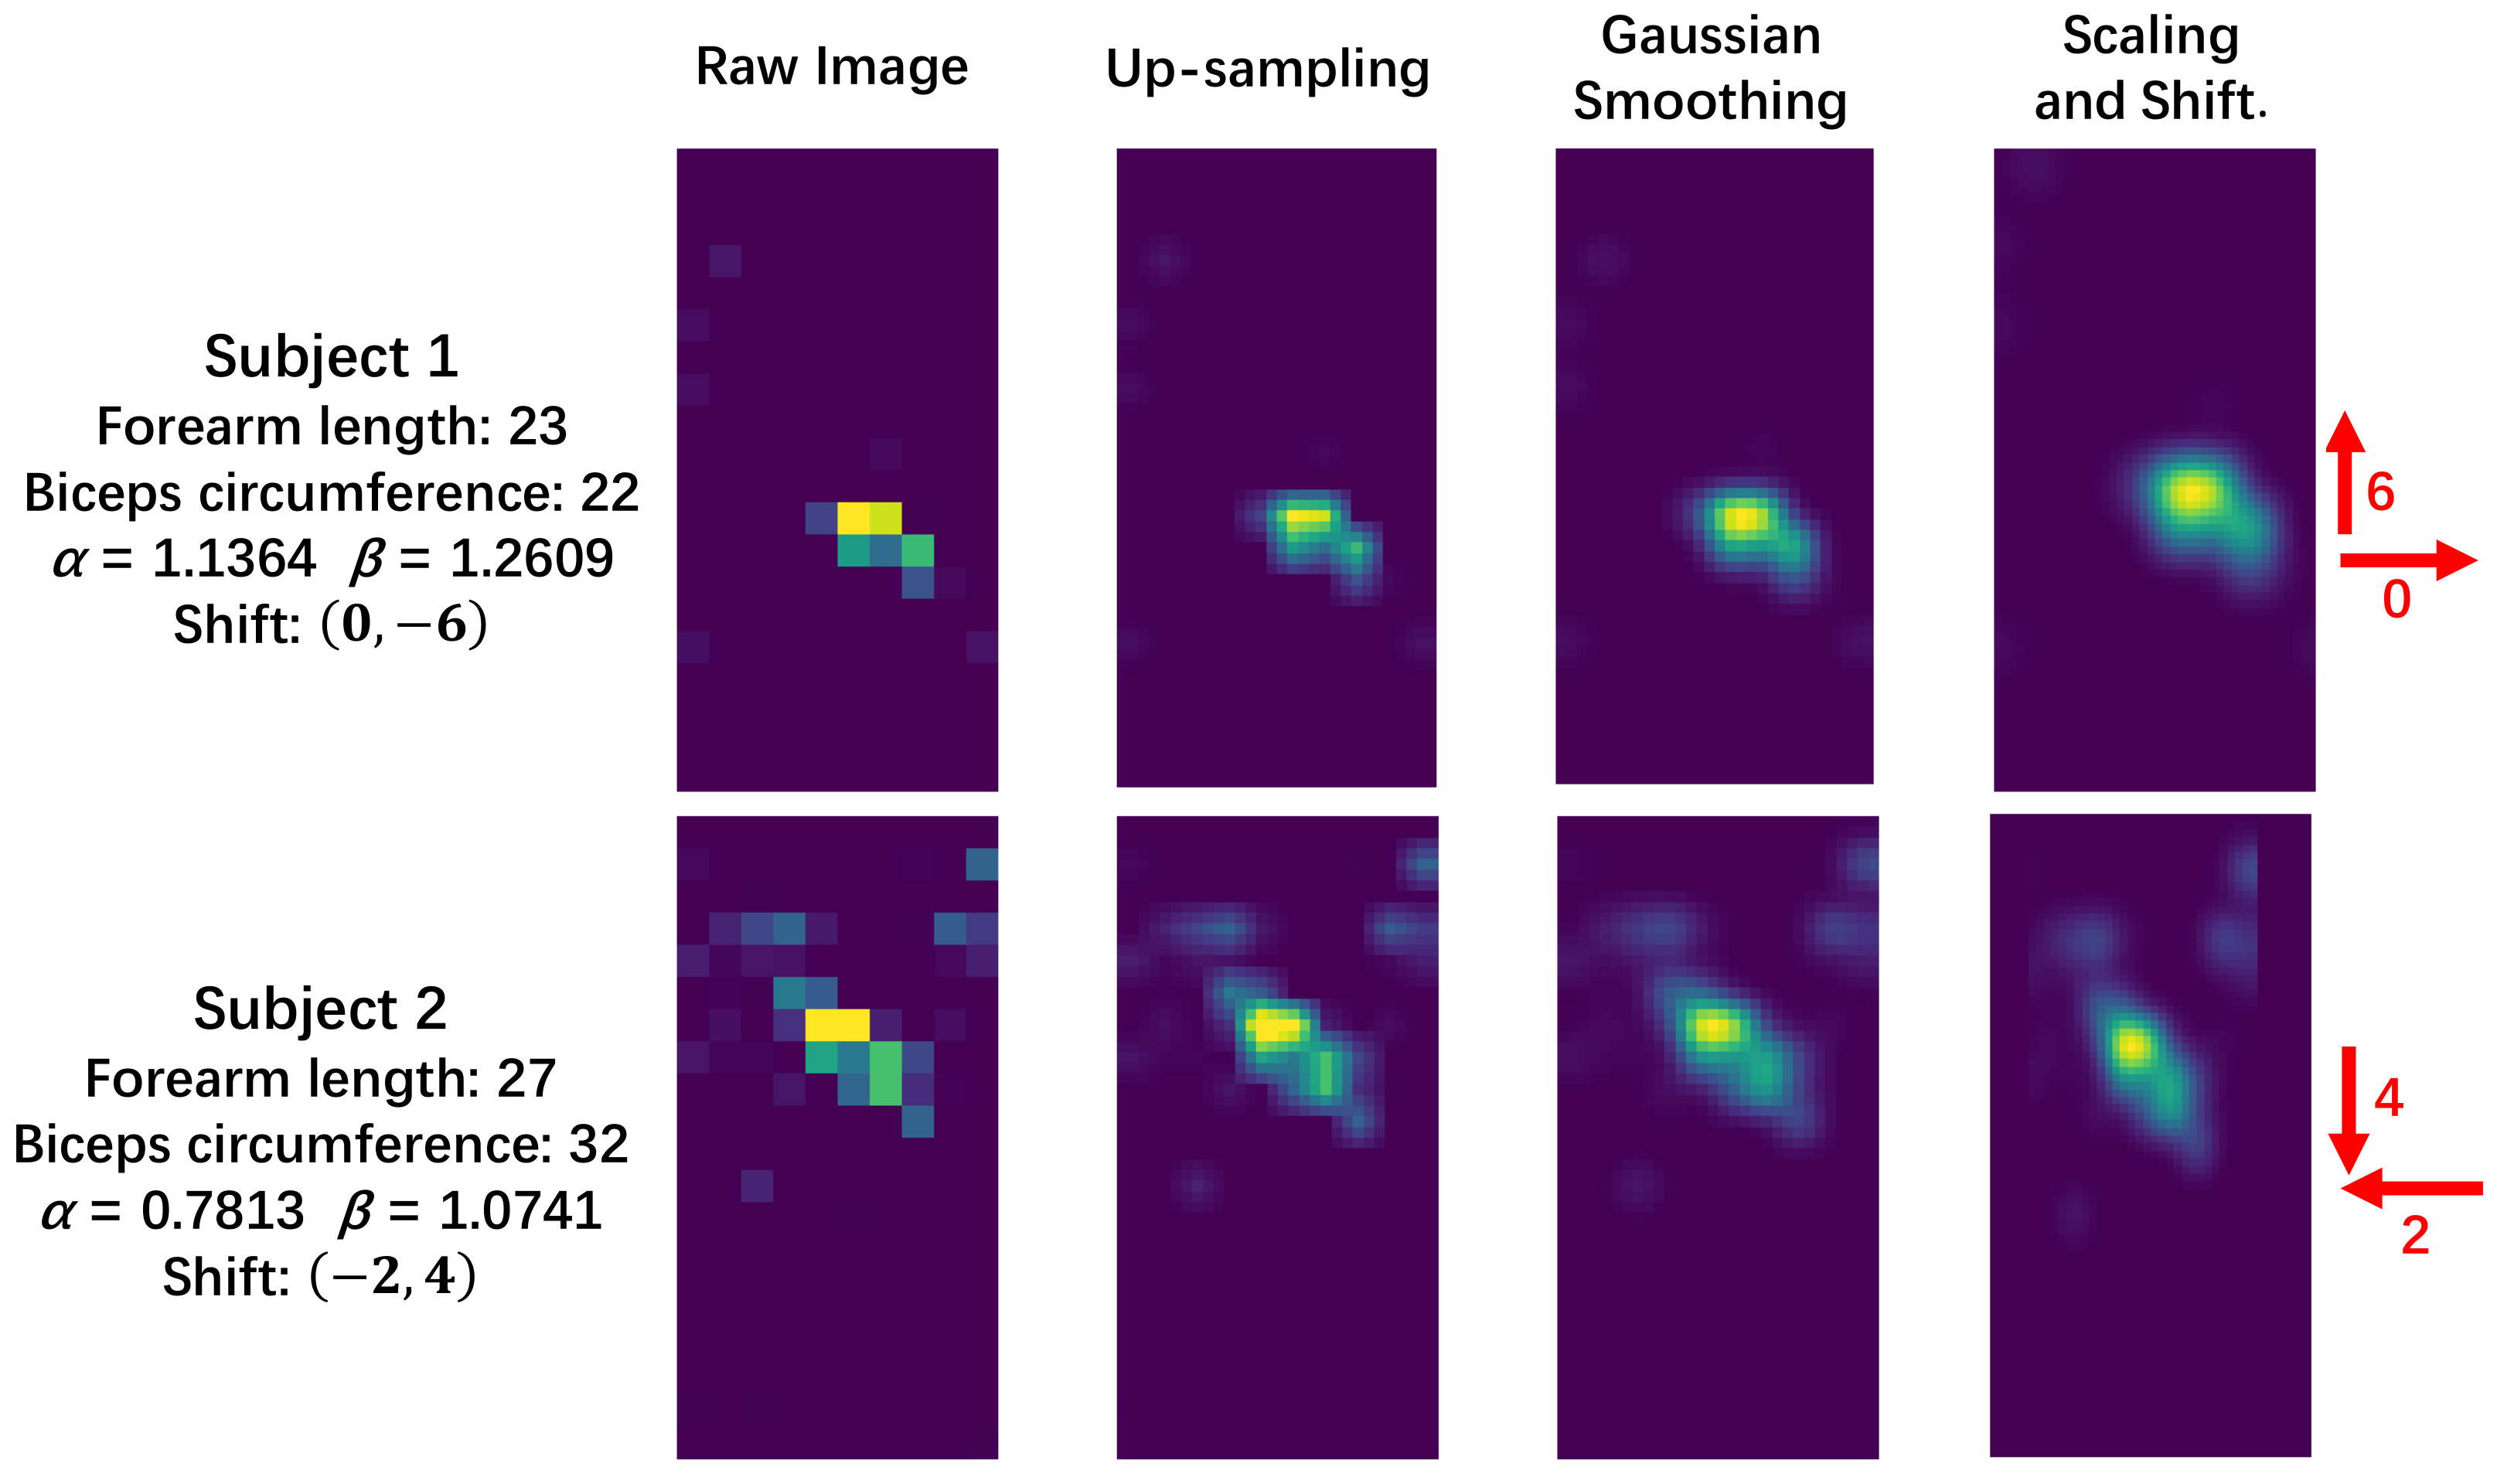
4.1. Preprocessing
4.1.1. Upsampling and Smoothing
4.1.2. Scaling and Shift
4.2. Feature Extraction
4.2.1. Statistical Features
| to : | Maximum, median, sum, and range (maximum–median). |
| to : | Average, variance, mean absolute deviation, and entropy of all pixel values in the pressure image, as defined in [34]. |
4.2.2. Geometric Features
| , : | The centroid coordinate x and y. |
| , : | The centre of mass coordinate x and y. |
| : | The distance from the centroid to the origin. |
| : | The distance from the centre of mass to the origin. |
| : | The angle between the line from the origin to the centroid and the positive direction of the x-axis. |
| : | The angle between the line from the origin to the centre of mass and the positive direction of the x-axis. |
| to : | Width, height, aspect ratio, and area of the bounding rectangle of the pressure image. |
| : | Area (the number of pixels after thresholding with a value of 2). |
| to : | Hu’s seven invariant moments [37], which are rotation, translation, and scale invariant. |
| : | Coverage (proportion of image covered). |
| to : | The coverage for the pixels that contain 25%, 50%, and 75% of the total pressure. |
| to : | The coverage over four fixed rectangular regions. |
| : | The number of contours. |
| : | Area of the contour containing the largest area. |
| : | Pressure of the contour containing the largest pressure. |
| : | Intensity of pressure of the contour containing the largest intensity of pressure. |
| to : | to of the masked image. |
4.2.3. Symmetry Features
| , : | The area of each side. |
| , : | the pressure of each side. |
| : | The ratio of area of both sides. |
| : | The ratio of pressure of both sides. |
5. Evaluations
5.1. Classical Machine Learning Method
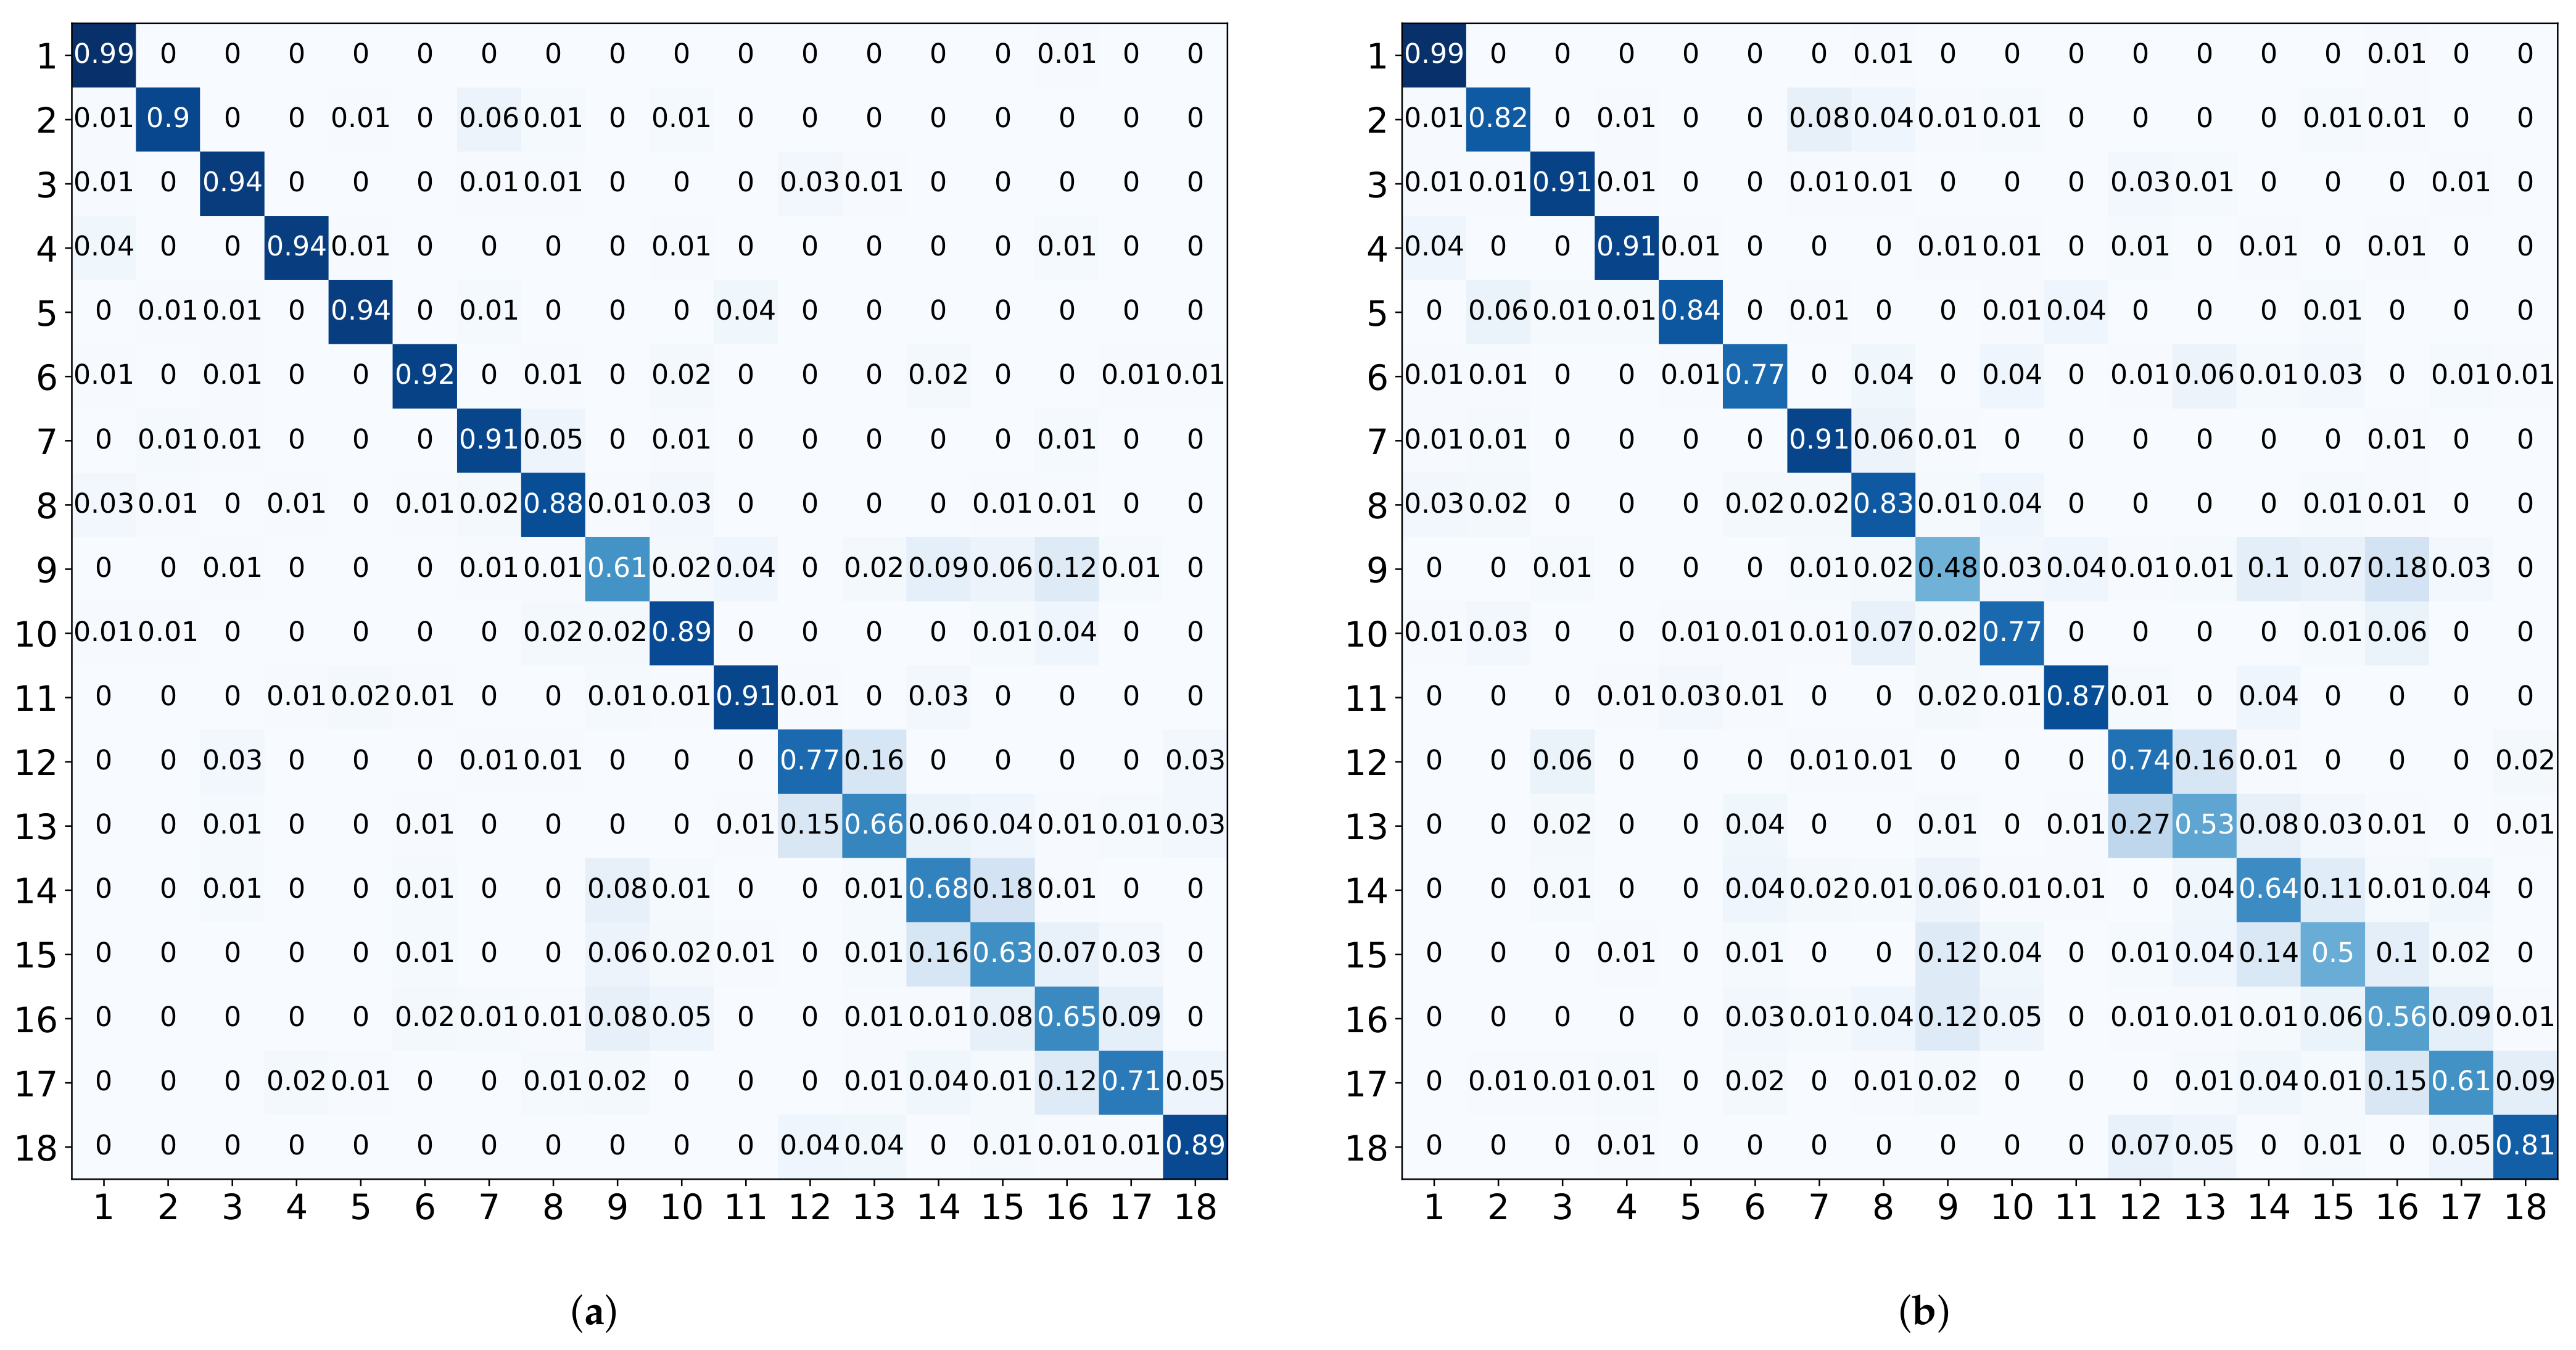
5.2. Deep Learning Method
5.3. Evaluation Metrics
5.4. Classical Machine Learning Results
5.5. Deep Learning Results
6. Conclusions
7. Discussions
Author Contributions
Funding
Institutional Review Board Statement
Informed Consent Statement
Data Availability Statement
Acknowledgments
Conflicts of Interest
Abbreviations
| HAR | Human activity recognition |
| IMU | Inertial measurement units |
| ADC | Analog to digital converter |
| SVM | Support vector machine |
| KNN | k-nearest neighbor |
| LR | Logistic regression |
| RF | Random forest |
| DT | Decision tree |
| NB | Naive Bayes |
| CNN | Convolutional neural network |
| IOT | Internet of Things |
| LOSO | Leave-one-subject-out |
References
- Haresamudram, H.; Anderson, D.V.; Plötz, T. On the role of features in human activity recognition. In Proceedings of the 23rd International Symposium on Wearable Computers; London, UK, 9–13 September 2019, ACM: London, UK, 2019; pp. 78–88. [Google Scholar] [CrossRef]
- Zhou, Z.; Chen, X.; Chung, Y.C.; He, Z.; Han, T.X.; Keller, J.M. Activity analysis, summarization, and visualization for indoor human activity monitoring. IEEE Trans. Circuits Syst. Video Technol. 2008, 18, 1489–1498. [Google Scholar] [CrossRef] [Green Version]
- Pirsiavash, H.; Ramanan, D. Detecting activities of daily living in first-person camera views. In Proceedings of the 2012 IEEE Conference on Computer Vision and Pattern Recognition, Providence, RI, USA, 16–21 June 2012; pp. 2847–2854. [Google Scholar] [CrossRef]
- Khan, I.U.; Afzal, S.; Lee, J.W. Human Activity Recognition via Hybrid Deep Learning Based Model. Sensors 2022, 22, 323. [Google Scholar] [CrossRef] [PubMed]
- Jiang, W.; Miao, C.; Ma, F.; Yao, S.; Wang, Y.; Yuan, Y.; Xue, H.; Song, C.; Ma, X.; Koutsonikolas, D.; et al. Towards environment independent device free human activity recognition. In Proceedings of the 24th Annual International Conference on Mobile Computing and Networking; New Delhi, India, 29 October–2 November 2018, ACM: New Delhi, India, 2018; pp. 289–304. [Google Scholar] [CrossRef]
- Wang, Y.; Jiang, X.; Cao, R.; Wang, X. Robust indoor human activity recognition using wireless signals. Sensors 2015, 15, 17195–17208. [Google Scholar] [CrossRef] [PubMed] [Green Version]
- Wang, W.; Liu, A.X.; Shahzad, M.; Ling, K.; Lu, S. Device-Free Human Activity Recognition Using Commercial WiFi Devices. IEEE J. Sel. Areas Commun. 2017, 35, 1118–1131. [Google Scholar] [CrossRef]
- Jalal, A.; Kamal, S.; Kim, D. A depth video sensor-based life-logging human activity recognition system for elderly care in smart indoor environments. Sensors 2014, 14, 11735–11759. [Google Scholar] [CrossRef] [PubMed]
- Luo, Y.; Li, Y.; Foshey, M.; Shou, W.; Sharma, P.; Palacios, T.; Torralba, A.; Matusik, W. Intelligent Carpet: Inferring 3D Human Pose From Tactile Signals. In Proceedings of the IEEE/CVF Conference on Computer Vision and Pattern Recognition, Nashville, TN, USA, 19–25 June 2021; pp. 11255–11265. [Google Scholar]
- Casas, L.; Navab, N.; Demirci, S. Patient 3D body pose estimation from pressure imaging. Int. J. Comput. Assist. Radiol. Surg. 2019, 14, 517–524. [Google Scholar] [CrossRef]
- Attal, F.; Mohammed, S.; Dedabrishvili, M.; Chamroukhi, F.; Oukhellou, L.; Amirat, Y. Physical human activity recognition using wearable sensors. Sensors 2015, 15, 31314–31338. [Google Scholar] [CrossRef] [Green Version]
- Altun, K.; Barshan, B.; Tunçel, O. Comparative study on classifying human activities with miniature inertial and magnetic sensors. Pattern Recognit. 2010, 43, 3605–3620. [Google Scholar] [CrossRef]
- Jamieson, A.; Murray, L.; Stankovic, L.; Stankovic, V.; Buis, A. Human activity recognition of individuals with lower limb amputation in free-living conditions: A pilot study. Sensors 2021, 21, 8377. [Google Scholar] [CrossRef]
- Wei, W.; Kurita, K.; Kuang, J.; Gao, A. Real-time 3D arm motion tracking using the 6-axis IMU sensor of a smartwatch. In Proceedings of the 2021 IEEE 17th International Conference on Wearable and Implantable Body Sensor Networks (BSN), Athens, Greece, 27–30 July 2021; pp. 1–4. [Google Scholar] [CrossRef]
- Liu, S.; Zhang, J.; Zhang, Y.; Zhu, R. A wearable motion capture device able to detect dynamic motion of human limbs. Nat. Commun. 2020, 11, 1–12. [Google Scholar] [CrossRef]
- Lim, X.Y.; Gan, K.B.; Abd Aziz, N.A. Deep ConvLSTM Network with Dataset Resampling for Upper Body Activity Recognition Using Minimal Number of IMU Sensors. Appl. Sci. 2021, 11, 3543. [Google Scholar] [CrossRef]
- Amini, N.; Sarrafzadeh, M.; Vahdatpour, A.; Xu, W. Accelerometer-based on-body sensor localization for health and medical monitoring applications. Pervasive Mob. Comput. 2011, 7, 746–760. [Google Scholar] [CrossRef] [Green Version]
- Caramia, C.; Torricelli, D.; Schmid, M.; Munoz-Gonzalez, A.; Gonzalez-Vargas, J.; Grandas, F.; Pons, J.L. IMU-based classification of Parkinson’s disease from gait: A sensitivity analysis on sensor location and feature selection. IEEE J. Biomed. Health Inform. 2018, 22, 1765–1774. [Google Scholar] [CrossRef] [PubMed]
- Sundholm, M.; Cheng, J.; Zhou, B.; Sethi, A.; Lukowicz, P. Smart-mat: Recognizing and counting gym exercises with low-cost resistive pressure sensing matrix. In Proceedings of the 2014 ACM International Joint Conference on Pervasive and Ubiquitous Computing; Seattle, WA, USA, 13–17 September 2014, ACM: Seattle, WA, USA, 2014; pp. 373–382. [Google Scholar] [CrossRef]
- Parzer, P.; Sharma, A.; Vogl, A.; Steimle, J.; Olwal, A.; Haller, M. SmartSleeve: Real-time sensing of surface and deformation gestures on flexible, interactive textiles, using a hybrid gesture detection pipeline. In Proceedings of the 30th Annual ACM Symposium on User Interface Software and Technology; Quebec City, QC, Canada, 22–25 October 2017, Association for Computing Machinery: New York, NY, USA, 2017; pp. 565–577. [Google Scholar] [CrossRef] [Green Version]
- Inaba, M.; Hoshino, Y.; Nagasaka, K.; Ninomiya, T.; Kagami, S.; Inoue, H. A full-body tactile sensor suit using electrically conductive fabric and strings. Proceedings of IEEE/RSJ International Conference on Intelligent Robots and Systems. IROS’96, Osaka, Japan, 8 November 1996; Volume 2, pp. 450–457. [Google Scholar] [CrossRef]
- Vega-Barbas, M.; Pau, I.; Ferreira, J.; Lebis, E.; Seoane, F. Utilizing smart textiles-enabled sensorized toy and playful interactions for assessment of psychomotor development on children. J. Sens. 2015, 2015, 898047. [Google Scholar] [CrossRef]
- Xu, W.; Huang, M.C.; Amini, N.; He, L.; Sarrafzadeh, M. Ecushion: A textile pressure sensor array design and calibration for sitting posture analysis. IEEE Sens. J. 2013, 13, 3926–3934. [Google Scholar] [CrossRef]
- Pouyan, M.B.; Birjandtalab, J.; Heydarzadeh, M.; Nourani, M.; Ostadabbas, S. A pressure map dataset for posture and subject analytics. In Proceedings of the 2017 IEEE EMBS International Conference on Biomedical & Health Informatics (BHI), Orlando, FL, USA, 16–19 February 2017; pp. 65–68. [Google Scholar] [CrossRef]
- Liu, J.J.; Xu, W.; Huang, M.C.; Alshurafa, N.; Sarrafzadeh, M.; Raut, N.; Yadegar, B. A dense pressure sensitive bedsheet design for unobtrusive sleep posture monitoring. In Proceedings of the 2013 IEEE International Conference on Pervasive Computing and Communications (PerCom), San Diego, CA, USA, 18–22 March 2013; pp. 207–215. [Google Scholar] [CrossRef]
- Liu, R.; Shao, Q.; Wang, S.; Ru, C.; Balkcom, D.; Zhou, X. Reconstructing human joint motion with computational fabrics. Proc. ACM Interact. Mob. Wearable Ubiquitous Technol. 2019, 3, 1–26. [Google Scholar] [CrossRef]
- Voit, A.; Pfähler, F.; Schneegass, S. Posture sleeve: Using smart textiles for public display interactions. In Proceedings of the 2018 CHI Conference on Human Factors in Computing Systems; Montreal, QC, Canada, 21–26 April 2018, ACM: Montreal, QC, Canada, 2018; pp. 1–6. [Google Scholar] [CrossRef]
- Poupyrev, I.; Gong, N.W.; Fukuhara, S.; Karagozler, M.E.; Schwesig, C.; Robinson, K.E. Project Jacquard: Interactive digital textiles at scale. In Proceedings of the 2016 CHI Conference on Human Factors in Computing Systems; San Jose, CA, USA, 7–12 May 2016, ACM: San Jose, CA, USA, 2016; pp. 4216–4227. [Google Scholar] [CrossRef] [Green Version]
- Wu, T.Y.; Xu, Z.; Yang, X.D.; Hodges, S.; Seyed, T. Project Tasca: Enabling Touch and Contextual Interactions with a Pocket-based Textile Sensor. In Proceedings of the 2021 CHI Conference on Human Factors in Computing Systems; Yokohama, Japan, 8–13 May 2021, ACM: Yokohama, Japan, 2021; pp. 1–13. [Google Scholar] [CrossRef]
- Parzer, P.; Probst, K.; Babic, T.; Rendl, C.; Vogl, A.; Olwal, A.; Haller, M. FlexTiles: A flexible, stretchable, formable, pressure-sensitive, tactile input sensor. In Proceedings of the 2016 CHI Conference Extended Abstracts on Human Factors in Computing Systems; San Jose, CA, USA, 7–12 May 2016, ACM: San Jose, CA, USA, 2016; pp. 3754–3757. [Google Scholar] [CrossRef]
- Leong, J.; Parzer, P.; Perteneder, F.; Babic, T.; Rendl, C.; Vogl, A.; Egger, H.; Olwal, A.; Haller, M. proCover: Sensory augmentation of prosthetic limbs using smart textile covers. In Proceedings of the 29th Annual Symposium on User Interface Software and Technology; Tokyo, Japan, 16–19 October 2016, ACM: Tokyo, Japan, 2016; pp. 335–346. [Google Scholar] [CrossRef]
- Zhou, B.; Cheng, J.; Sundholm, M.; Lukowicz, P. From smart clothing to smart table cloth: Design and implementation of a large scale, textile pressure matrix sensor. In Proceedings of the International Conference on Architecture of Computing Systems; Lübeck, Germany, 25–28 February 2014, Springer International Publishing: Cham, Switzerland, 2014; pp. 159–170. [Google Scholar]
- Guo, T.; Huang, Z.; Cheng, J. LwTool: A data processing toolkit for building a real-time pressure mapping smart textile software system. Pervasive Mob. Comput. 2022, 80, 101540. [Google Scholar] [CrossRef]
- Zhou, B.; Lukowicz, P. TPM Feature Set: A Universal Algorithm for Spatial-Temporal Pressure Mapping Imagery Data. In Proceedings of the International Conference on Mobile Ubiquitous Computing, Services and Technologies (UBICOMM-2019), Porto, Portugal, 22–26 September 2019. [Google Scholar]
- Zhou, B.; Cheng, J.; Mawandia, A.; He, Y.; Huang, Z.; Sundholm, M.; Yildrim, M.; Cruz, H.; Lukowicz, P. TPM Framework: A Comprehensive Kit for Exploring Applications with Textile Pressure Mapping Matrix. 2017. Available online: https://www.researchgate.net/profile/Ankur-Mawandia/publication/321723681_TPM_Framework_a_Comprehensive_Kit_for_Exploring_Applicationswith_Textile_Pressure_Mapping_Matrix/links/5a2e6025a6fdccfbbf89bcc2/TPM-Framework-a-Comprehensive-Kit-for-Exploring-Applicationswith-Textile-Pressure-Mapping-Matrix.pdf (accessed on 11 December 2017).
- Cheng, J.; Sundholm, M.; Zhou, B.; Hirsch, M.; Lukowicz, P. Smart-surface: Large scale textile pressure sensors arrays for activity recognition. Pervasive Mob. Comput. 2016, 30, 97–112. [Google Scholar] [CrossRef]
- Hu, M.K. Visual pattern recognition by moment invariants. IRE Trans. Inf. Theory 1962, 8, 179–187. [Google Scholar] [CrossRef] [Green Version]
- Pedregosa, F.; Varoquaux, G.; Gramfort, A.; Michel, V.; Thirion, B.; Grisel, O.; Blondel, M.; Prettenhofer, P.; Weiss, R.; Dubourg, V.; et al. Scikit-learn: Machine Learning in Python. J. Mach. Learn. Res. 2011, 12, 2825–2830. [Google Scholar]
- Paszke, A.; Gross, S.; Massa, F.; Lerer, A.; Bradbury, J.; Chanan, G.; Killeen, T.; Lin, Z.; Gimelshein, N.; Antiga, L.; et al. Pytorch: An imperative style, high-performance deep learning library. Adv. Neural Inf. Process. Syst. 2019, 32, 8026–8037. [Google Scholar]
- Özdemir, A.T.; Barshan, B. Detecting falls with wearable sensors using machine learning techniques. Sensors 2014, 14, 10691–10708. [Google Scholar] [CrossRef] [PubMed]
- Yang, Y. An evaluation of statistical approaches to text categorization. Inf. Retr. 1999, 1, 69–90. [Google Scholar] [CrossRef]
- Jain, A.; Nandakumar, K.; Ross, A. Score normalization in multimodal biometric systems. Pattern Recognit. 2005, 38, 2270–2285. [Google Scholar] [CrossRef]


| Category | Reference | Sensor | Number of Activities | Number of Participants | Classification Technique | Best Accuracy |
|---|---|---|---|---|---|---|
| Environmental | Khan et al., 2022 [4] | vision sensor (Kinect V2) | 12 | 20 | Hybrid Deep Learning Model | 91% |
| Wang et al., 2017 [7] | commercial WiFi device | 8 | 25 | Hidden Markov Model | 96% | |
| Sundholm et al., 2014 [19] | textile pressure sensor | 10 | 7 | K-nearest Neighbor | 90% | |
| Wearable | Pirsiavash et al., 2012 [3] | GoPro camera | 18 | 20 | Support Vector Machine | 77% |
| Jamieson et al., 2021 [13] | accelerometer (ActivPAL) | 5 | 12 | Support Vector Machine and Long-Short Term Memory | 77% | |
| Altun et al., 2010 [12] | miniature inertial sensor and magnetometer | 19 | 8 | 7 kinds of classification techniques 1 | 99% | |
| Lim et al., 2021 [16] | accelerometer, gyroscope, magnetometer, object, and ambient sensor | 18 | 4 | Deep ConvLSTM | 91% | |
| Parzer et al., 2017 [20] | textile pressure sensor | 9 | 6 | Support Vector Machine | 92% |
| Sensor | Advantages | Disadvantages |
|---|---|---|
| vision sensors | intuitive | high cost, complex setup and susceptibility to lighting condition and occlusion |
| wireless devices | device-free and larger coverage | vulnerable to interference from other electromagnetic devices |
| inertial measurement unit | wearable and motion-related | drift and instability |
| textile pressure sensors | wearable, contact-related, deformable and stretchable | non-waterproof and instability |
| Parameters | Mean (±Standard Deviation) | Minimum | Maximum |
|---|---|---|---|
| Age (years) | 23.2 (±2.0) | 21 | 28 |
| Height (cm) | 173.2 (±9.5) | 152 | 184 |
| Weight (kg) | 67.4 (±13.5) | 40 | 85 |
| Arm length (cm) | 51.9 (±3.4) | 47 | 59 |
| Forearm length (cm) | 25.5 (±1.8) | 23 | 28 |
| Biceps circumference (cm) | 29.0 (±4.7) | 21 | 38 |
| Classifiers | Parameters |
|---|---|
| SVM | kernel = poly |
| KNN | n_neighbors = 5 |
| LR | penalty = l2, max_iter = 8000, random_state = 40 |
| RF | class_weight = balanced, criterion = gini, max_features = log2, random_state = 40 |
| DT | random_state = 40 |
| NB | GaussianNB is used, with default parameters |
| Classifiers | Accuracy | |||
|---|---|---|---|---|
| 10-Fold | ||||
| SVM | 82.02 | 82.20 | 82.24 | 81.61 |
| KNN | 75.67 | 76.49 | 75.95 | 75.18 |
| LR | 76.55 | 76.33 | 77.00 | 75.95 |
| RF | 80.20 | 80.16 | 80.32 | 79.51 |
| DT | 61.79 | 62.01 | 62.19 | 61.19 |
| NB | 61.51 | 63.08 | 61.77 | 60.49 |
| CNN | 82.30 | 82.56 | 82.42 | 81.79 |
| LOSO | ||||
| SVM | 72.66 | 75.76 | 72.66 | 71.28 |
| KNN | 64.80 | 67.06 | 64.80 | 63.02 |
| LR | 70.16 | 72.64 | 70.16 | 68.24 |
| RF | 69.72 | 71.64 | 69.72 | 67.62 |
| DT | 51.90 | 52.88 | 51.90 | 49.93 |
| NB | 57.62 | 61.34 | 57.62 | 54.54 |
| CNN | 74.84 | 76.98 | 74.84 | 73.32 |
| Classifiers | with A 1 with B (10-Fold) | without A with B (10-Fold) | with A without B (10-Fold) | without A without B (10-Fold) | with A with B (LOSO) | without A with B (LOSO) | with A without B (LOSO) | without A without B (LOSO) |
|---|---|---|---|---|---|---|---|---|
| SVM | 82.02 | 78.61 | 74.72 | 69.52 | 72.66 | 69.56 | 66.55 | 62.42 |
| KNN | 75.47 | 75.12 | 70.40 | 65.12 | 64.80 | 63.81 | 58.37 | 54.37 |
| LR | 76.55 | 71.87 | 68.61 | 60.99 | 70.16 | 66.43 | 62.94 | 56.63 |
| RF | 80.20 | 78.25 | 75.87 | 73.41 | 69.72 | 67.70 | 65.60 | 60.16 |
| DT | 61.79 | 59.44 | 56.51 | 56.87 | 51.90 | 50.63 | 48.37 | 47.02 |
| NB | 61.51 | 59.37 | 50.83 | 46.55 | 57.62 | 55.20 | 46.94 | 42.86 |
Publisher’s Note: MDPI stays neutral with regard to jurisdictional claims in published maps and institutional affiliations. |
© 2022 by the authors. Licensee MDPI, Basel, Switzerland. This article is an open access article distributed under the terms and conditions of the Creative Commons Attribution (CC BY) license (https://creativecommons.org/licenses/by/4.0/).
Share and Cite
Xu, G.; Wan, Q.; Deng, W.; Guo, T.; Cheng, J. Smart-Sleeve: A Wearable Textile Pressure Sensor Array for Human Activity Recognition. Sensors 2022, 22, 1702. https://doi.org/10.3390/s22051702
Xu G, Wan Q, Deng W, Guo T, Cheng J. Smart-Sleeve: A Wearable Textile Pressure Sensor Array for Human Activity Recognition. Sensors. 2022; 22(5):1702. https://doi.org/10.3390/s22051702
Chicago/Turabian StyleXu, Guanghua, Quan Wan, Wenwu Deng, Tao Guo, and Jingyuan Cheng. 2022. "Smart-Sleeve: A Wearable Textile Pressure Sensor Array for Human Activity Recognition" Sensors 22, no. 5: 1702. https://doi.org/10.3390/s22051702
APA StyleXu, G., Wan, Q., Deng, W., Guo, T., & Cheng, J. (2022). Smart-Sleeve: A Wearable Textile Pressure Sensor Array for Human Activity Recognition. Sensors, 22(5), 1702. https://doi.org/10.3390/s22051702