
Deep Learning-Based Myoelectric Potential Estimation Method for Wheelchair Operation

 ,
, 
Abstract
:1. Introduction
2. Related Work
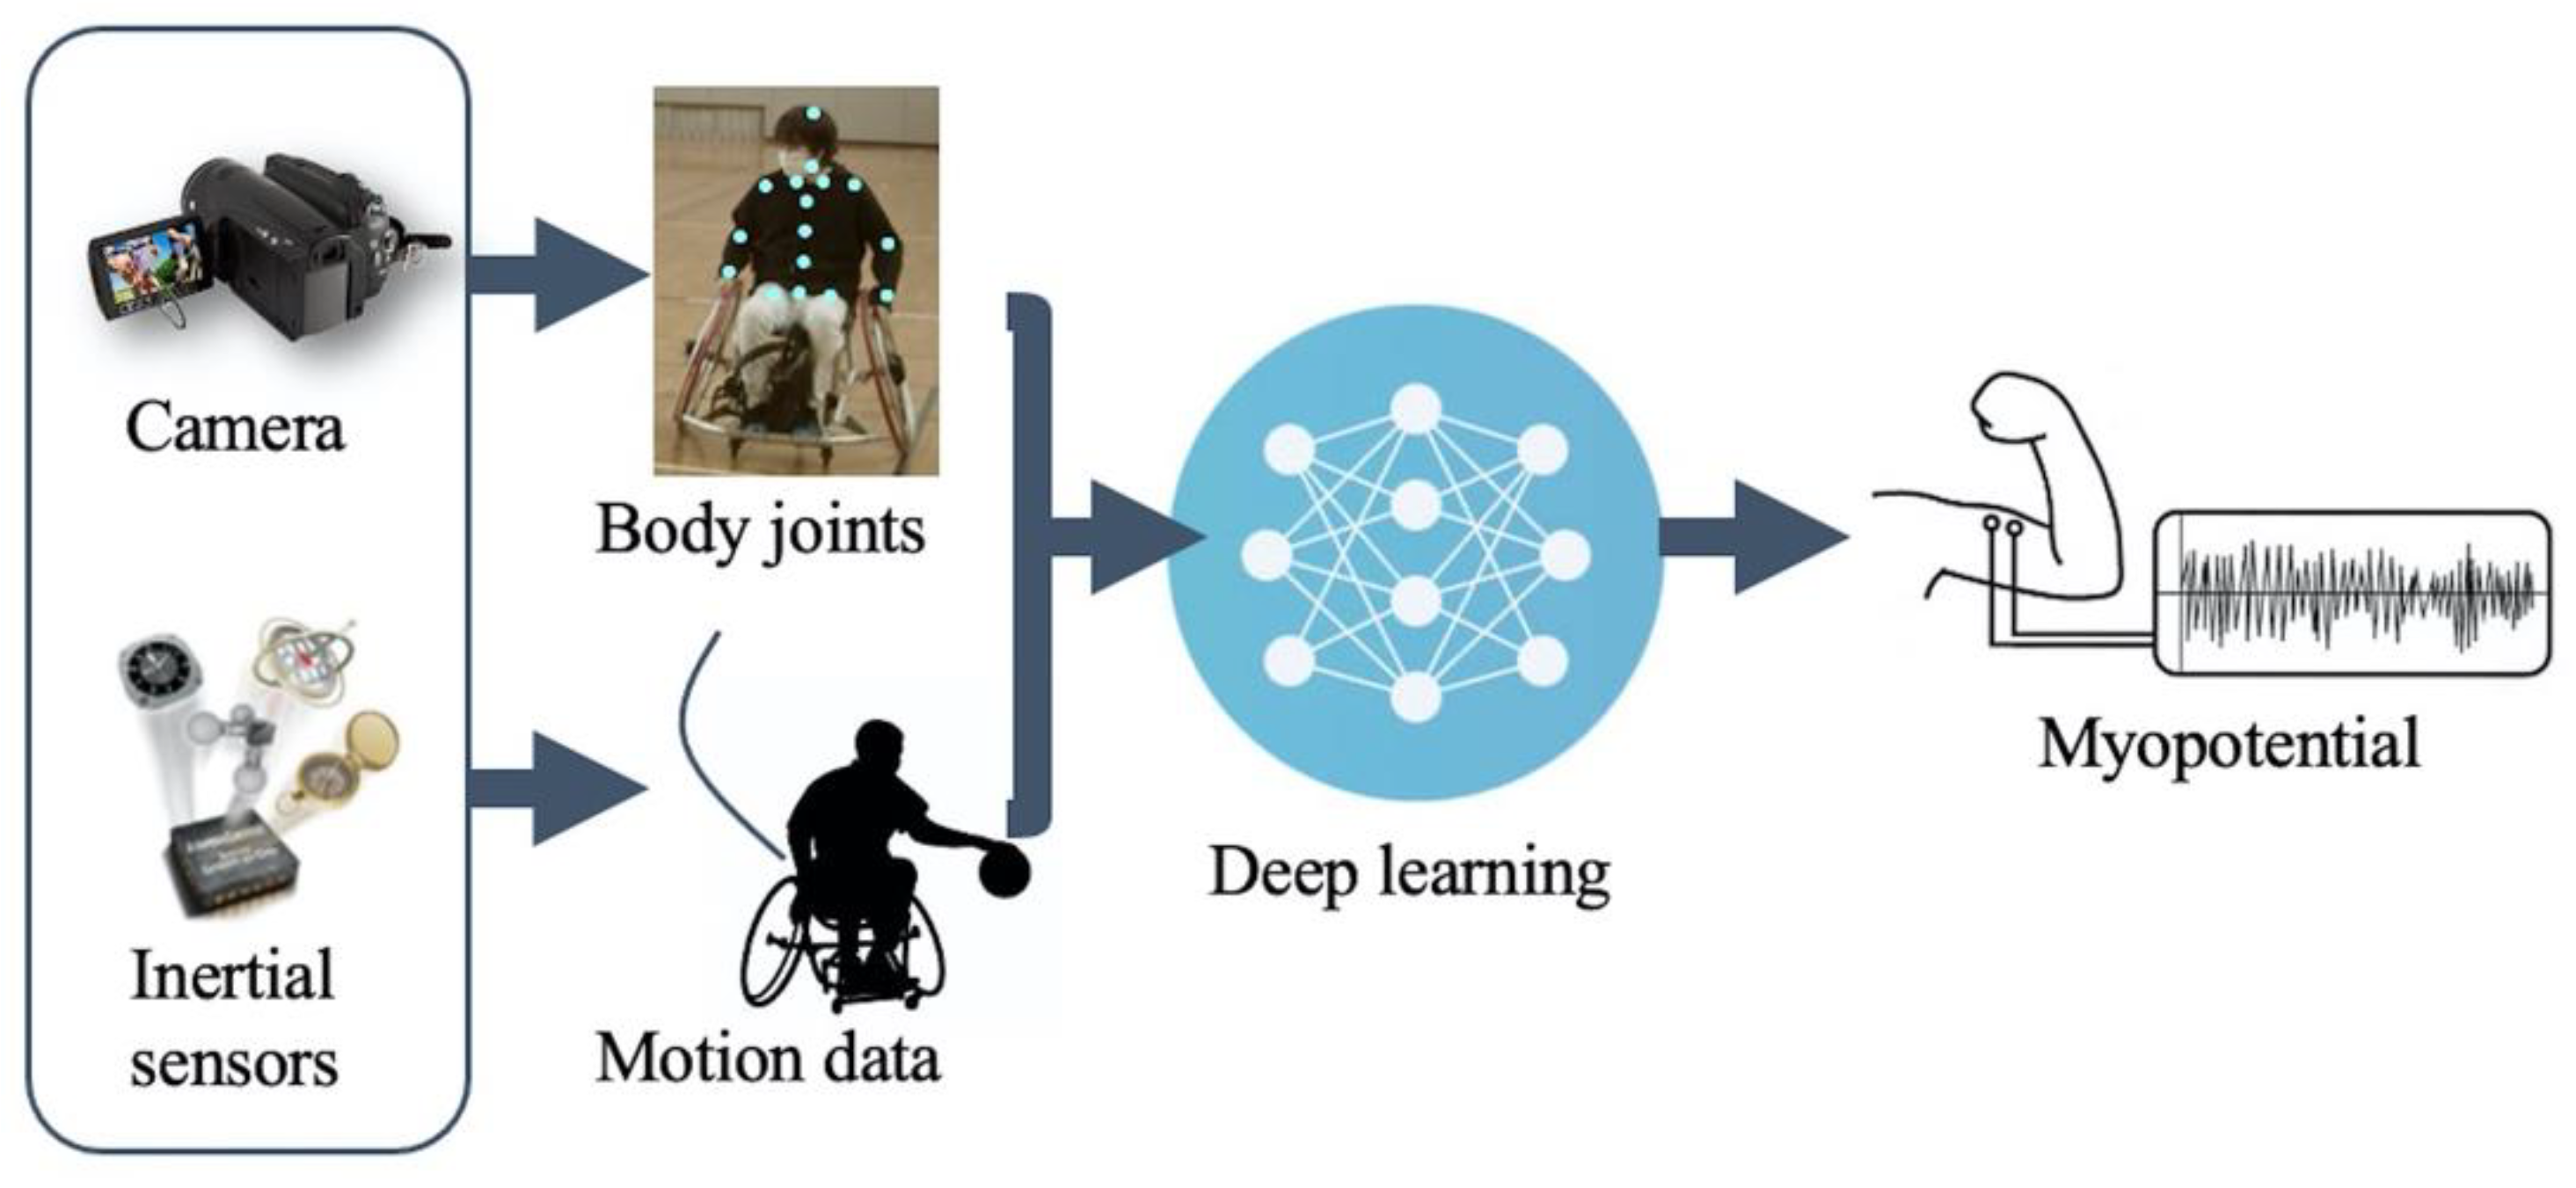
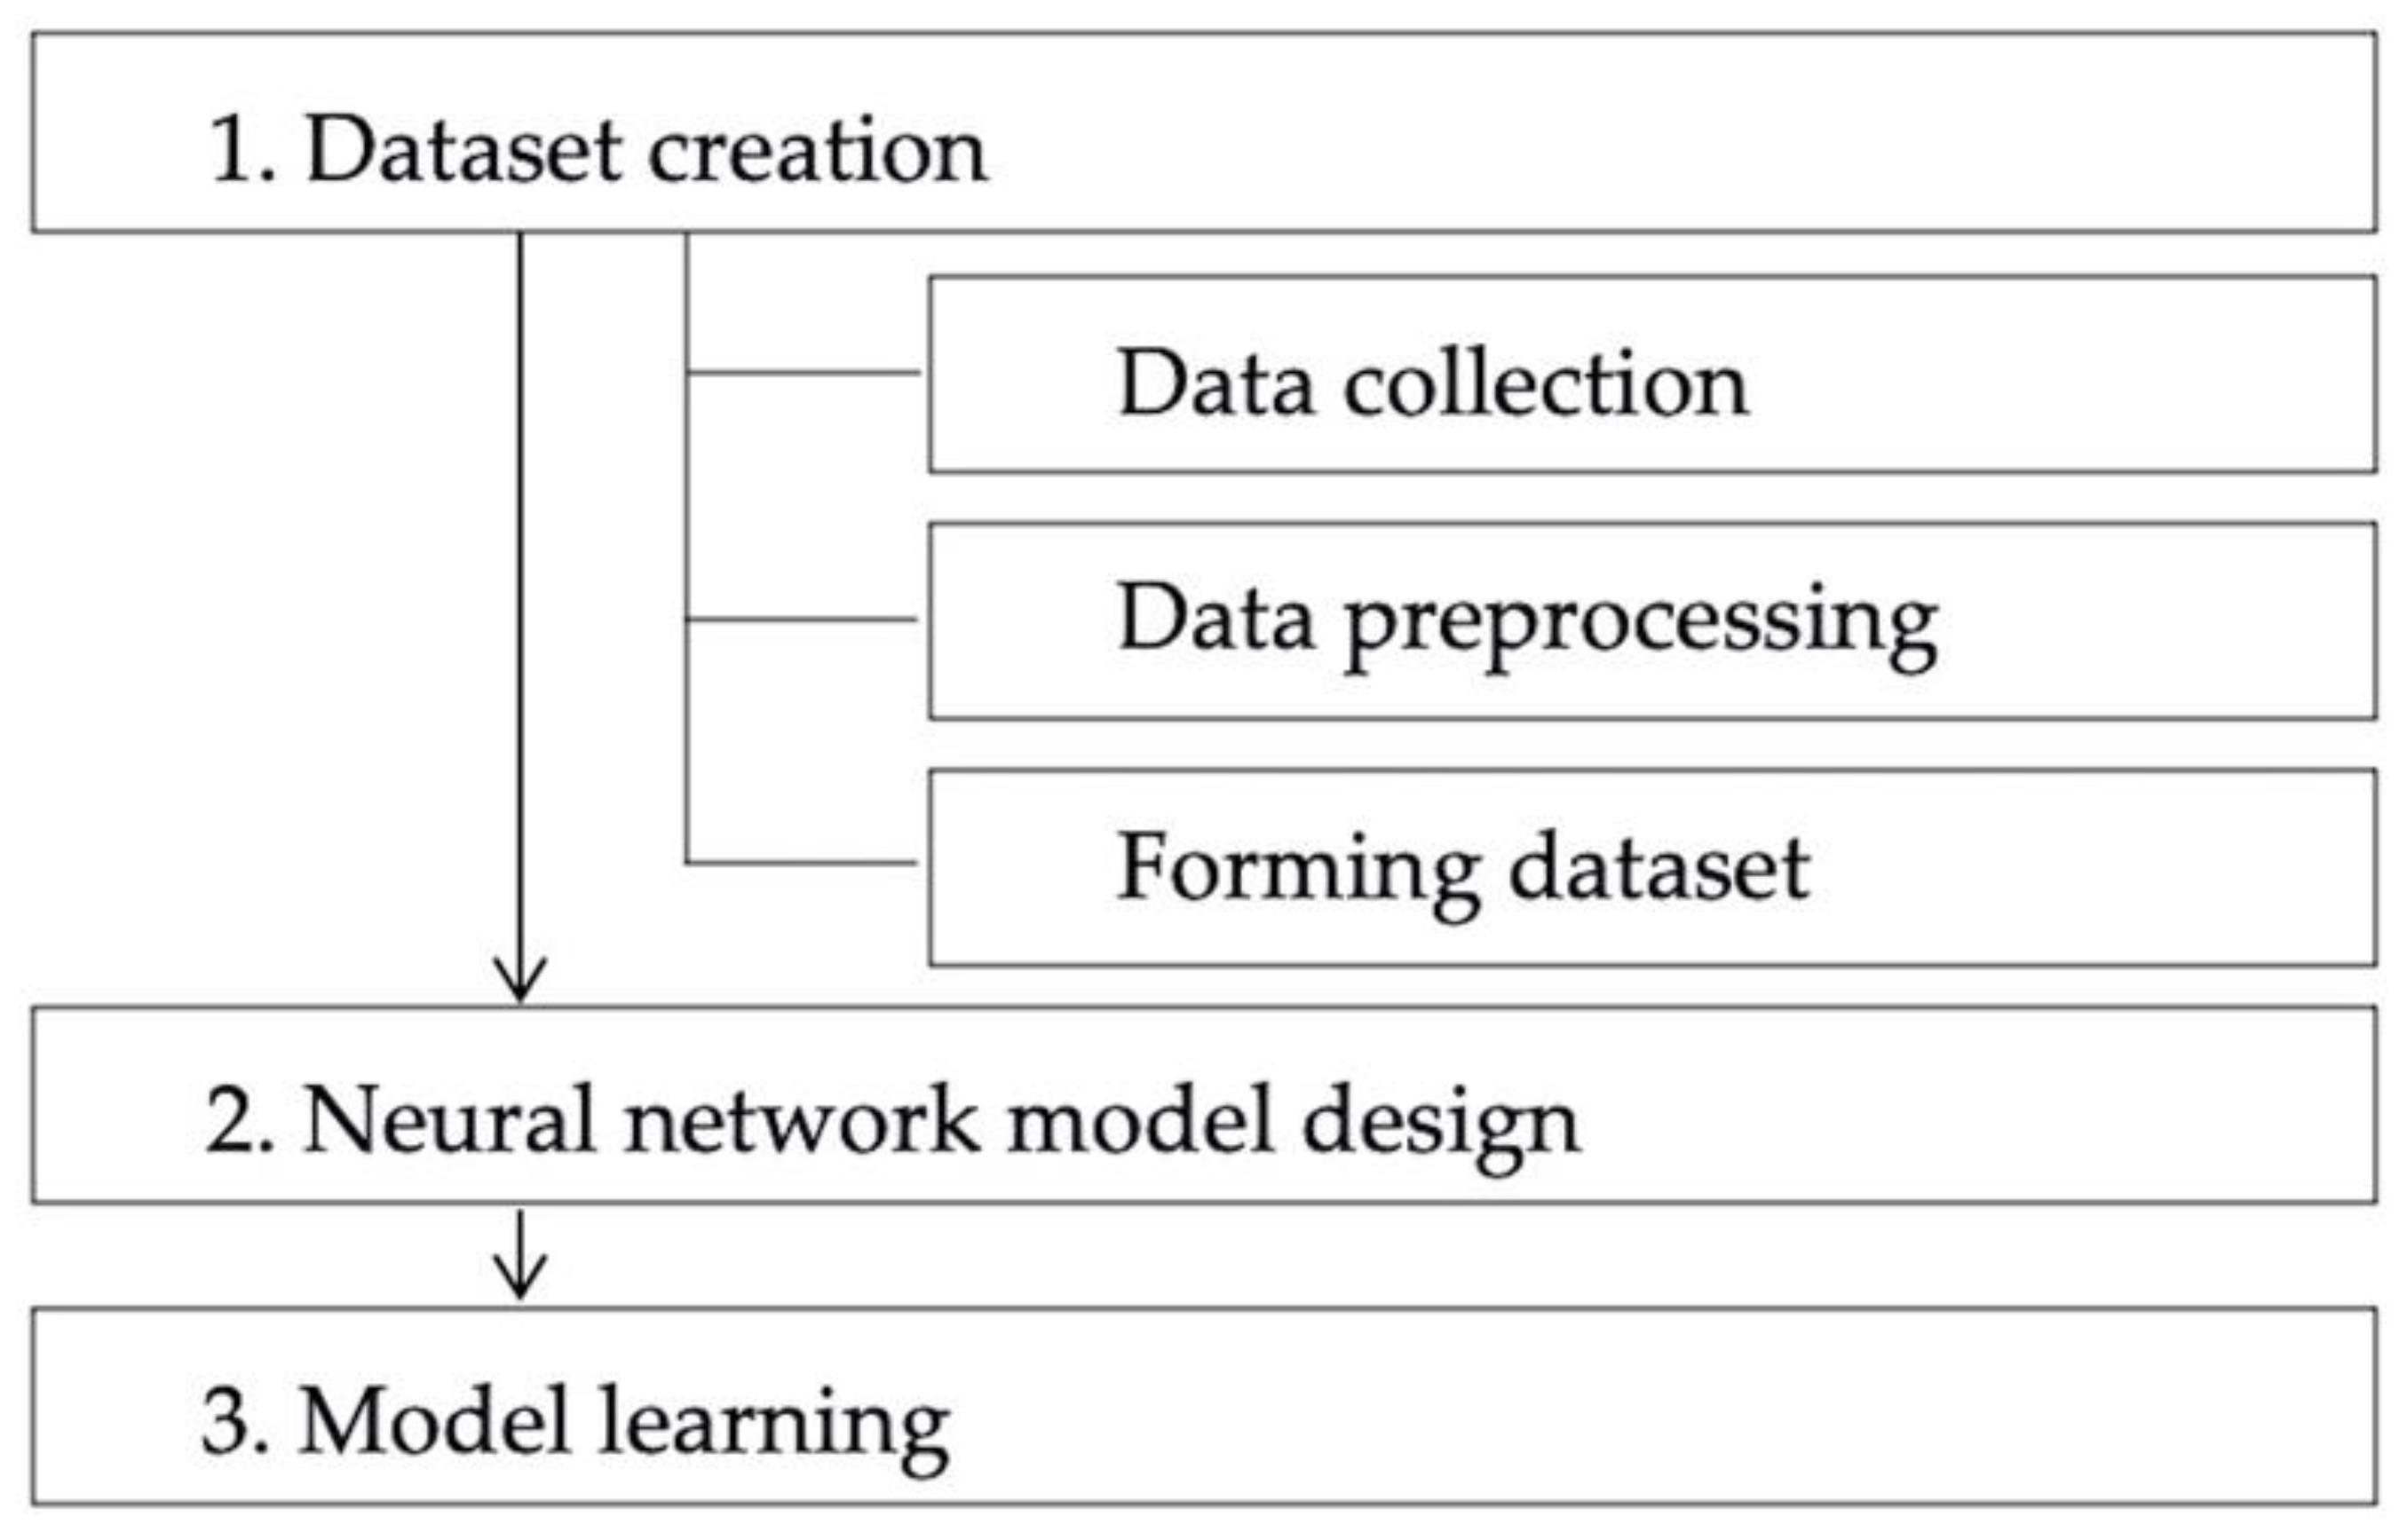
3. Proposed Method
3.1. Dataset Creation
3.1.1. Data Collection
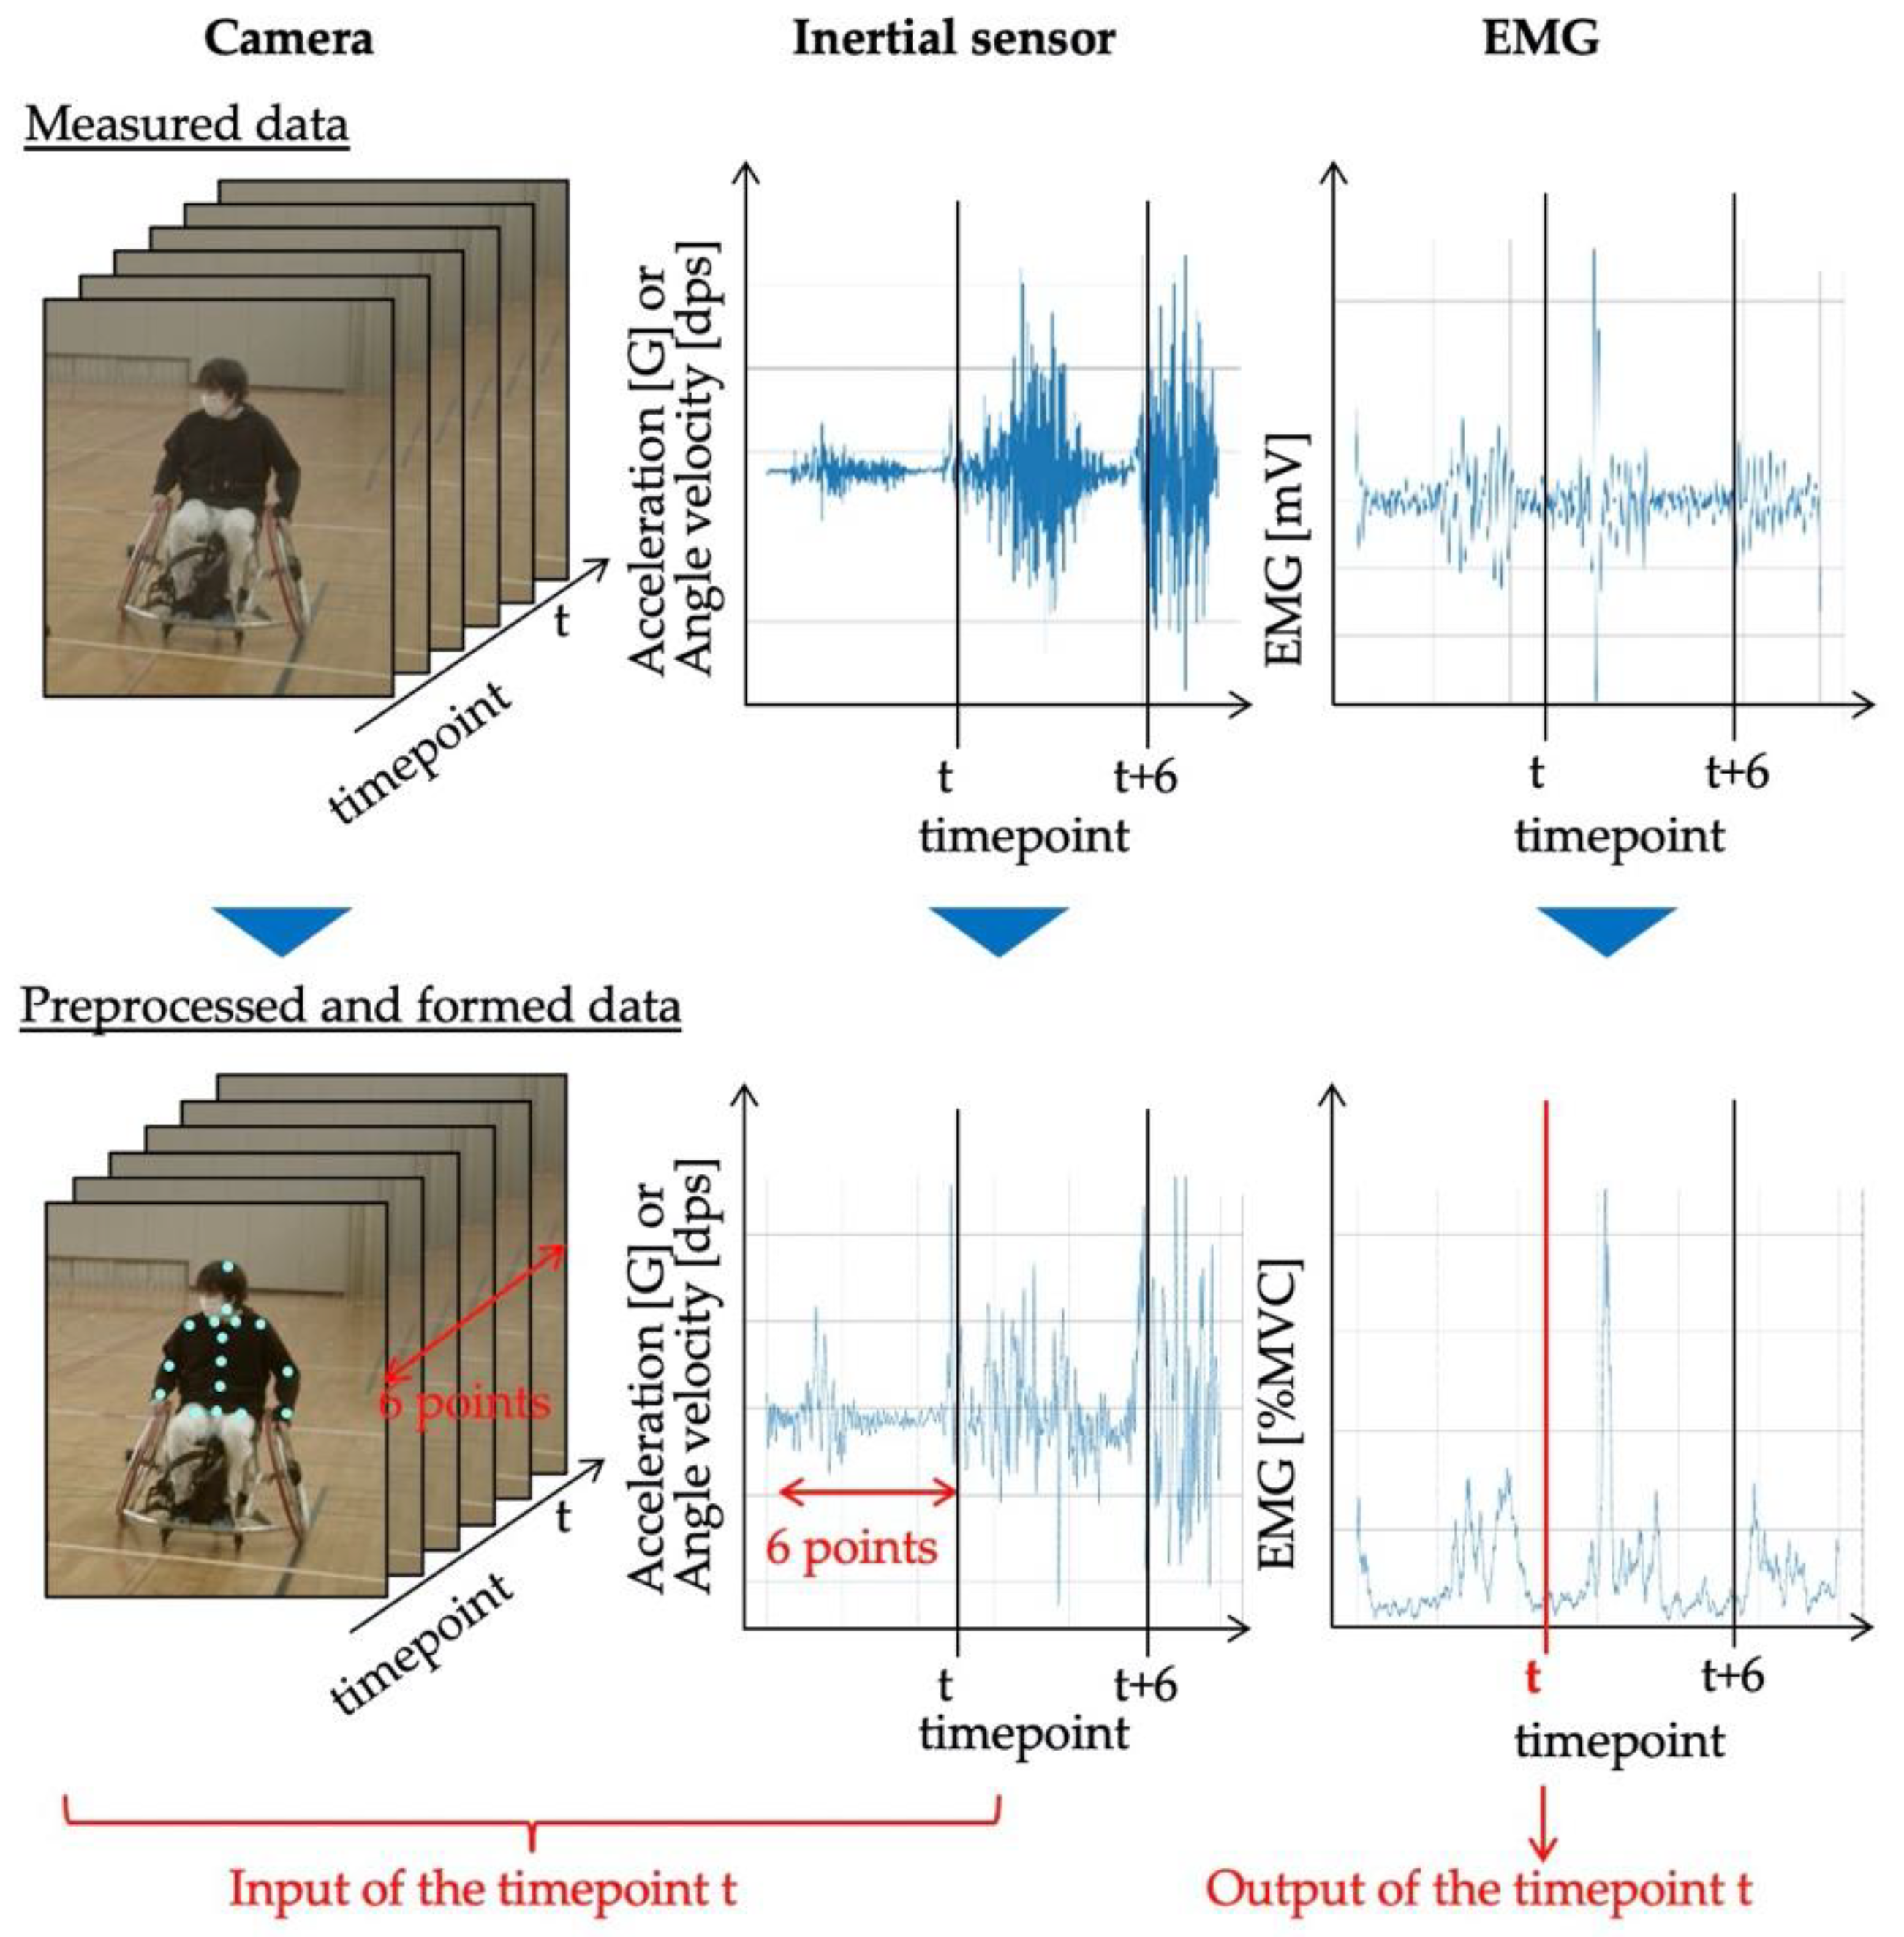
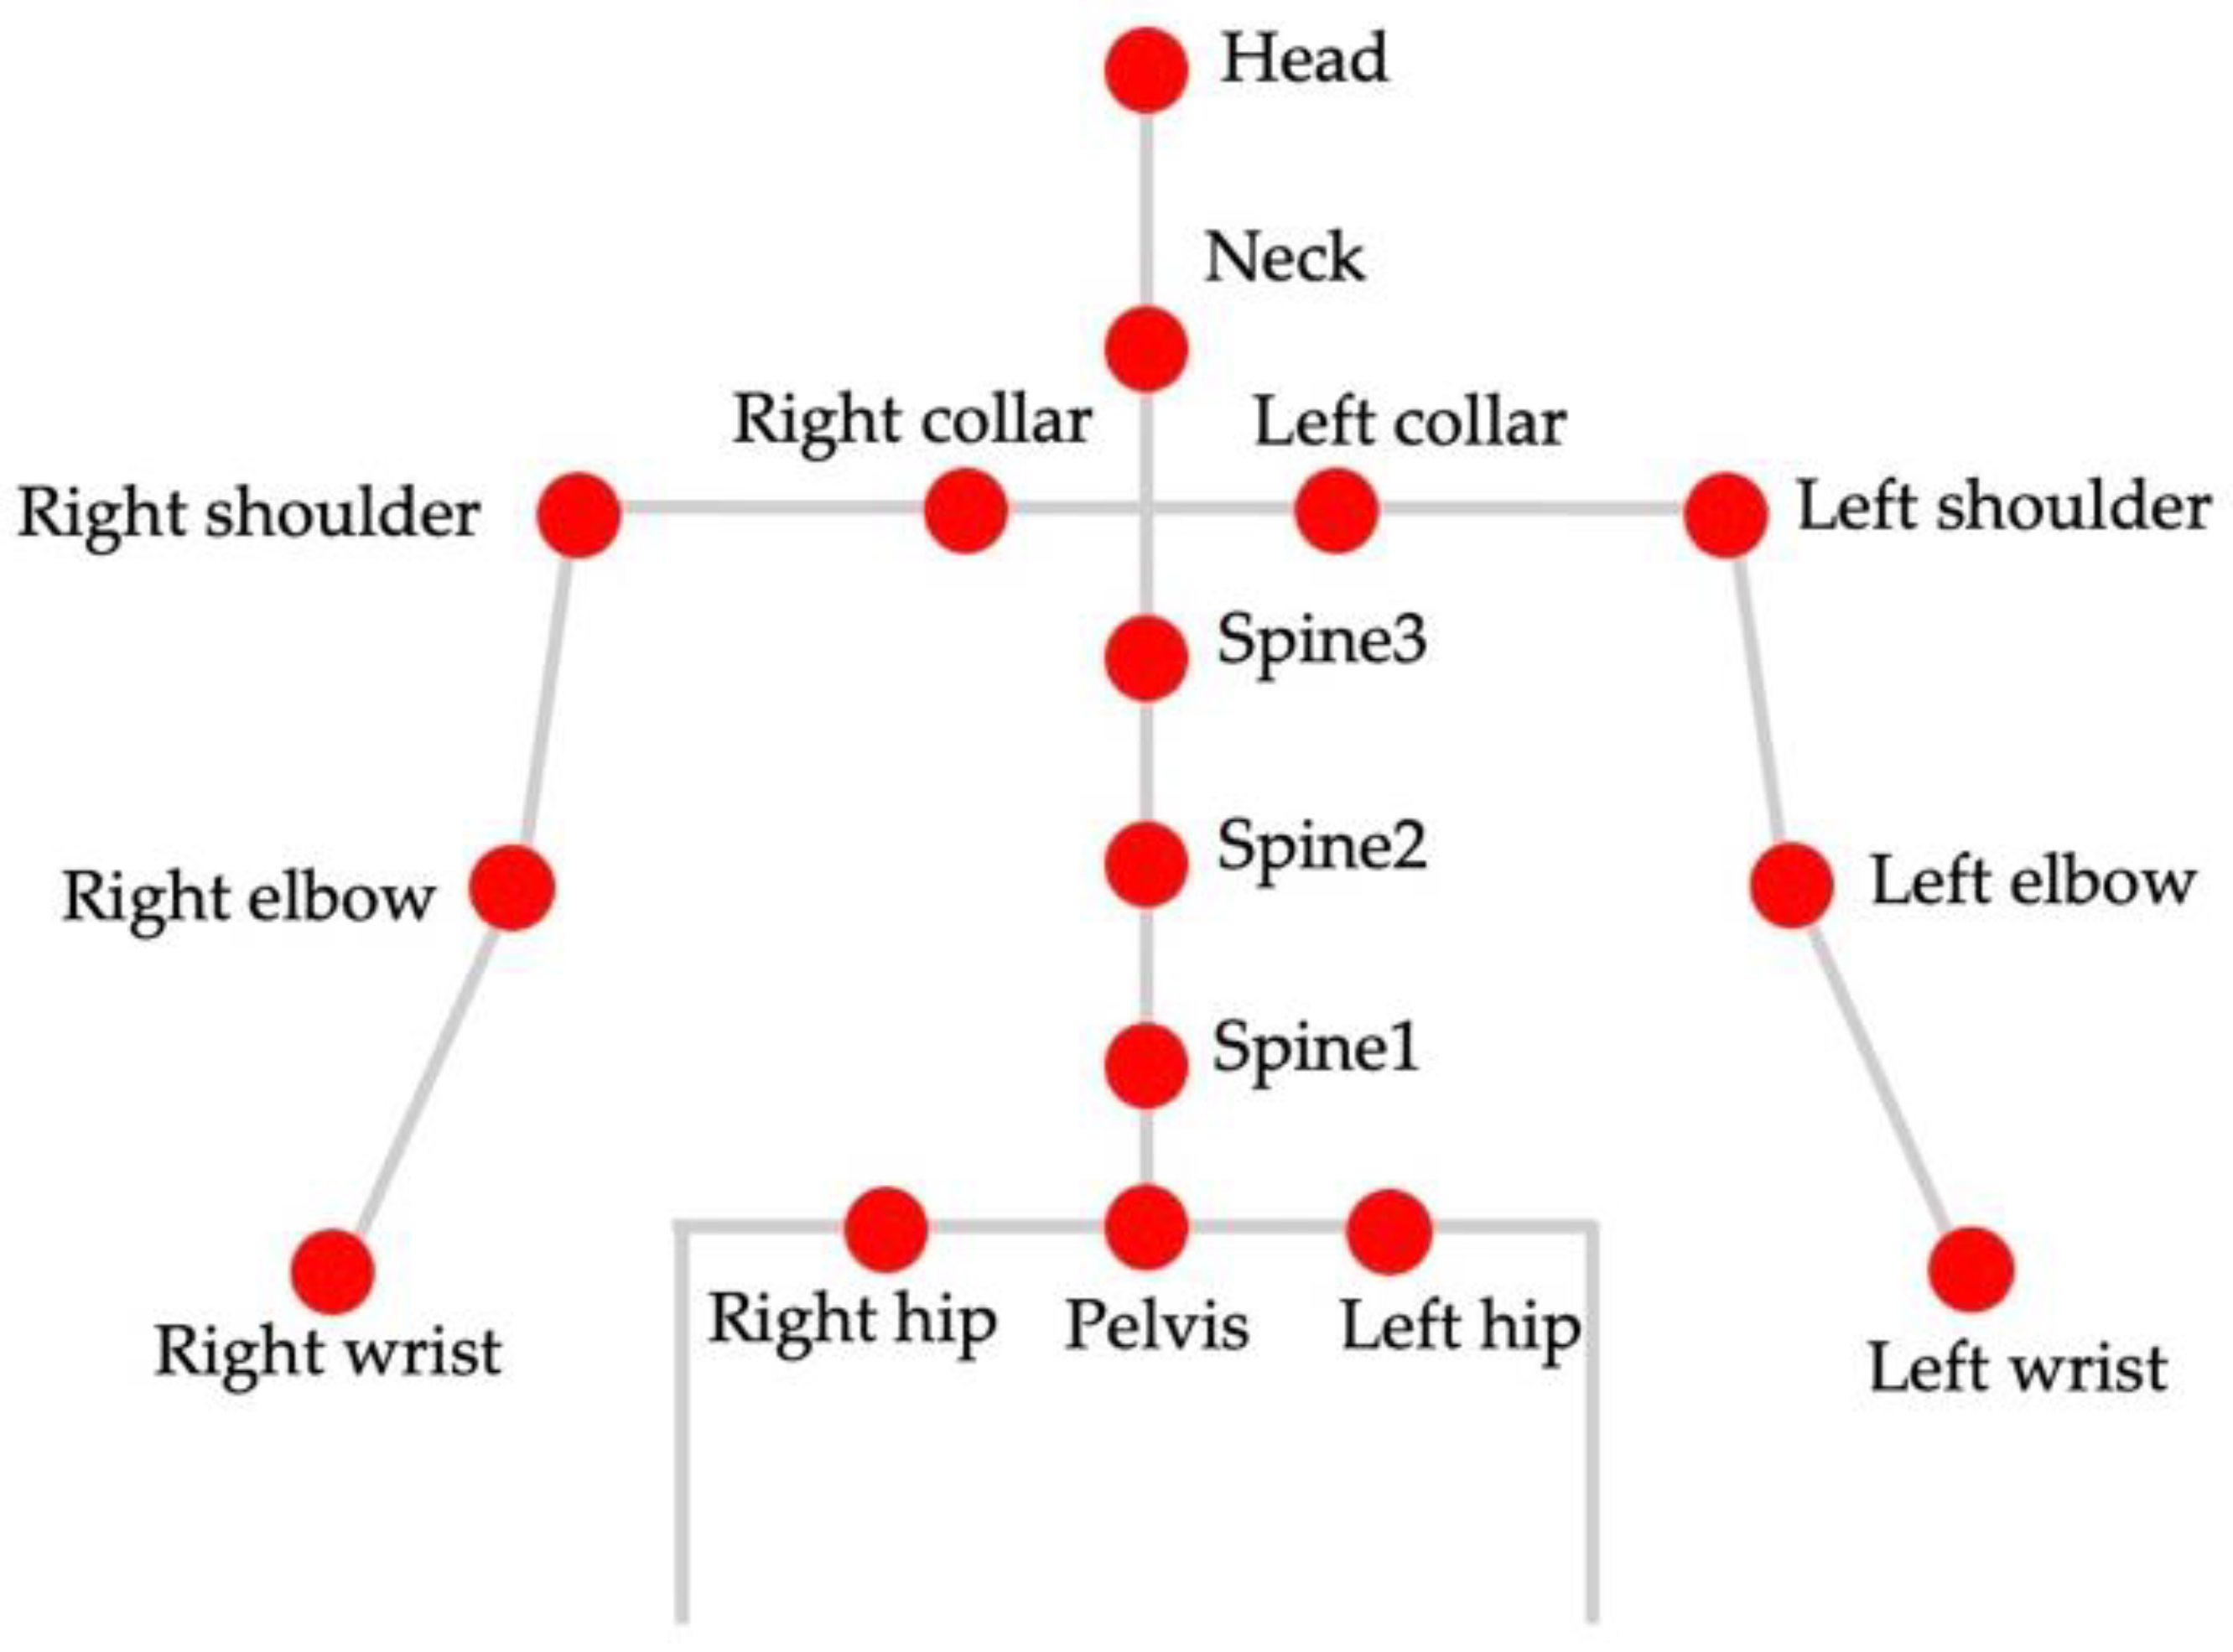
3.1.2. Data Preprocessing
3.1.3. Dataset Construction
3.2. Neural Network Model Design
3.3. Model Learning
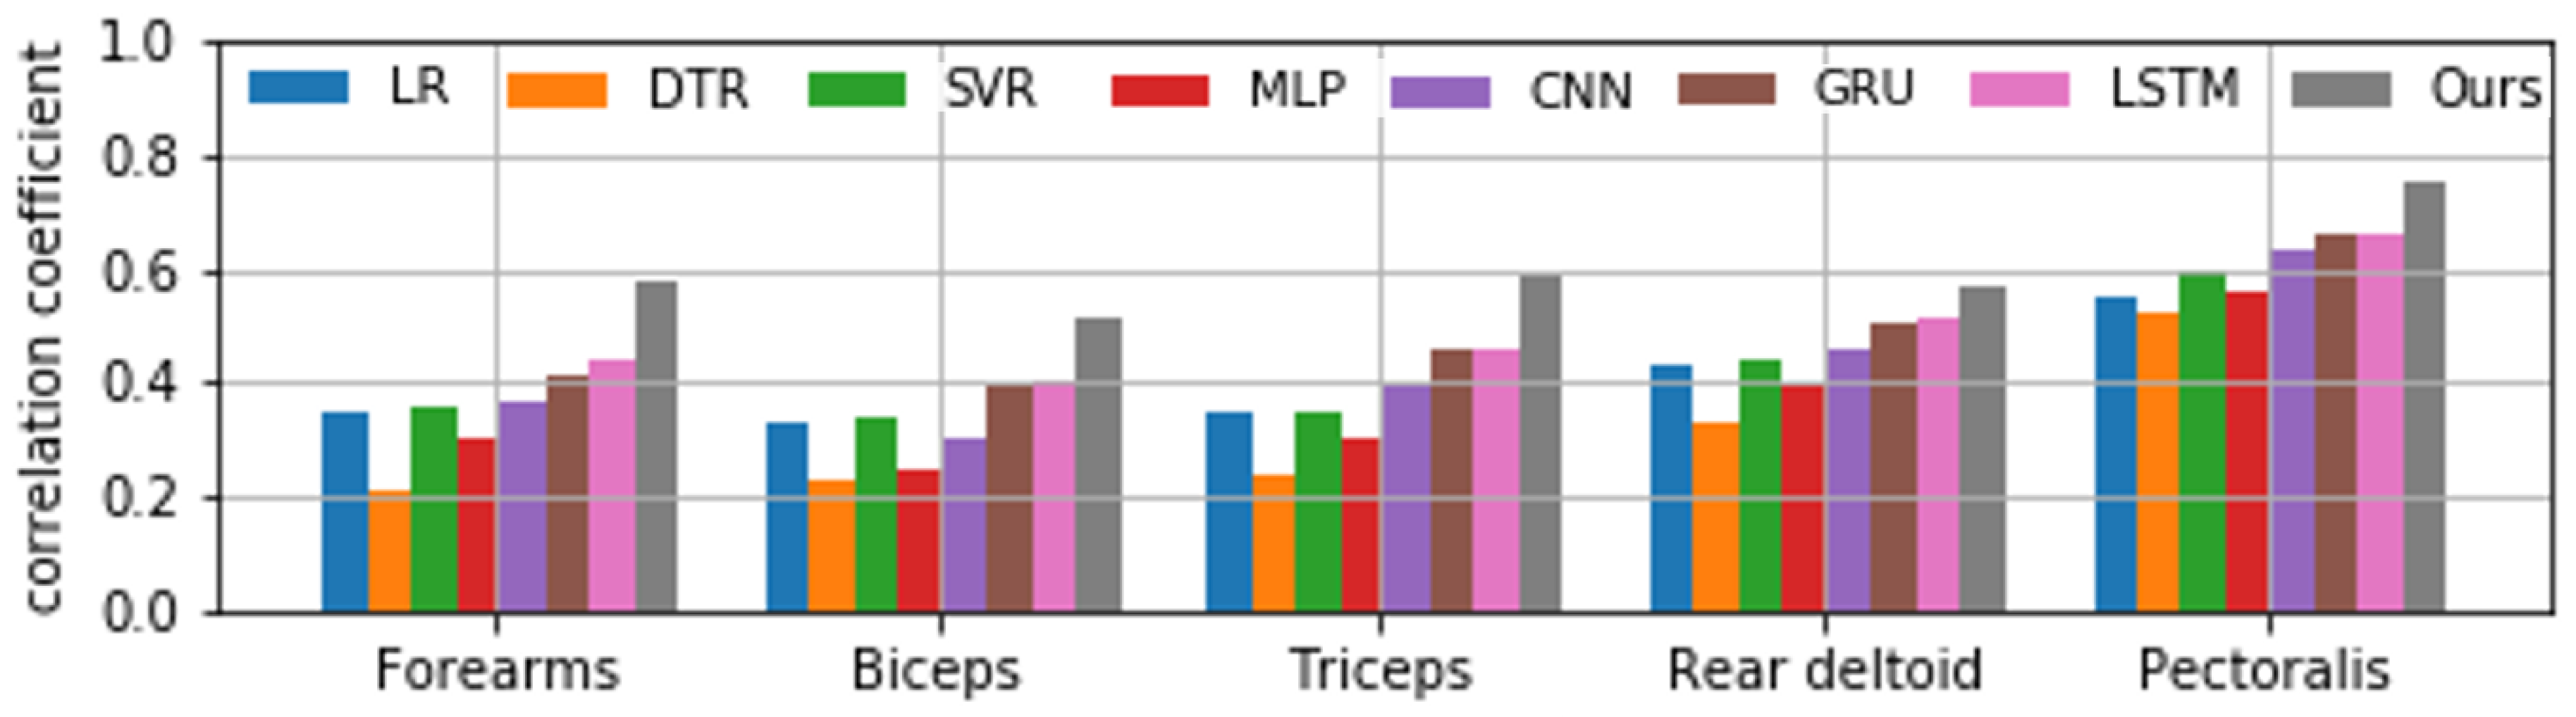
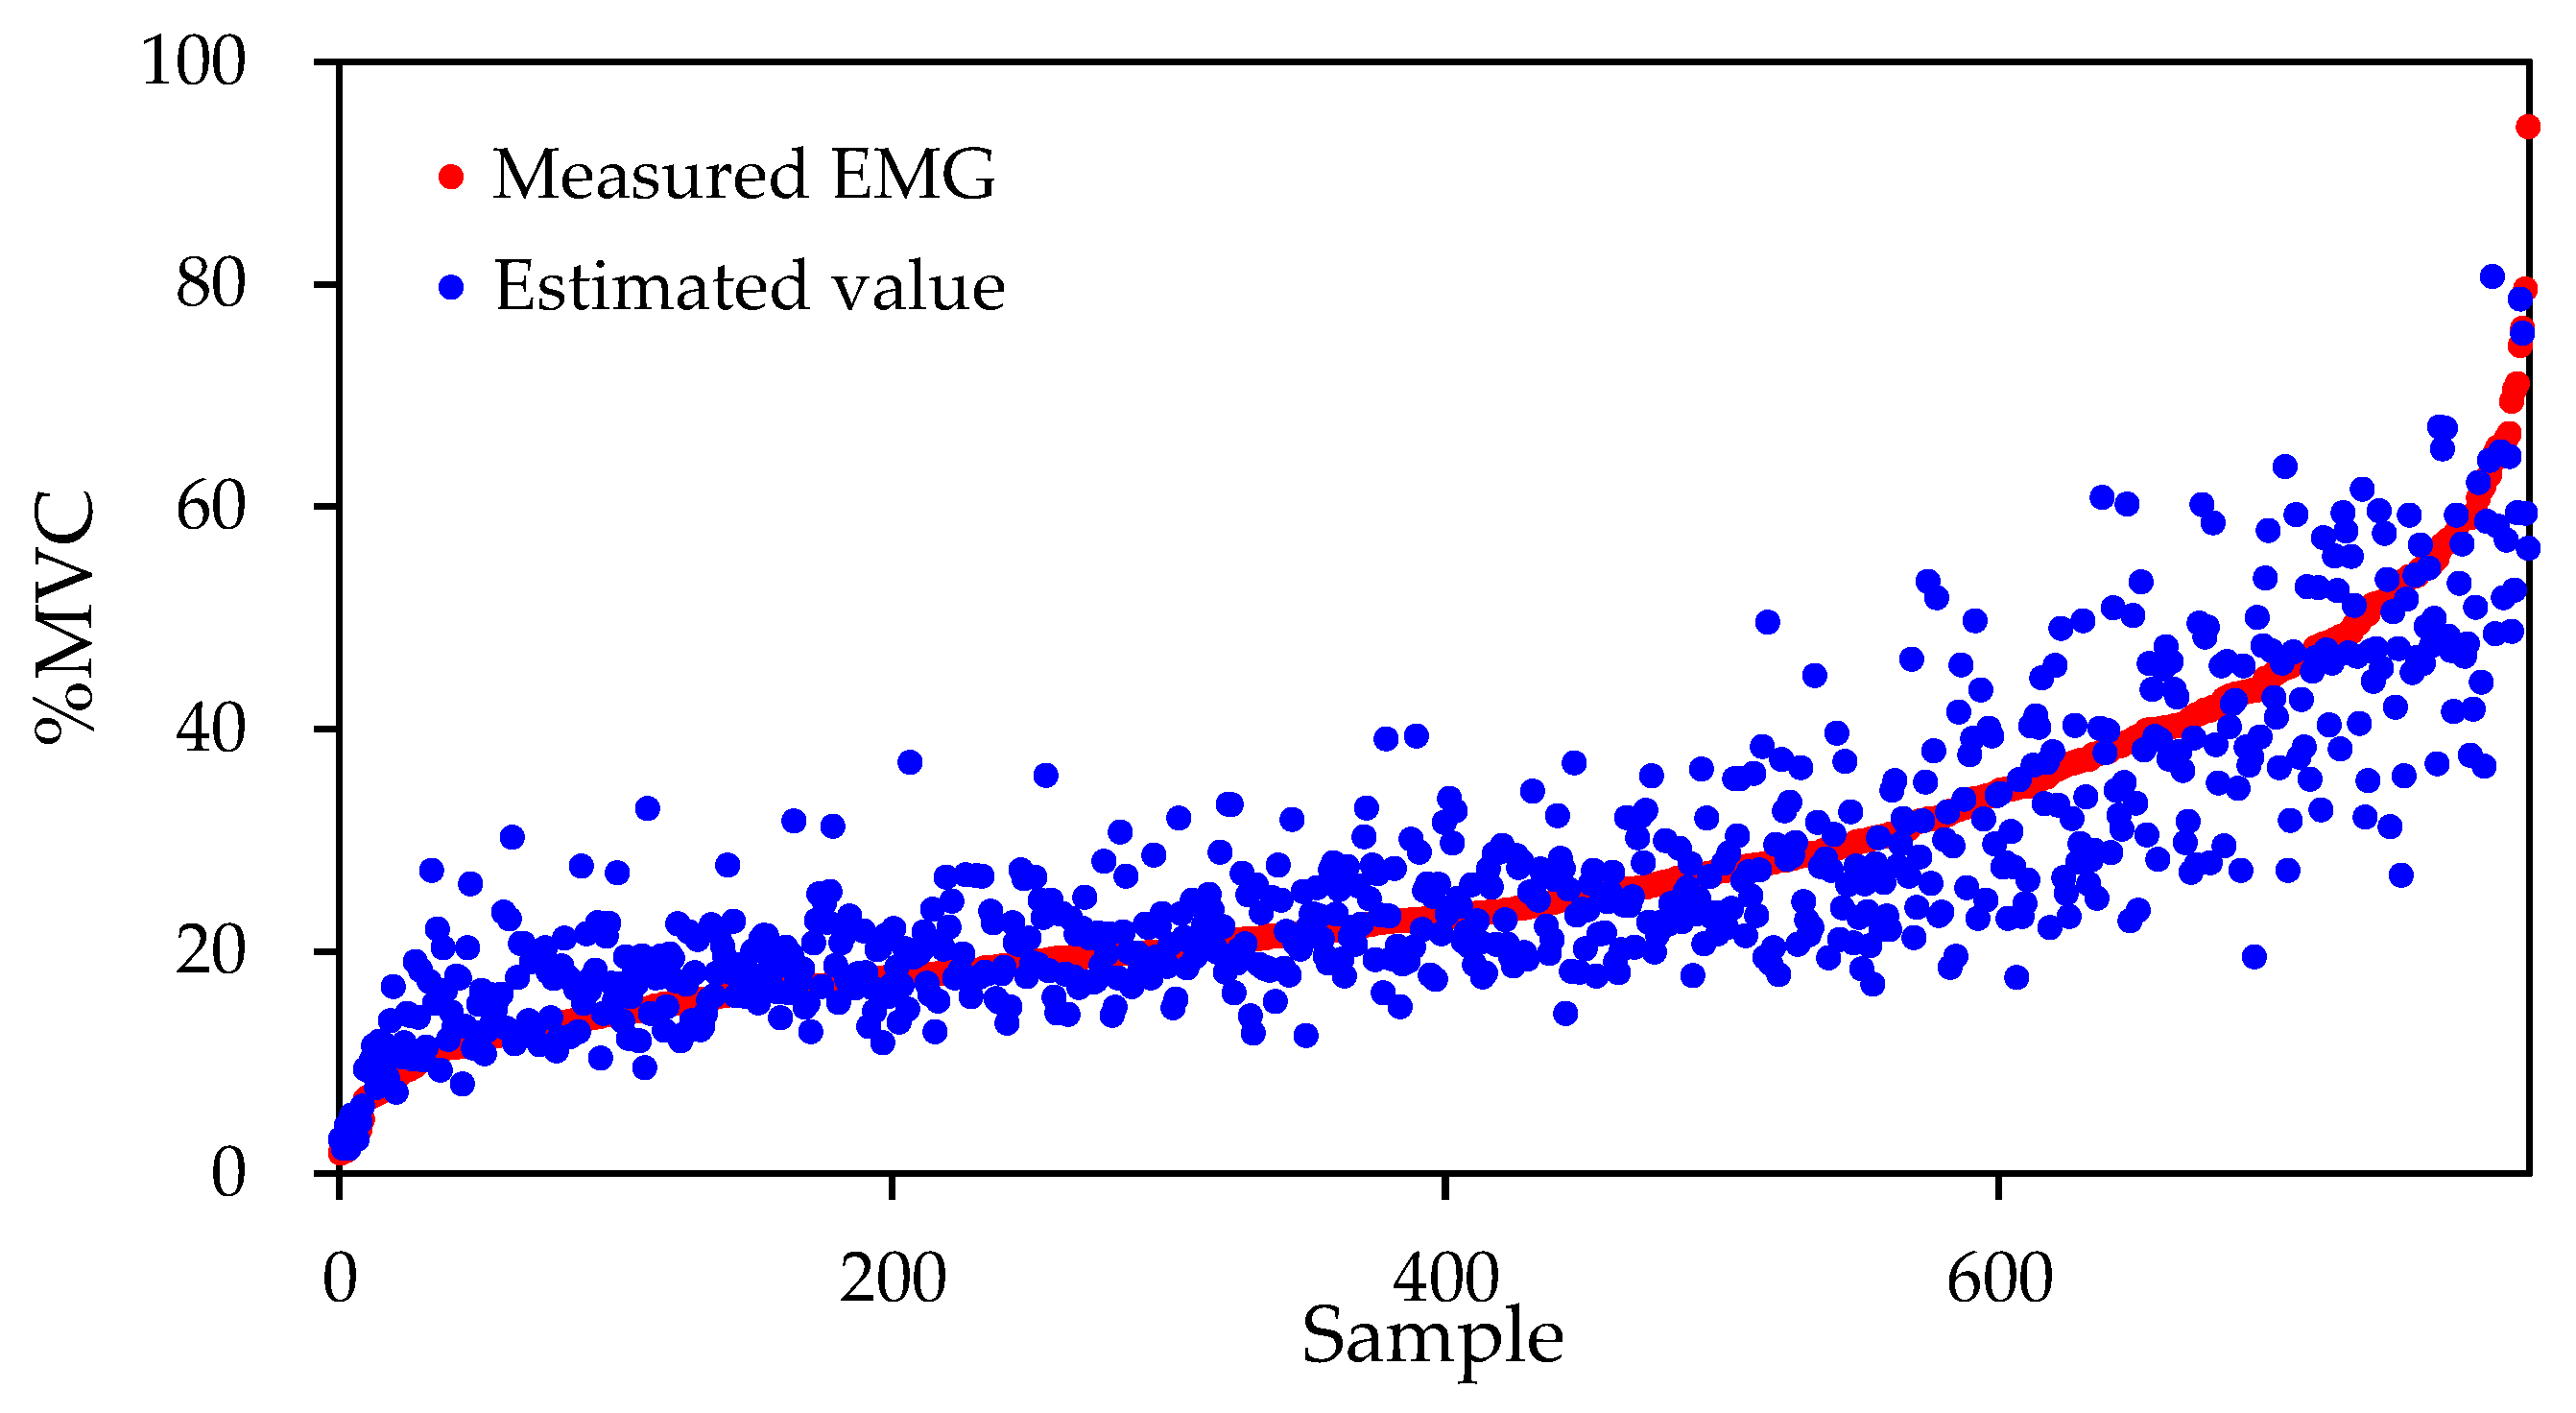
4. Results
5. Discussion
6. Conclusions
Author Contributions
Funding
Institutional Review Board Statement
Informed Consent Statement
Data Availability Statement
Acknowledgments
Conflicts of Interest
References
- van der Slikke, R.M.A.; Berger, M.A.M.; Bregman, D.J.J.; Veeger, D.H.E.J. Wearable Wheelchair Mobility Performance Measurement in Basketball, Rugby, and Tennis: Lessons for Classification and Training. Sensors 2020, 20, 3518. [Google Scholar] [CrossRef] [PubMed]
- De Groot, S.; Balvers, I.J.M.; Kouwenhoven, S.M.; Janssen, T.W.J. Validity and Reliability of Tests Determining Performance-Related Components of Wheelchair Basketball. J. Sports Sci. 2012, 30, 879–887. [Google Scholar] [CrossRef] [PubMed]
- Usma-Alvarez, C.C.; Chua, J.J.C.; Fuss, F.K.; Subic, A.; Burton, M. Advanced Performance Analysis of the Illinois Agility Test Based on the Tangential Velocity and Turning Radius in Wheelchair Rugby Athletes. Sport. Technol. 2011, 3, 204–214. [Google Scholar] [CrossRef]
- Coutts, K.D. Kinematics of Sport Wheelchair Propulsion. J. Rehabil. Res. Dev. 1990, 27, 21–26. [Google Scholar] [CrossRef]
- van der Kruk, E.; Reijne, M.M. Accuracy of Human Motion Capture Systems for Sport Applications; State-of-the-art review. Eur. J. Sport Sci. 2018, 18, 806–819. [Google Scholar] [CrossRef]
- Franchin, S.M.; Giordani, F.; Tonellato, M.; Benazzato, M.; Marcolin, G.; Sacerdoti, P.; Bettella, F.; Musumeci, A.; Petrone, N.; Masiero, S. Kinematic Bidimensional Analysis of the Propulsion Technique in Wheelchair Rugby Athletes. Eur. J. Transl. Myol. 2020, 30, 129–133. [Google Scholar] [CrossRef] [Green Version]
- Curran, S.A.; Frossard, L. Biomechanical analyses of the performance of Paralympians: From Foundation to Elite Level. Prosthet. Orthot. Int. 2012, 36, 380–395. [Google Scholar] [CrossRef] [Green Version]
- Reilly, T. Assessment of sports performance with particular reference to field games. Eur. J. Sport Sci. 2010, 1, 1–12. [Google Scholar] [CrossRef]
- Adesida, Y.; Papi, E.; McGregor, A.H. Exploring the Role of Wearable Technology in Sport Kinematics and Kinetics: A Systematic Review. Sensors 2019, 19, 1597. [Google Scholar] [CrossRef] [Green Version]
- Camomilla, V.; Bergamini, E.; Fantozzi, S.; Vannozzi, G. Trends Supporting the In-Field Use of Wearable Inertial Sensors for Sport Performance Evaluation: A Systematic Review. Sensors 2018, 18, 873. [Google Scholar] [CrossRef] [Green Version]
- Sozen, H. Comparison of Muscle Activation During Elliptical Trainer, Treadmill and Bike Exercise. Biol. Sport 2010, 27, 203–206. [Google Scholar] [CrossRef]
- Mulroy, S.J.; Gronley, J.K.; Newsam, C.J.; Perry, J. Electromyographic Activity of Shoulder Muscles During Wheelchair Propulsion by Paraplegic Persons. Arch. Phys. Med. Rehabil. 1996, 77, 187–193. [Google Scholar] [CrossRef]
- Rodgers, M.M.; Gayle, G.W.; Figoni, S.F.; Kobayashi, M.; Lieh, J.; Glaser, R.M. Biomechanics of Wheelchair Propulsion During Fatigue. Arch. Phys. Med. Rehabil. 1994, 75, 85–93. [Google Scholar] [CrossRef]
- Veeger, H.E.J.; van der Woude, L.H.V.; Rozendal, R.H. Load on the Upper Extremity in Manual Wheelchair Propulsion. J. Electromyogr. Kinesiol. 1991, 1, 270–280. [Google Scholar] [CrossRef]
- Spaepen, A.J.; Vanlandewijck, Y.C.; Lysens, R.J. Relationship Between Energy Expenditure and Muscular Activity Patterns in Handrim Wheelchair Propulsion. Int. J. Ind. Ergon. 1996, 17, 163–173. [Google Scholar] [CrossRef]
- Howard, R. Wireless Sensor Devices in Sports Performance. IEEE Potentials 2016, 35, 40–42. [Google Scholar] [CrossRef]
- Lee, S.; Yoon, J.; Lee, D.; Seong, D.; Lee, S.; Jang, M.; Choi, J.; Yu, K.J.; Kim, J.; Lee, S.; et al. Wireless Epidermal Electromyogram Sensing System. Electronics 2020, 9, 269. [Google Scholar] [CrossRef] [Green Version]
- Kim, J.; Youn, W. Development of a Compact-size and Wireless Surface EMG Measurement System. ICROS-SICE Int. Jt. Conf. 2009 2009, 1625–1628. [Google Scholar]
- Felici, F.; Del Vecchio, A. Surface Electromyography: What Limits Its Use in Exercise and Sport Physiology? Front. Neurol. 2020, 11. [Google Scholar] [CrossRef]
- Dang, Q.; Yin, J.; Wang, B.; Zheng, W. Deep learning based 2D human pose estimation: A survey. Tsinghua Sci. Technol. 2019, 24, 663–676. [Google Scholar] [CrossRef]
- Chen, Y.; Tian, Y.; He, M. Monocular Human Pose Estimation: A Survey of Deep Learning-based Methods. Comput. Vis. Image Underst. 2020, 192, 1–23. [Google Scholar] [CrossRef]
- Difini, G.M.; Martins, M.G.; Barbosa, J.L.V. Human Pose Estimation for Training Assistance: A Systematic Literature Review. ACM Int. Conf. Proc. Ser. 2021, 189–196. [Google Scholar] [CrossRef]
- Cust, E.E.; Sweeting, A.J.; Ball, K.; Robertson, S. Machine and deep learning for sport-specific movement recognition: A systematic review of model development and performance. J. Sports Sci. 2018, 37, 568–600. [Google Scholar] [CrossRef] [PubMed]
- Groh, B.H.; Flaschka, J.; Wirth, M.; Kautz, T.; Fleckenstein, M.; Eskofier, B.M. Wearable Real-Time Skateboard Trick Visualization and Its Community Perception. IEEE Comput. Graph. Appl. 2016, 36, 12–18. [Google Scholar] [CrossRef] [PubMed]
- Mitchell, E.; Monaghan, D.; O’Connor, N.E. Classification of Sporting Activities Using Smartphone Accelerometers. Sensors 2013, 13, 5317–5337. [Google Scholar] [CrossRef] [Green Version]
- Thomas, O.; Sunehag, P.; Dror, G.; Yun, S.; Kim, S.; Robards, M.; Smola, A.; Green, D.; Saunders, P. Wearable sensor activity analysis using semi-Markov models with a grammar. Pervasive Mob. Comput. 2010, 6, 342–350. [Google Scholar] [CrossRef] [Green Version]
- Bux, A.; Angelov, P.; Habib, Z. Vision Based Human Activity Recognition: A Review. Adv. Intell. Syst. Comput. 2017, 513, 341–371. [Google Scholar] [CrossRef] [Green Version]
- Ramanujam, E.; Perumal, T.; Padmavathi, S. Human Activity Recognition with Smartphone and Wearable Sensors Using Deep Learning Techniques: A Review. IEEE Sens. J. 2021, 21, 1309–13040. [Google Scholar] [CrossRef]
- Rangasamy, K.; As’ari, M.A.; Rahmad, N.A.; Ghazali, N.F.; Ismail, S. Deep learning in sport video analysis: A review. Telecommun. Comput. Electron. Control 2020, 18, 1926–1933. [Google Scholar] [CrossRef]
- Bengio, Y. Deep Learning of Representations: Looking Forward. Int. Conf. Stat. Lang. Speech Process. 2013, 7978, 1–37. [Google Scholar] [CrossRef] [Green Version]
- Lecun, Y.; Bengio, Y.; Hinton, G. Deep learning. Nature 2015, 521, 436–444. [Google Scholar] [CrossRef] [PubMed]
- Cao, Z.; Hidalgo, G.; Simon, T.; Wei, S.E.; Sheikh, Y. OpenPose: Realtime Multi-Person 2D Pose Estimation Using Part Affinity Fields. IEEE Trans. Pattern Anal. Mach. Intell. 2021, 43, 172–186. [Google Scholar] [CrossRef] [PubMed] [Green Version]
- Martinez, J.; Hossain, R.; Romero, J.; Little, J.J. A Simple Yet Effective Baseline for 3d Human Pose Estimation. Proc. IEEE Int. Conf. Comput. Vis. 2017, 1, 2659–2668. [Google Scholar] [CrossRef] [Green Version]
- Yoshida, M.; Terao, M. Suitable Cutoff Frequency of Low-pass Filter for Estimating Muscle Force by Surface Eectromyogram. Annu. Int. Conf. IEEE Eng. Med. Biol. Proc. 2003, 2, 1709–1711. [Google Scholar] [CrossRef]
- Hochreiter, S.; Schmidhuber, J. Long Short-Term Memory. Neural Comput. 1997, 9, 1735–1780. [Google Scholar] [CrossRef]
- Chua, L.O.; Yang, L. Cellular Neural Networks: Theory. IEEE Trans. Circuits Syst. 1988, 35, 1257–1272. [Google Scholar] [CrossRef]
- Dai, H.; Hwang, H.G.; Tseng, V.S. Convolutional neural network based automatic screening tool for cardiovascular diseases using different intervals of ECG signals. Comput. Methods Programs Biomed. 2021, 203, 106035. [Google Scholar] [CrossRef]
- Hsieh, C.H.; Li, Y.S.; Hwang, B.J.; Hsiao, C.H. Detection of Atrial Fibrillation Using 1D Convolutional Neural Network. Sensors 2020, 20, 2136. [Google Scholar] [CrossRef] [Green Version]
- Srivastava, N.; Hinton, G.; Krizhevsky, A.; Sutskever, I.; Salakhutdinov, R. Dropout: A Simple Way to Prevent Neural Networks from Overfitting. J. Mach. Learn. Res. 2014, 15, 1929–1958. [Google Scholar]
- Kingma, D.P.; Ba, J.L. Adam: A Method for Stochastic Optimization. In Proceedings of the ICLR 2015, San Diego, CA, USA, 7–9 May 2015; pp. 1–15. [Google Scholar]
- Bengio, Y. Practical recommendations for gradient-based training of deep architectures. Lect. Notes Comput. Sci. 2012, 7700, 437–478. [Google Scholar] [CrossRef] [Green Version]
- Alexopoulos, E.C. Introduction to Multivariate Regression Analysis. Hippokratia 2010, 14, 28. [Google Scholar]
- Loh, W.Y. Classification and regression trees. Wiley Interdiscip. Rev. Data Min. Knowl. Discov. 2011, 1, 14–23. [Google Scholar] [CrossRef]
- Awad, M.; Khanna, R. Support Vector Regression. Effic. Learn. Mach. 2015, 67–80. [Google Scholar] [CrossRef] [Green Version]
- Wang, Z.; Yan, W.; Oates, T. Time Series Classification from Scratch with Deep Neural Networks: A Strong Baseline. Proc. Int. Jt. Conf. Neural Netw. 2016, 1578–1585. [Google Scholar] [CrossRef] [Green Version]
- Bai, S.; Kolter, J.Z.; Koltun, V. An Empirical Evaluation of Generic Convolutional and Recurrent Networks for Sequence Modeling. arXiv 2018, arXiv:1803.01271. [Google Scholar]
- Cho, K.; Van Merriënboer, B.; Gulcehre, C.; Bahdanau, D.; Bougares, F.; Schwenk, H.; Bengio, Y. Learning Phrase Representations using RNN Encoder-Decoder for Statistical Machine Translation. Conf. Empir. Methods Nat. Lang. Process. 2014, 1724–1734. [Google Scholar] [CrossRef]
- Dickerson, C.R.; Hughes, R.E.; Chaffin, D.B. Experimental evaluation of a computational shoulder musculoskeletal model. Clin. Biomech. 2008, 23, 886–894. [Google Scholar] [CrossRef]
- Dao, T.T. From deep learning to transfer learning for the prediction of skeletal muscle forces. Med. Biol. Eng. Comput. 2019, 57, 1049–1058. [Google Scholar] [CrossRef]
- Asato, K.T.; Cooper, R.A.; Robertson, R.N.; Ster, J.F. SMARTWheels: Development and testing of a system for measuring manual wheelchair propulsion dynamics. IEEE Trans. Biomed. Eng. 1993, 40, 1320–1324. [Google Scholar] [CrossRef]


| Forearms | Biceps | Triceps | Rear Deltoid | Pectoralis | Micro Average | |
|---|---|---|---|---|---|---|
| Subject 1 | 0.74 | 0.64 | 0.57 | 0.84 | 0.86 | 0.73 |
| Subject 2 | 0.68 | 0.73 | 0.60 | 0.88 | 0.88 | 0.75 |
| Subject 3 | 0.41 | 0.40 | 0.49 | 0.41 | 0.92 | 0.53 |
| Subject 4 | 0.54 | 0.50 | 0.63 | 0.32 | 0.87 | 0.57 |
| Subject 5 | 0.60 | 0.33 | 0.64 | 0.37 | 0.64 | 0.52 |
| Subject 6 | 0.60 | 0.39 | 0.64 | 0.57 | 0.47 | 0.53 |
| Subject 7 | 0.49 | 0.55 | 0.60 | 0.56 | 0.58 | 0.56 |
| Micro Average | 0.58 | 0.51 | 0.59 | 0.57 | 0.75 | - |
| Forearms | Biceps | Triceps | Rear Deltoid | Pectoralis | |
|---|---|---|---|---|---|
| Subject 1 | 5.11 ± 7.06 | 7.21 ± 6.56 | 3.83 ± 5.75 | 5.53 ± 5.12 | 5.15 ± 5.15 |
| Subject 2 | 5.69 ± 6.70 | 6.24 ± 6.18 | 6.89 ± 6.12 | 4.29 ± 5.15 | 4.97 ± 6.05 |
| Subject 3 | 5.75 ± 6.12 | 7.47 ± 6.88 | 7.10 ± 9.21 | 5.40 ± 7.66 | 4.57 ± 4.27 |
| Subject 4 | 6.37 ± 6.51 | 6.98 ± 6.06 | 5.63 ± 7.28 | 2.47 ± 4.67 | 4.36 ± 4.11 |
| Subject 5 | 4.58 ± 5.46 | 0.96 ± 4.20 | 4.76 ± 5.65 | 4.38 ± 7.80 | 5.69 ± 7.53 |
| Subject 6 | 6.72 ± 7.69 | 5.72 ± 7.04 | 5.55 ± 8.68 | 7.78 ± 8.34 | 5.65 ± 8.80 |
| Subject 7 | 4.73 ± 6.88 | 5.83 ± 7.05 | 5.05 ± 8.14 | 6.62 ± 6.38 | 4.65 ± 5.45 |
Publisher’s Note: MDPI stays neutral with regard to jurisdictional claims in published maps and institutional affiliations. |
© 2022 by the authors. Licensee MDPI, Basel, Switzerland. This article is an open access article distributed under the terms and conditions of the Creative Commons Attribution (CC BY) license (https://creativecommons.org/licenses/by/4.0/).
Share and Cite
Aihara, S.; Shibata, R.; Mizukami, R.; Sakai, T.; Shionoya, A. Deep Learning-Based Myoelectric Potential Estimation Method for Wheelchair Operation. Sensors 2022, 22, 1615. https://doi.org/10.3390/s22041615
Aihara S, Shibata R, Mizukami R, Sakai T, Shionoya A. Deep Learning-Based Myoelectric Potential Estimation Method for Wheelchair Operation. Sensors. 2022; 22(4):1615. https://doi.org/10.3390/s22041615
Chicago/Turabian StyleAihara, Shimpei, Ryusei Shibata, Ryosuke Mizukami, Takara Sakai, and Akira Shionoya. 2022. "Deep Learning-Based Myoelectric Potential Estimation Method for Wheelchair Operation" Sensors 22, no. 4: 1615. https://doi.org/10.3390/s22041615
APA StyleAihara, S., Shibata, R., Mizukami, R., Sakai, T., & Shionoya, A. (2022). Deep Learning-Based Myoelectric Potential Estimation Method for Wheelchair Operation. Sensors, 22(4), 1615. https://doi.org/10.3390/s22041615