
Trunk Muscle Coactivation in People with and without Low Back Pain during Fatiguing Frequency-Dependent Lifting Activities

 , ,
, ,  ,
,  and
and
Abstract
:1. Introduction
2. Materials and Methods
2.1. Participants
- capacity to give informed written consent;
- no concurrent systemic, rheumatic or neuro-musculoskeletal disorders, which may confound testing, or on high doses of opioids (>30 mg of morphine equivalent dose);
- no current pregnancy;
- HC did not have a relevant history, over the last three years, of back and lower-limb pain or injury that limited their daily activities and/or required treatment from a health professional;
- LBP participants presented with chronic pain for at least 3 months during the past 6 months, which was not attributed to a specific pathology.
- LBP participants had not received treatment from a therapist in the last three months before the date of enrolment.
2.2. Experimental Procedure
- L is the actual weight of the lifted load;
- RWL is the recommended weight limit that provides an estimate of the level of physical demand associated with the lifting task [12];
- LC is the constant load of 23 kg [12];
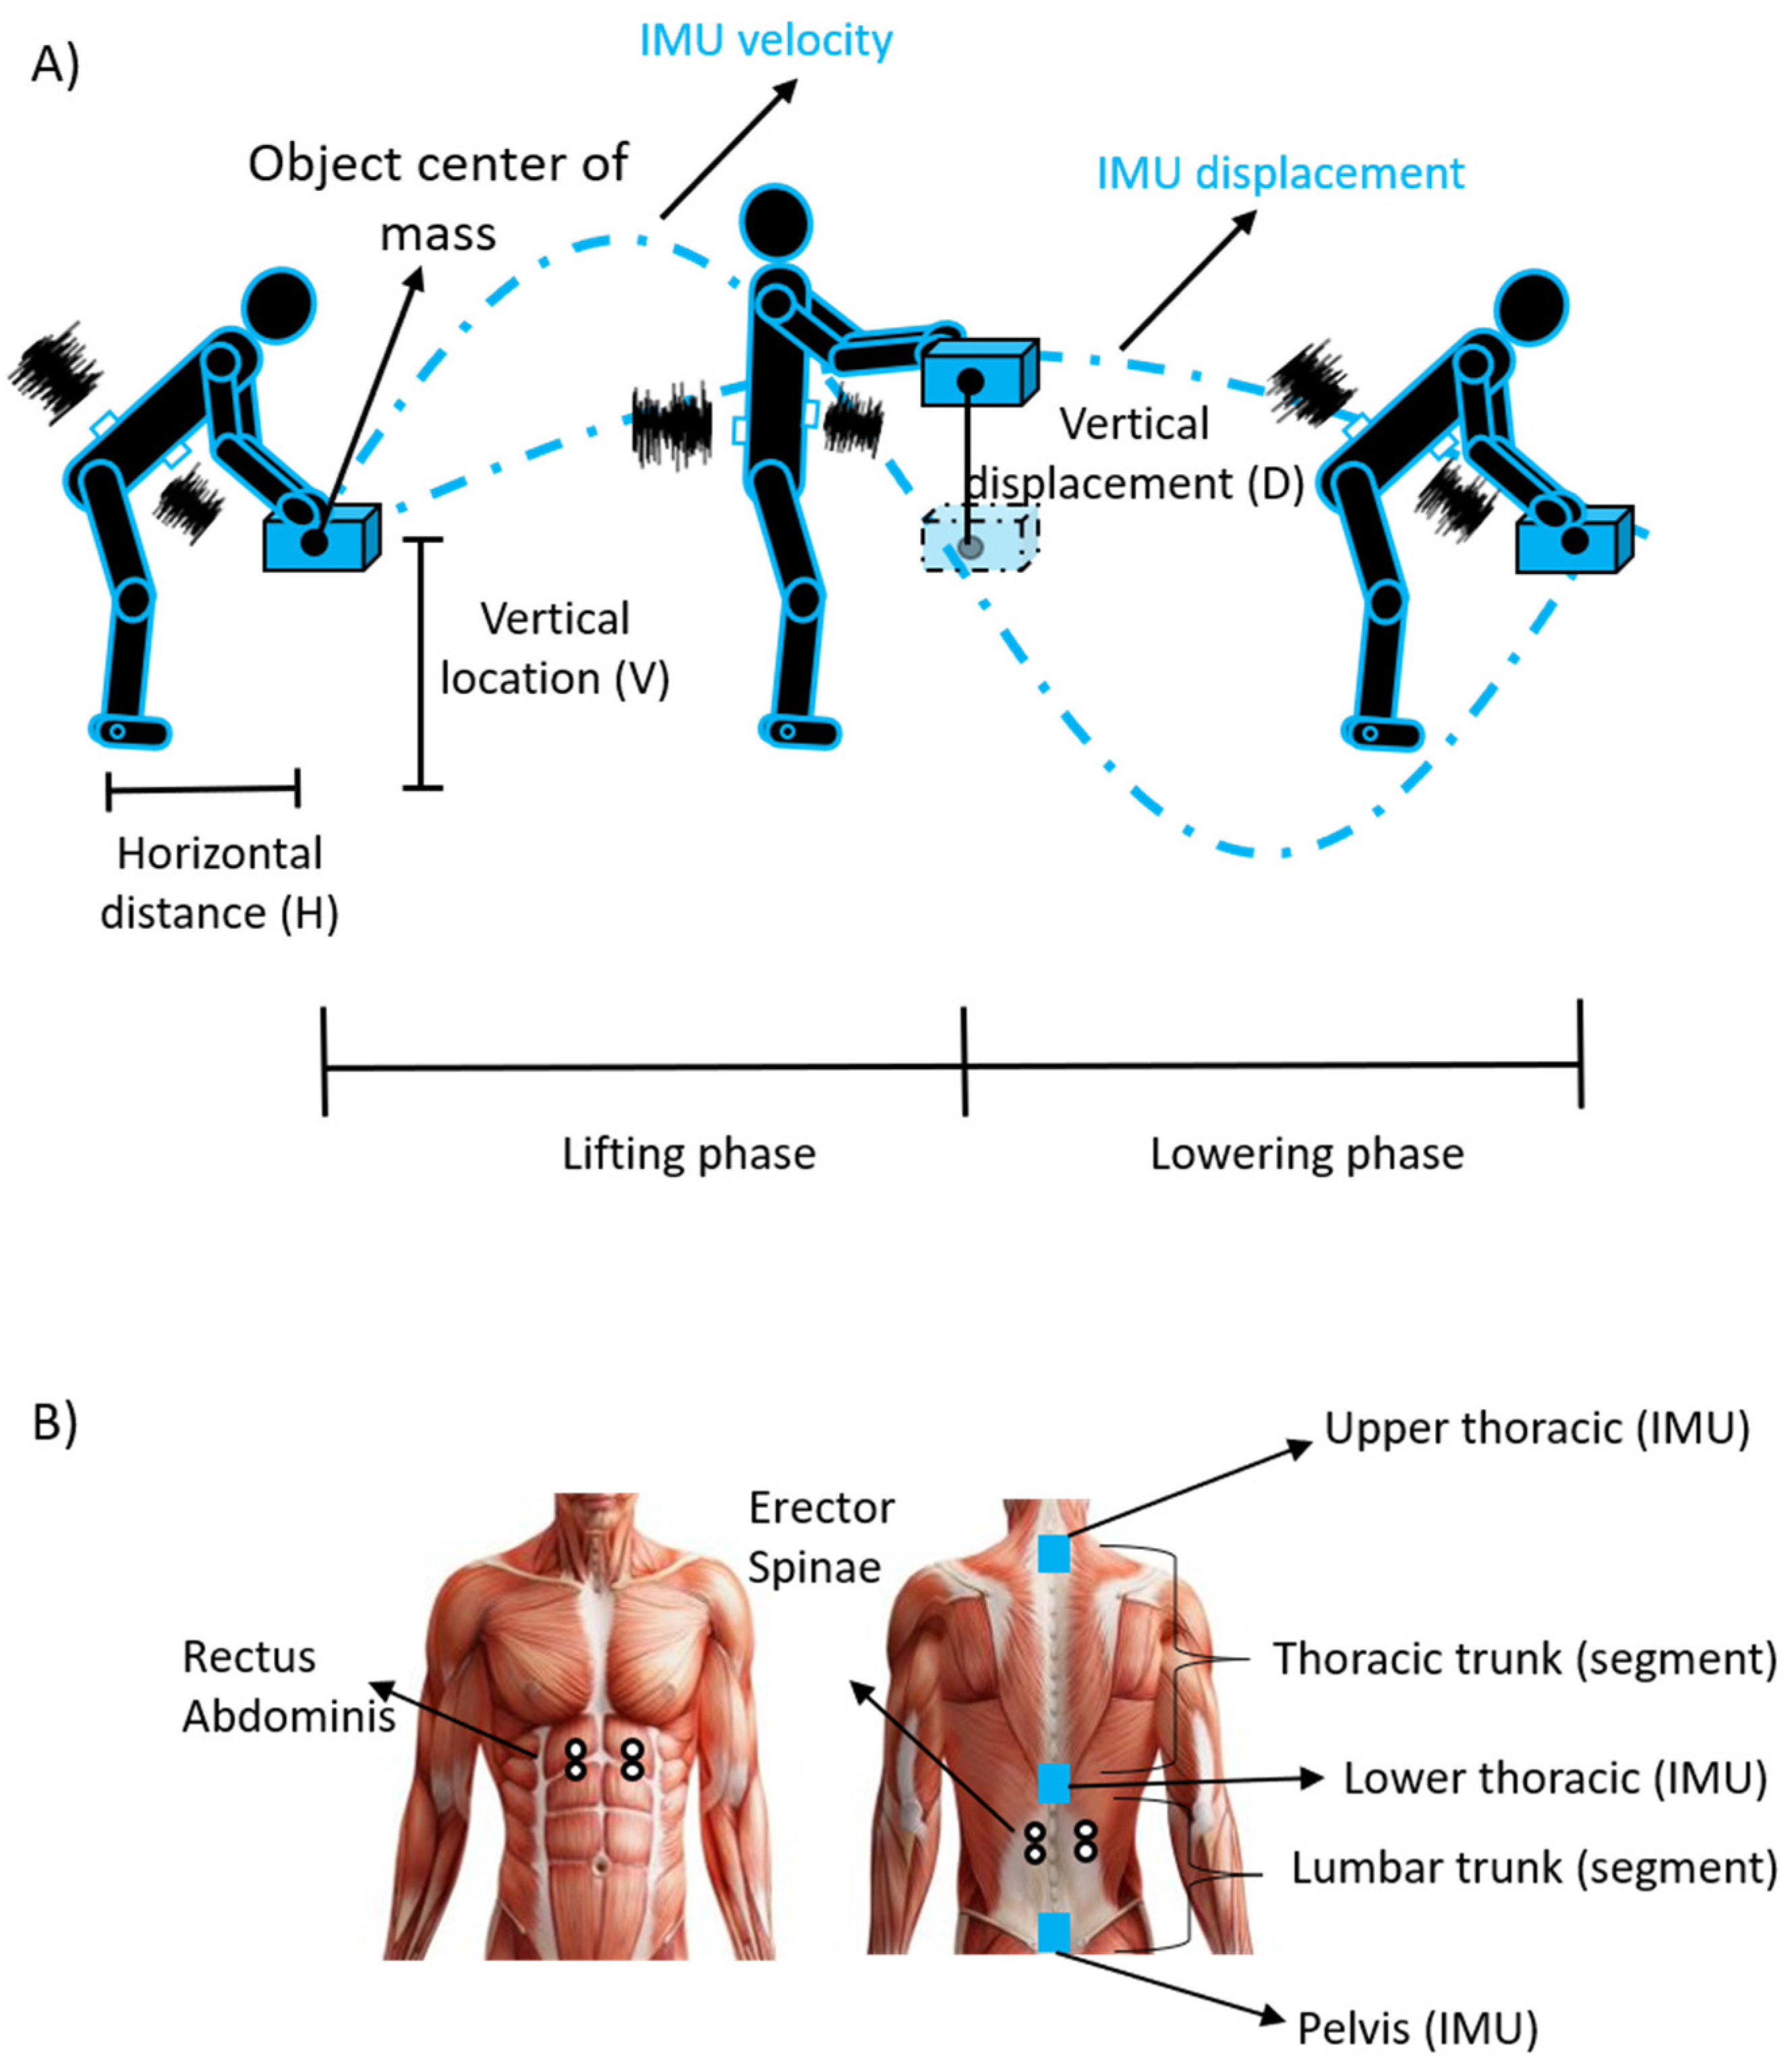
- HM, VM, DM and AM are the horizontal distance, vertical location, vertical displacement and asymmetry multipliers calculated by using equations or derived by tables by measuring the following parameters (see Figure 1A): horizontal distance (H); vertical location (V); vertical displacement (D); angle of asymmetry (A);
- CM is the coupling multiplier for the quality of gripping;
- FM is the frequency multiplier depending on lifting frequency (F), lifting duration and vertical location [12].
2.3. Electromyographic and Inertial Measurement Unit Recordings
2.3.1. Bipolar sEMG
2.3.2. Inertial Measurement Unit
2.4. Questionnaires Data
2.5. Data Analysis
2.5.1. Lifting Cycles Detection
2.5.2. Bipolar sEMG Preprocessing
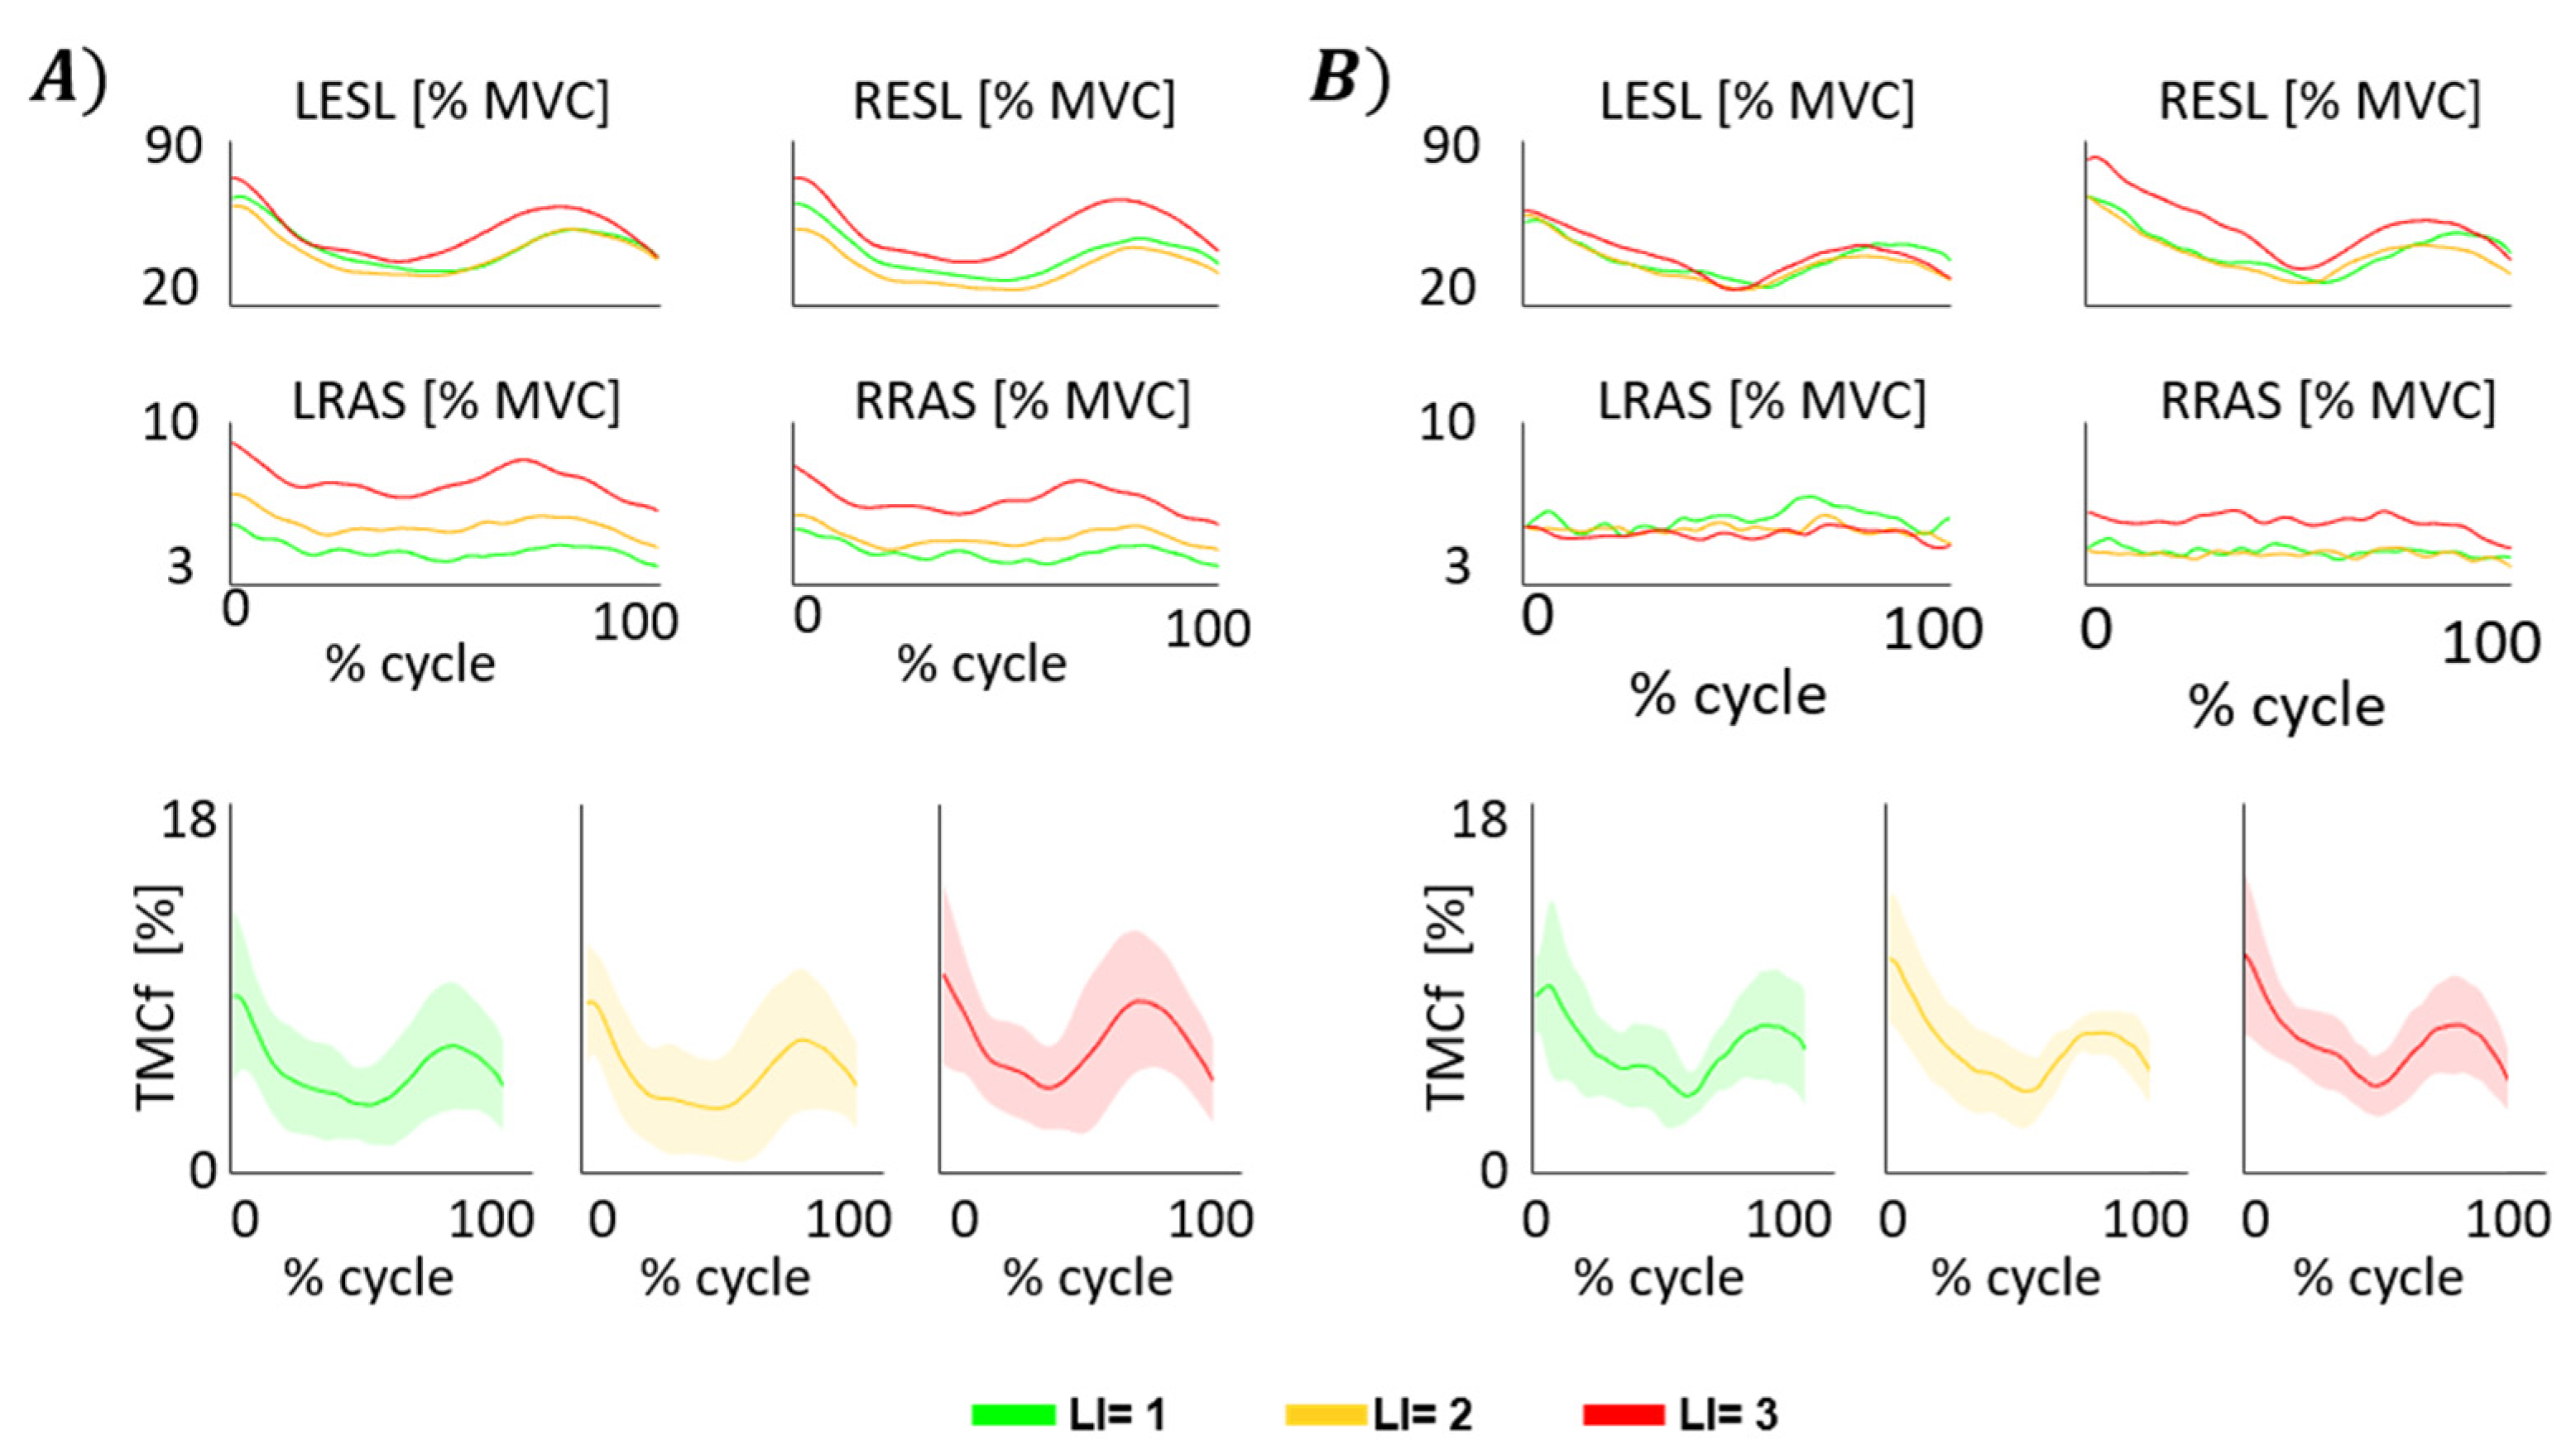
2.5.3. Time-Varying Multi-Muscle Coactivation Function (TMCf)
- is the mean of the differences between the kth samples of each pair of sEMG signals:
- J is the length of the signal;
- M is the number of considered muscles;
- and are the kth sample value of the envelope of the sEMG signals of the mth and nth muscles, respectively.
2.5.4. Range of Motion and Trunk Stability Parameters
2.6. Statistical Analysis
3. Results
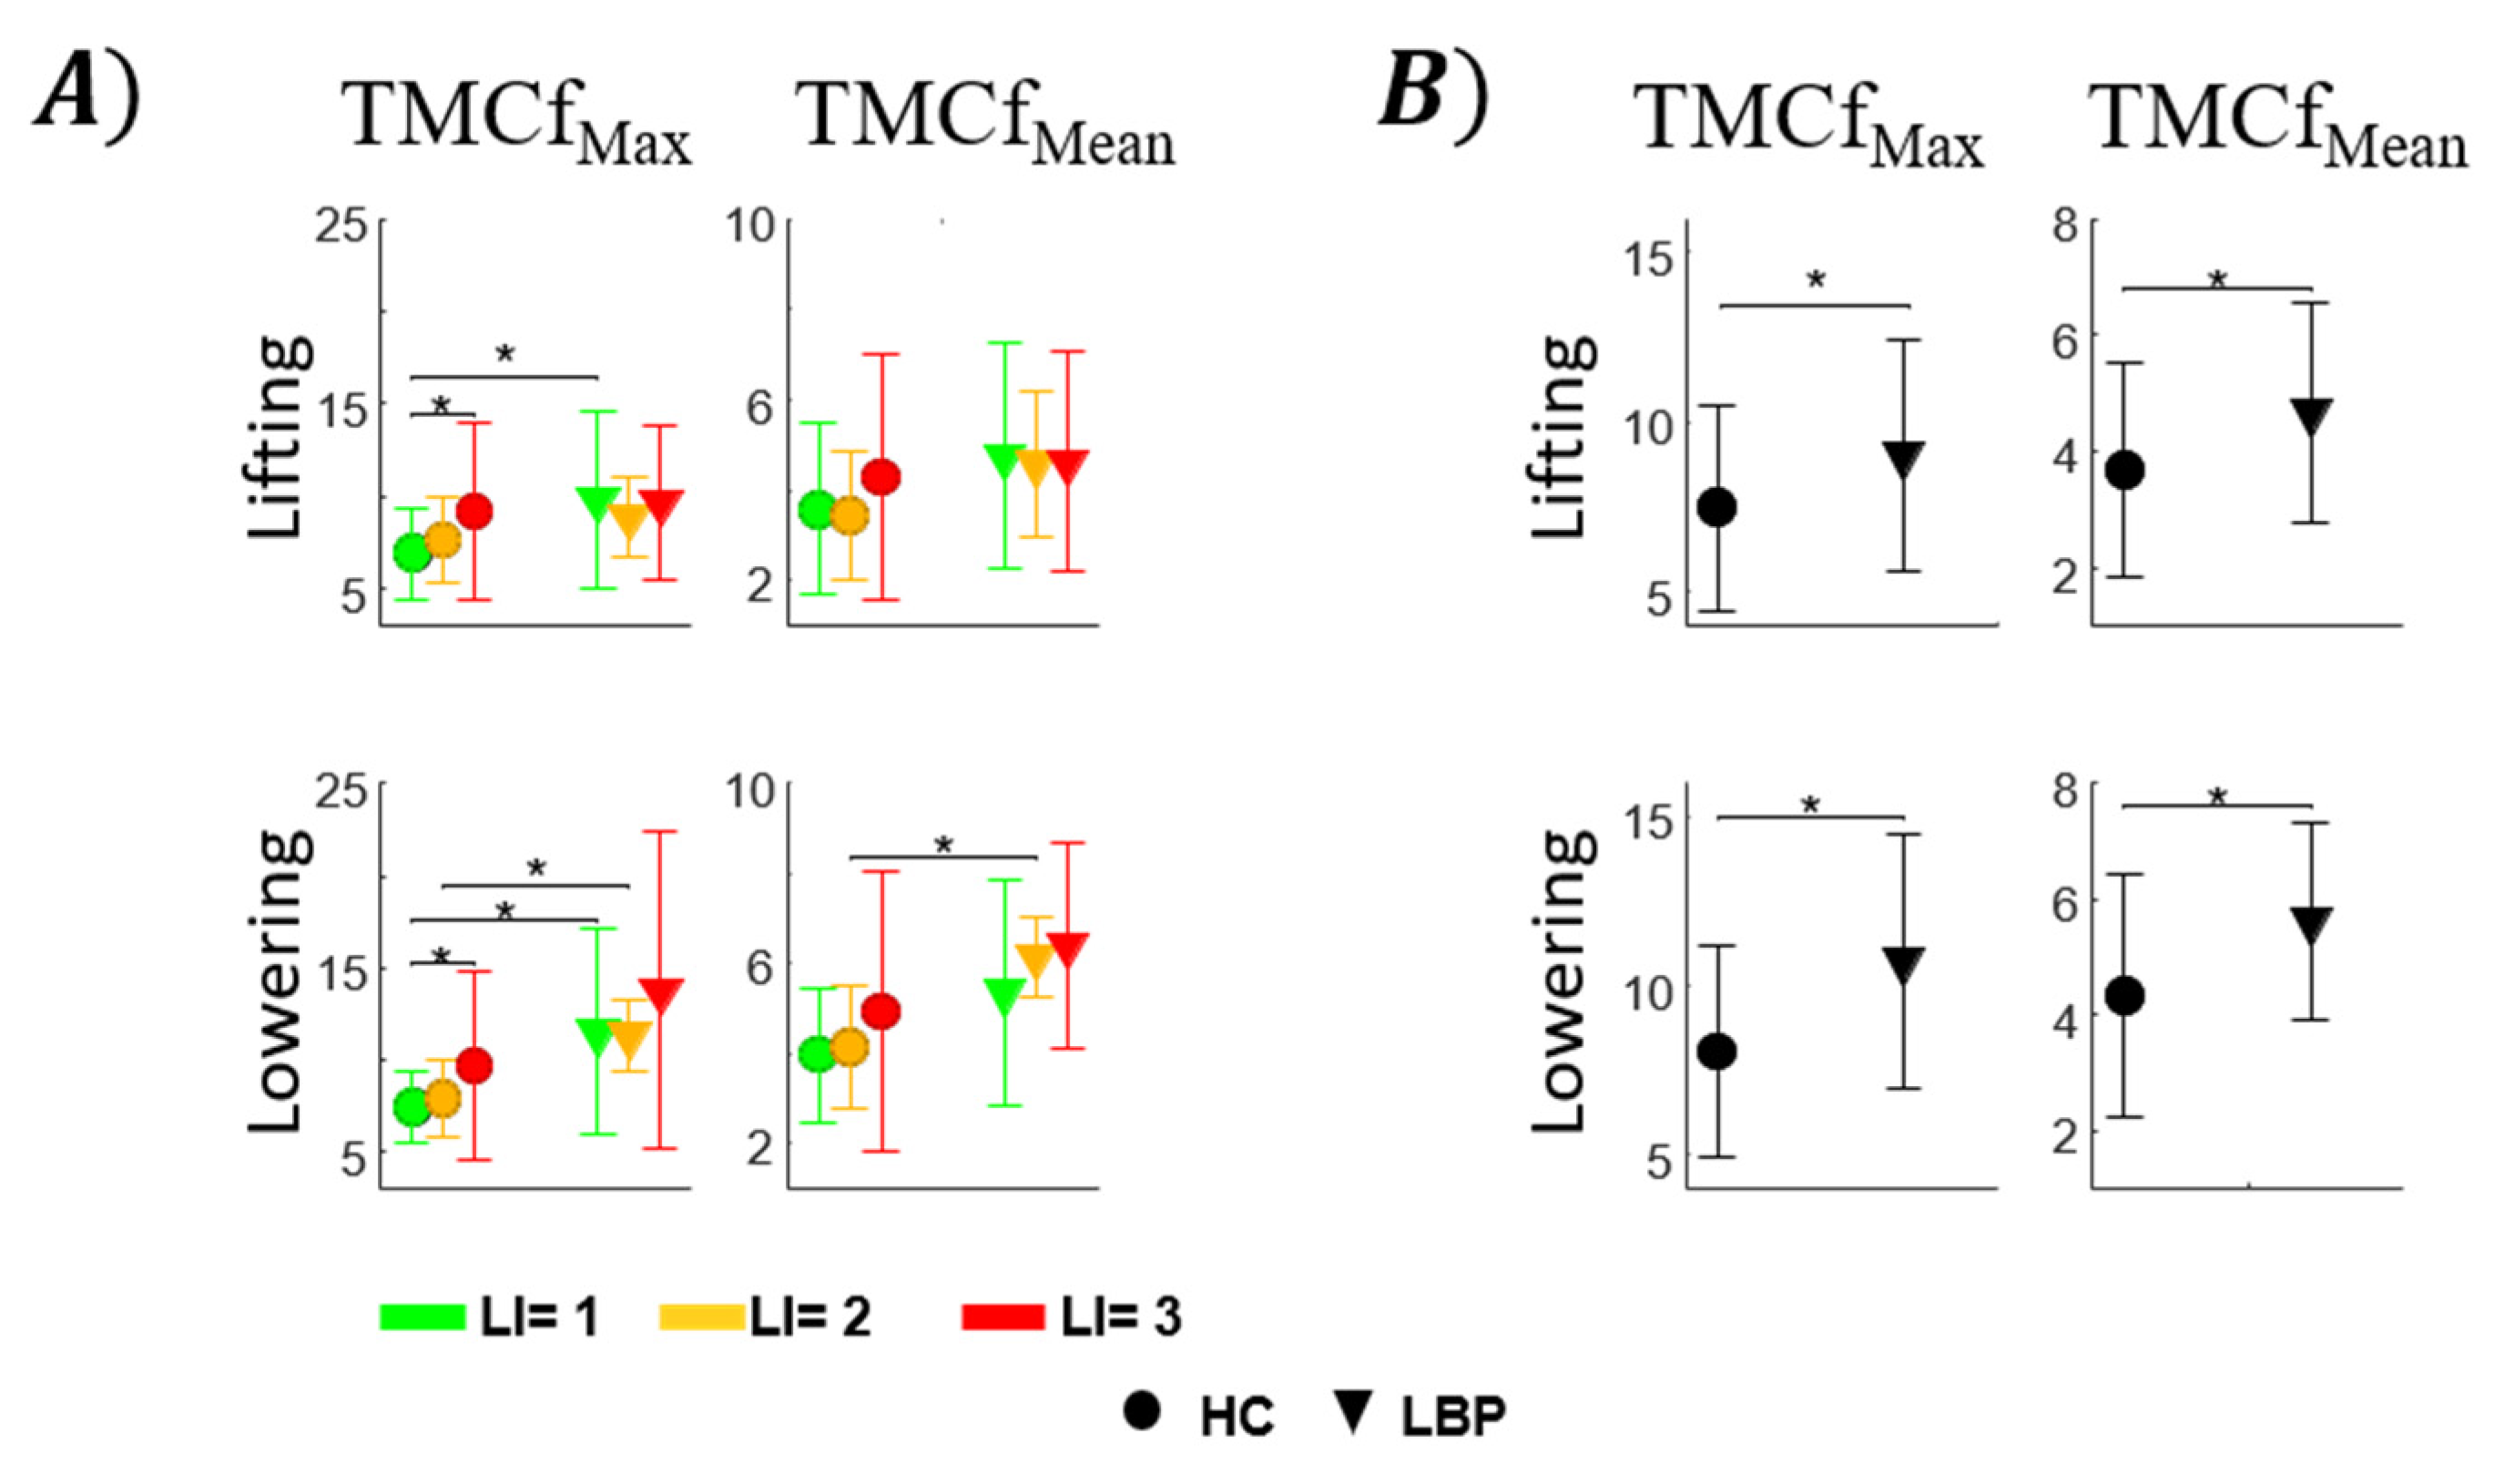
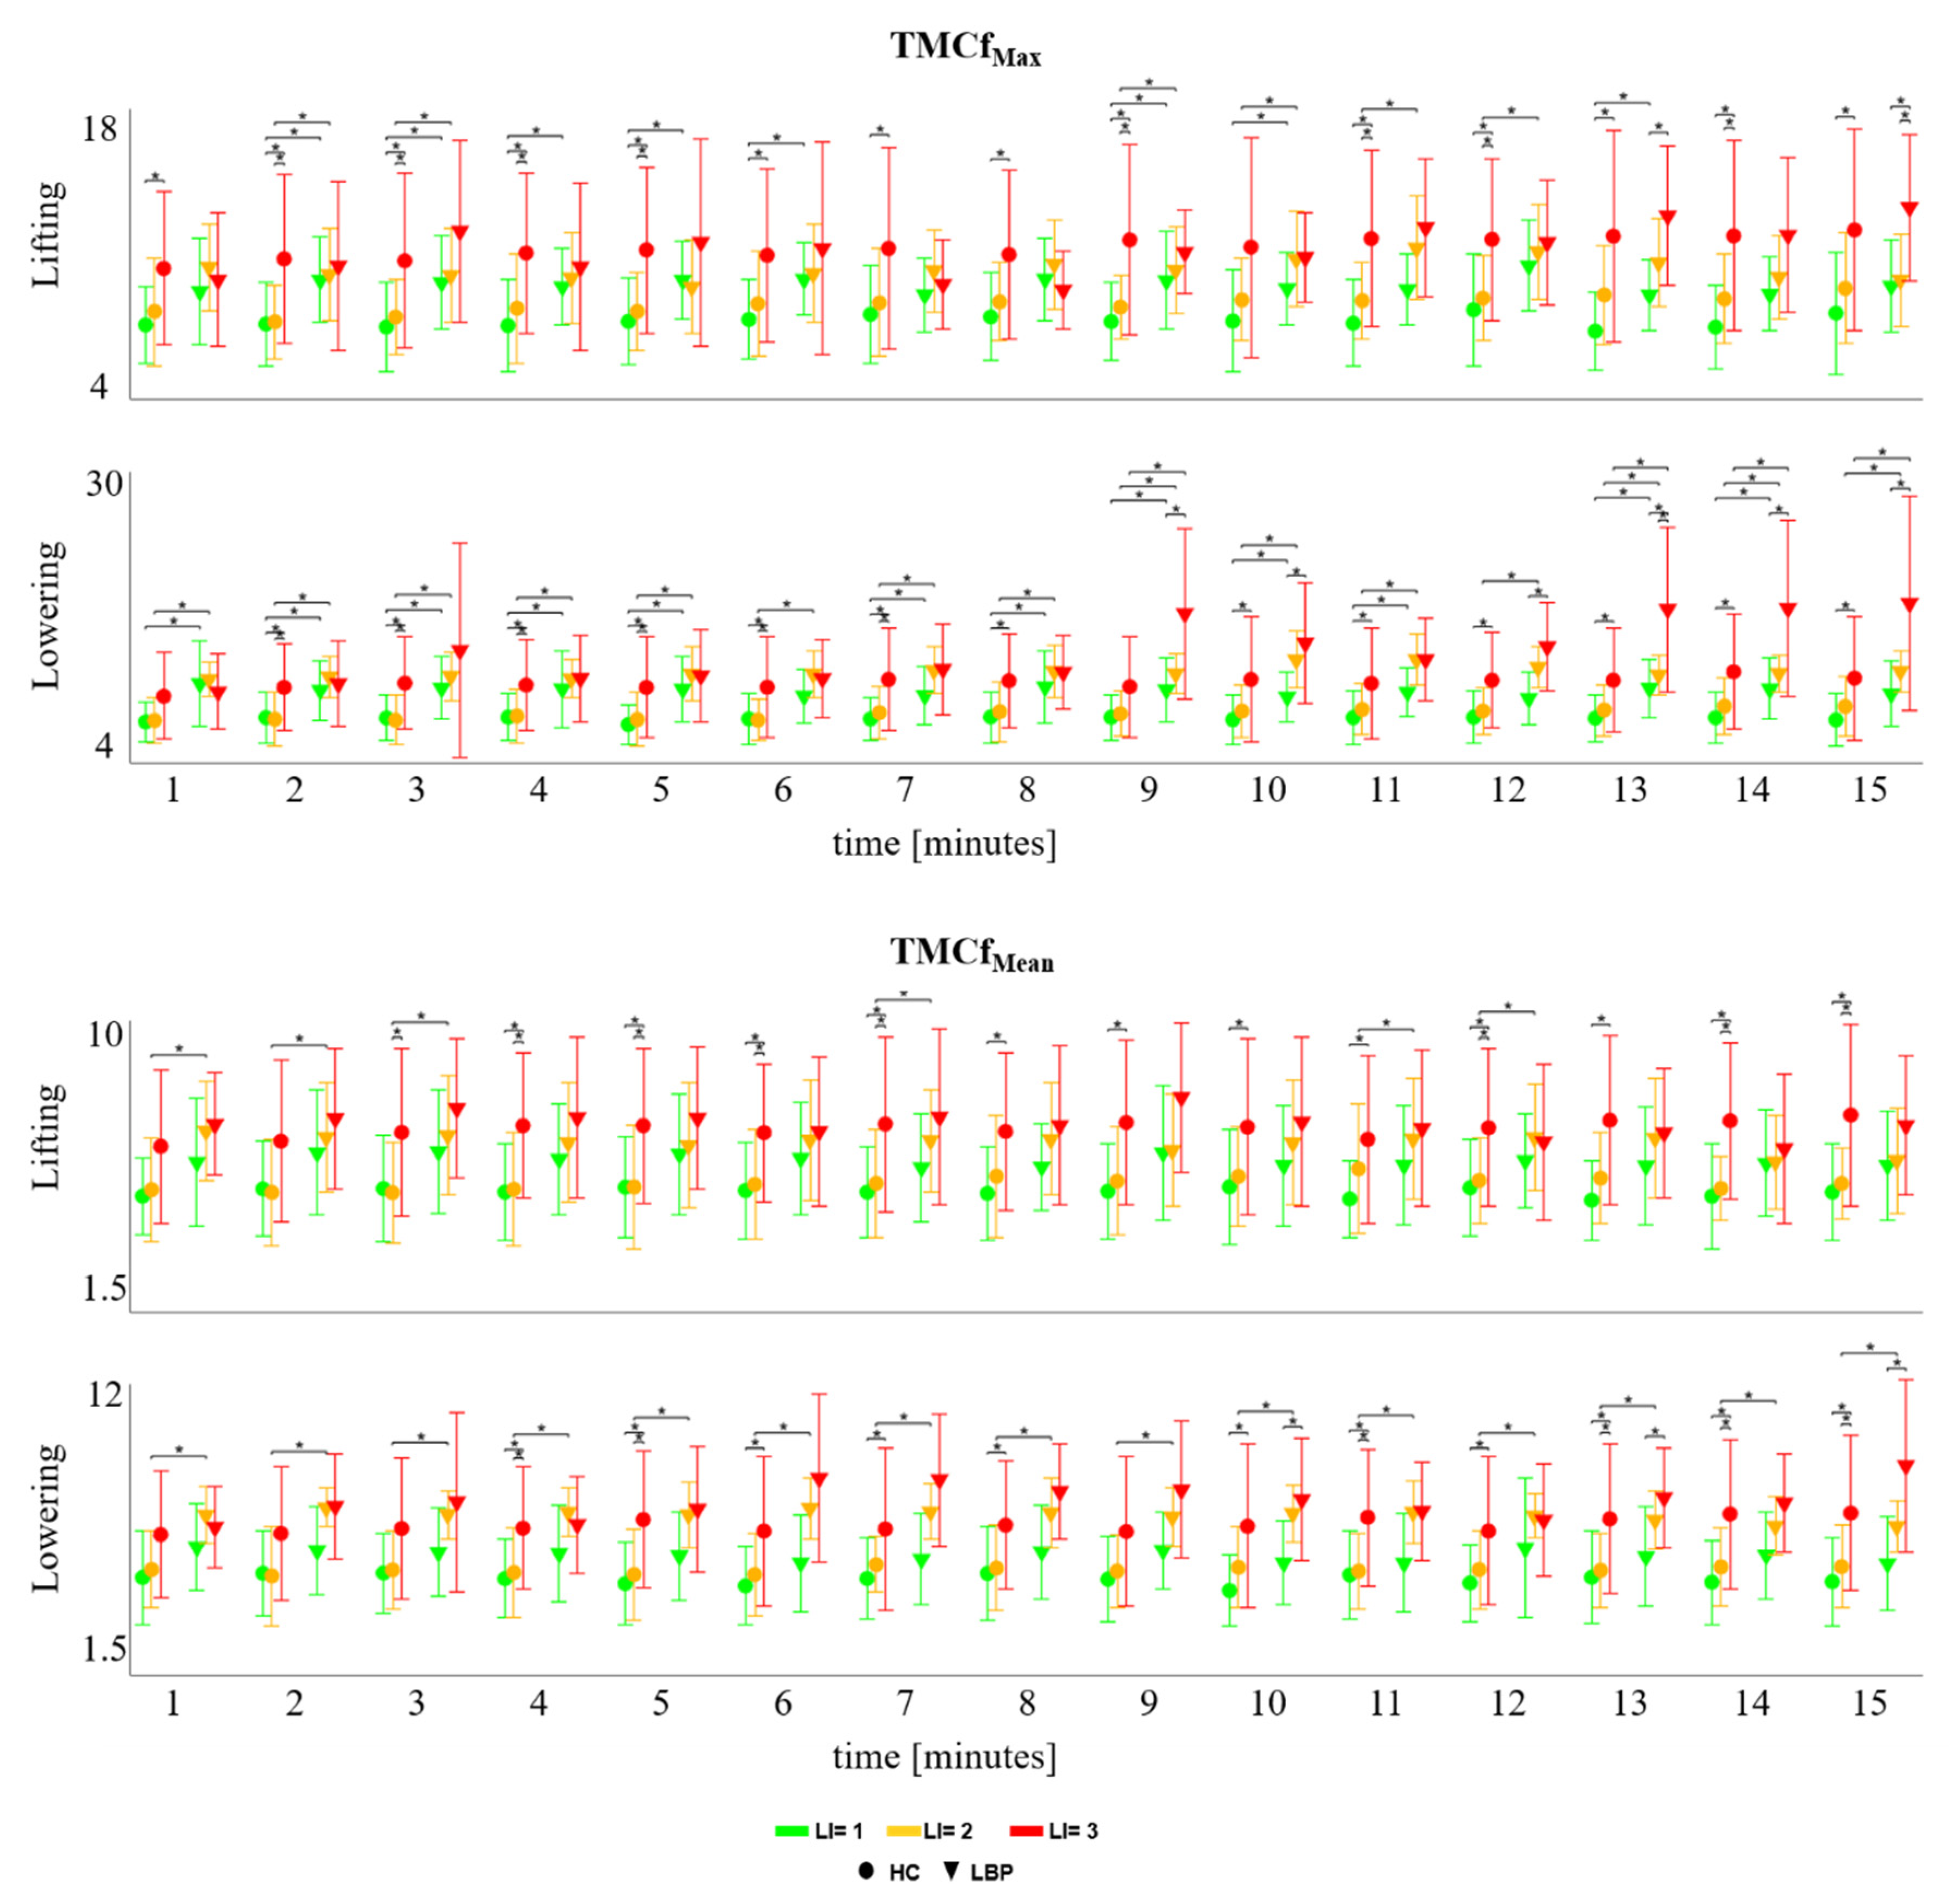
3.1. TMCf
3.2. Trunk Motion
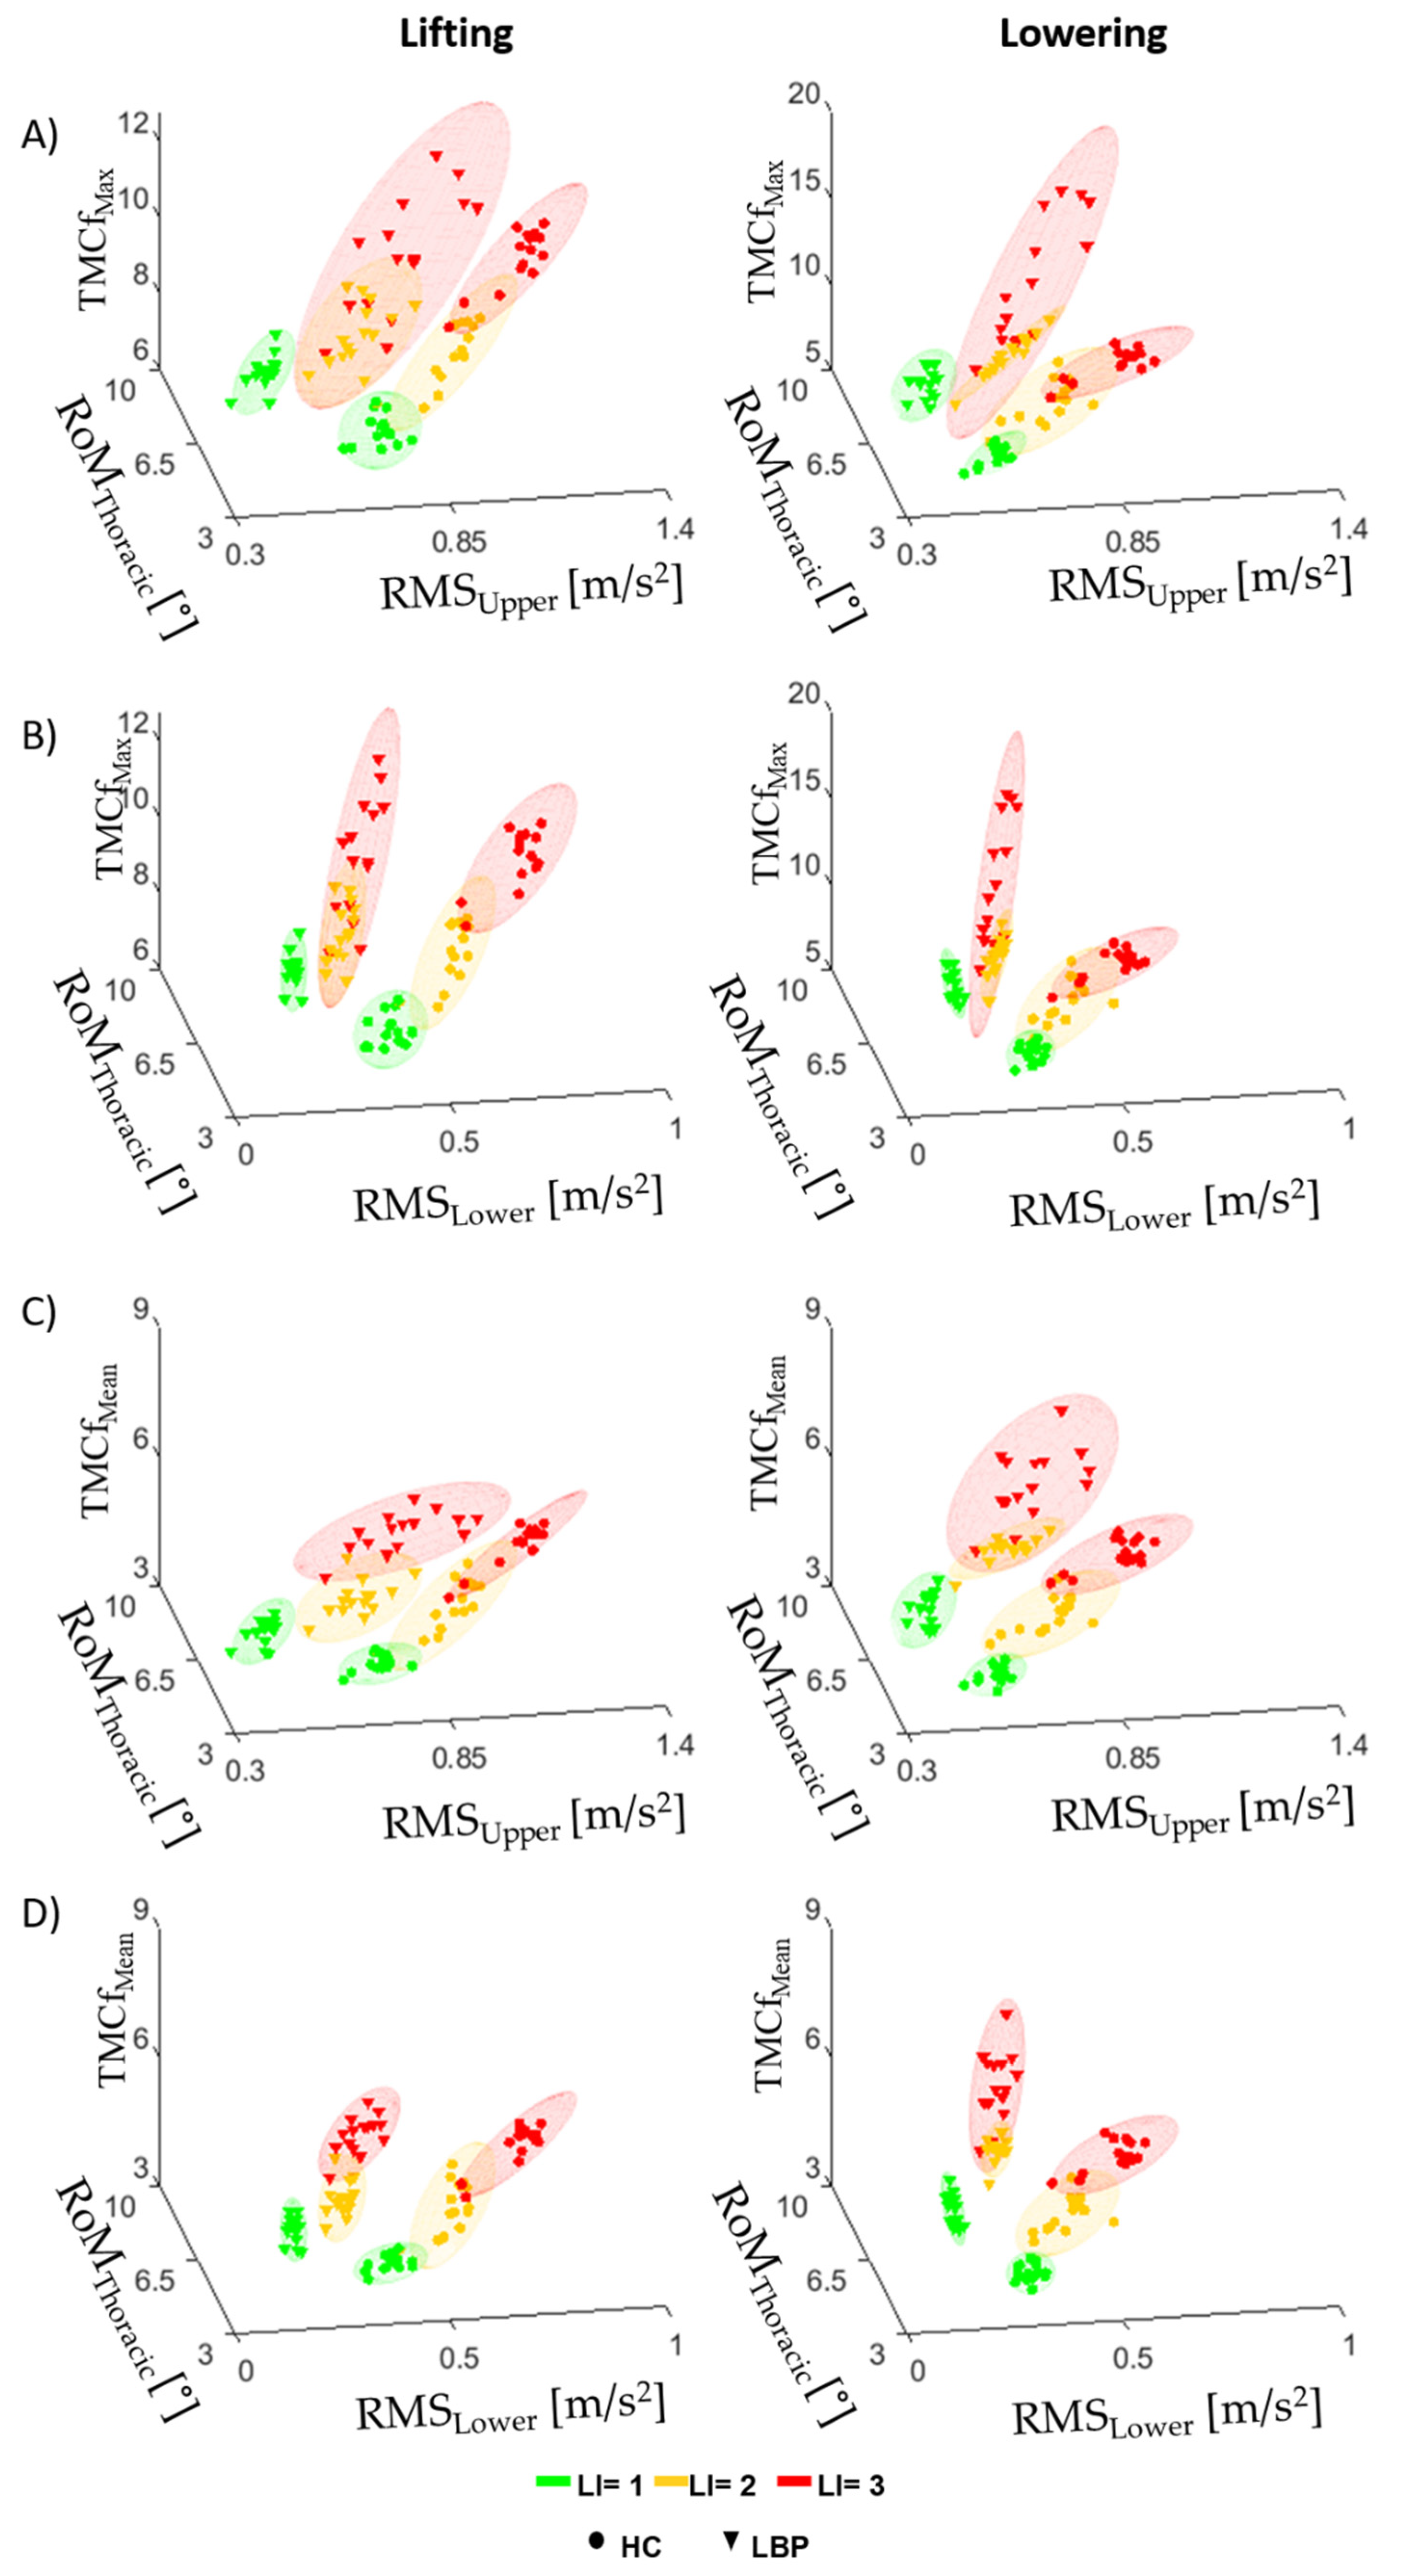
3.3. TMCf and Trunk Motion
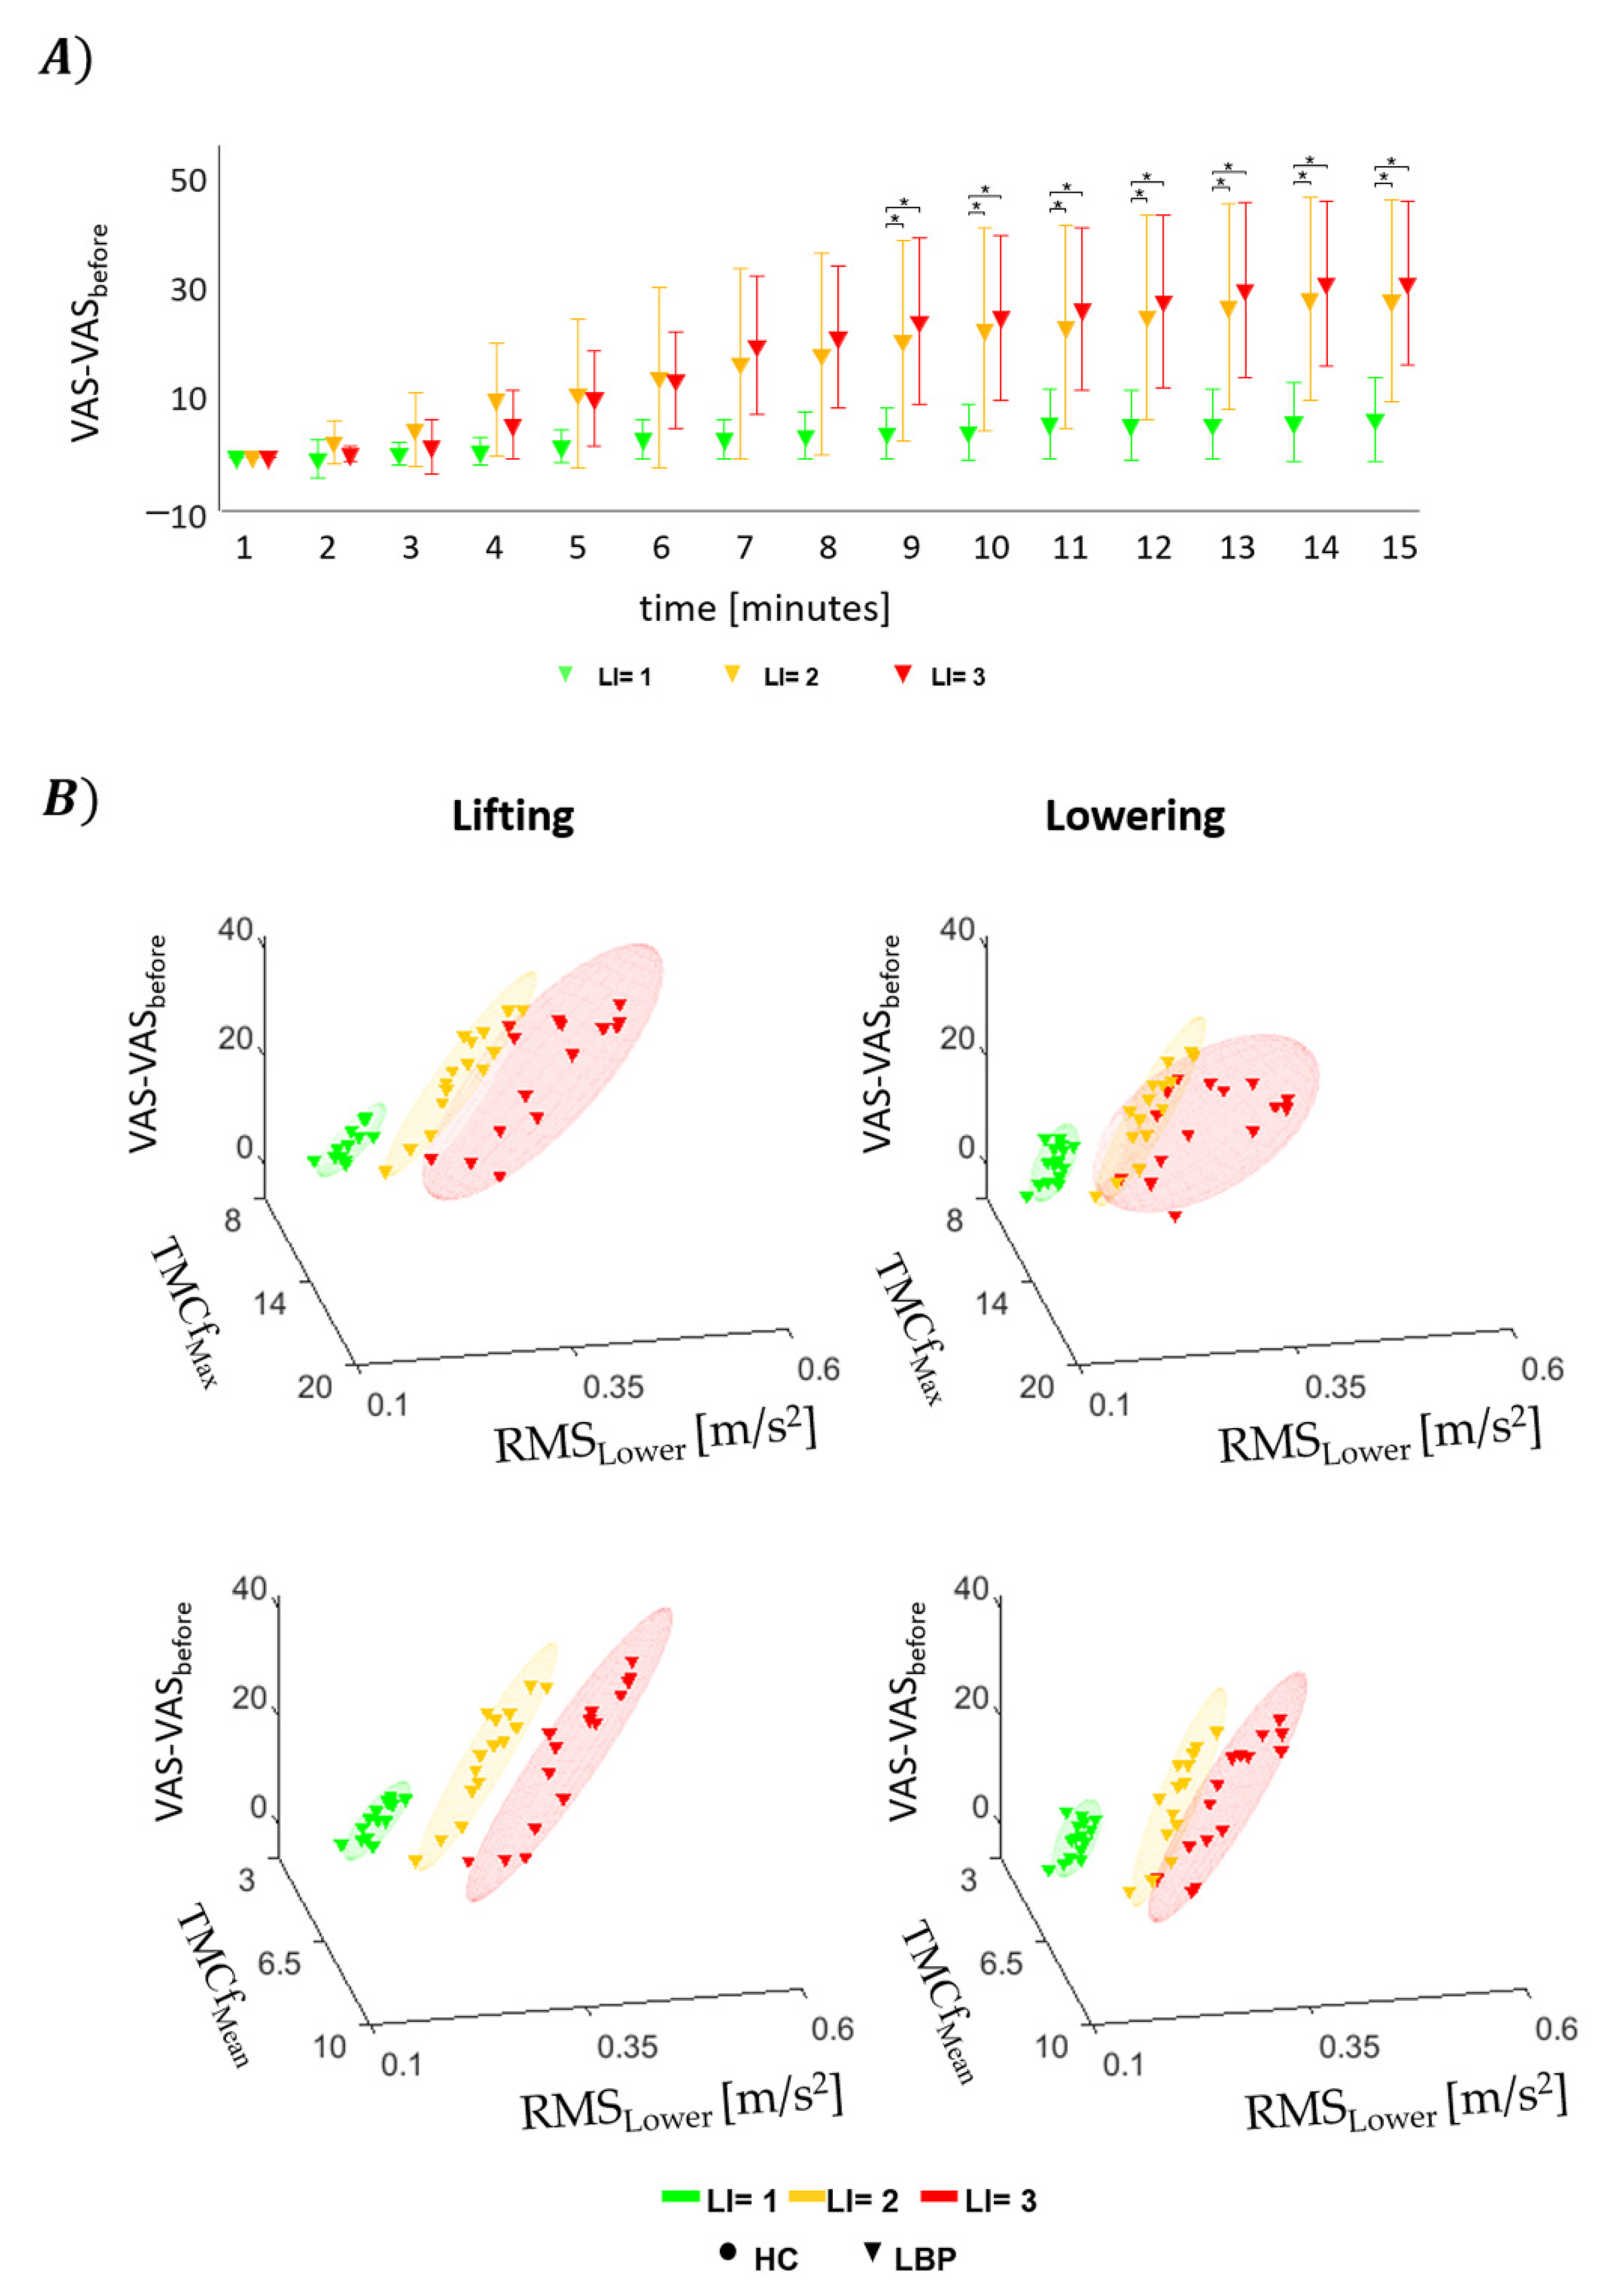
3.4. Questionnaires
4. Discussion
Author Contributions
Funding
Institutional Review Board Statement
Informed Consent Statement
Data Availability Statement
Acknowledgments
Conflicts of Interest
References
- Kuijer, P.P.; Verbeek, J.H.; Visser, B.; Elders, L.A.; Van Roden, N.; Van den Wittenboer, M.E.; Lebbink, M.; Burdorf, A.; Hulshof, C.T. An evidence based multidisciplinary practice guideline to reduce the workload due to lifting for preventing work-related low back pain. Ann. Occup. Environ. Med. 2014, 26, 16. [Google Scholar] [CrossRef] [PubMed] [Green Version]
- Lu, M.L.; Waters, T.R.; Krieg, E.; Werren, D. Efficacy of the revised NIOSH lifting equation to predict risk of low-back pain associated with manual lifting: A one-year prospective study. Hum. Factors 2014, 56, 73–85. [Google Scholar] [CrossRef] [PubMed]
- Garg, A.; Boda, S.; Hegmann, K.T.; Moore, J.S.; Kapellusch, J.M.; Bhoyar, P.; Thiese, M.S.; Merryweather, A.; Deckow-Schaefer, G.; Bloswick, D.; et al. The NIOSH lifting equation and low-back pain, Part 1: Association with low-back pain in the backworks prospective cohort study. Hum. Factors 2014, 56, 6–28. [Google Scholar] [CrossRef] [PubMed] [Green Version]
- Garg, A.; Kapellusch, J.M.; Hegmann, K.T.; Moore, J.S.; Boda, S.; Bhoyar, P.; Thiese, M.S.; Merryweather, A.; Deckow-Schaefer, G.; Bloswick, D.; et al. The NIOSH lifting equation and low-back pain, Part 2: Association with seeking care in the backworks prospective cohort study. Hum. Factors 2014, 56, 44–57. [Google Scholar] [CrossRef] [Green Version]
- Griffith, L.E.; Shannon, H.S.; Wells, R.P.; Walter, S.D.; Cole, D.C.; Côté, P.; Frank, J.; Hogg-Johnson, S.; Langlois, L.E. Individual participant data meta-analysis of mechanical workplace risk factors and low back pain. Am. J. Public Health 2012, 102, 309–318. [Google Scholar] [CrossRef]
- Kwon, B.K.; Roffey, D.M.; Bishop, P.B.; Dagenais, S.; Wai, E.K. Systematic review: Occupational physical activity and low back pain. Occup. Med. 2011, 61, 541–548. [Google Scholar] [CrossRef] [Green Version]
- Wai, E.K.; Roffey, D.M.; Bishop, P.; Kwon, B.K.; Dagenais, S. Causal assessment of occupational lifting and low back pain: Results of a systematic review. Spine J. 2010, 10, 554–566. [Google Scholar] [CrossRef]
- Bakker, E.W.; Verhagen, A.P.; van Trijffel, E.; Lucas, C.; Koes, B.W. Spinal mechanical load as a risk factor for low back pain: A systematic review of prospective cohort studies. Spine 2009, 34, E281–E293. [Google Scholar] [CrossRef]
- Hoogendoorn, W.E.; Bongers, P.M.; de Vet, H.C.W.; Ariëns, G.A.; van Mechelen, W.; Bouter, L.M. High physical work load and low job satisfaction increase the risk of sickness absence due to low back pain: Results of a prospective cohort study. Occup. Environ. Med. 2002, 59, 323–328. [Google Scholar] [CrossRef] [Green Version]
- Westgaard, R.H.; Winkel, J. Ergonomic intervention research for improved musculoskeletal health: A critical review. Int. J. Ind. Ergon. 1997, 20, 463–500. [Google Scholar] [CrossRef]
- Burgess-Limerick, R. Participatory ergonomics: Evidence and implementation lessons. Appl. Ergon. 2018, 68, 289–293. [Google Scholar] [CrossRef]
- Waters, T.R.; Putz-Anderson, V.; Garg, A. Applications Manual for the Revised NIOSH Lifting Equation; U.S. Department of Health and Human Services: Cincinnati, OH, USA, 1994. [Google Scholar]
- Waters, T.R.; Putz-Anderson, V.; Garg, A.; Fine, L.J. Revised NIOSH equation for the design and evaluation of manual lifting tasks. Ergonomics 1993, 36, 749–776. [Google Scholar] [CrossRef] [PubMed]
- Waters, T.R.; Lu, M.L.; Piacitelli, L.A.; Werren, D.; Deddens, J.A. Efficacy of the revised NIOSH lifting equation to predict risk of low back pain due to manual lifting: Expanded cross-sectional analysis. J. Occup. Environ. Med. 2011, 53, 1061–1067. [Google Scholar] [CrossRef] [PubMed]
- Ranavolo, A.; Draicchio, F.; Varrecchia, T.; Silvetti, A.; Iavicoli, S. Wearable Monitoring Devices for Biomechanical Risk Assessment at Work: Current Status and Future Challenges—A Systematic Review. Int. J. Environ. Res. Public Health 2018, 15, 2001. [Google Scholar] [CrossRef] [PubMed] [Green Version]
- Varrecchia, T.; De Marchis, C.; Draicchio, F.; Schmid, M.; Conforto, S.; Ranavolo, A. Lifting activity assessment using kinematic features and neural networks. Appl. Sci. 2020, 10, 1989. [Google Scholar] [CrossRef] [Green Version]
- Varrecchia, T.; De Marchis, C.; Rinaldi, M.; Draicchio, F.; Serrao, M.; Schmid, M.; Conforto, S.; Ranavolo, A. Lifting activity assessment using surface electromyographic features and neural networks. Int. J. Ind. Ergon. 2018, 66, 1–9. [Google Scholar] [CrossRef]
- Ranavolo, A.; Mari, S.; Conte, C.; Serrao, M.; Silvetti, A.; Iavicoli, S.; Draicchio, F. A new muscle coactivation index for biomechanical load evaluation in work activities. Ergonomics 2015, 58, 966–979. [Google Scholar] [CrossRef]
- Ranavolo, A.; Varrecchia, T.; Rinaldi, M.; Silvetti, A.; Serrao, M.; Conforto, S.; Draicchio, F. Mechanical lifting energy consumption in work activities designed by means of the “revised NIOSH lifting equation”. Ind. Health 2017, 55, 444–454. [Google Scholar] [CrossRef] [Green Version]
- Ranavolo, A.; Varrecchia, T.; Iavicoli, S.; Marchesi, A.; Rinaldi, M.; Serrao, M.; Conforto, S.; Cesarelli, M.; Draicchio, F. Surface electromyography for risk assessment in work activities designed using the “revised NIOSH lifting equation”. Int. J. Ind. Ergon. 2018, 68, 34–45. [Google Scholar] [CrossRef]
- Dean, S.G.; Hudson, S.; Hay-Smith, E.J.C.; Milosavljevic, S. Rural workers’ experience of low back pain: Exploring why they continue to work. J. Occup. Rehabil. 2011, 21, 395–409. [Google Scholar] [CrossRef]
- Trost, Z.; France, C.R.; Sullivan, M.J.; Thomas, J.S. Pain-related fear predicts reduced spinal motion following experimental back injury. Pain 2012, 153, 1015–1021. [Google Scholar] [CrossRef] [PubMed]
- Griffioen, M.; van Drunen, P.; Maaswinkel, E.; Perez, R.S.G.M.; Happee, R.; van Dieën, J.H. Identification of intrinsic and reflexive contributions to trunk stabilization in patients with low back pain: A case-control study. Eur. Spine J. 2020, 29, 1900–1908. [Google Scholar] [CrossRef] [PubMed] [Green Version]
- Hodges, P.; van den Hoorn, W.; Dawson, A.; Cholewicki, J. Changes in the mechanical properties of the trunk in low back pain may be associated with recurrence. J. Biomech. 2009, 42, 61–66. [Google Scholar] [CrossRef] [PubMed]
- Granata, K.P.; Marras, W.S. Cost-benefit of muscle cocontraction in protecting against spinal instability. Spine 2000, 25, 1398–1404. [Google Scholar] [CrossRef] [PubMed]
- Marras, W.S.; Mirka, G.A. Electromyographic studies of the lumbar trunk musculature during the generation of lowlevel trunk acceleration. J. Orthop. Res. 1993, 11, 811–817. [Google Scholar] [CrossRef]
- Kiers, H.; van Dieën, J.H.; Brumagne, S.; Vanhees, L. Postural sway and integration of proprioceptive signals in subjects with LBP. Hum. Mov. Sci. 2015, 39, 109–120. [Google Scholar] [CrossRef] [Green Version]
- Rinaldi, M.; D’Anna, C.; Schmid, M.; Conforto, S. Assessing the influence of SNR and pre-processing filter bandwidth on the extraction of different muscle co-activation indexes from surface EMG data. J. Electromyogr. Kinesiol. 2018, 43, 184–192. [Google Scholar] [CrossRef]
- Le, P.; Aurand, A.; Dufour, J.S.; Knapik, G.G.; Best, T.M.; Khan, S.N.; Mendel, E.; Marras, W.S. Development and testing of a moment-based coactivation index to assess complex dynamic tasks for the lumbar spine. Clin. Biomech. 2017, 46, 23–32. [Google Scholar] [CrossRef]
- Rosa, M.C.; Marques, A.; Demain, S.; Metcalf, C.D.; Rodrigues, J. Methodologies to assess muscle co-contraction during gait in people with neurological impairment—A systematic literature review. J. Electromyogr. Kinesiol. 2014, 24, 179–191. [Google Scholar] [CrossRef]
- Olney, S.J. Quanitative Evaluation of Cocontraction of Knee and Ankle Muscles in Normal Walking; Human Kinetics Publishers: Champaign, IL, USA, 1985. [Google Scholar]
- Frost, G.; Dowling, J.; Dyson, K.; Bar-Or, O. Cocontraction in Three Age Groups of Children during Treadmill Locomotion. J. Electromyogr. Kinesiol. 1997, 7, 179–186. [Google Scholar] [CrossRef]
- Winter, D.A. Biomechanics and Motor Control of Human Movement, 4th ed.; John Wiley & Sons, Inc.: Hoboken, NJ, USA; University of Waterloo: Waterloo, ON, Canada, 2009. [Google Scholar]
- Falconer, F.K.; Winter, D. Quantitative Assessment of Cocontraction at the Ankle Joint during Walking. Electromyogr. Clin. Neurophysiol. 1985, 25, 135–149. [Google Scholar] [PubMed]
- Macaluso, A.; Nimmo, M.A.; Foster, J.E.; Cockburn, M.; McMillan, N.C.; De Vito, G. Contractile Muscle Volume and Agonist–Antagonist Coactivation Account for Differences in Torque Between Young and Older Women. Muscle Nerve 2002, 25, 858–863. [Google Scholar] [CrossRef] [PubMed]
- Brookham, R.L.; Middlebrook, E.E.; Grewal, T.J.; Dickerson, C.R. The Utility of an Empirically Derived Coactivation Ratio for Muscle Force Prediction Through Optimization. J. Biomech. 2011, 44, 1582–1587. [Google Scholar] [CrossRef] [PubMed]
- Lewek, M.D.; Rudolph, K.S.; Snyder-Mackler, L. Control of Frontal Plane Knee Laxity during Gait in Patients with Medial Compartment Knee Osteoarthritis. Osteoarthr. Cartil. 2004, 12, 745–751. [Google Scholar] [CrossRef] [PubMed] [Green Version]
- Childs, J.D.; Sparto, P.J.; Fitzgerald, G.K.; Bizzini, M.; Irrgang, J.J. Alterations in Lower Extremity Movement and Muscle Activation Patterns in Individuals with Knee Osteoarthritis. Clin. Biomech. 2004, 19, 44–49. [Google Scholar] [CrossRef] [PubMed]
- Griffin, T.; Guilak, F. The Role of Mechanical Loading in the Onset and Progression of Osteoarthritis. Exerc. Sport Sci. Rev. 2005, 33, 195–200. [Google Scholar] [CrossRef]
- Collins, A.; Blackburn, J.T.; Olcott, C.; Yu, B.; Weinhold, P. The Impact of Stochastic Resonance Electrical Stimulation and Knee Sleeve on Impulsive Loading and Muscle Co-contraction during Gait in Knee Osteoarthritis. Clin. Biomech. 2011, 26, 853–858. [Google Scholar] [CrossRef]
- Granata, K.P.; Marras, W.S. An EMG-assisted Model of Loads on the Lumbar Spine during Asymmetric Trunk Extensions. J. Biomech. 1993, 26, 1429–1438. [Google Scholar] [CrossRef]
- Granata, K.P.; Marras, W.S. The Influence of Trunk Muscle Coactivity on Dynamic Spinal Loads. Spine 1995, 20, 913–919. [Google Scholar] [CrossRef]
- Marras, W.S.; Granata, K.P. Spine Loading During Trunk Lateral Bending Motions. J. Biomech. 1996, 30, 697–703. [Google Scholar] [CrossRef]
- Varrecchia, T.; Ranavolo, A.; Conforto, S.; De Nunzio, A.M.; Arvanitidis, M.; Draicchio, F.; Falla, D. Bipolar versus high-density surface electromyography for evaluating risk in fatiguing frequency-dependent lifting activities. Appl. Ergon. 2021, 95, 103456. [Google Scholar] [CrossRef]
- Moore, S.M.; Torma-Krajewski, J.; Steiner, L.J. Practical Demonstrations of Ergonomic Principles; Technical Report of investigations for National Institute for Occupational Safety and Health, 9684; DHHS Publication: Washington, DC, USA, 2011. [Google Scholar]
- Filho, J.C.; Gobbi, L.T.; Gurjão, A.L.; Gonçalves, R.; Prado, A.K.; Gobbi, S. Effect of different rest intervals, between sets, on muscle performance during leg press exercise, in trained older women. J. Sports Sci. Med. 2013, 12, 138–143. [Google Scholar] [PubMed]
- Vera-Garcia, F.J.; Moreside, J.M.; McGill, S.M. MVC techniques to normalize trunk muscle EMG in healthy women. J. Electromyogr. Kinesiol. 2010, 20, 10–16. [Google Scholar] [CrossRef] [PubMed]
- Seniam. Available online: www.seniam.org (accessed on 9 October 2020).
- Barbero, M.; Merletti, R.; Rainoldi, A. Atlas of Muscle Innervation Zones: Understanding Surface Electromyography and Its Applications; Springer: New York, NY, USA, 2012. [Google Scholar] [CrossRef]
- Borg, G.A. Psychophysical bases of perceived exertion. Med. Sci. Sports Exerc. 1982, 14, 377–381. [Google Scholar] [CrossRef] [PubMed]
- Faiz, K.W. VAS—visuell analog skala [VAS—visual analog scale]. Tidsskr Nor Laegeforen 2014, 134, 323. [Google Scholar] [CrossRef] [PubMed]
- Fazio, P.; Granieri, G.; Casetta, I.; Cesnik, E.; Mazzacane, S.; Caliandro, P.; Pedrielli, F.; Granieri, E. Gait measures with a triaxial accelerometer among patients with neurological impairment. J. Neurol. Sci. 2013, 34, 435–440. [Google Scholar] [CrossRef] [PubMed]
- Muscillo, R.; Conforto, S.; Schmid, M.; Caselli, P.; D’Alessio, T. Classification of motor activities through derivative dynamic time warping applied on accelerometer data. In Proceedings of the 2007 29th Annual International Conference of the IEEE Engineering in Medicine and Biology Society, Lyon, France, 22–26 August 2007; pp. 4930–4933. [Google Scholar]
- Butler, H.L.; Newell, R.; Hubley-Kozey, C.L.; Kozey, J.W. The Interpretation of Abdominal Wall Muscle Recruitment Strategies Change when the Electrocardiogram (ECG) is Removed from the Electromyogram (EMG). J. Electromyogr. Kinesiol. 2009, 19, 102–113. [Google Scholar] [CrossRef]
- Drake, J.D.; Callaghan, J.P. Elimination of electrocardiogram contamination from electromyogram signals: An evaluation of currently used removal techniques. J. Electromyogr. Kinesiol. 2006, 16, 175–187. [Google Scholar] [CrossRef] [PubMed]
- Ranavolo. Principi di Elettromiografia di Superficie. Dal Potenziale D’azione alle Applicazioni nei Diversi Settori Della Medicina e Dell’ingegneria; Edizioni Universitarie Romane: Rome, Italy, 2021. [Google Scholar]
- Burden, A. How should we normalize electromyograms obtained from healthy participants? What we have learned from over 25 years of research. J. Electromyogr. Kinesiol. 2010, 20, 1023–1035. [Google Scholar] [CrossRef]
- Hermens, H.J.; Freriks, B.; Disselhorst-Klug, C.; Rau, G. Development of recommendations for SEMG sensors and sensor placement procedures. J. Electromyogr. Kinesiol. 2000, 10, 361–374. [Google Scholar] [CrossRef]
- Marras, W.S.; Davis, K.G. A non-MVC EMG normalization technique for the trunk musculature: Part 1. Method development. J. Electromyogr. Kinesiol. 2001, 11, 1–9. [Google Scholar] [CrossRef]
- Shirado, O.; Ito, T.; Kaneda, K.; Strax, T.E. Concentric and eccentric strength of trunk muscles: Influence of test postures on strength and characteristics of patients with chronic low-back pain. Arch. Phys. Med. Rehabil. 1995, 76, 604–611. [Google Scholar] [CrossRef]
- Cole, M.H.; Grimshaw, P.N. Low back pain and lifting: A review of epidemiology and aetiology. Work 2003, 21, 173–184. [Google Scholar] [PubMed]


| Task | LC (Kg) | H (Cm) | HM | V (Cm) | VM | D (Cm) | DM | A (°) | AM | F (Lift/Min) | FM | C | CM | L (KG) | RWL | LI |
|---|---|---|---|---|---|---|---|---|---|---|---|---|---|---|---|---|
| A | 23 | 44 | 0.57 | 75 | 0.99 | 40 | 0.93 | 0 | 1 | 4 | 0.83 | good | 1 | 10 | 10 | 1 |
| B | 23 | 44 | 0.57 | 75 | 0.99 | 40 | 0.93 | 0 | 1 | 11 | 0.41 | good | 1 | 10 | 5 | 2 |
| C | 23 | 44 | 0.57 | 75 | 0.99 | 40 | 0.93 | 0 | 1 | 15 | 0.28 | good | 1 | 10 | 3.33 | 3 |
| Scale | LI | HC (Mean ± SD) | LBP (Mean ± SD) |
|---|---|---|---|
| VAS Pain Intensity (0–100) | 1 | 1.4 ± 3.22 | 42.25 ± 28.48 |
| 2 | 4.73 ± 10.81 | 45.71 ± 17.7 | |
| 3 | 11.6 ± 22.78 | 45.4 ± 17.02 | |
| Borg Scale (6–20) | 1 | 7.53 ± 1.55 | 10.13 ± 2.47 |
| 2 | 9.2 ± 2.62 | 13.13 ± 1.96 | |
| 3 | 10.1 ± 2.65 | 13.5 ± 2.78 |
Publisher’s Note: MDPI stays neutral with regard to jurisdictional claims in published maps and institutional affiliations. |
© 2022 by the authors. Licensee MDPI, Basel, Switzerland. This article is an open access article distributed under the terms and conditions of the Creative Commons Attribution (CC BY) license (https://creativecommons.org/licenses/by/4.0/).
Share and Cite
Varrecchia, T.; Conforto, S.; De Nunzio, A.M.; Draicchio, F.; Falla, D.; Ranavolo, A. Trunk Muscle Coactivation in People with and without Low Back Pain during Fatiguing Frequency-Dependent Lifting Activities. Sensors 2022, 22, 1417. https://doi.org/10.3390/s22041417
Varrecchia T, Conforto S, De Nunzio AM, Draicchio F, Falla D, Ranavolo A. Trunk Muscle Coactivation in People with and without Low Back Pain during Fatiguing Frequency-Dependent Lifting Activities. Sensors. 2022; 22(4):1417. https://doi.org/10.3390/s22041417
Chicago/Turabian StyleVarrecchia, Tiwana, Silvia Conforto, Alessandro Marco De Nunzio, Francesco Draicchio, Deborah Falla, and Alberto Ranavolo. 2022. "Trunk Muscle Coactivation in People with and without Low Back Pain during Fatiguing Frequency-Dependent Lifting Activities" Sensors 22, no. 4: 1417. https://doi.org/10.3390/s22041417
APA StyleVarrecchia, T., Conforto, S., De Nunzio, A. M., Draicchio, F., Falla, D., & Ranavolo, A. (2022). Trunk Muscle Coactivation in People with and without Low Back Pain during Fatiguing Frequency-Dependent Lifting Activities. Sensors, 22(4), 1417. https://doi.org/10.3390/s22041417