
Study on Machine Learning Models for Building Resilience Evaluation in Mountainous Area: A Case Study of Banan District, Chongqing, China


Abstract
:1. Introduction
2. Study Area
3. Data and Methods
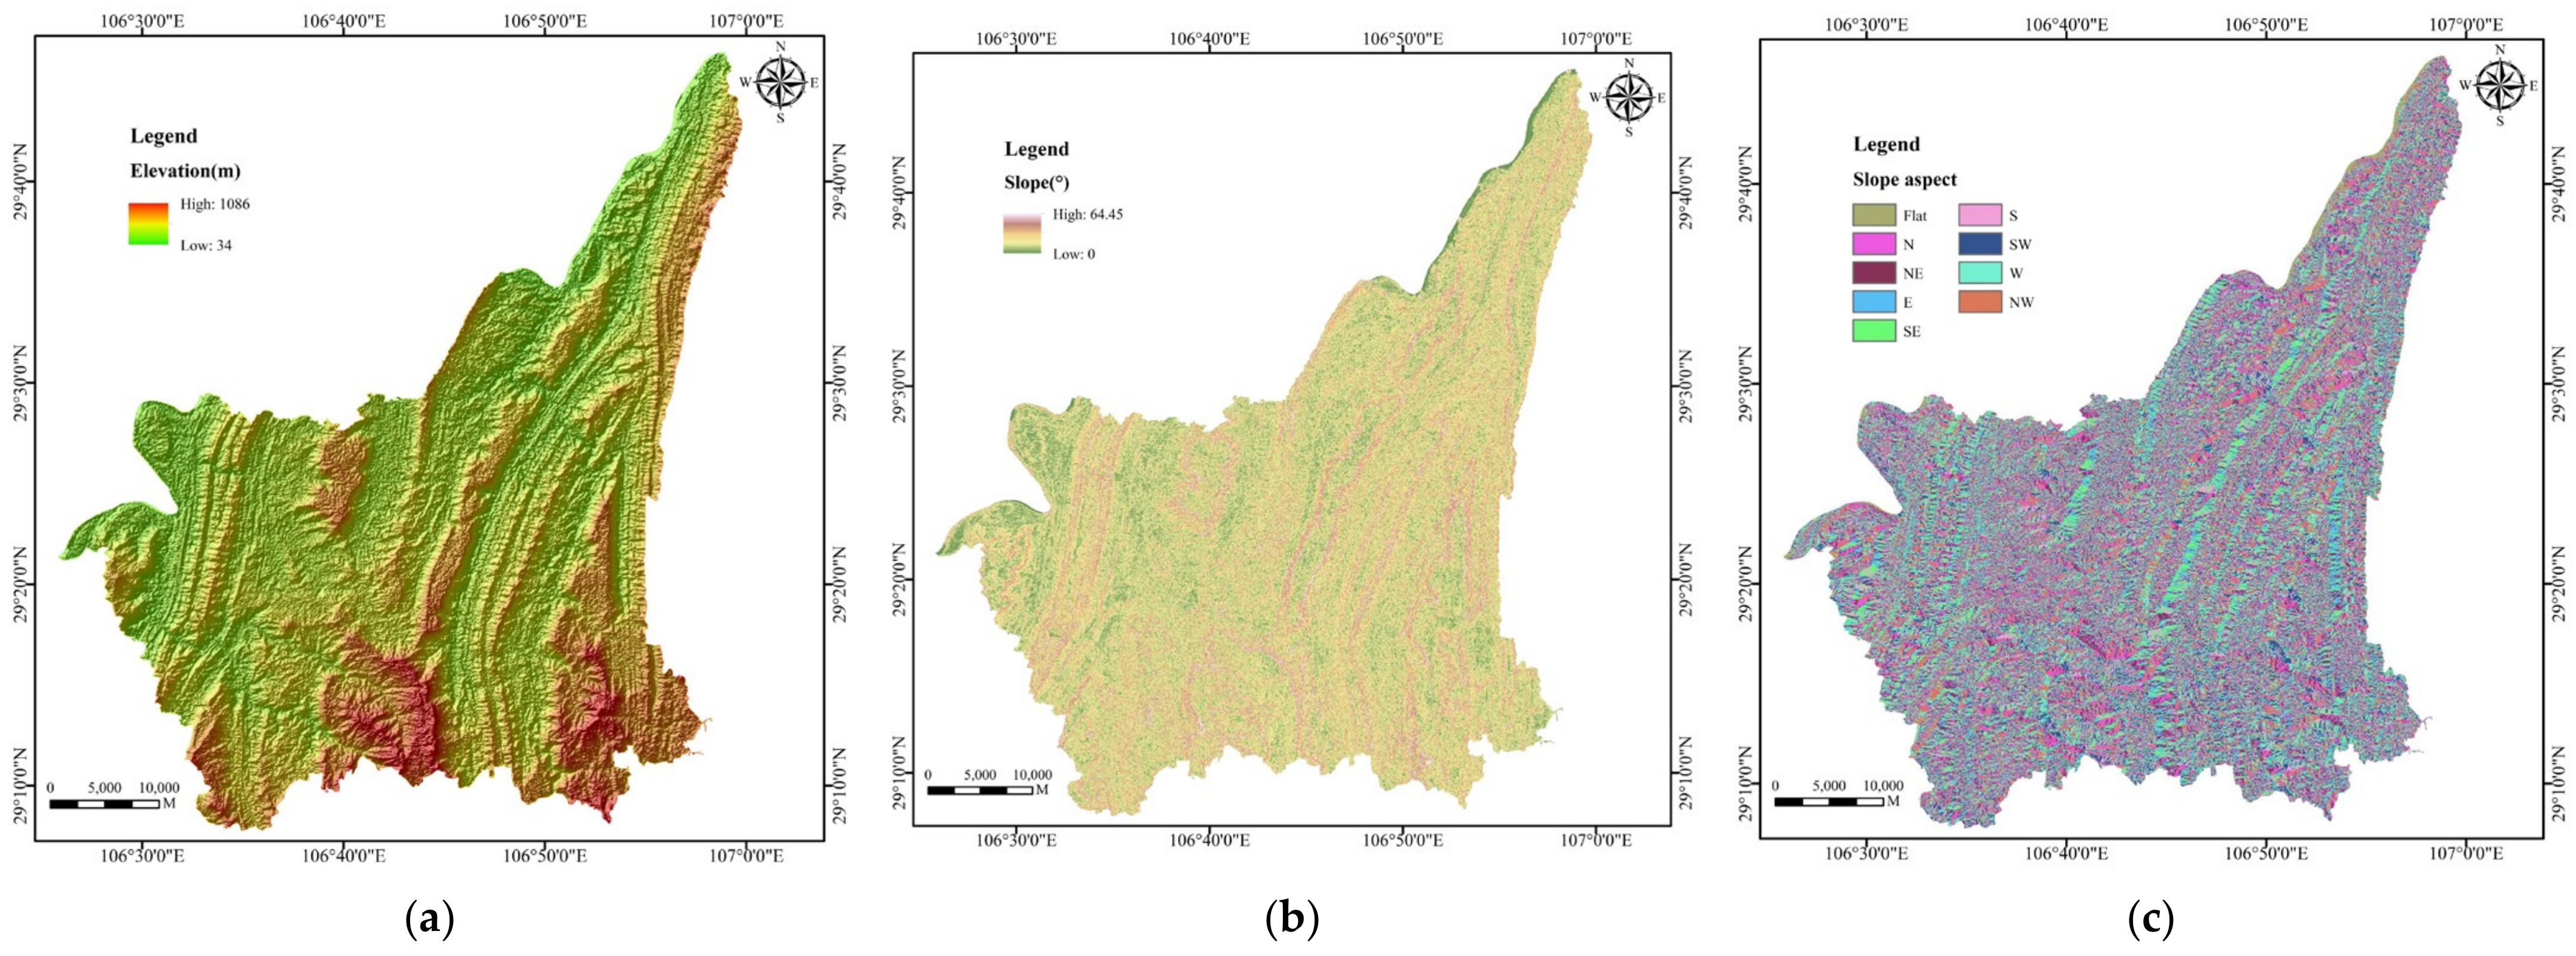
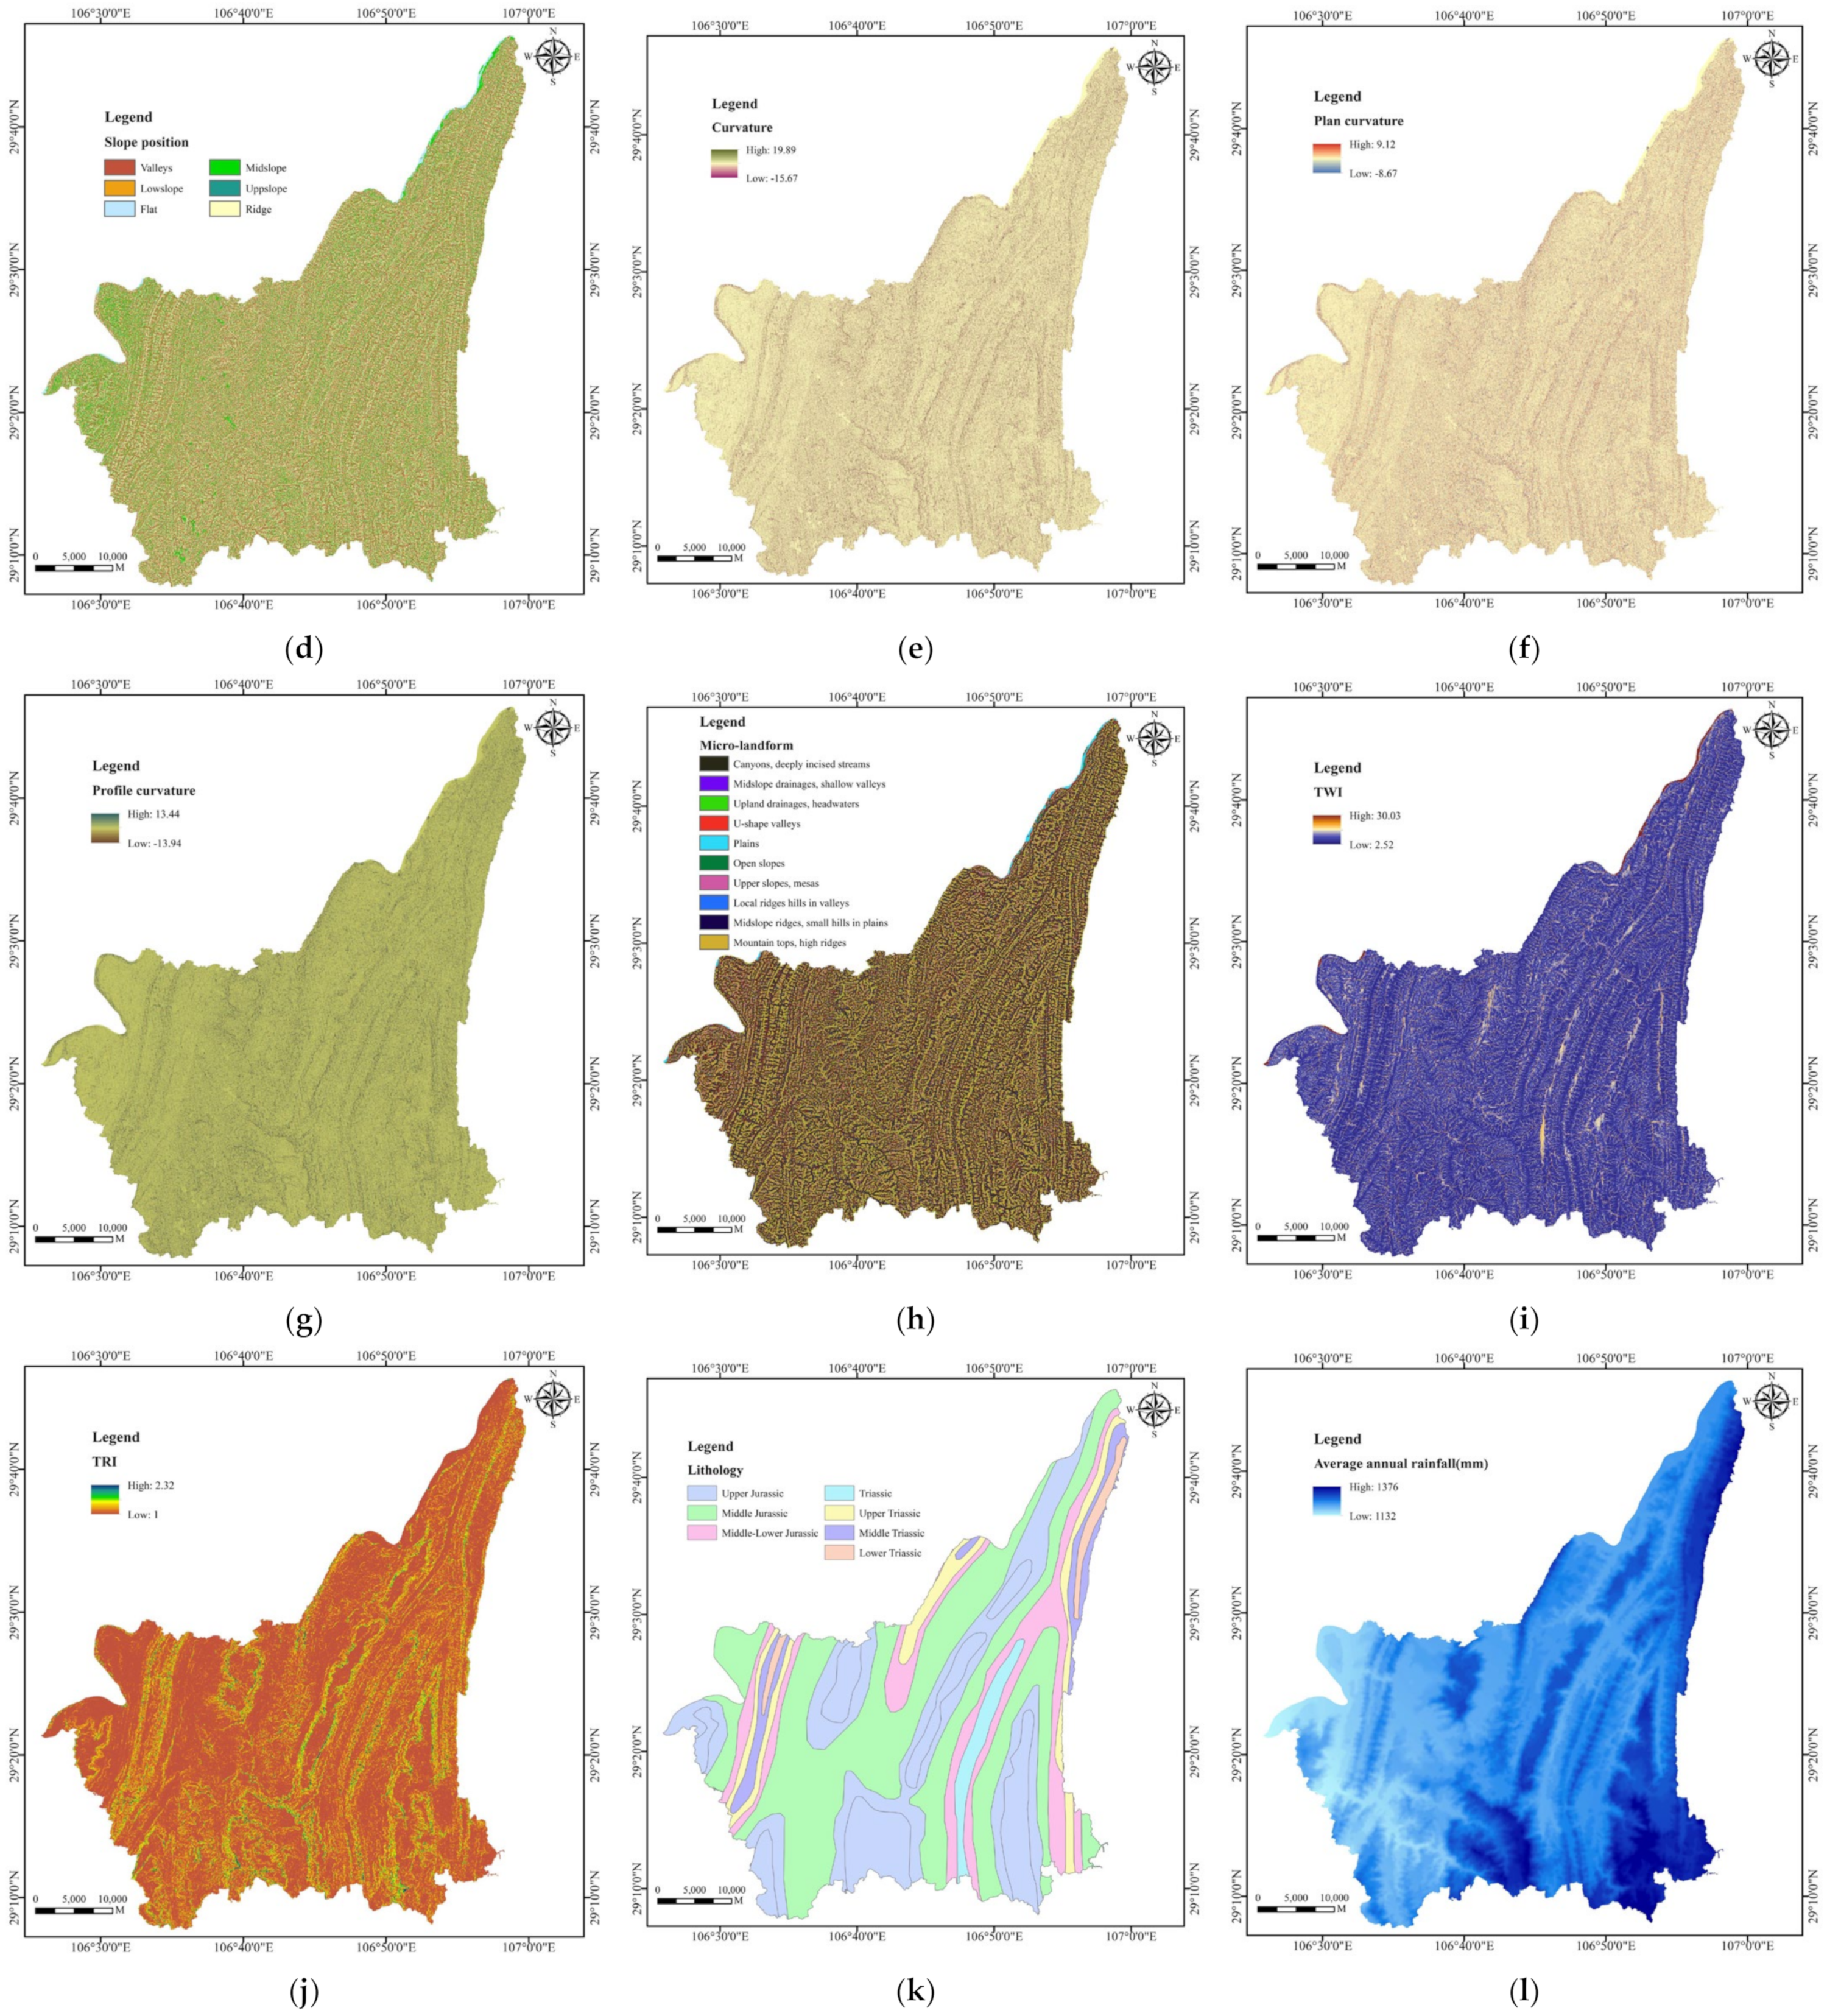
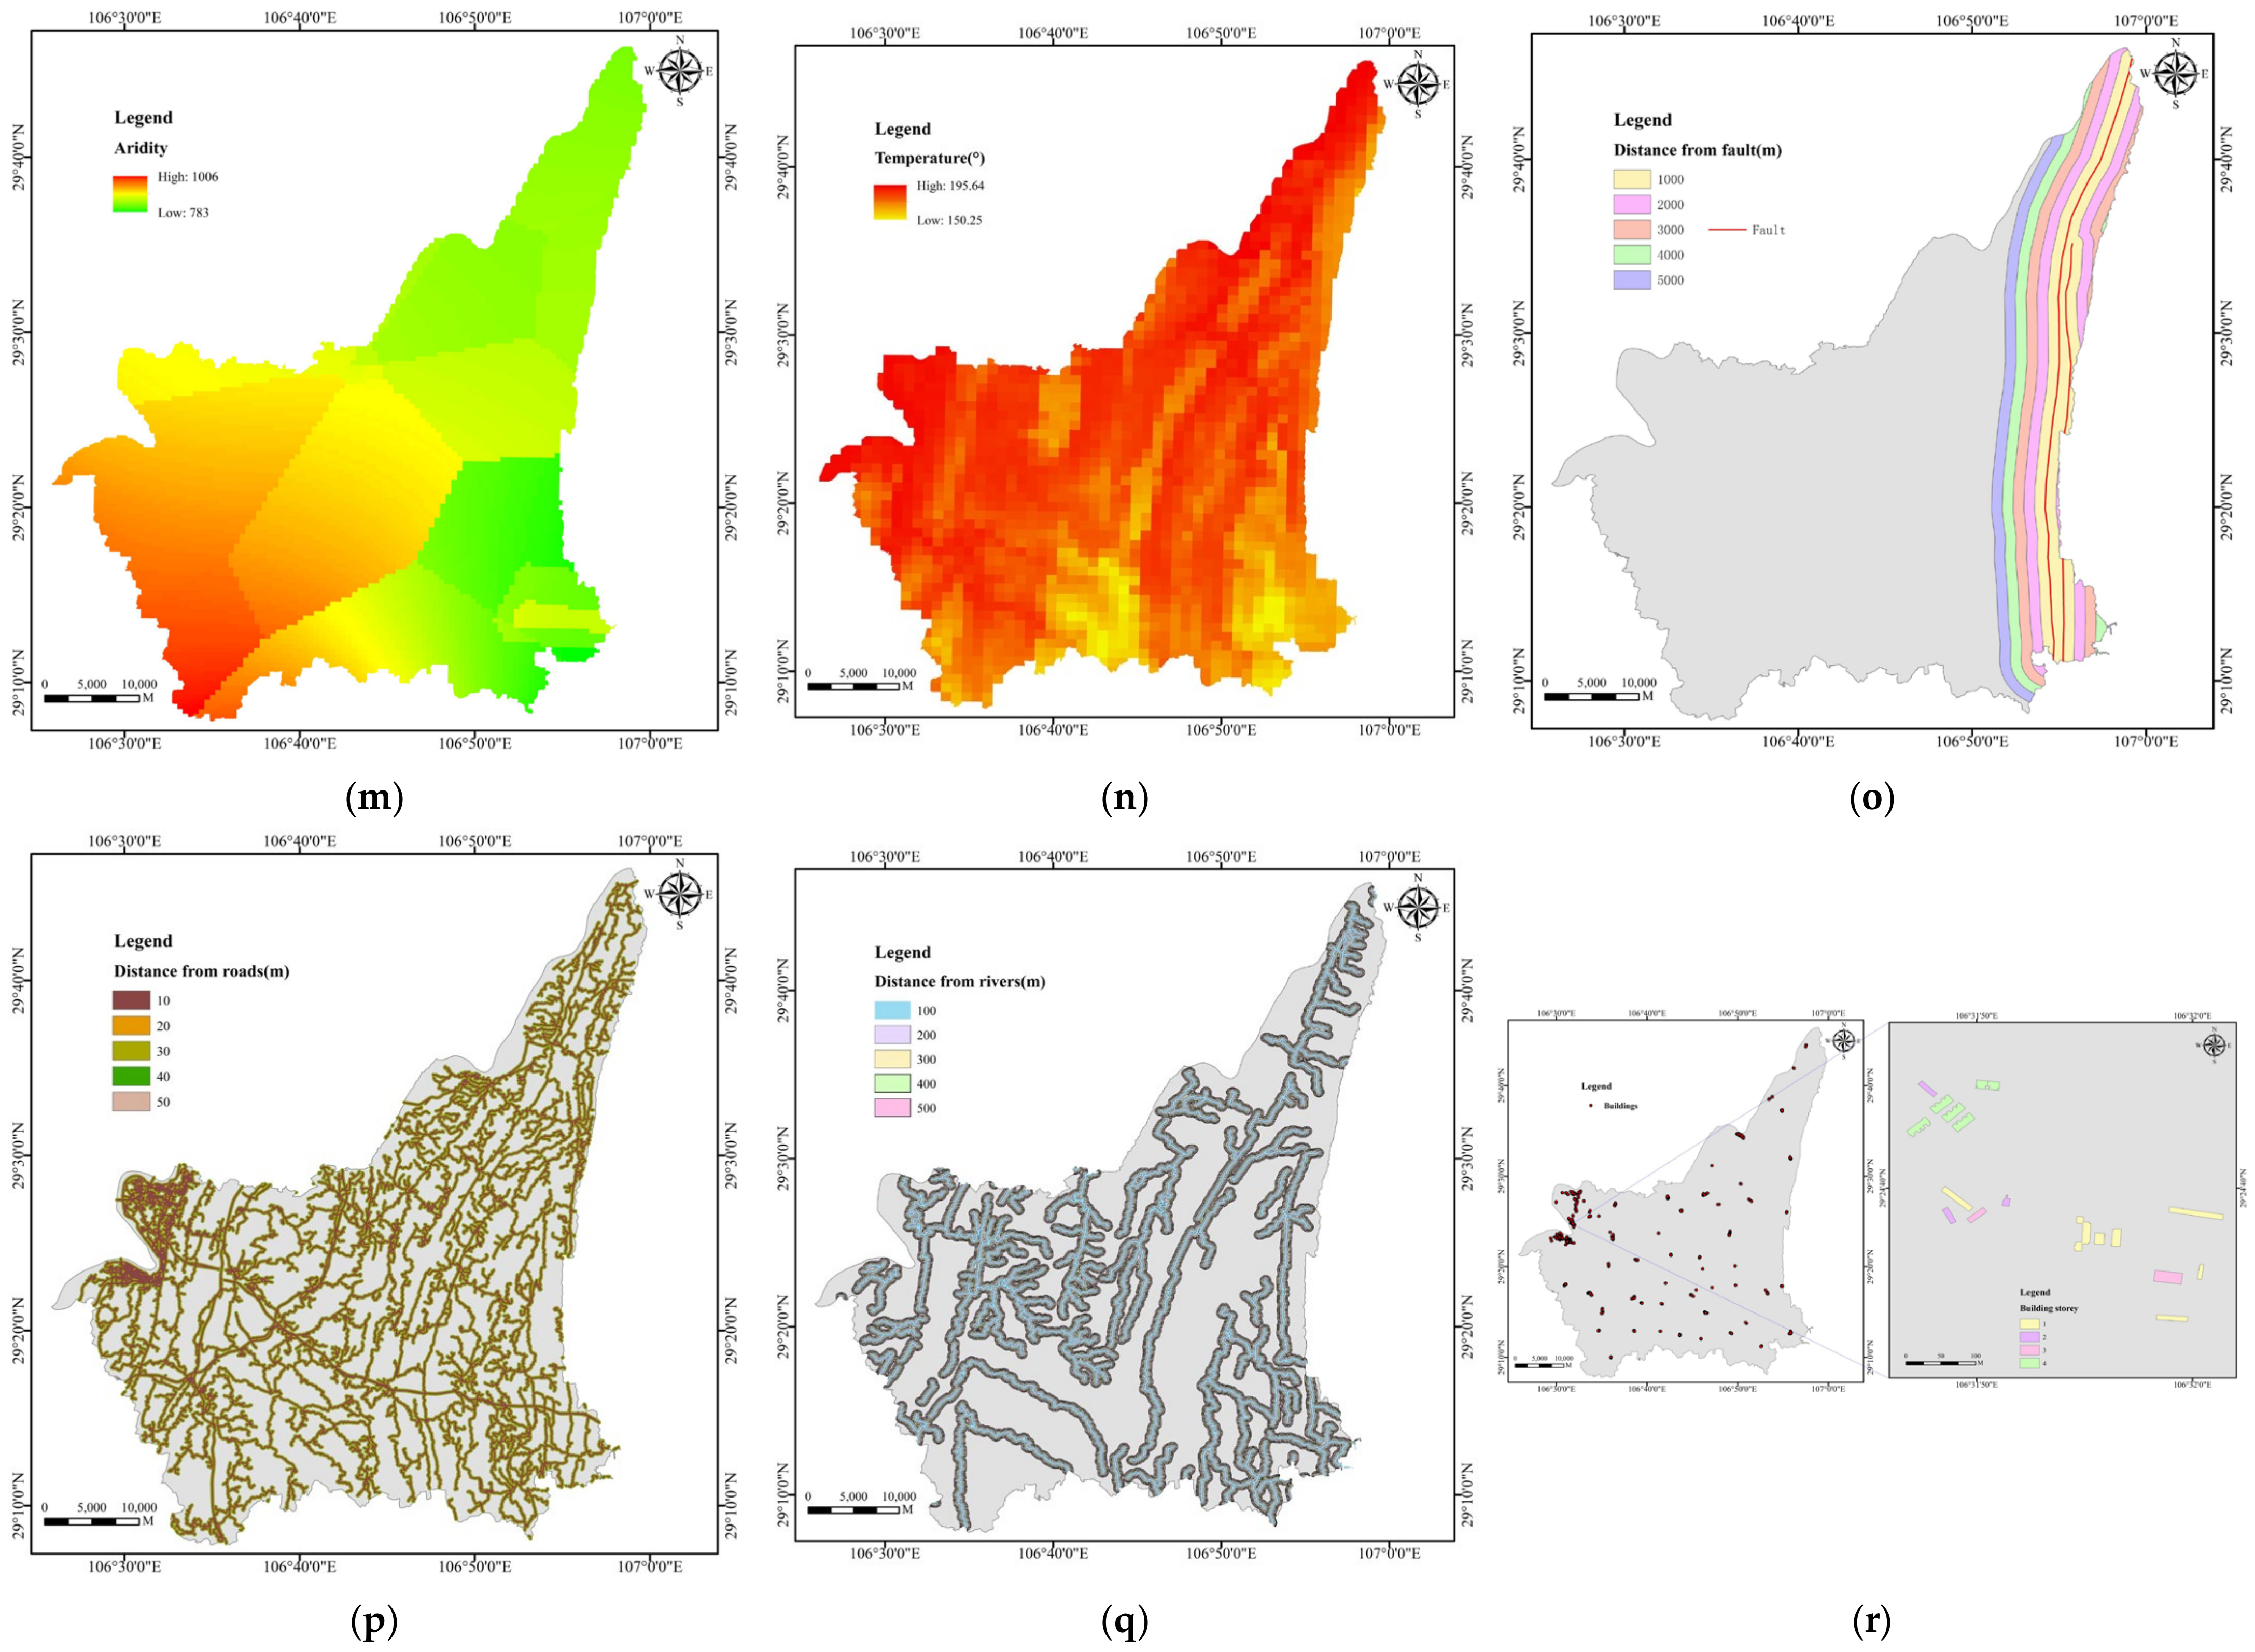
3.1. Data
3.1.1. Data Selection
3.1.2. Data Source
3.1.3. Data Processing
3.2. Methodology
3.2.1. Random Forest
3.2.2. Support Vector Machine
3.2.3. Feature Recursive Elimination
3.2.4. Model Evaluation Methods
4. Results and Discussion
4.1. Optimization Models of Building Resilience Based on Dominant Factors
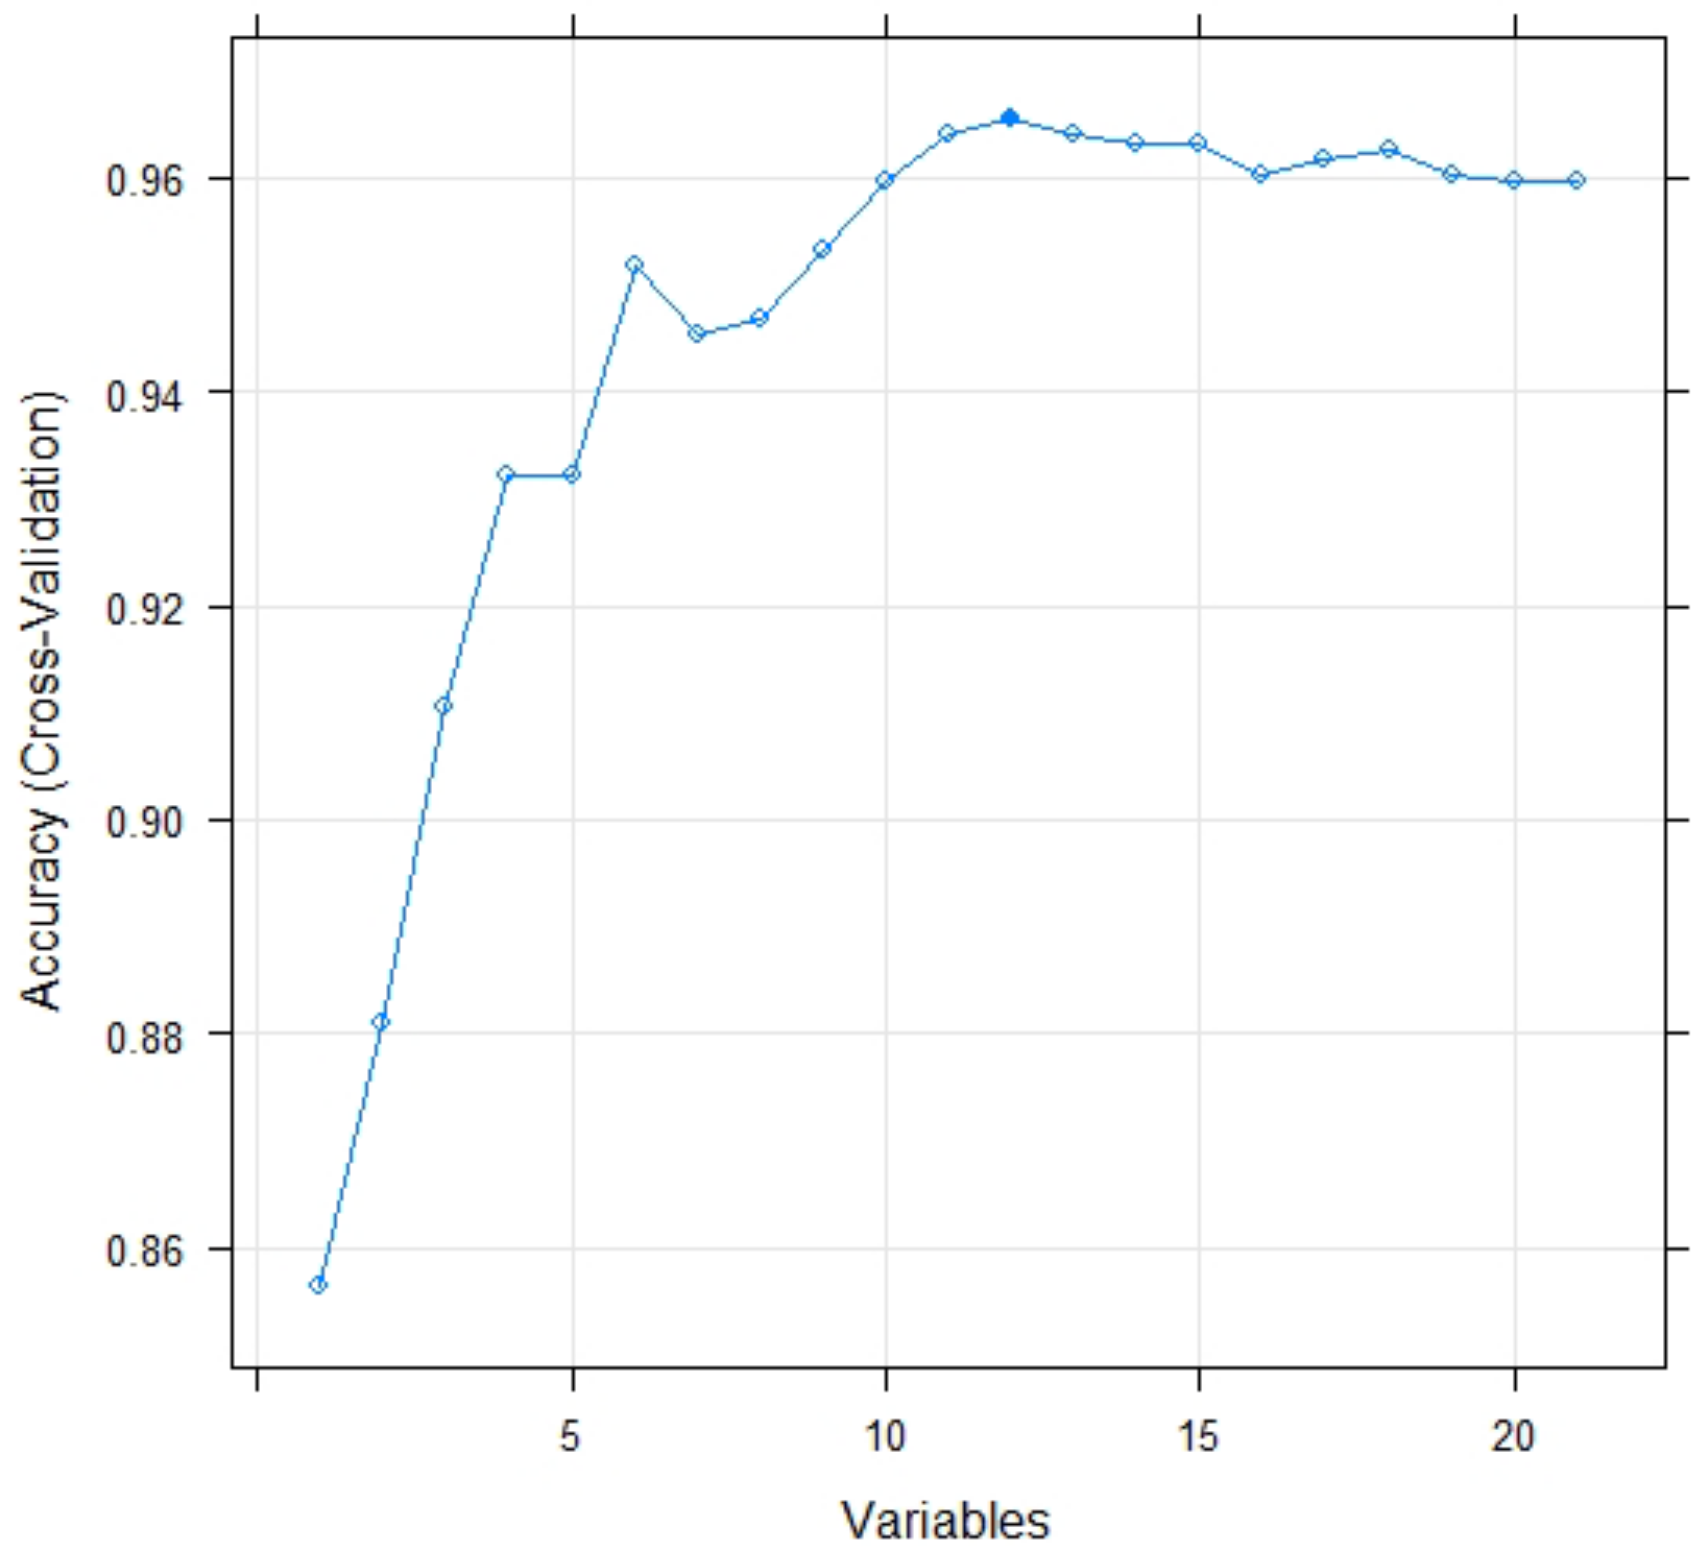
4.1.1. Screening of Dominant Factors
4.1.2. Optimization models’ results of building resilience based on dominant factors
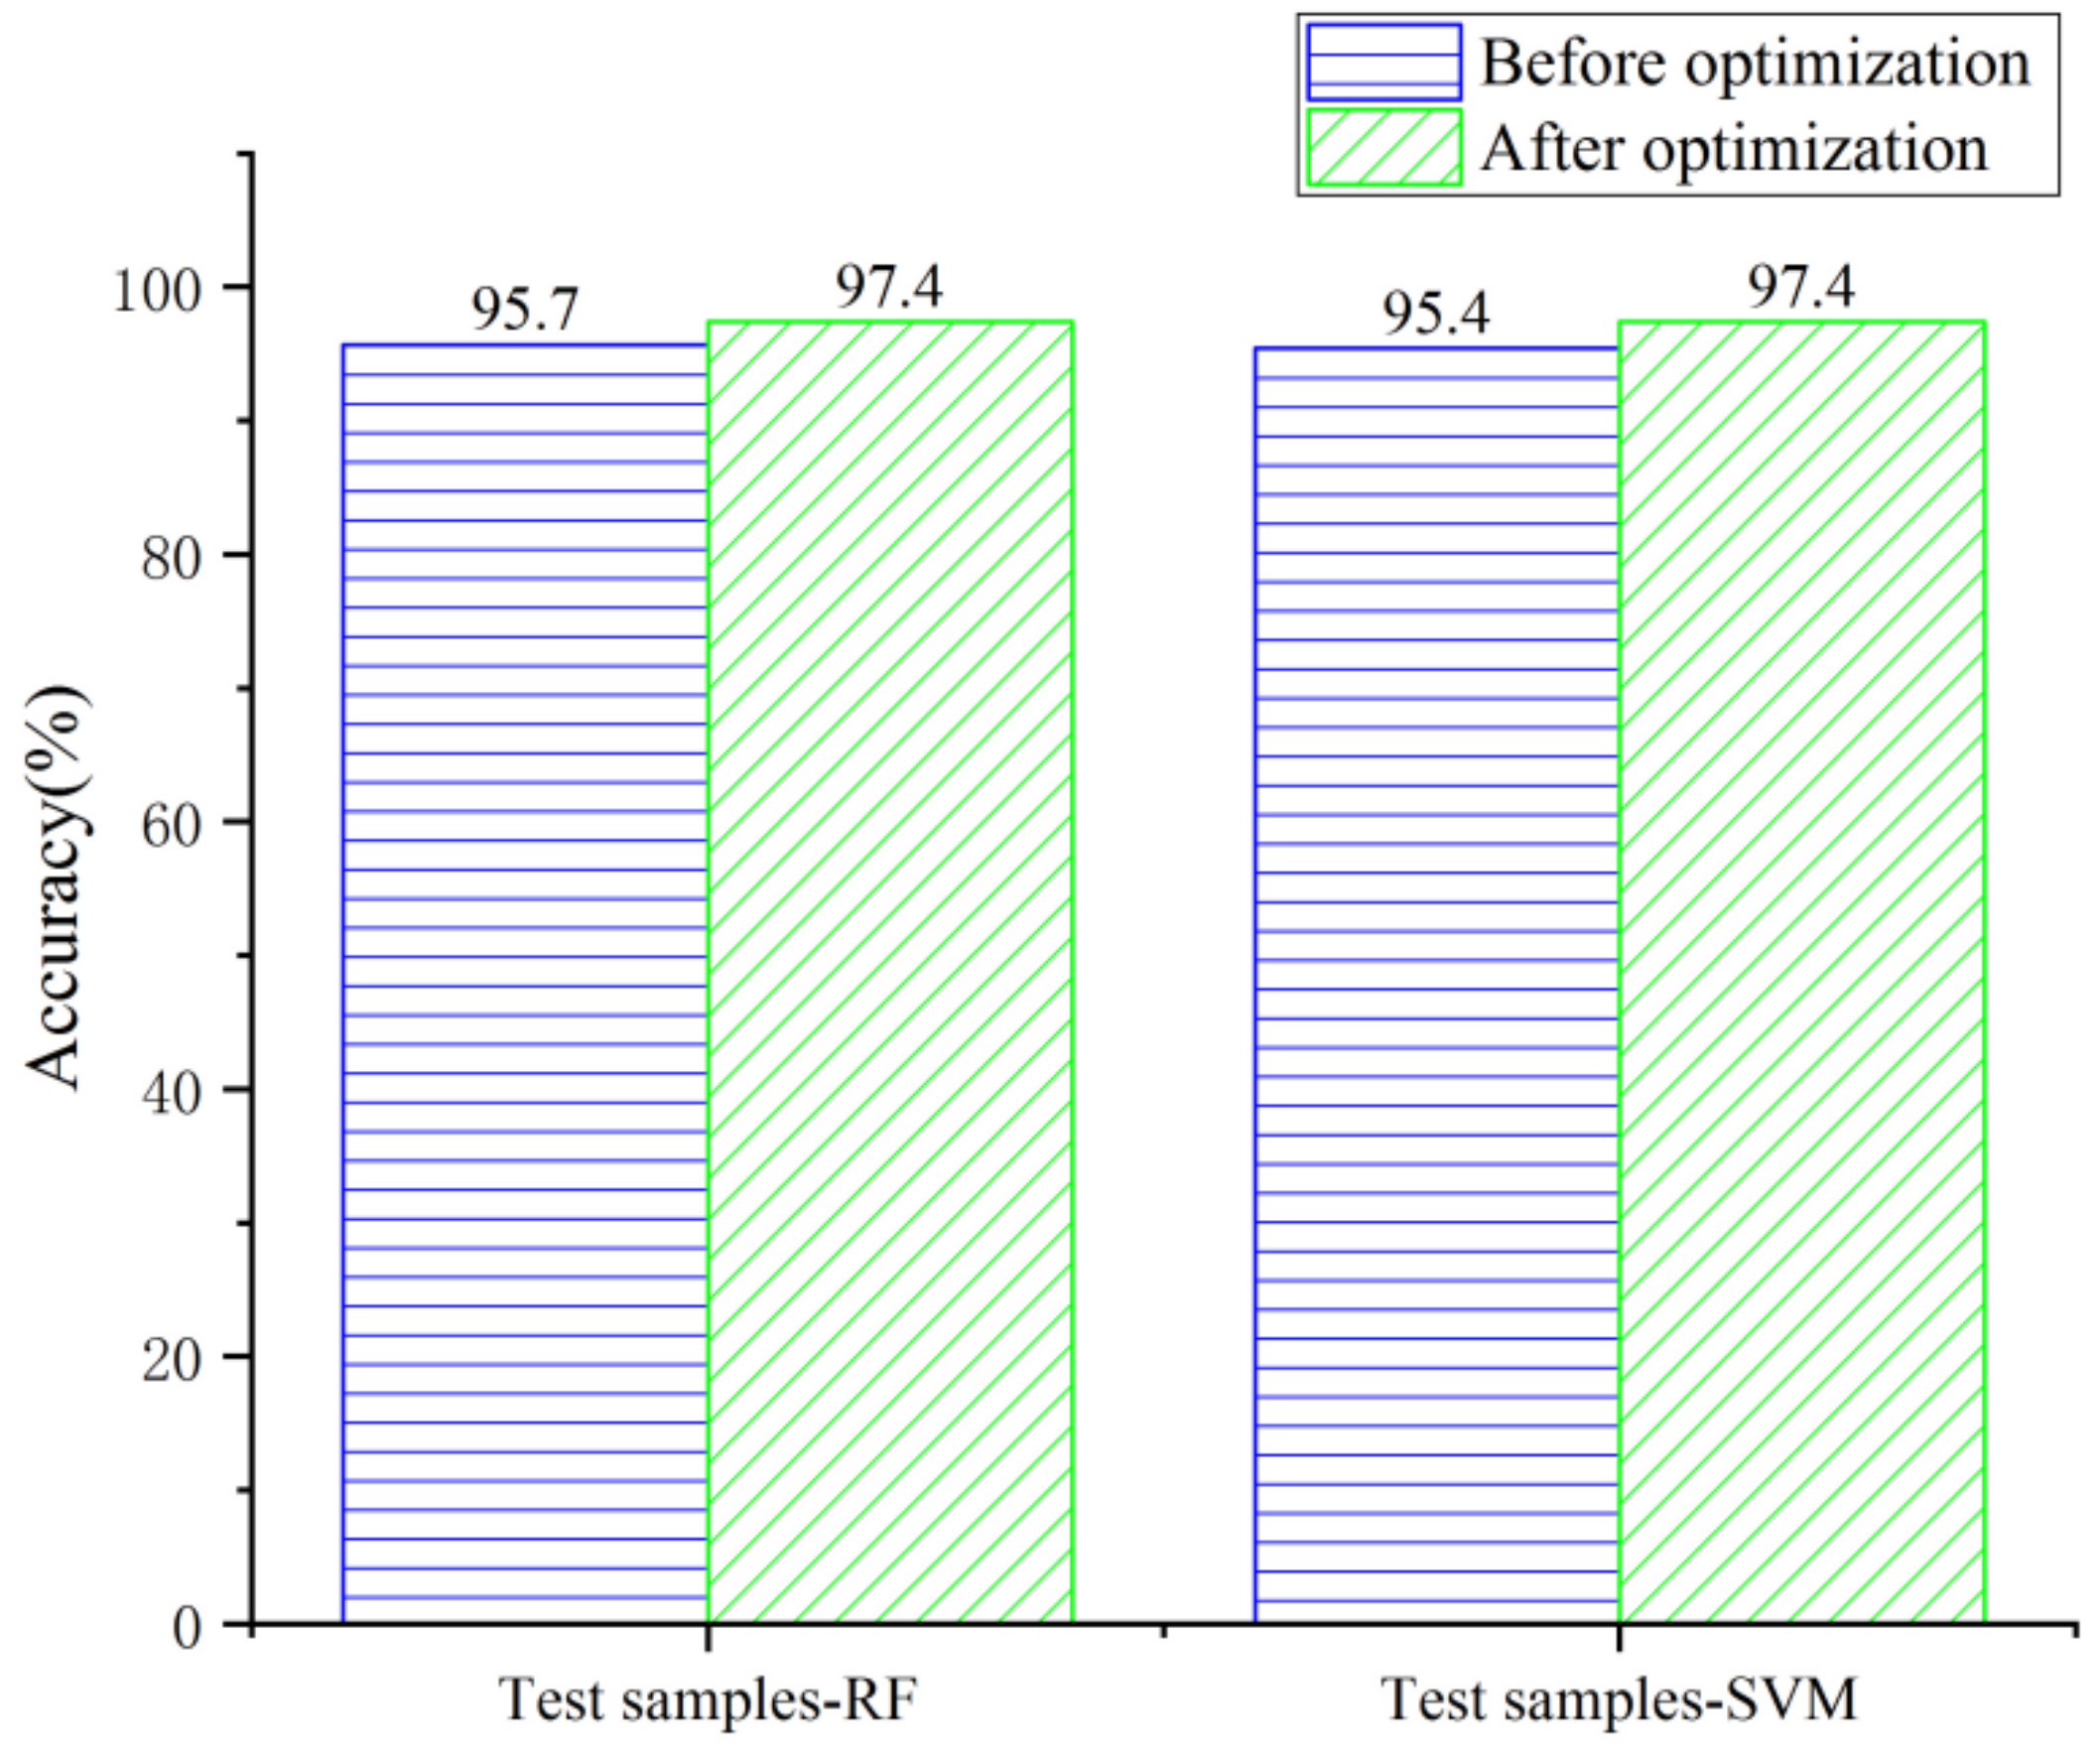
4.2. Optimization Effect Comparison
4.3. Discussion
4.3.1. Comparison of Two Machine Learning Models
4.3.2. Importance of Resilience Impact Factors
4.3.3. Model Improvement Options
5. Conclusions
- (1)
- By combining MDA and MDG to form a comprehensive measure, the impact factors of the optimization models were ranked in order of importance: building structure, TRI, building category, aridity, construction time, temperature, distance from rivers, lithology, building storey, elevation, distance from roads and average annual rainfall. In the respective rankings of MDA and MDG, the impact factors in the top three rankings are the same, and the remaining impact factors tend to differ between the two. The alternate arrangement of internal and external factors fully illustrates the necessity of exploring the combined effect of various factors on buildings in a mountainous area.
- (2)
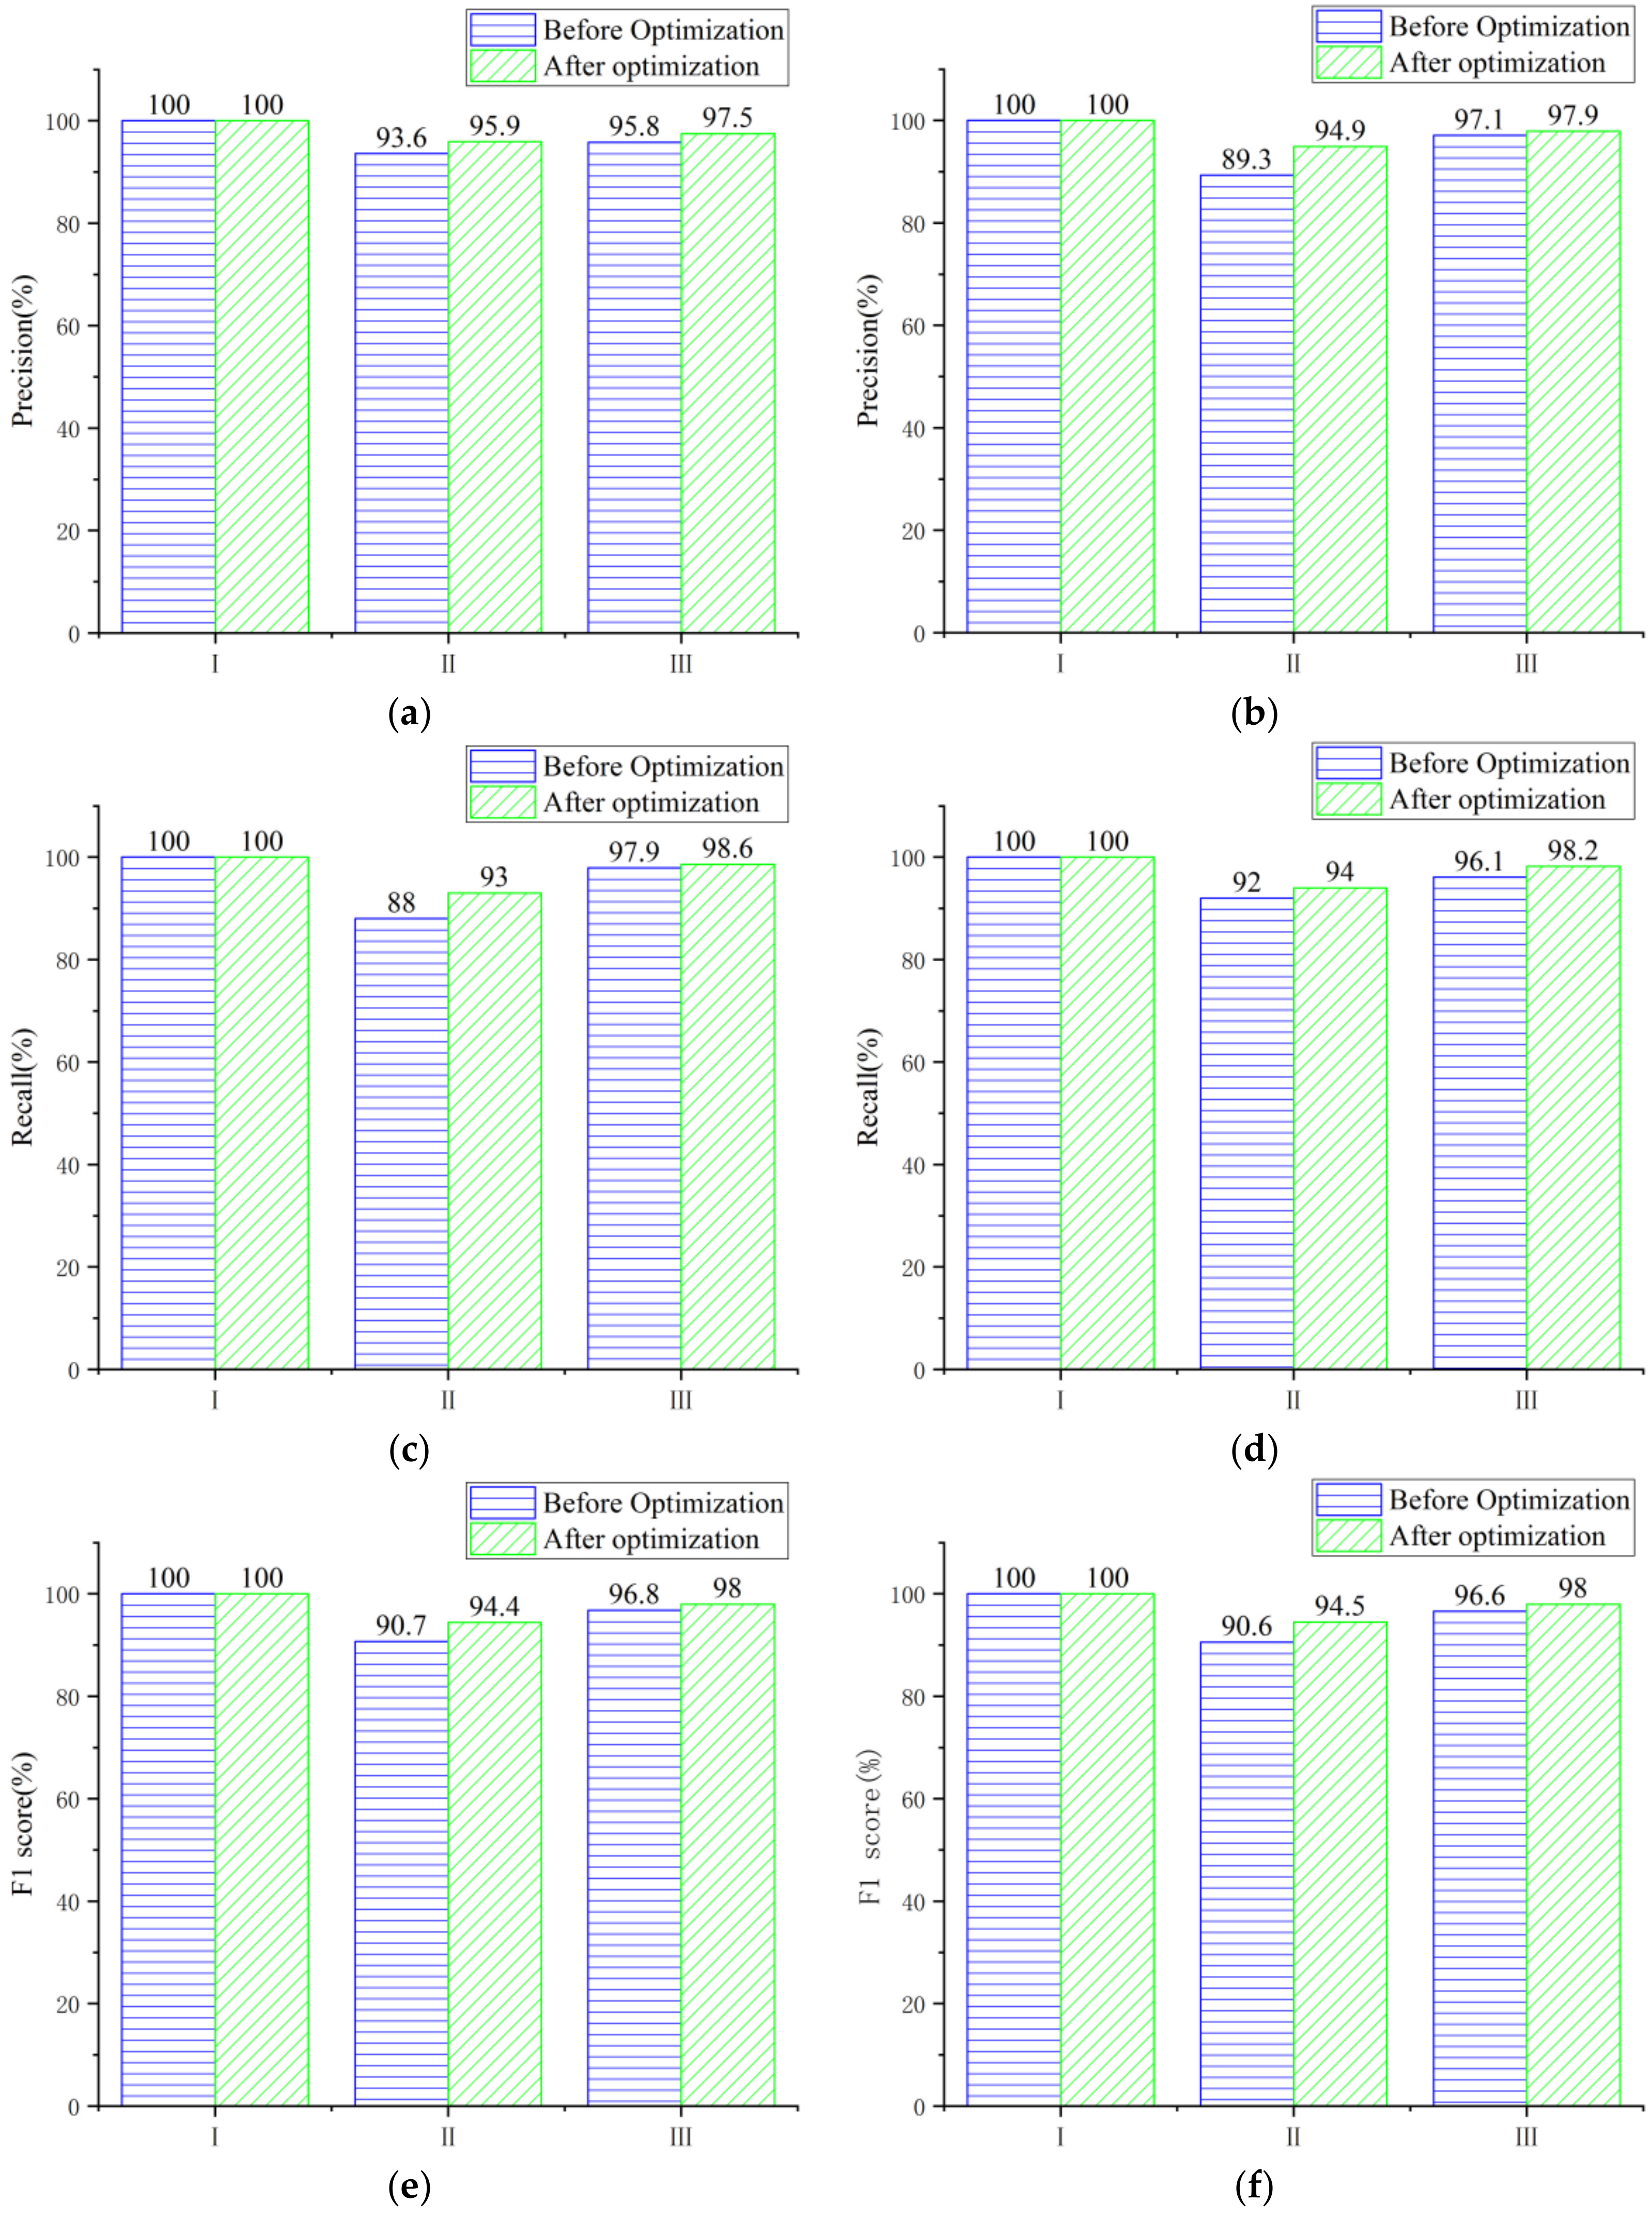
- Through the screening of dominant factors, the minimum value of each index in the model test sets was increased from 88% to 93%, the models were comprehensively optimized, demonstrating the need for factor screening. The two machine learning algorithms have different emphases on model optimization, but the effects were remarkable.
- (3)
- The accuracy of the optimization models based on random forest and support vector machine were both 97.4%, and the F1 scores were greater than 94.4%, which proves that the machine learning method is reliable for resilience evaluation of buildings in a mountainous area. This study has the advantages of accuracy, efficiency and visualization. It provides additional value and reference significance in risk prevention and the control of mountainous environment building construction.
Author Contributions
Funding
Institutional Review Board Statement
Informed Consent Statement
Data Availability Statement
Acknowledgments
Conflicts of Interest
References
- Cimellaro, G.P.; Reinhorn, A.M.; Bruneau, M. Framework for analytical quantification of disaster resilience. Eng. Struct. 2010, 32, 3639–3649. [Google Scholar] [CrossRef]
- Holling, C.S. Resilience and stability of ecological systems. Annu. Rev. Ecol. Syst. 1973, 4, 1–23. [Google Scholar] [CrossRef] [Green Version]
- Wildavsky, A.B. Searching for Safety. J. Risk Insur. 1988, 57, 564. [Google Scholar] [CrossRef]
- ZHOU, Y.; LU, X. State-of-the-art on rocking and self-centering structures. J. Build. Struct. 2011, 32, 1–10. [Google Scholar] [CrossRef]
- Adger, W.N. Social and ecological resilience: Are they related? Prog. Hum. Geog. 2000, 24, 347–364. [Google Scholar] [CrossRef]
- Folke, C. Resilience: The emergence of a perspective for social–ecological systems analyses. Glob. Environ. Change 2006, 16, 253–267. [Google Scholar] [CrossRef]
- Rasulo, A.; Pelle, A.; Briseghella, B.; Nuti, C. A Resilience-Based Model for the Seismic Assessment of the Functionality of Road Networks Affected by Bridge Damage and Restoration. Infrastructures 2021, 6, 112. [Google Scholar] [CrossRef]
- Park, J.; Seager, T.P.; Rao, P.S.C.; Convertino, M.; Linkov, I. Integrating Risk and Resilience Approaches to Catastrophe Management in Engineering Systems. Risk Anal 2013, 33, 356–367. [Google Scholar] [CrossRef] [PubMed]
- Rose, A. Economic resilience to natural and man-made disasters: Multidisciplinary origins and contextual dimensions. Environ. Hazards 2007, 7, 383–398. [Google Scholar] [CrossRef]
- Jennings, B.J.; Vugrin, E.D.; Belasich, D.K. Resilience certification for commercial buildings: A study of stakeholder perspectives. Environ. Syst. Decis. 2013, 33, 184–194. [Google Scholar] [CrossRef]
- Herrera, M.; Abraham, E.; Stoianov, I. A Graph-Theoretic Framework for Assessing the Resilience of Sectorised Water Distribution Networks. Water Resour. Manag. 2016, 30, 1685–1699. [Google Scholar] [CrossRef] [Green Version]
- Marasco, S.; Cardoni, A.; Zamani Noori, A.; Kammouh, O.; Domaneschi, M.; Cimellaro, G.P. Integrated platform to assess seismic resilience at the community level. Sustain. Cities Soc. 2021, 64, 102506. [Google Scholar] [CrossRef]
- Wen, H.; Xie, P.; Xie, Q.; Hu, J.; Wu, S. An Evaluation Method Based on Big Data for Building Resilience in Mountainous Area. Chinese Patent CN2018107915103 [P/OL], 8 November 2021. Available online: https://kns.cnki.net/kcms/detail/detail.aspx?FileName=CN109214643B&DbName=SCPD2021 (accessed on 10 October 2021).
- Joyner, M.D.; Gardner, C.; Puentes, B.; Sasani, M. Resilience-Based seismic design of buildings through multiobjective optimization. Eng. Struct. 2021, 246, 113024. [Google Scholar] [CrossRef]
- Himoto, K.; Suzuki, K. Computational framework for assessing the fire resilience of buildings using the multi-layer zone model. Reliab. Eng. Syst. Safe 2021, 216, 108023. [Google Scholar] [CrossRef]
- Dong, Y.; Frangopol, D.M. Performance-based seismic assessment of conventional and base-isolated steel buildings including environmental impact and resilience. Earthq. Eng. Struct. D 2016, 45, 739–756. [Google Scholar] [CrossRef]
- Bruneau, M.; Reinhorn, A. Exploring the concept of seismic resilience for acute care facilities. Earthq. Spectra 2007, 23, 41–62. [Google Scholar] [CrossRef] [Green Version]
- Liu, D.; Fan, Z.; Fu, Q.; Li, M.; Faiz, M.A.; Ali, S.; Li, T.; Zhang, L.; Khan, M.I. Random forest regression evaluation model of regional flood disaster resilience based on the whale optimization algorithm. J. Clean. Prod. 2020, 250, 119468. [Google Scholar] [CrossRef]
- Deng, W.; Zhou, J. Approach for feature weighted support vector machine and its application in flood disaster evaluation. Disaster Adv. 2013, 6, 51–58. [Google Scholar]
- Motta, M.; de Castro Neto, M.; Sarmento, P. A mixed approach for urban flood prediction using Machine Learning and GIS. Int. J. Disast. Risk Re. 2021, 56, 102154. [Google Scholar] [CrossRef]
- Riedel, I.; Guéguen, P.; Dunand, F.; Cottaz, S. Macroscale vulnerability assessment of cities using association rule learning. Seismol. Res. Lett. 2014, 85, 295–305. [Google Scholar] [CrossRef] [Green Version]
- Riedel, I.; Guéguen, P.; Dalla Mura, M.; Pathier, E.; Leduc, T.; Chanussot, J. Seismic vulnerability assessment of urban environments in moderate-to-low seismic hazard regions using association rule learning and support vector machine methods. Nat. Hazards 2015, 76, 1111–1141. [Google Scholar] [CrossRef]
- Xie, Y.; Ebad Sichani, M.; Padgett, J.E.; DesRoches, R. The promise of implementing machine learning in earthquake engineering: A state-of-the-art review. Earthq. Spectra 2020, 36, 1769–1801. [Google Scholar] [CrossRef]
- Liuzzi, M.; Aravena Pelizari, P.; Geiß, C.; Masi, A.; Tramutoli, V.; Taubenböck, H. A transferable remote sensing approach to classify building structural types for seismic risk analyses: The case of Val d’Agri area (Italy). B Earthq. Eng. 2019, 17, 4825–4853. [Google Scholar] [CrossRef]
- Mangalathu, S.; Burton, H.V. Deep learning-based classification of earthquake-impacted buildings using textual damage descriptions. Int. J. Disast. Risk Re. 2019, 36, 101111. [Google Scholar] [CrossRef]
- Chen, W.; Zhang, L. Resilience assessment of regional areas against earthquakes using multi-source information fusion. Reliab. Eng. Syst. Safe 2021, 215, 107833. [Google Scholar] [CrossRef]
- Mangalathu, S.; Sun, H.; Nweke, C.C.; Yi, Z.; Burton, H.V. Classifying earthquake damage to buildings using machine learning. Earthq. Spectra 2020, 36, 183–208. [Google Scholar] [CrossRef]
- Zhang, X.; Song, J.; Peng, J.; Wu, J. Landslides-oriented urban disaster resilience assessment—A case study in Shen Zhen, China. Sci. Total Environ. 2019, 661, 95–106. [Google Scholar] [CrossRef]
- Barua, A.; Katyaini, S.; Mili, B.; Gooch, P. Climate change and poverty: Building resilience of rural mountain communities in South Sikkim, Eastern Himalaya, India. Reg. Environ. Change 2014, 14, 267–280. [Google Scholar] [CrossRef]
- Kohler, T.; Giger, M.; Hurni, H.; Ott, C.; Wiesmann, U.; Wymann Von Dach, S.; Maselli, D. Mountains and Climate Change: A Global Concern. Mt. Res. Dev. 2010, 30, 53–55. [Google Scholar] [CrossRef] [Green Version]
- Kato, T.; Rambali, M.; Blanco-Gonzalez, V. Strengthening Climate Resilience in Mountainous Areas; OECD Development Co-operation Working Papers, No. 104; OECD Publishing: Paris, France, 2021. [Google Scholar]
- Ministry of Housing and Urban-Rural Development of the People’s Republic of China Web Page. Available online: http://www.mohurd.gov.cn/gongkai/fdzdgknr/tzgg/201912/20191202_242931.html (accessed on 2 October 2019).
- Ministry of Housing and Urban-Rural Development of the People’s Republic of China Web Page. Available online: https://www.mohurd.gov.cn/gongkai/fdzdgknr/tzgg/201608/20160801_228380.html (accessed on 1 August 2016).
- Xiao, L.; Zhang, Y.; Peng, G. Landslide Susceptibility Assessment Using Integrated Deep Learning Algorithm along the China-Nepal Highway. Sensors 2018, 18, 4436. [Google Scholar] [CrossRef] [Green Version]
- Narjabadifam, P.; Hoseinpour, R.; Noori, M.; Altabey, W. Practical seismic resilience evaluation and crisis management planning through GIS-based vulnerability assessment of buildings. Earthq. Eng. Eng. Vib. 2021, 20, 25–37. [Google Scholar] [CrossRef]
- Xue, M.; Wen, H.; Lin, Y.; Sun, D. Random Forest Evaluation Model for Physical Toughness of Slopes Along Mountain Roads-Taking Maoxian County of Sichuan Province as an example. Bull. Fo Soil Water Conserv. 2020, 40, 168–175. [Google Scholar] [CrossRef]
- Sun, D.; Wen, H.; Zhang, Y.; Xue, M. An optimal sample selection-based logistic regression model of slope physical resistance against rainfall-induced landslide. Nat. Hazards. 2020, 105, 1255–1279. [Google Scholar] [CrossRef]
- Taalab, K.; Cheng, T.; Zhang, Y. Mapping landslide susceptibility and types using Random Forest. Big Earth Data 2018, 2, 159–178. [Google Scholar] [CrossRef]
- Al Rifat, S.A.; Liu, W. Measuring community disaster resilience in the conterminous coastal United States. Isprs Int J Geo-Inf 2020, 9, 469. [Google Scholar] [CrossRef]
- El-Tawil, S.; Ibrahim, A.; Eltawil, A. Stick-Slip Classification Based on Machine Learning Techniques for Building Damage Assessment. J. Earthq. Eng. JEE 2021, 1–18. [Google Scholar] [CrossRef]
- Mahmoudi, S.N.; Chouinard, L. Seismic fragility assessment of highway bridges using support vector machines. B Earthq. Eng. 2016, 14, 1571–1587. [Google Scholar] [CrossRef]
- kernlab: Kernel-Based Machine Learning Lab Web Page. Available online: http://cran.r-project.org/web/packages/kernlab/index.html (accessed on 12 November 2019).
- Zhou, X.; Wen, H.; Zhang, Y.; Xu, J.; Zhang, W. Landslide susceptibility mapping using hybrid random forest with GeoDetector and RFE for factor optimization. Geosci. Front. 2021, 12, 101211. [Google Scholar] [CrossRef]
- Deng, X.; Liu, Q.; Deng, Y.; Mahadevan, S. An improved method to construct basic probability assignment based on the confusion matrix for classification problem. Inform. Sci. 2016, 340–341, 250–261. [Google Scholar] [CrossRef]
- Banks, S.; Millard, K.; Pasher, J.; Richardson, M.; Wang, H.; Duffe, J. Assessing the Potential to Operationalize Shoreline Sensitivity Mapping: Classifying Multiple Wide Fine Quadrature Polarized RADARSAT-2 and Landsat 5 Scenes with a Single Random Forest Model. Remote Sens. 2015, 7, 13528–13563. [Google Scholar] [CrossRef] [Green Version]
- Han, H.; Guo, X.; Yu, H. Variable Selection Using Mean Decrease Accuracy and Mean Decrease Gini Based on Random Forest. In Proceedings of the 2016 7th IEEE International Conference on Software Engineering and Service Science (ICSESS), Beijing, China, 26–28 August 2016; pp. 219–224. [Google Scholar] [CrossRef]


| Building Resilience Grades | Grade I | Grade II | Grade III |
|---|---|---|---|
| Grading criteria | Buildings whose structure is basically safe for use | Local dangerous buildings in which a part of the load-bearing structure cannot meet the requirements of safe use. | Whole dangerous buildings in which the load-bearing structure cannot meet the requirements of safe use. |
| Pictures from the scene | 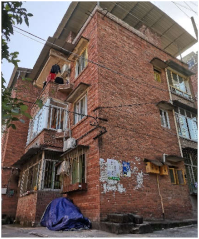 |  |  |
| Category | Data | Data Source | Scale |
|---|---|---|---|
| Geographical and geological factors | Elevation | ASTER | 30 m |
| Lithology | National Geological Archives of China | 1:200000 | |
| Meteorological and hydrological factors | Average annual rainfall | China Meteorological Data Service Centre-Resource and Environment Science and Data Center | 30 m |
| Aridity | Resource and Environment Science and Data Center | 500 m | |
| Temperature | Resource and Environment Science and Data Center | 1000 m | |
| Environmental factors | Fault | National Geological Archives of China | 1:200,000 |
| Roads | Google remote sensing images | 1:250,000 | |
| Rivers | Google remote sensing images | 1:250,000 |
| Category | Impact Factors | Number of Categories | Classification Criteria |
|---|---|---|---|
| Geographical and geological factors | Elevation (m) | 9 | (1) ≤244; (2) 244~312; (3) 312~377; (4) 377~448; (5) 448~525; (6) 525~605; (7) 605~691; (8) 691~802; (9) ≥802 |
| Slope (°) | 9 | (1) ≤5.03°; (2) 5.03°~8.70°; (3) 8.70°~12.33°; (4) 12.33°~16.07°; (5) 16.07°~20.08°; (6) 20.08~24.57; (7) 24.57~29.88; (8) 2 9.88~36.94; (9) ≥36.94 | |
| Slope aspect | 9 | (1) Flat; (2) N; (3) NE; (4) E; (5) SE; (6) S; (7) SW; (8) W; (9) NW | |
| Slope position | 6 | (1) Valleys; (2) Lowslope; (3) Flat; (4) Midslope; (5) Uppslope; (6) Ridge | |
| Curvature | 9 | (1) ≤−4.09; (2) −4.09~−2.46; (3) −2.46~−1.29; (4) −1.29~−0.47; (5) −0.47~0.35; (6) 0.35~1.17; (7) 1.17~2.24; (8) 2.24~4.09; (9) ≥4.09 | |
| Plan curvature | 9 | (1) ≤−1.97; (2) −1.97~−1.21; (3) −1.21~−0.65; (4) −0.65~−0.23; (5) −0.23~0.19; (6) 0.19~0.61; (7) 0.61~1.17; (8) 1.17~2.00; (9) ≥2.00 | |
| Profile curvature | 9 | (1) ≤−2.88; (2) −2.88~−1.70; (3) −1.70~−0.95; (4) −0.95–0.41; (5) −0.41~0.12; (6) 0.12~0.66; (7) 0.66~1.41; (8) 1.41~2.59; (9) ≥2.59 | |
| Micro-landform | 10 | (1) Canyons, deeply incised streams; (2) Midslope drainages, shallow valleys; (3) Upland drainages, headwaters; (4) U-shape valleys; (5) Plains; (6) Open slopes; (7) Upper slopes, mesas; (8) Local ridges hills in valleys; (9) Midslope ridges, small hills in plains; (10) Mountain tops, high ridges | |
| TWI | 9 | (1) ≤4.68; (2) 4.68~5.87; (3) 5.87~7.16; (4) 7.16~8.56; (5) 8.56~10.18; (6) 10.18~12.12; (7) 12.12~14.71; (8) 14.71~17.95; (9) ≥17.95 | |
| TRI | 9 | (1) ≤1.018; (2) 1.018~1.041; (3) 1.041~1.071; (4) 1.071~1.108; (5) 1.108~1.155; (6) 1.155~1.217; (7) 1.217~1.304; (8) 1.304~1.450; (9) ≥1.450 | |
| Lithology | 7 | (1) Lower Triassic; (2) Middle Triassic; (3) Upper Triassic; (4) Triassic; (5) Middle-Lower Jurassic; (6) Middle Jurassic; (7) Upper Jurassic | |
| Meteorological and hydrological factors | Average annual rainfall (mm) | 9 | (1) ≤117.0; (2) 117.0~119.2; (3) 119.2~120.7; (4) 120.7~122.3; (5) 122.3~124.0; (6) 124.0~125.8; (7) 125.8~127.7; (8) 127.7~129.9; (9) ≥129.9 |
| Aridity | 9 | (1) ≤0.808; (2) 0.808~0.828; (3) 0.828~0.852; (4) 0.852~0.881; (5) 0.881~0.907; (6) 0.907~0.927; (7) 0.927~0.948; (8) 0.948~0.971; (9) ≥0.971 | |
| Temperature (°) | 9 | (1) ≤16.214; (2) 16.214~16.889; (3) 16.889~17.401; (4) 17.401~17.807; (5) 17.807~18.139; (6) 18.139~18.431; (7) 18.431~18.715; (8) 18.715~19.048; (9) ≥19.048 | |
| Environmental factors | Distance from fault (m) | 6 | (1) ≤1000; (2) 1000~2000; (3) 2000~3000; (4) 3000~4000; (5) 4000~5000; (6) ≥ 5000 |
| Distance from roads (m) | 6 | (1) ≤10; (2) 10~20; (3) 20~30; (4) 30~40; (5) 40~50; (6) ≥ 50 | |
| Distance from rivers (m) | 6 | (1) ≤100; (2) 100~200; (3) 200~300; (4) 300~400; (5) 400~500; (6) ≥500 | |
| Building factors | Building structure | 7 | (1) Timber structure; (2) Simple structure; (3) Adobe–timber structure; (4) Brick–timber structure; (5) Brick–concrete structure; (6) Hybrid structure; (7) Steel and reinforced concrete structure |
| Construction time | 7 | (1) before 1939; (2) 1940~1949; (3) 1950~1959; (4) 1960~1969; (5) 1970~1979; (6) 1980~1999; (7) after 2000; | |
| Building storey | 8 | (1) 1; (2) 2; (3) 3; (4) 4; (5) 5; (6) 6; (7) 7; (8) ≥8; | |
| Building category | 5 | (1) Residential building; (2) Commercial building; (3) Teaching building; (4) Auxiliary building; (5) Other building |
| Predicted Grade | ||||
|---|---|---|---|---|
| I | II | III | ||
| Actual grade | I | N11 | N12 | N13 |
| II | N21 | N22 | N23 | |
| III | N31 | N32 | N33 | |
| Accuracy | Precision | Recall | F1 score | |||||||
|---|---|---|---|---|---|---|---|---|---|---|
| Ⅰ | Ⅱ | Ⅲ | Ⅰ | Ⅱ | Ⅲ | Ⅰ | Ⅱ | Ⅲ | ||
| RF | 97.4% | 100% | 95.9% | 97.5% | 100% | 93% | 98.6% | 100% | 94.4% | 98.0% |
| SVM | 97.4% | 100% | 94.9% | 97.9% | 100% | 94% | 98.2% | 100% | 94.5% | 98.0% |
| Difference | 0 | 0 | 1% | 0.4% | 0 | 1% | 0.4% | 0 | 0.1% | 0 |
| Category | Impact Factors | Value of MDA | Score of MDA | Value of MDG | Score of MDG | Score of MDA and MDG | Comprehensive Ranking |
|---|---|---|---|---|---|---|---|
| Geographical and geological factors | Elevation | 27.15 | 4 | 6.81 | 2 | 6 | 10 |
| TRI | 86.78 | 11 | 91.35 | 11 | 22 | 2 | |
| Lithology | 37.78 | 7 | 11.50 | 3 | 10 | 8 | |
| Meteorological and hydrological factors | Average annual rainfall | 18.16 | 3 | 5.24 | 1 | 4 | 12 |
| Aridity | 44.21 | 9 | 16.84 | 7 | 16 | 4 | |
| Temperature | 42.91 | 8 | 13.10 | 6 | 14 | 5 | |
| Environmental factors | Distance from roads | 11.72 | 1 | 12.02 | 4 | 5 | 11 |
| Distance from rivers | 33.80 | 6 | 13.00 | 5 | 11 | 7 | |
| Building factors | Building structure | 91.26 | 12 | 170.82 | 12 | 24 | 1 |
| Construction time | 33.02 | 5 | 50.37 | 9 | 14 | 5 | |
| Building storey | 16.66 | 2 | 23.27 | 8 | 10 | 8 | |
| Building category | 56.82 | 10 | 68.79 | 10 | 20 | 3 |
Publisher’s Note: MDPI stays neutral with regard to jurisdictional claims in published maps and institutional affiliations. |
© 2022 by the authors. Licensee MDPI, Basel, Switzerland. This article is an open access article distributed under the terms and conditions of the Creative Commons Attribution (CC BY) license (https://creativecommons.org/licenses/by/4.0/).
Share and Cite
Zhang, C.; Wen, H.; Liao, M.; Lin, Y.; Wu, Y.; Zhang, H. Study on Machine Learning Models for Building Resilience Evaluation in Mountainous Area: A Case Study of Banan District, Chongqing, China. Sensors 2022, 22, 1163. https://doi.org/10.3390/s22031163
Zhang C, Wen H, Liao M, Lin Y, Wu Y, Zhang H. Study on Machine Learning Models for Building Resilience Evaluation in Mountainous Area: A Case Study of Banan District, Chongqing, China. Sensors. 2022; 22(3):1163. https://doi.org/10.3390/s22031163
Chicago/Turabian StyleZhang, Chi, Haijia Wen, Mingyong Liao, Yu Lin, Yang Wu, and Hui Zhang. 2022. "Study on Machine Learning Models for Building Resilience Evaluation in Mountainous Area: A Case Study of Banan District, Chongqing, China" Sensors 22, no. 3: 1163. https://doi.org/10.3390/s22031163
APA StyleZhang, C., Wen, H., Liao, M., Lin, Y., Wu, Y., & Zhang, H. (2022). Study on Machine Learning Models for Building Resilience Evaluation in Mountainous Area: A Case Study of Banan District, Chongqing, China. Sensors, 22(3), 1163. https://doi.org/10.3390/s22031163